 Deutsch
 English
 Español
 Français
 Italiano
 Nederlands
 Polski
 Português
 Русский
 Türkçe
 Svenska
 Chinese
 Magyar
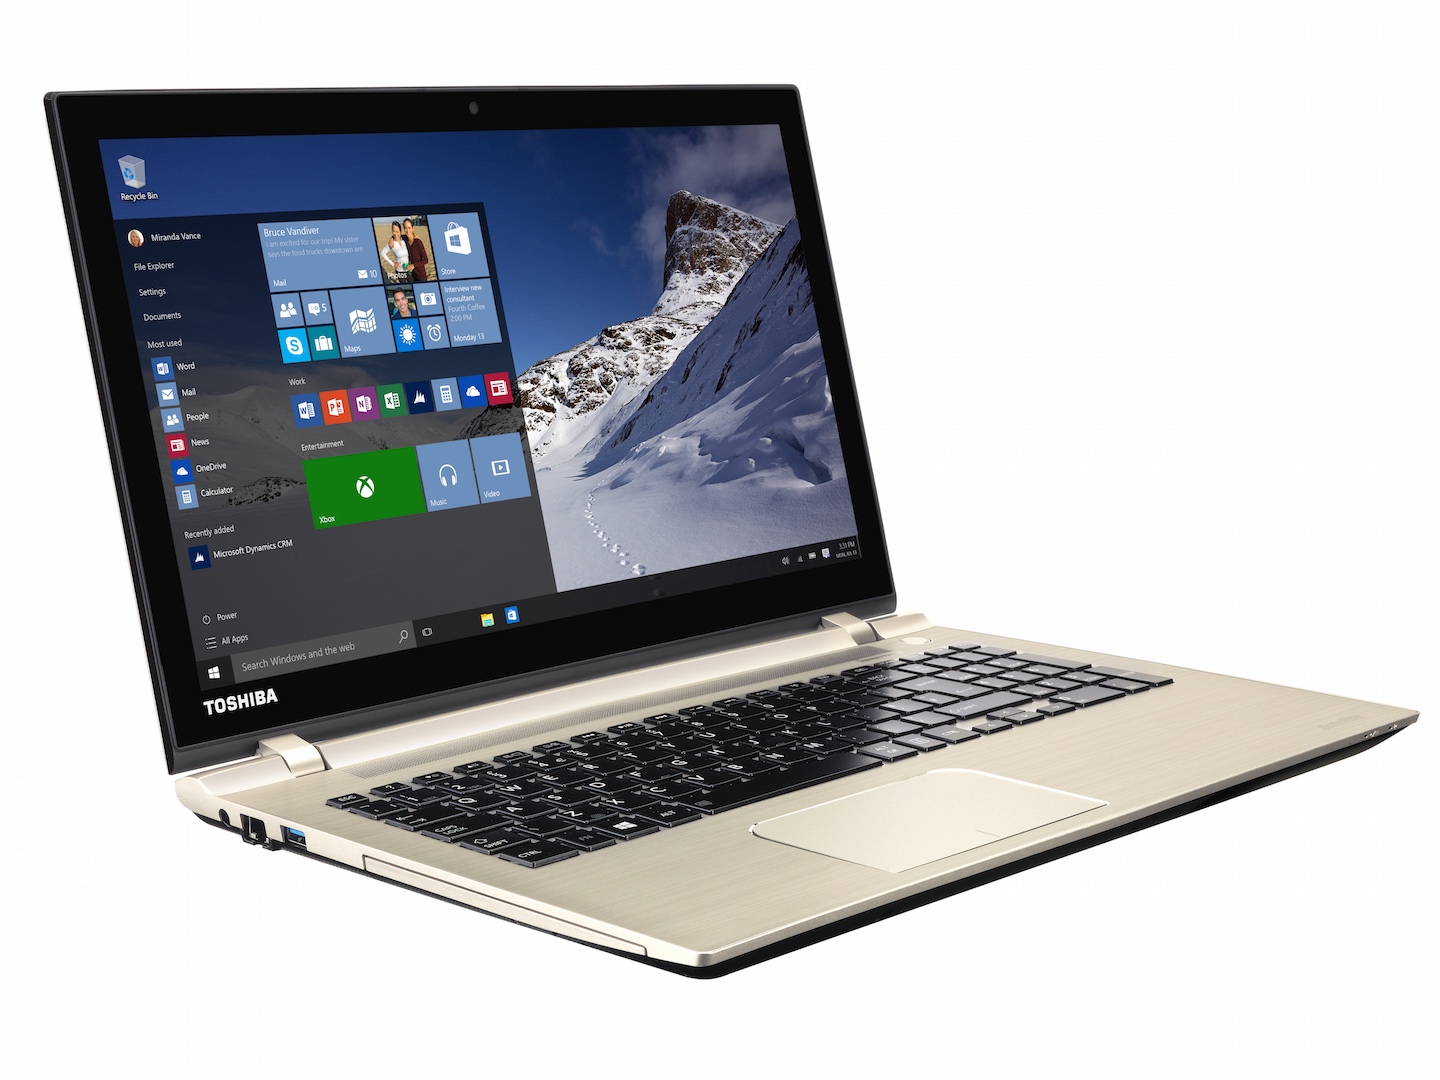
东芝 Satellite P50-C-10G 笔记本电脑简短评测
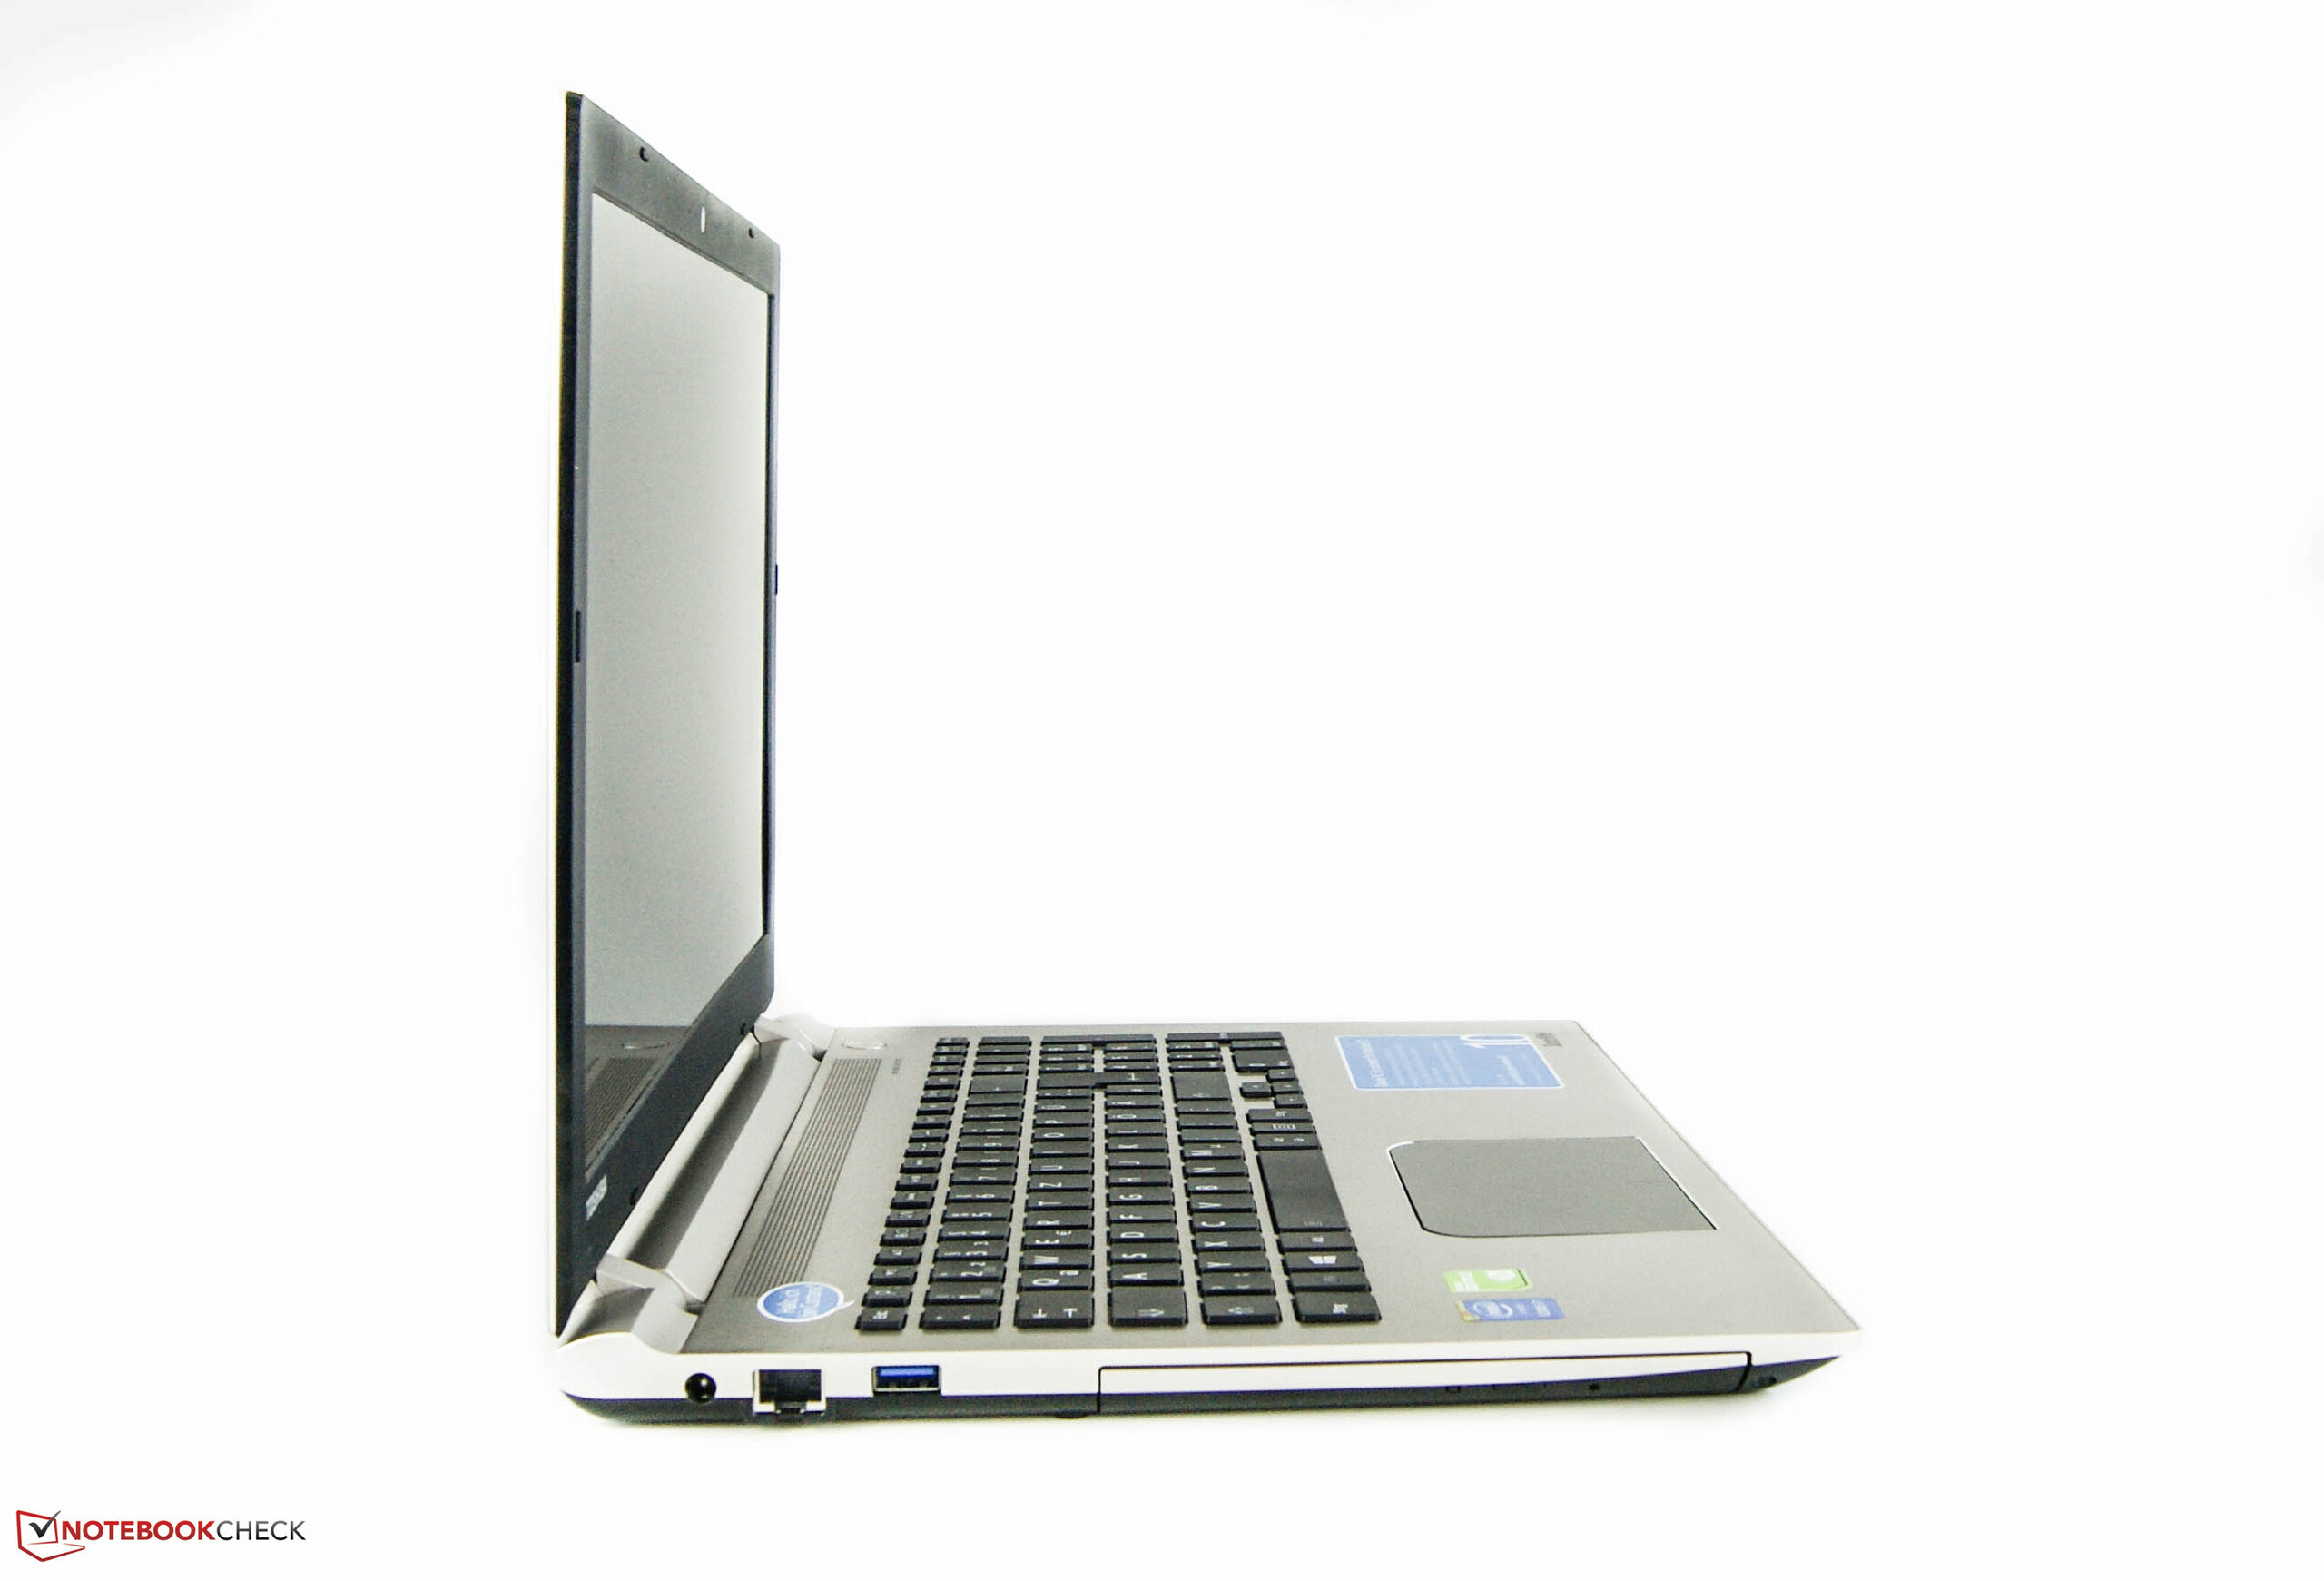
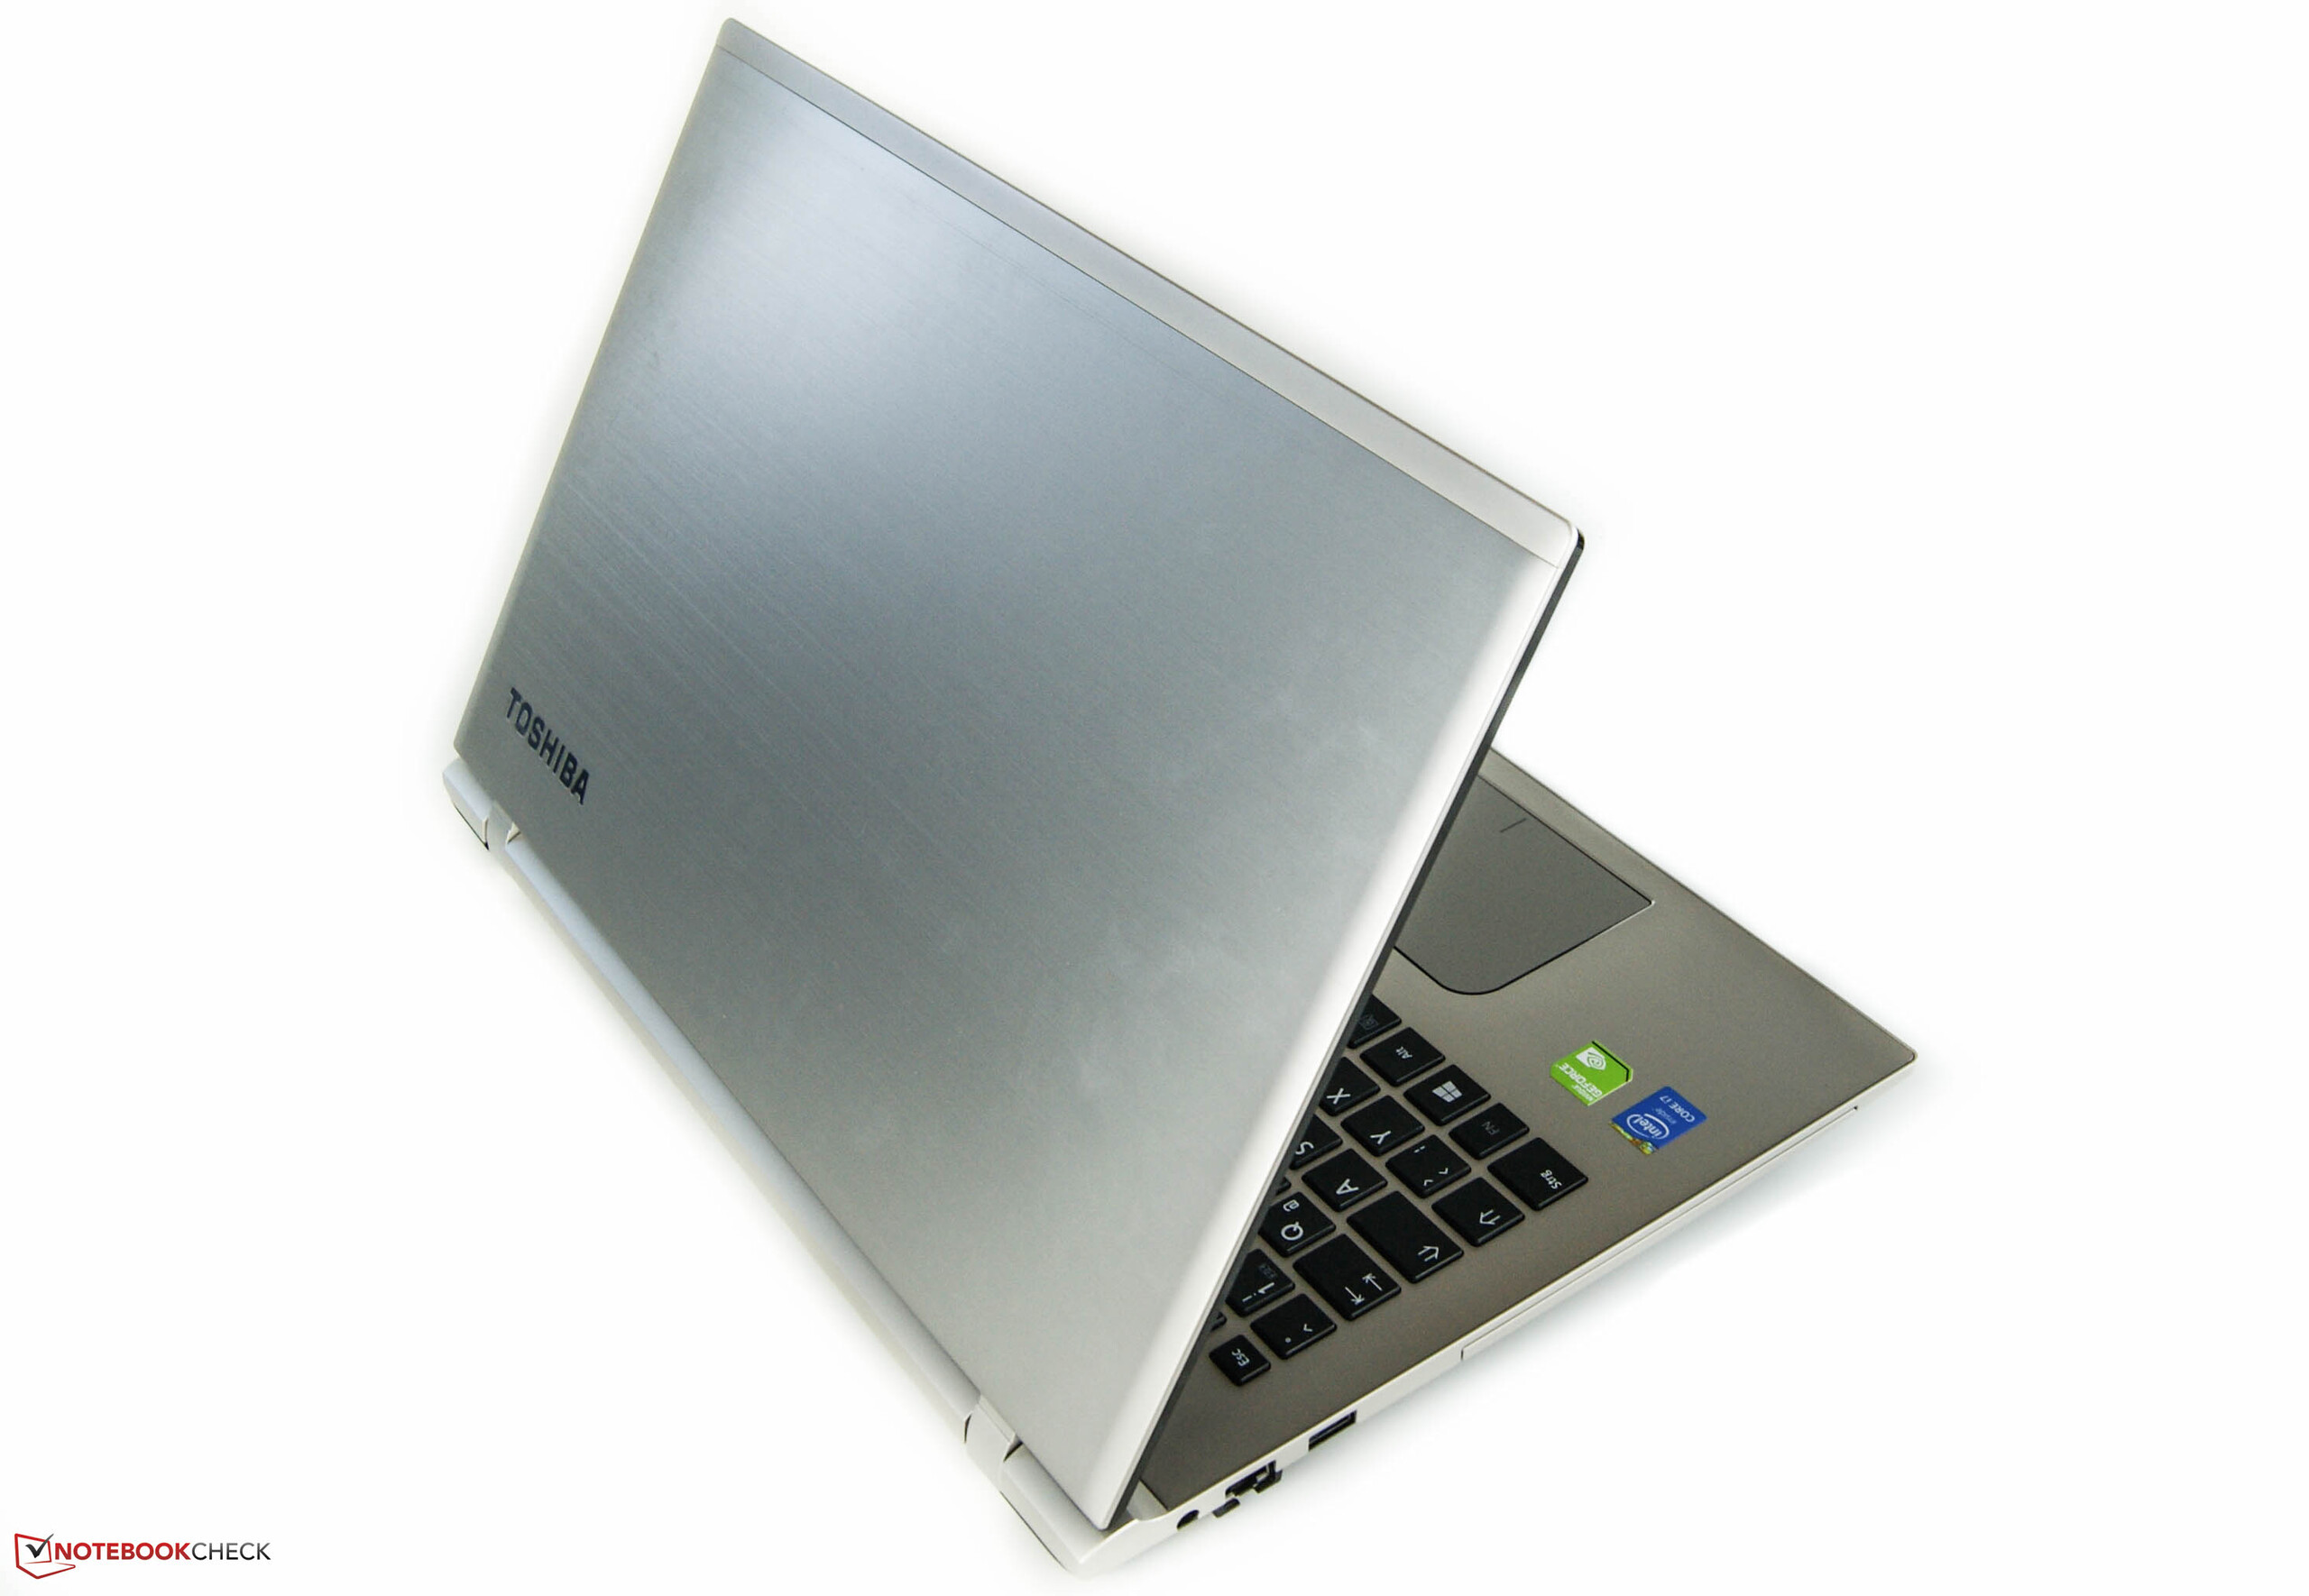
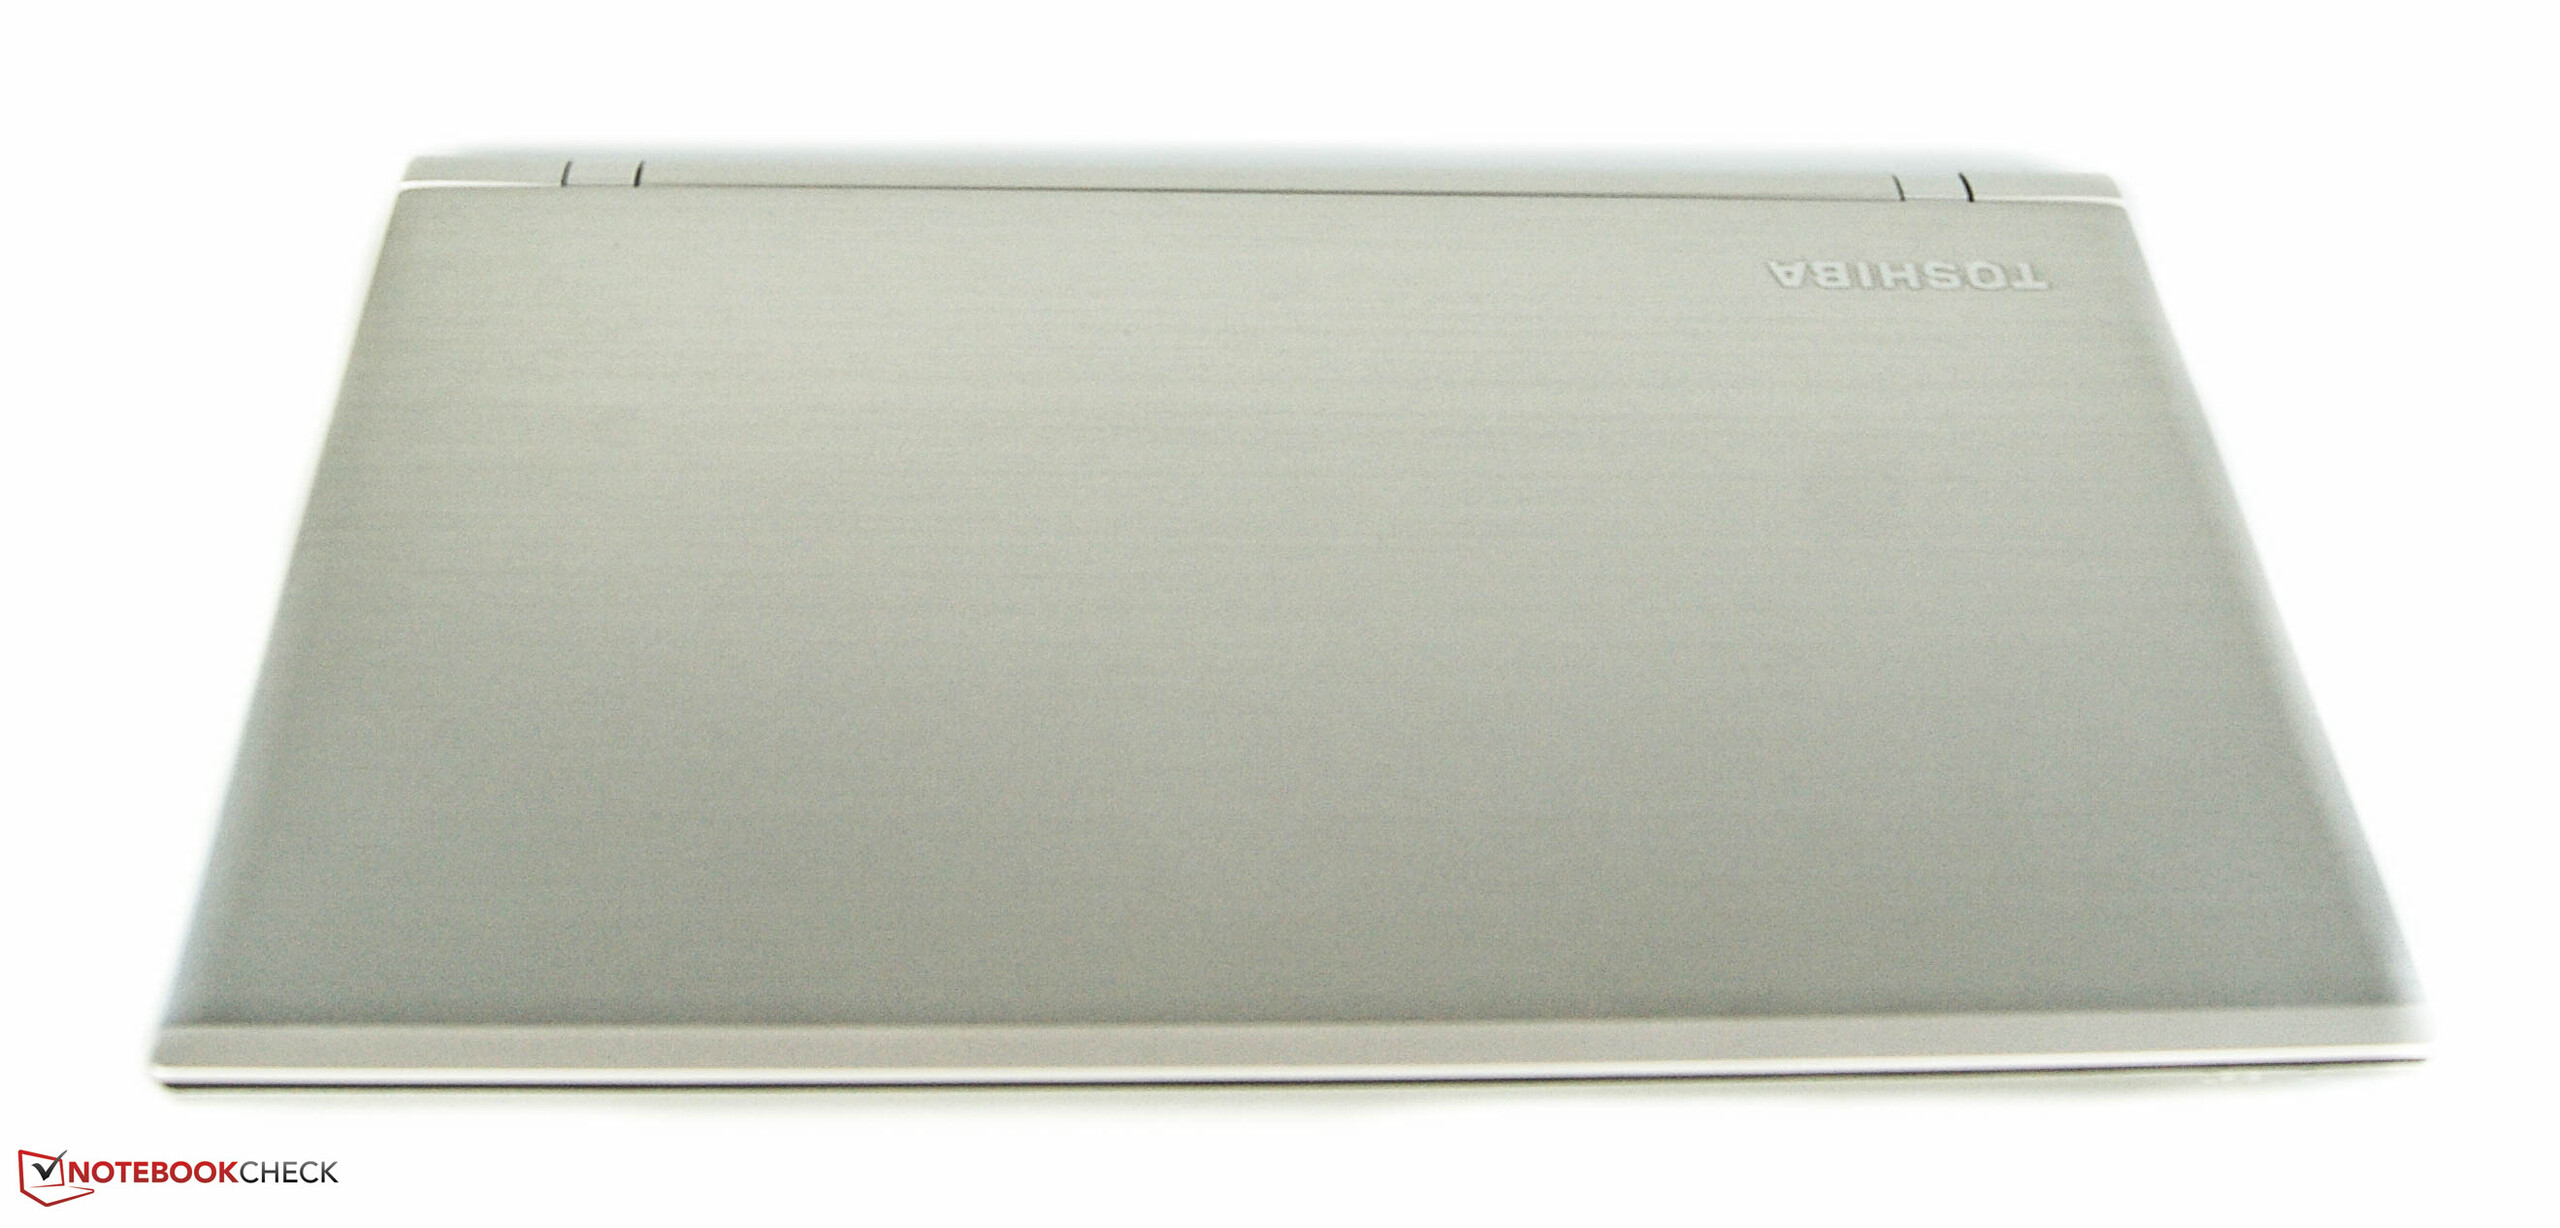
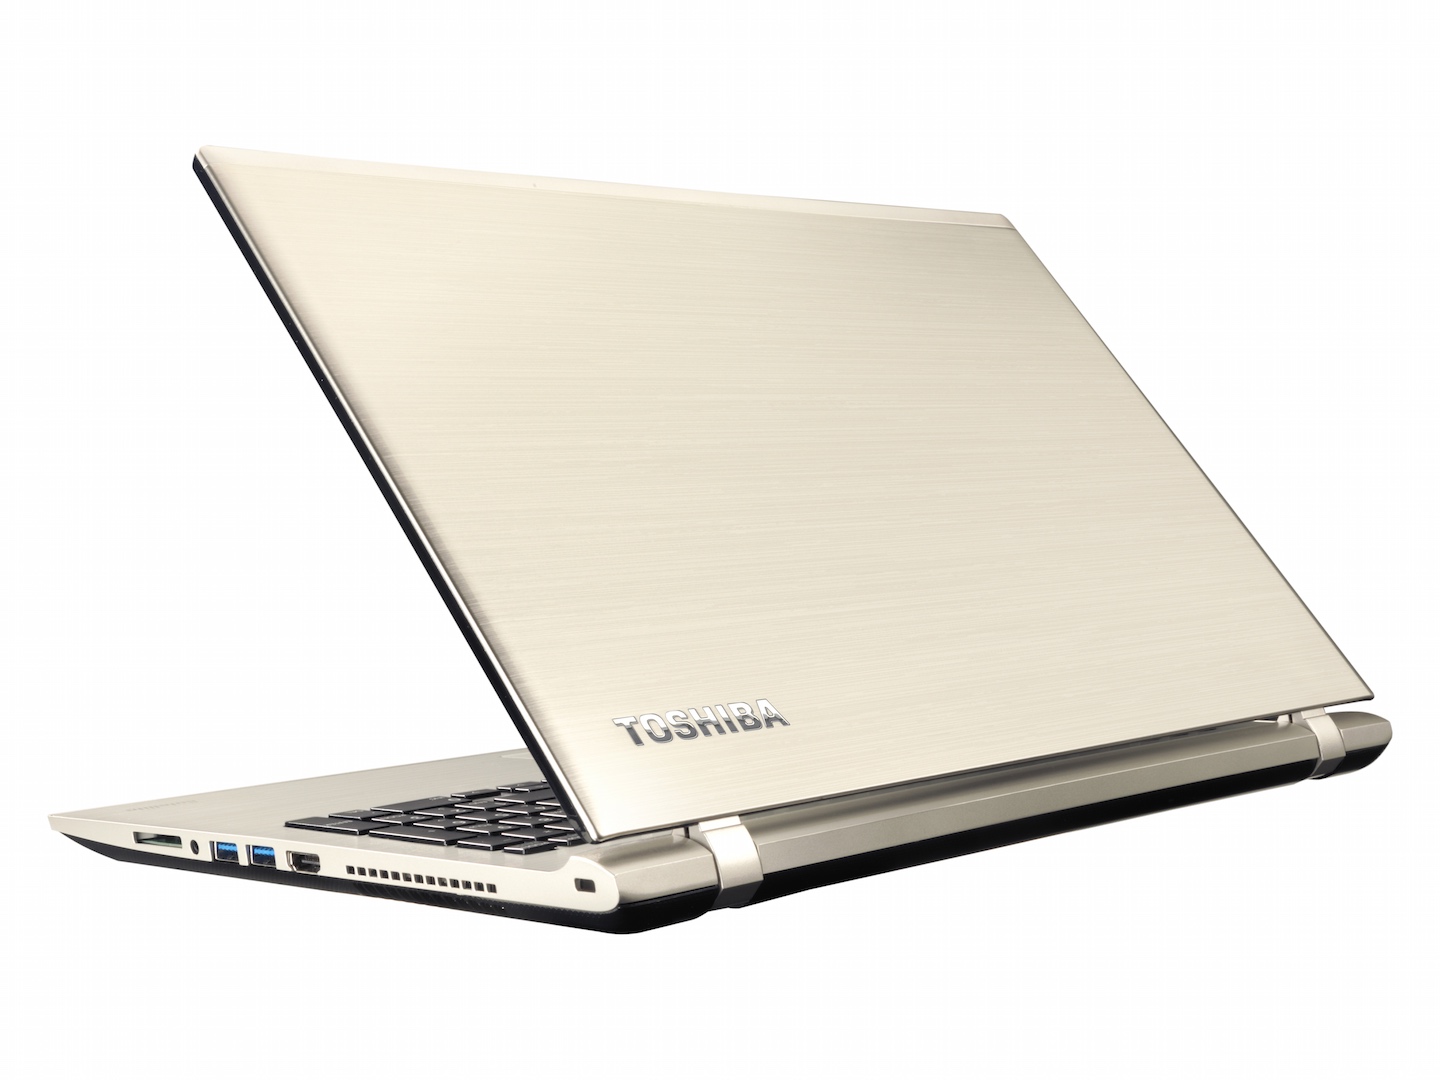
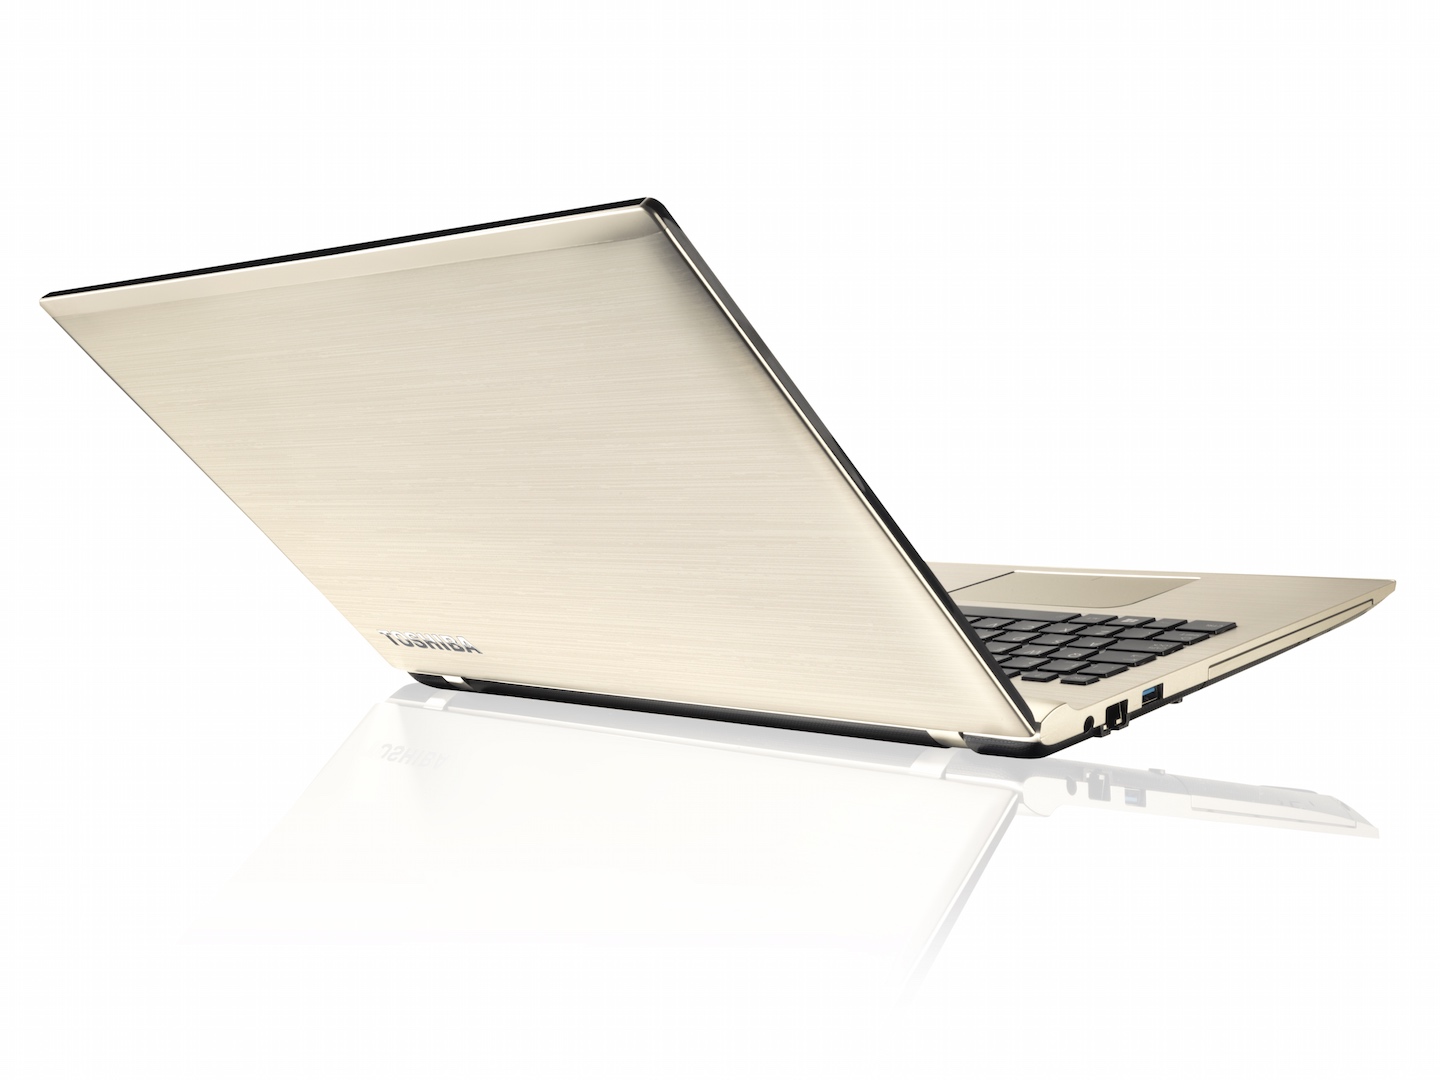
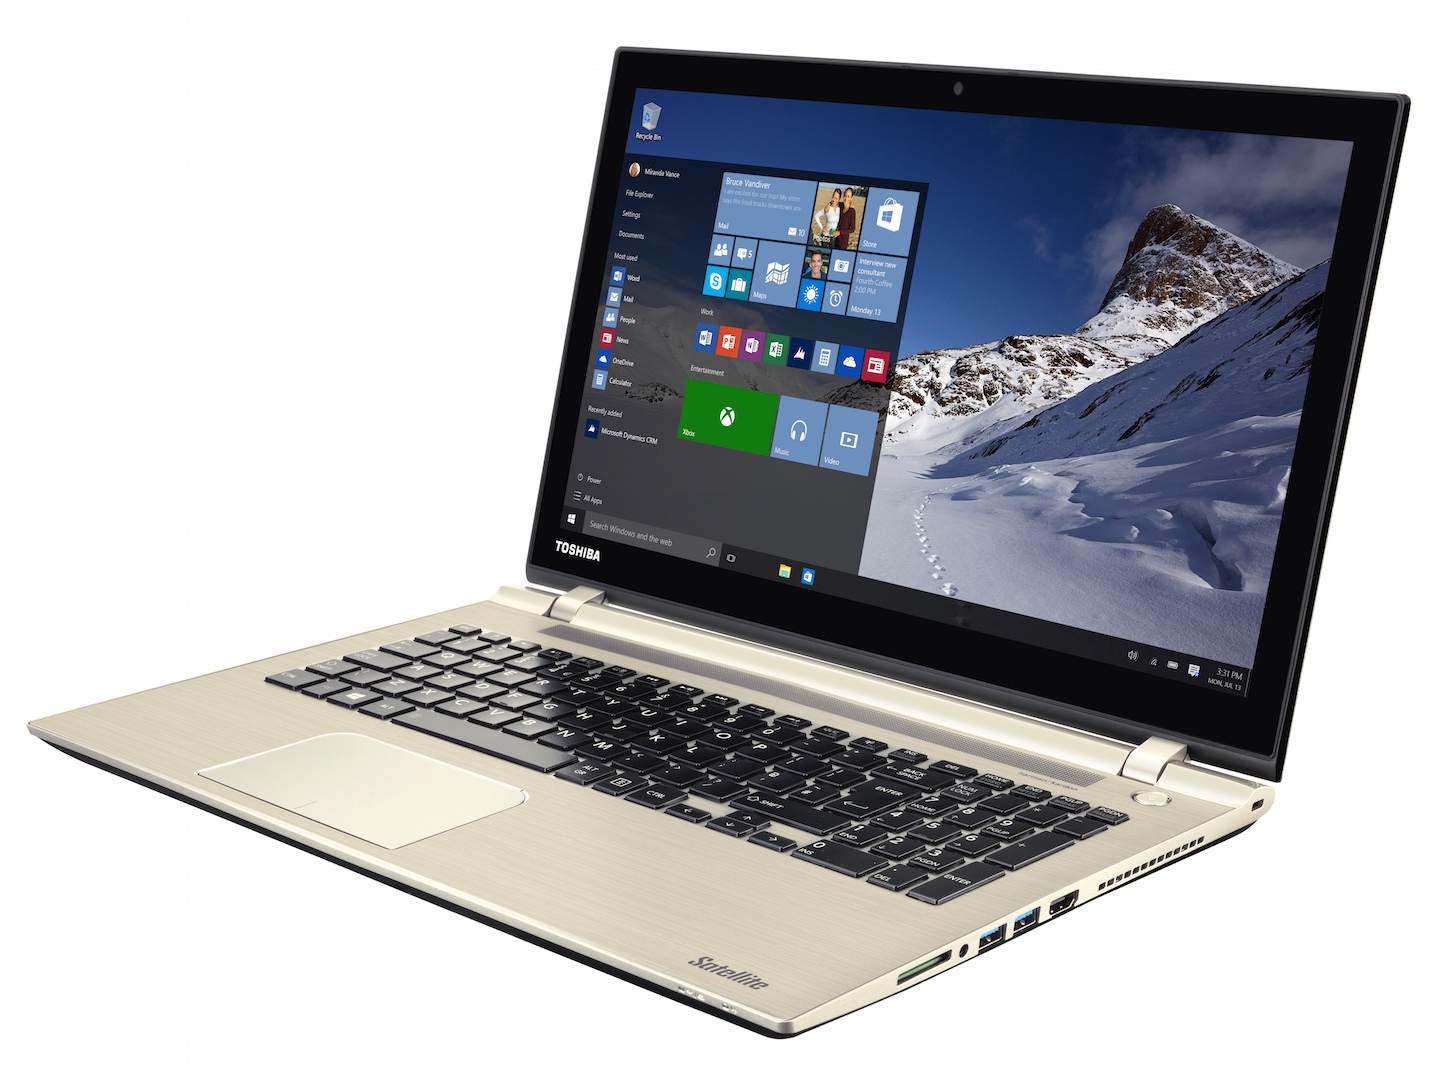
Toshiba Satellite P50-C-10G (Satellite P50 Series)
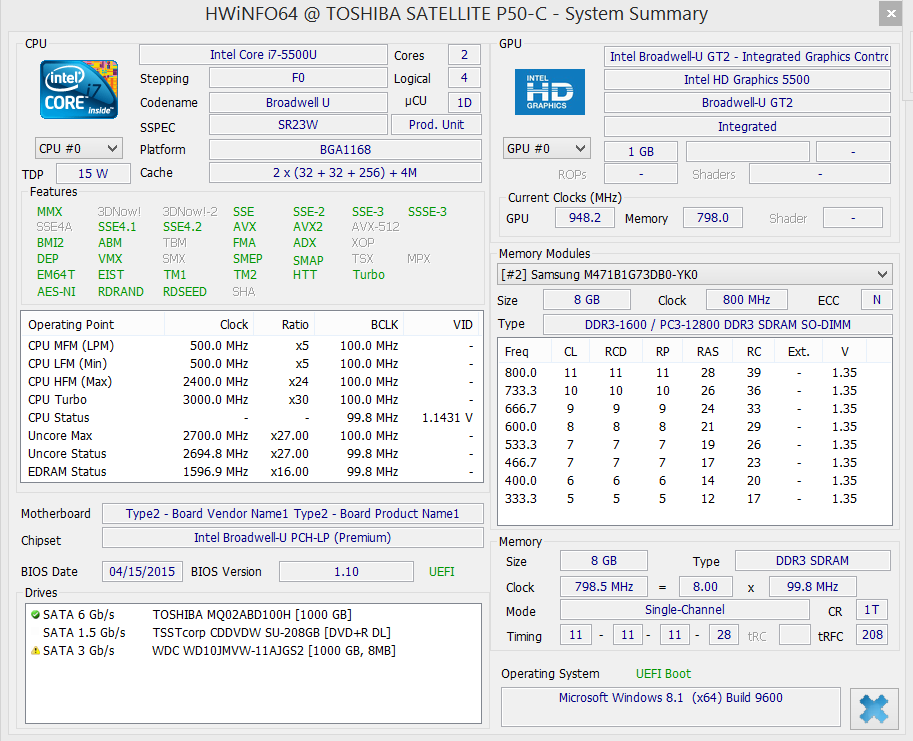
Processor
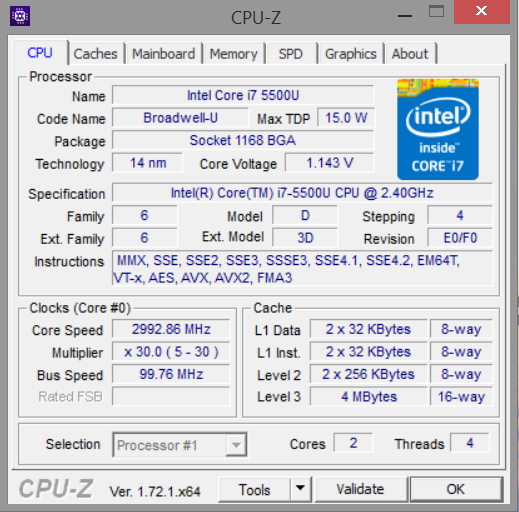
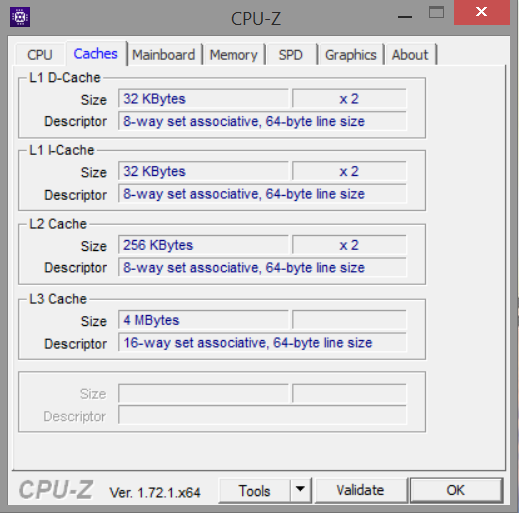
Intel Core i7-5500U 2 x 2.4 - 3 GHz, Broadwell, 15 W 热设计功率, 2 核心
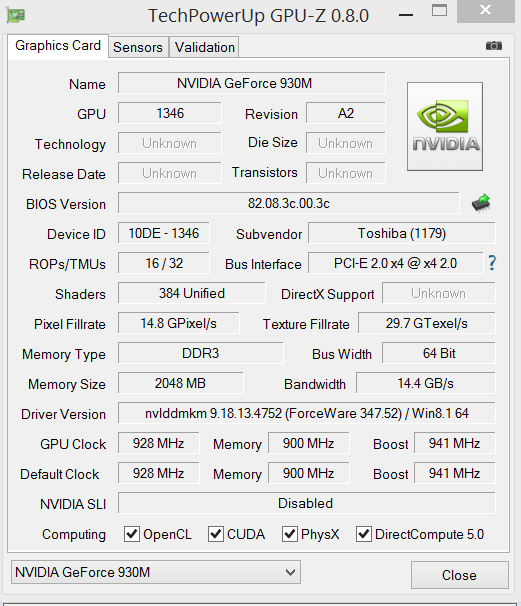
Graphics adapter
NVIDIA GeForce 930M - 2048 MB VRAM, Core: 930 MHz, Memory: 900 MHz, 9.18.13.4752 WHQL (ForceWare 347.52) , NVIDIA Optimus
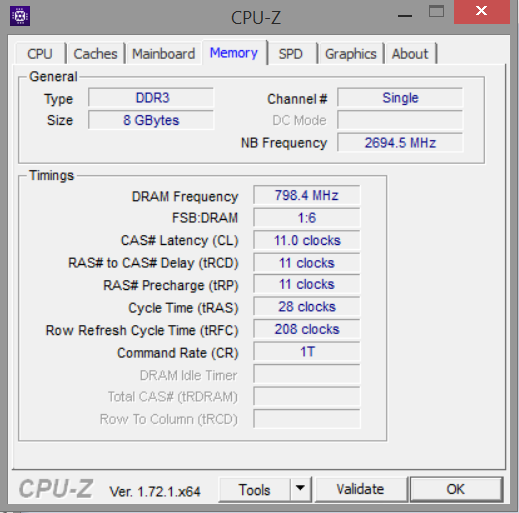
Memory
8 GB
, DDR3-1600 / PC3-12800
Display
15.60 inch 16:9, 1920 x 1080 pixel, LG Philips LGD0470 LP156WF, IPS, glossy: yes
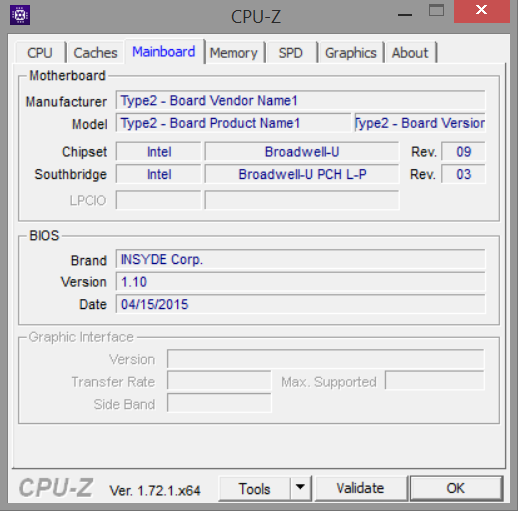
Mainboard
Intel Broadwell-U PCH-LP (Premium)
Storage
Toshiba MQ02ABD100H, 1000 GB
, 5400 rpm, 5400 RPM
Weight
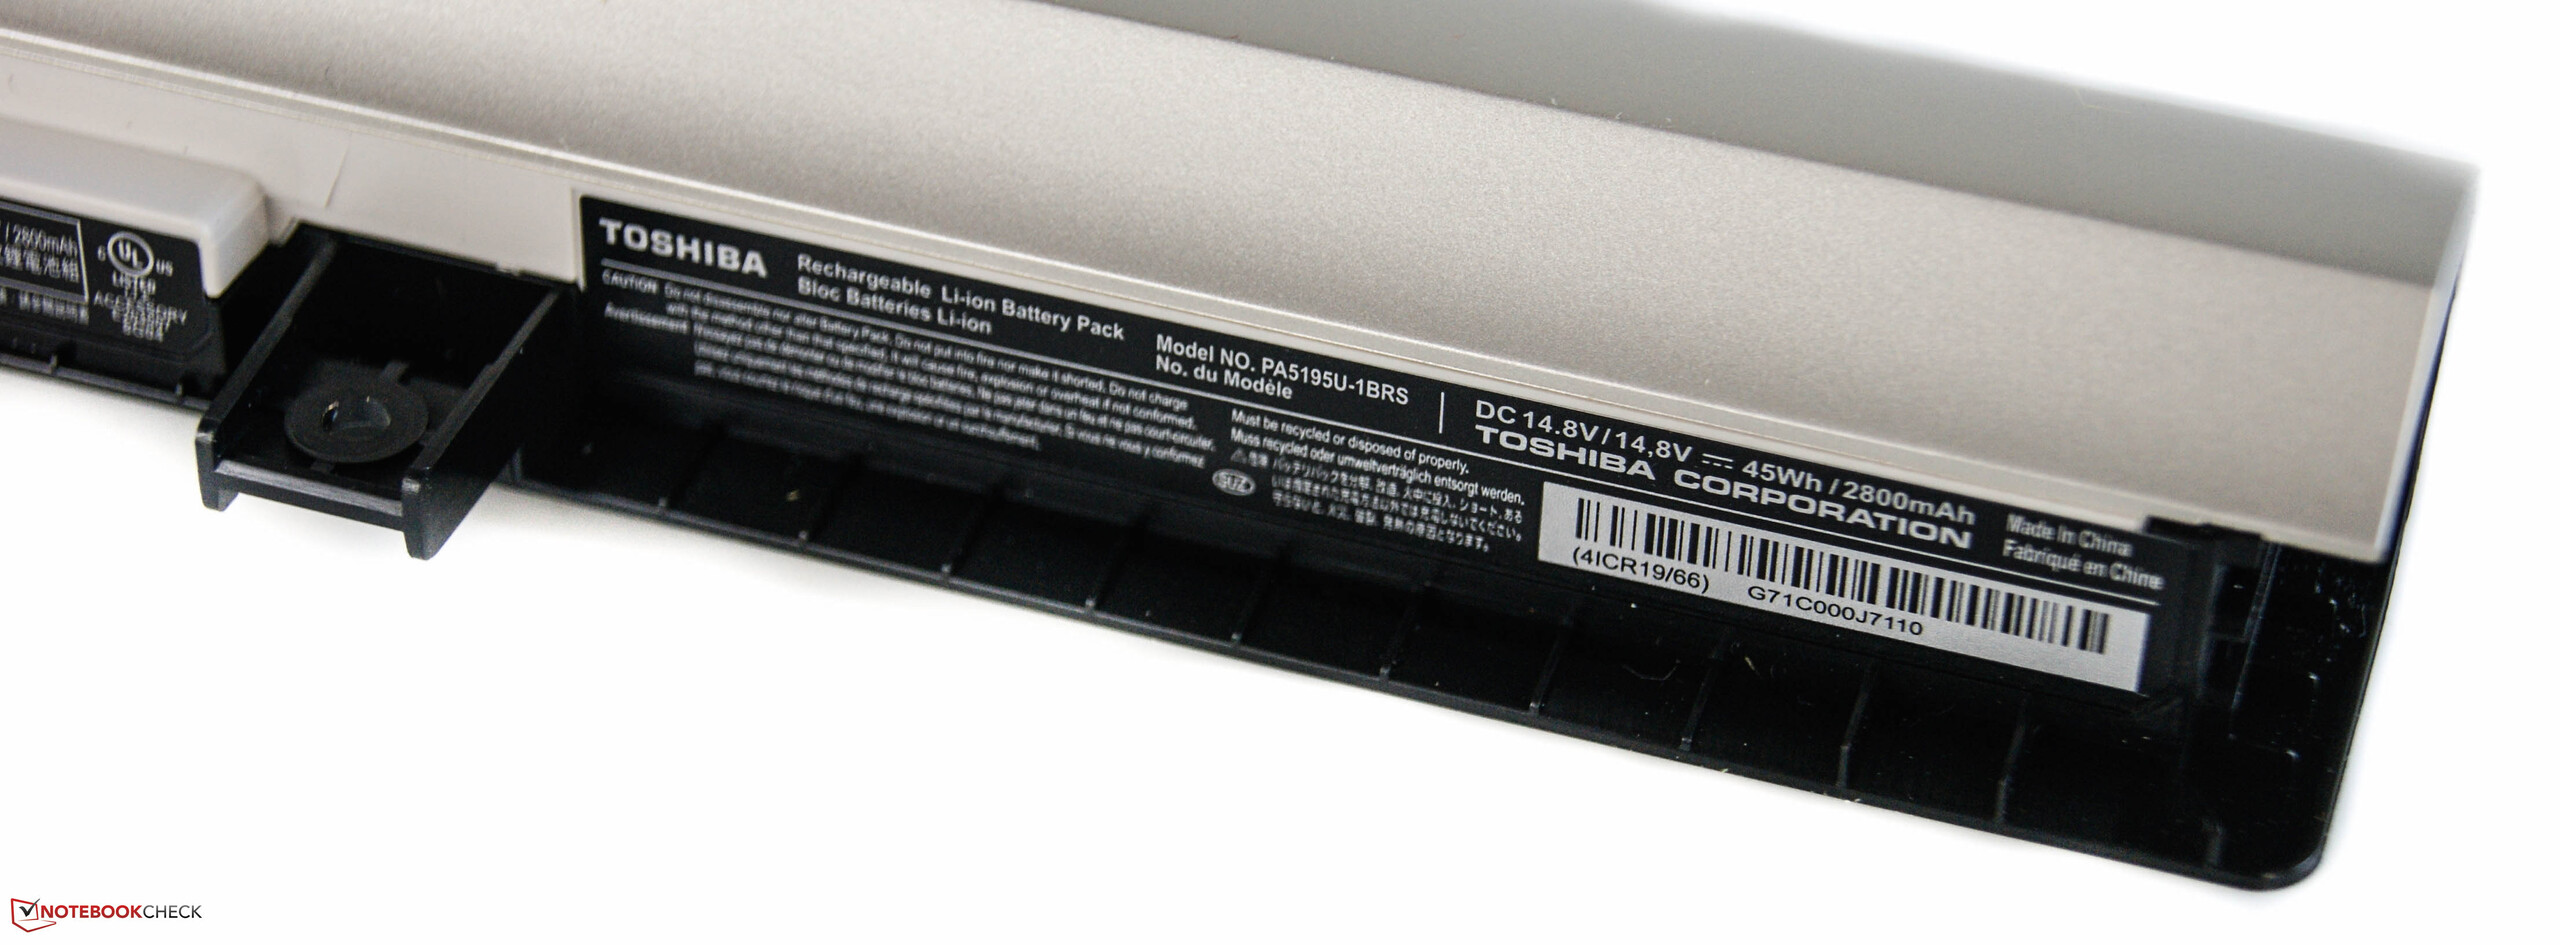
2.185 kg, Power Supply: 320 g
Price
1250 Euro
Note: The manufacturer may use components from different suppliers including display panels, drives or memory sticks with similar specifications.


| |||||||||||||||||||||||||
LG Philips LGD0470 LP156WF tested with X-Rite i1Pro 2
Maximum: 327 cd/m² (Nits) Average: 300.7 cd/m²Brightness Distribution: 86 %
Center on Battery: 245 cd/m²
Contrast: 1075:1 (Black: 0.28 cd/m²)
ΔE Color 6.31 | 0.5-29.43 Ø5
ΔE Greyscale 7.02 | 0.57-98 Ø5.3
84% sRGB (Argyll 1.6.3 3D)
55% AdobeRGB 1998 (Argyll 1.6.3 3D)
61.2% AdobeRGB 1998 (Argyll 2.2.0 3D)
83.8% sRGB (Argyll 2.2.0 3D)
64.3% Display P3 (Argyll 2.2.0 3D)
Gamma: 3.11
| Toshiba Satellite P50-C-10G GeForce 930M, 5500U, Toshiba MQ02ABD100H | MSI PE60-2QEi581 GeForce GTX 960M, 4210H, HGST Travelstar 7K1000 HTS721010A9E630 | Dell Inspiron 15-7548 Radeon R7 M270, 5500U, Liteon IT LCS-256L9S-11 | HP EliteBook 850 G2 J8R68EA Radeon R7 M260X, 5500U, Samsung SSD PM851 256 GB MZ7TE256HMHP | |
|---|---|---|---|---|
| Display | 12% | -7% | ||
| Display P3 Coverage | 64.3 | 67.6 5% | 56.5 -12% | |
| sRGB Coverage | 83.8 | 97 16% | 80.7 -4% | |
| AdobeRGB 1998 Coverage | 61.2 | 69.8 14% | 58.4 -5% | |
| Screen | 14% | -44% | -30% | |
| Brightness middle | 301 | 300 0% | 214 -29% | 314 4% |
| Brightness | 301 | 282 -6% | 204 -32% | 294 -2% |
| Brightness Distribution | 86 | 90 5% | 77 -10% | 88 2% |
| Black Level * | 0.28 | 0.35 -25% | 0.76 -171% | 0.66 -136% |
| Contrast | 1075 | 857 -20% | 282 -74% | 476 -56% |
| Colorchecker dE 2000 * | 6.31 | 1.8 71% | 5.83 8% | 7.43 -18% |
| Greyscale dE 2000 * | 7.02 | 2.18 69% | 7.17 -2% | 9.25 -32% |
| Gamma | 3.11 71% | 2.37 93% | 1.94 113% | 2.49 88% |
| CCT | 7186 90% | 6837 95% | 5617 116% | 10786 60% |
| Color Space (Percent of AdobeRGB 1998) | 55 | 64 16% | 52.3 -5% | |
| Color Space (Percent of sRGB) | 84 | 97 15% | ||
| Total Average (Program / Settings) | 13% /
13% | -44% /
-44% | -19% /
-24% |
* ... smaller is better
| Toshiba Satellite P50-C-10G GeForce 930M, 5500U, Toshiba MQ02ABD100H | Dell Inspiron 15-7548 Radeon R7 M270, 5500U, Liteon IT LCS-256L9S-11 | MSI PE60-2QEi581 GeForce GTX 960M, 4210H, HGST Travelstar 7K1000 HTS721010A9E630 | HP EliteBook 850 G2 J8R68EA Radeon R7 M260X, 5500U, Samsung SSD PM851 256 GB MZ7TE256HMHP | |
|---|---|---|---|---|
| PCMark 7 | ||||
| Score | 3923 | 5417 38% | 3275 -17% | 4905 25% |
| PCMark 8 | -7% | 9% | 13% | |
| Home Score Accelerated v2 | 3069 | 2805 -9% | 3114 1% | 3726 21% |
| Creative Score Accelerated v2 | 4099 | 3826 -7% | 3826 -7% | |
| Work Score Accelerated v2 | 3581 | 3413 -5% | 4169 16% | 4491 25% |
| Total Average (Program / Settings) | 16% /
4% | -4% /
0% | 19% /
16% |
| PCMark 7 Score | 3923 points | |
| PCMark 8 Home Score Accelerated v2 | 3069 points | |
| PCMark 8 Creative Score Accelerated v2 | 4099 points | |
| PCMark 8 Work Score Accelerated v2 | 3581 points | |
Help | ||
| Toshiba Satellite P50-C-10G GeForce 930M, 5500U, Toshiba MQ02ABD100H | MSI PE60-2QEi581 GeForce GTX 960M, 4210H, HGST Travelstar 7K1000 HTS721010A9E630 | Dell Inspiron 15-7548 Radeon R7 M270, 5500U, Liteon IT LCS-256L9S-11 | HP EliteBook 850 G2 J8R68EA Radeon R7 M260X, 5500U, Samsung SSD PM851 256 GB MZ7TE256HMHP | |
|---|---|---|---|---|
| CrystalDiskMark 3.0 | 105% | 23718% | 25398% | |
| Read Seq | 102.8 | 140.4 37% | 497.3 384% | 528 414% |
| Write Seq | 61.8 | 140.1 127% | 418 576% | 267.4 333% |
| Read 512 | 27.14 | 49.28 82% | 373.9 1278% | 448.2 1551% |
| Write 512 | 37.58 | 65 73% | 397 956% | 267.3 611% |
| Read 4k | 0.427 | 0.63 48% | 34.71 8029% | 29.2 6738% |
| Write 4k | 0.57 | 1.2 111% | 84.1 14654% | 136.1 23777% |
| Read 4k QD32 | 0.312 | 1.086 248% | 334 106951% | 384.3 123073% |
| Write 4k QD32 | 0.567 | 1.222 116% | 323.3 56919% | 265.3 46690% |

Toshiba MQ02ABD100H
Transfer Rate Minimum:
48.2 MB/s
Transfer Rate Maximum:
106.8 MB/s
Transfer Rate Average:
84.3 MB/s
Access Time:
0.2 ms
Burst Rate:
53.3 MB/s
CPU Usage:
2.7 %
| 3DMark 11 - 1280x720 Performance (sort by value) | |
| Toshiba Satellite P50-C-10G | |
| Asus Asuspro Essential P751JF-T2007G | |
| MSI PE60-2QEi581 | |
| Dell Inspiron 15-7548 | |
| HP EliteBook 850 G2 J8R68EA | |
| 3DMark - 1920x1080 Fire Strike Score (sort by value) | |
| Toshiba Satellite P50-C-10G | |
| Asus Asuspro Essential P751JF-T2007G | |
| MSI PE60-2QEi581 | |
| Dell Inspiron 15-7548 | |
| HP EliteBook 850 G2 J8R68EA | |
| 3DMark 11 Performance | 2165 points | |
| 3DMark Ice Storm Standard Score | 39147 points | |
| 3DMark Cloud Gate Standard Score | 6200 points | |
| 3DMark Fire Strike Score | 1287 points | |
Help | ||
| Alien: Isolation | |
| 1366x768 Medium, On (AA & SSAO Off), Shadow Map 1024 AF:4x (sort by value) | |
| Toshiba Satellite P50-C-10G | |
| MSI PE60-2QEi581 | |
| 1920x1080 High, On, Shadow Map 1536, Standard SSAO AA:FX AF:8x (sort by value) | |
| Toshiba Satellite P50-C-10G | |
| MSI PE60-2QEi581 | |
| 1920x1080 Ultra, On, Shadow Map 2048, HDAO AA:2x SM AF:16x (sort by value) | |
| Toshiba Satellite P50-C-10G | |
| MSI PE60-2QEi581 | |
| low | med. | high | ultra | |
| Alien: Isolation (2014) | 63.5 | 41.8 | 21.2 | 15.7 |
| GTA V (2015) | 57.5 | 50.8 | 13.4 | 5.7 |
| Batman: Arkham Knight (2015) | 13 | 11 | 5 | 5 |
Noise Level
| Idle |
| 33.2 / 33.2 / 33.2 dB(A) |
| DVD |
| 38.5 / dB(A) |
| Load |
| 44.7 / 44.7 dB(A) |
 | ||
30 dB silent 40 dB(A) audible 50 dB(A) loud |
||
min: | ||
(±) The average temperature for the upper side under maximal load is 35.7 °C / 96 F, compared to the average of 31.2 °C / 88 F for the devices in the class Multimedia.
(-) The maximum temperature on the upper side is 49.6 °C / 121 F, compared to the average of 36.9 °C / 98 F, ranging from 21.1 to 71 °C for the class Multimedia.
(-) The bottom heats up to a maximum of 53.3 °C / 128 F, compared to the average of 39.1 °C / 102 F
(+) In idle usage, the average temperature for the upper side is 30 °C / 86 F, compared to the device average of 31.2 °C / 88 F.
(±) The palmrests and touchpad can get very hot to the touch with a maximum of 36.8 °C / 98.2 F.
(-) The average temperature of the palmrest area of similar devices was 28.8 °C / 83.8 F (-8 °C / -14.4 F).
Power Consumption
| Off / Standby | |
| Idle | |
| Load |
|
| Battery Runtime - WiFi Websurfing (sort by value) | |
| Toshiba Satellite P50-C-10G | |
| MSI PE60-2QEi581 | |
| Dell Inspiron 15-7548 | |
| HP EliteBook 850 G2 J8R68EA | |
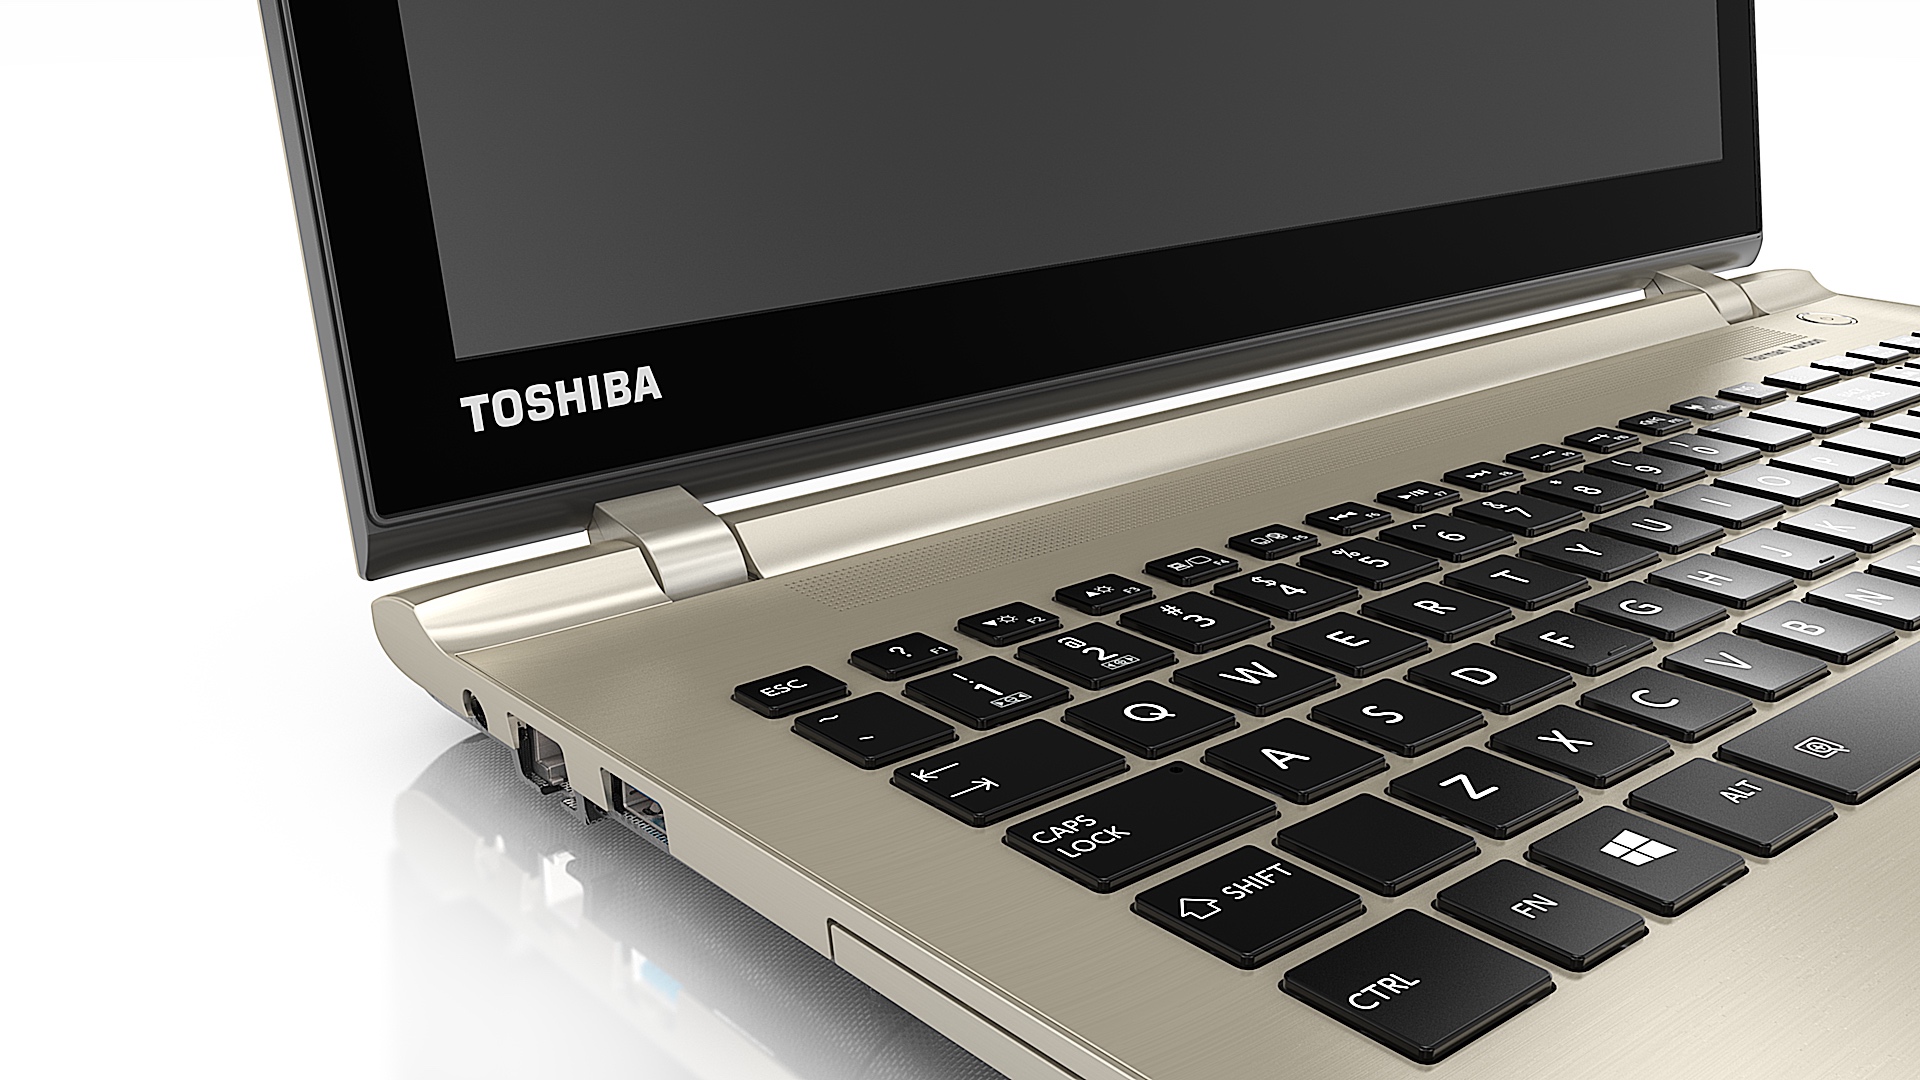
Pros
+ 对比度
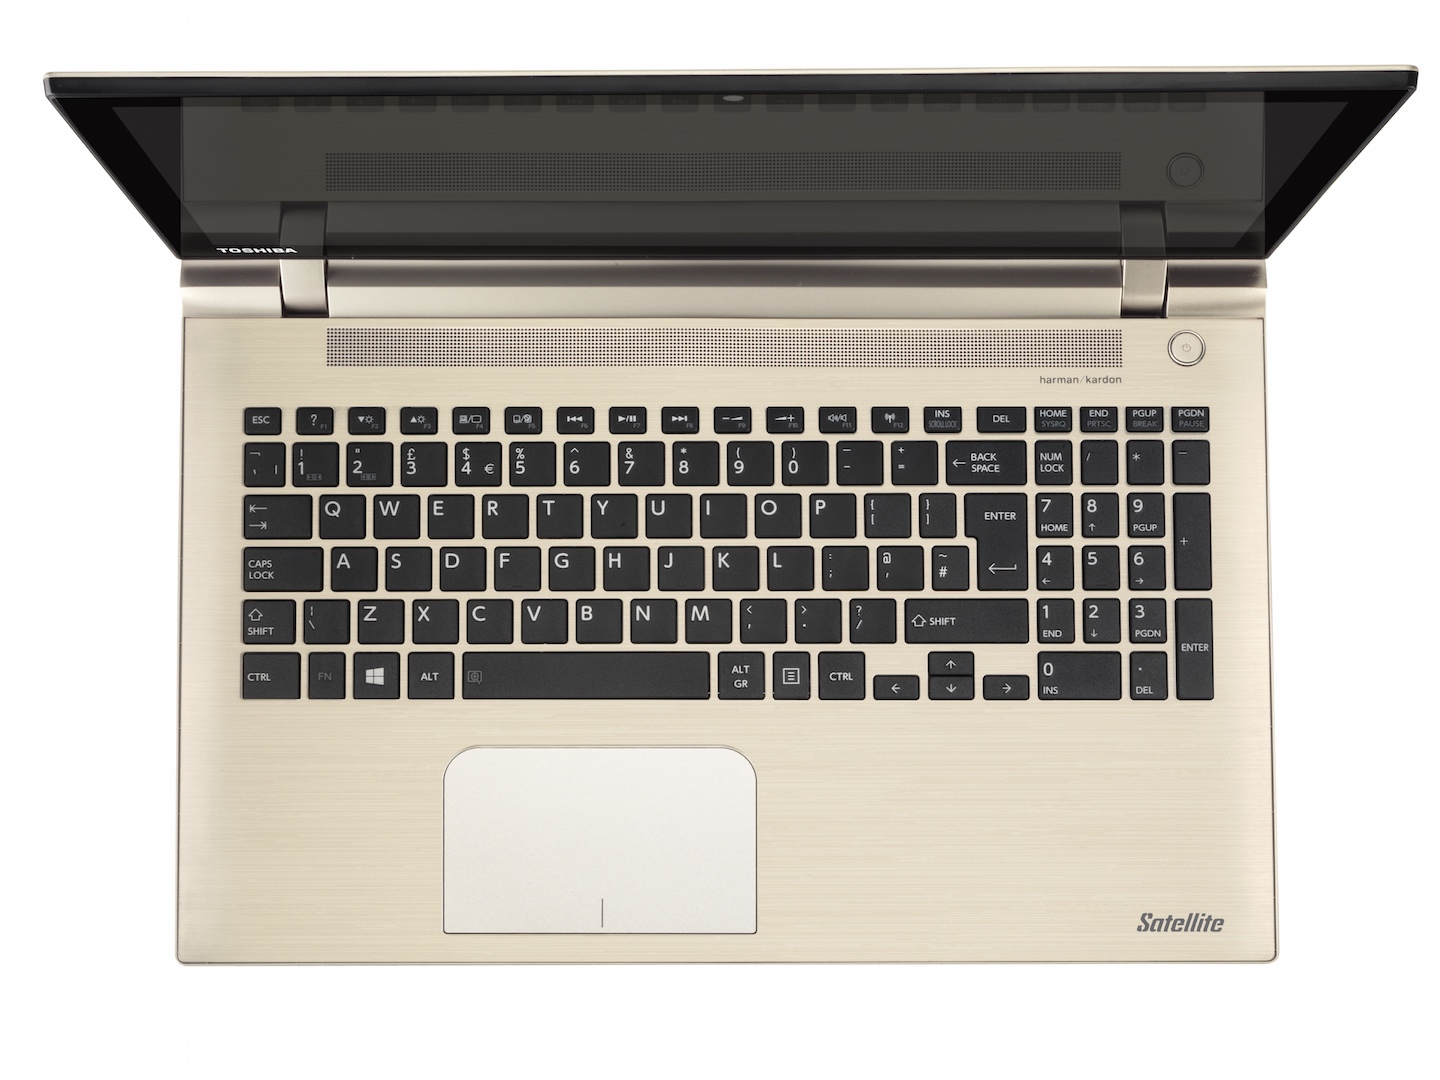
+ IPS屏幕
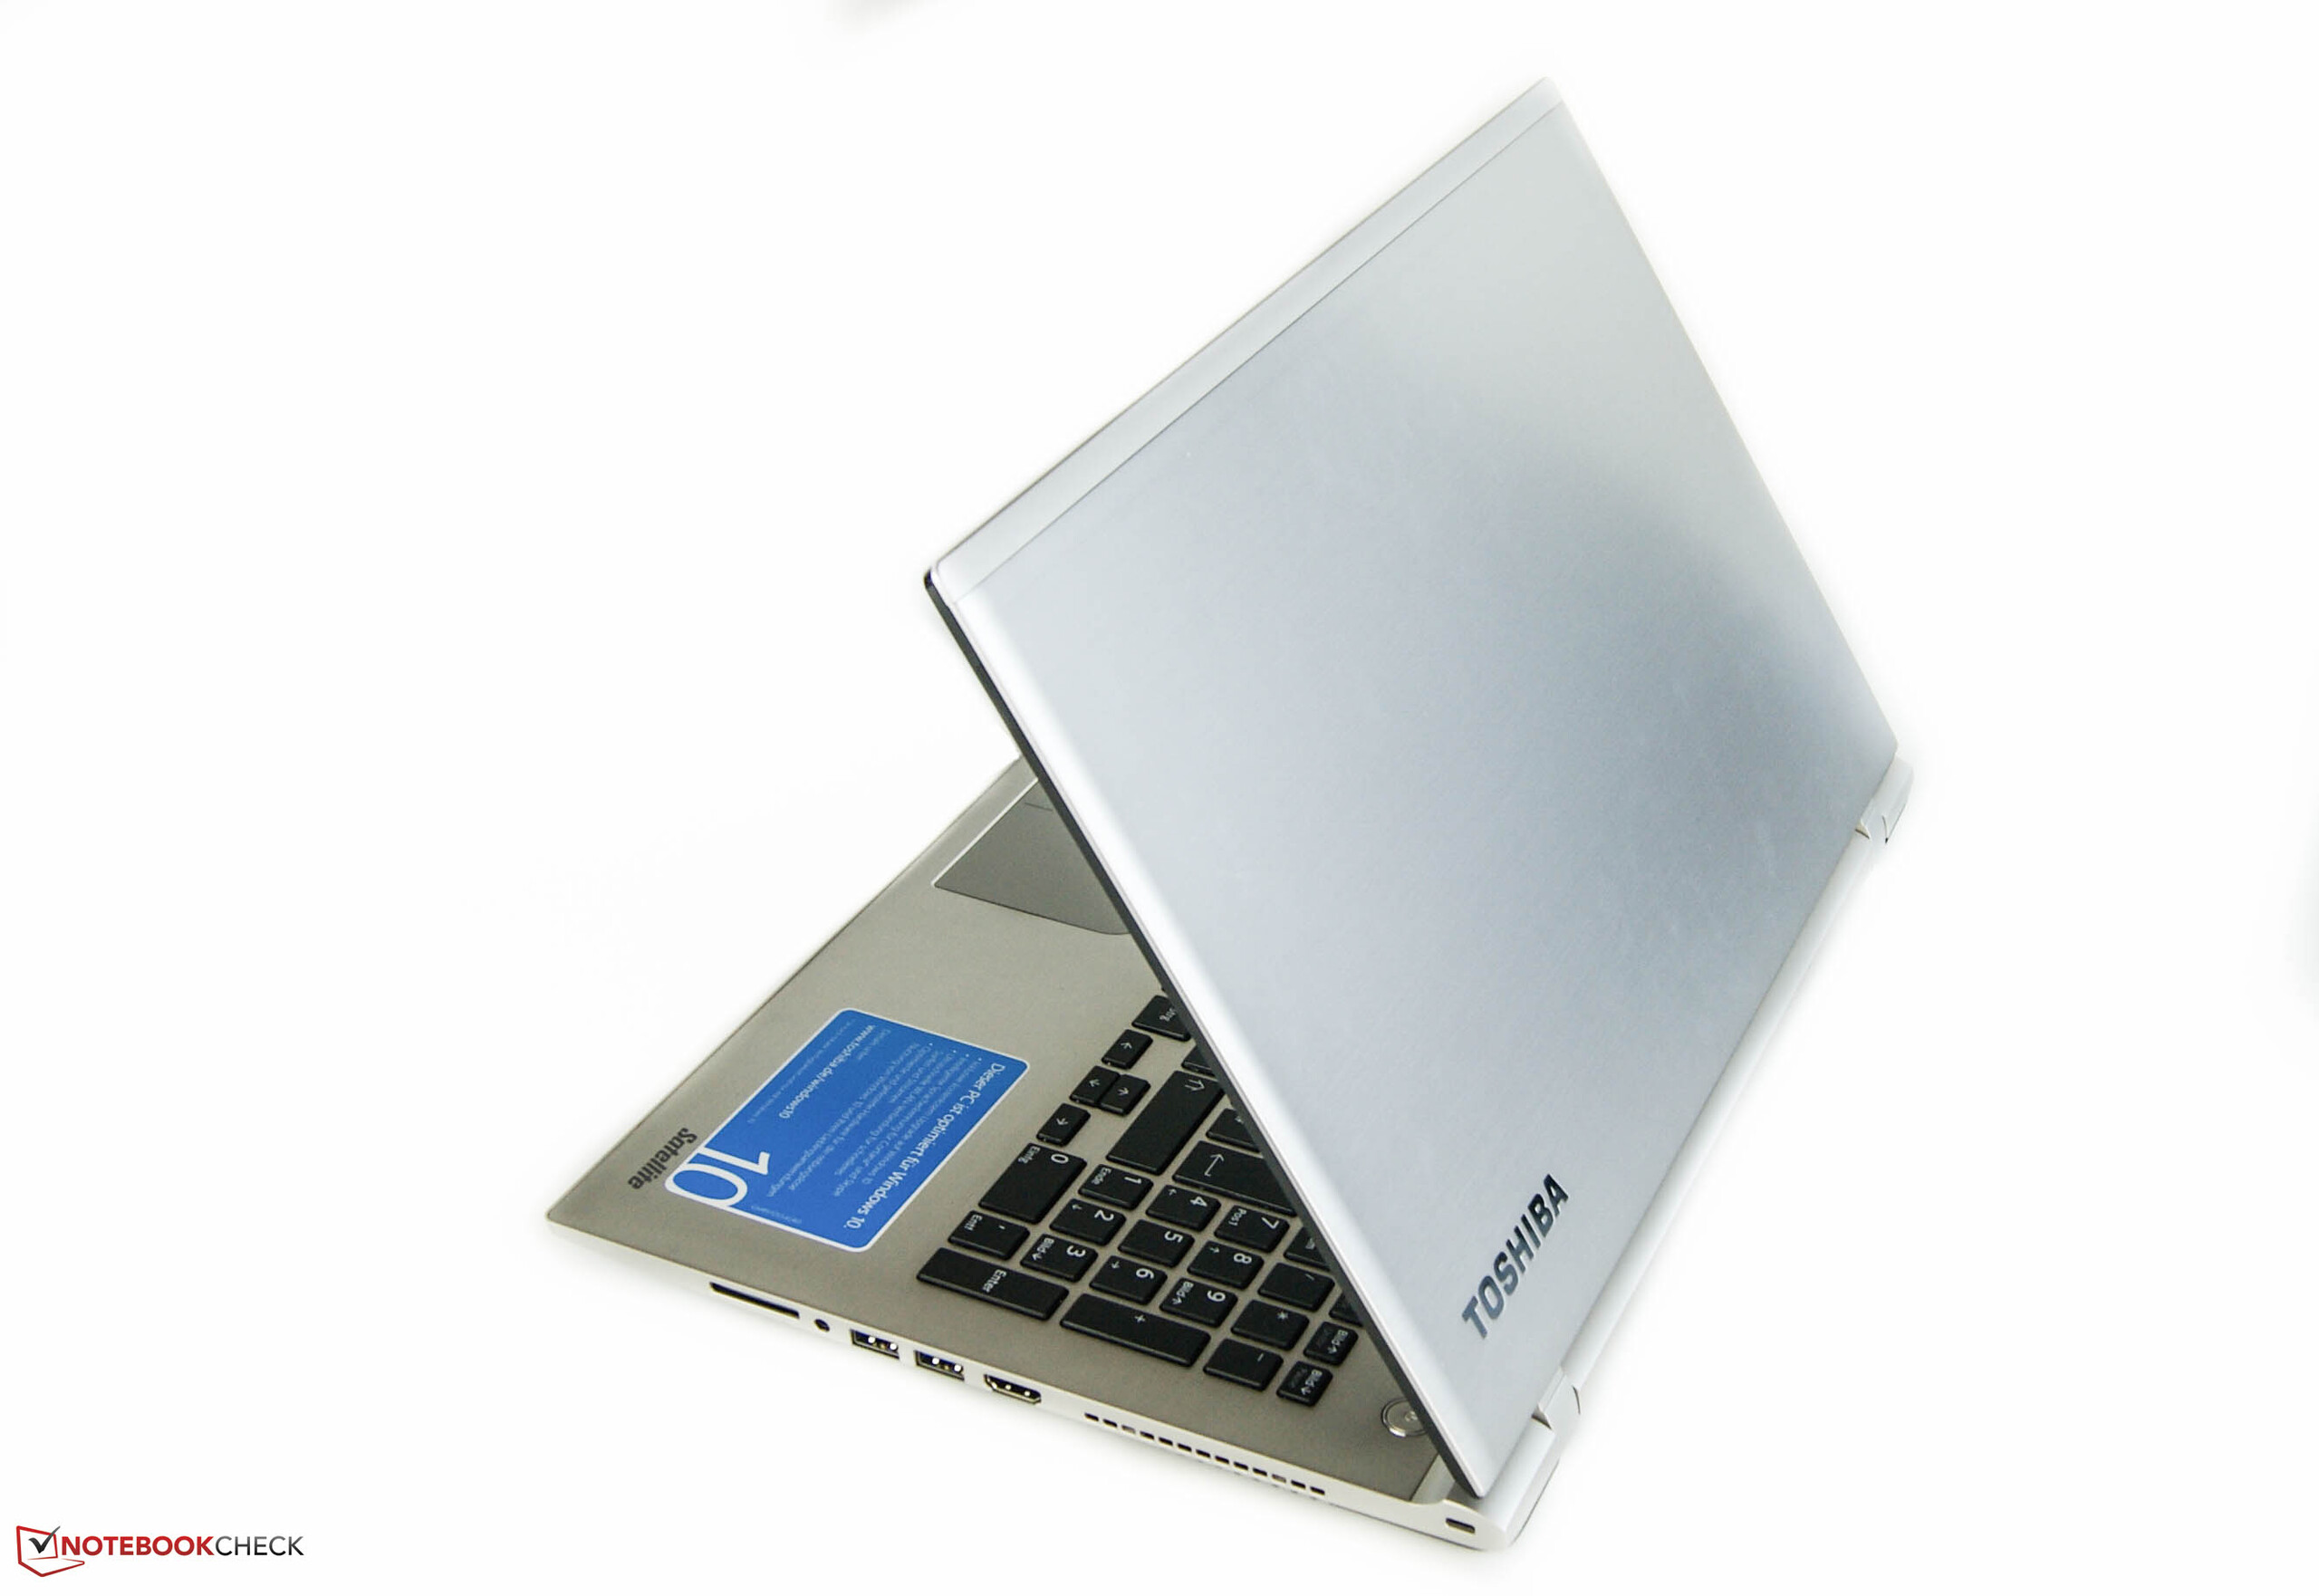
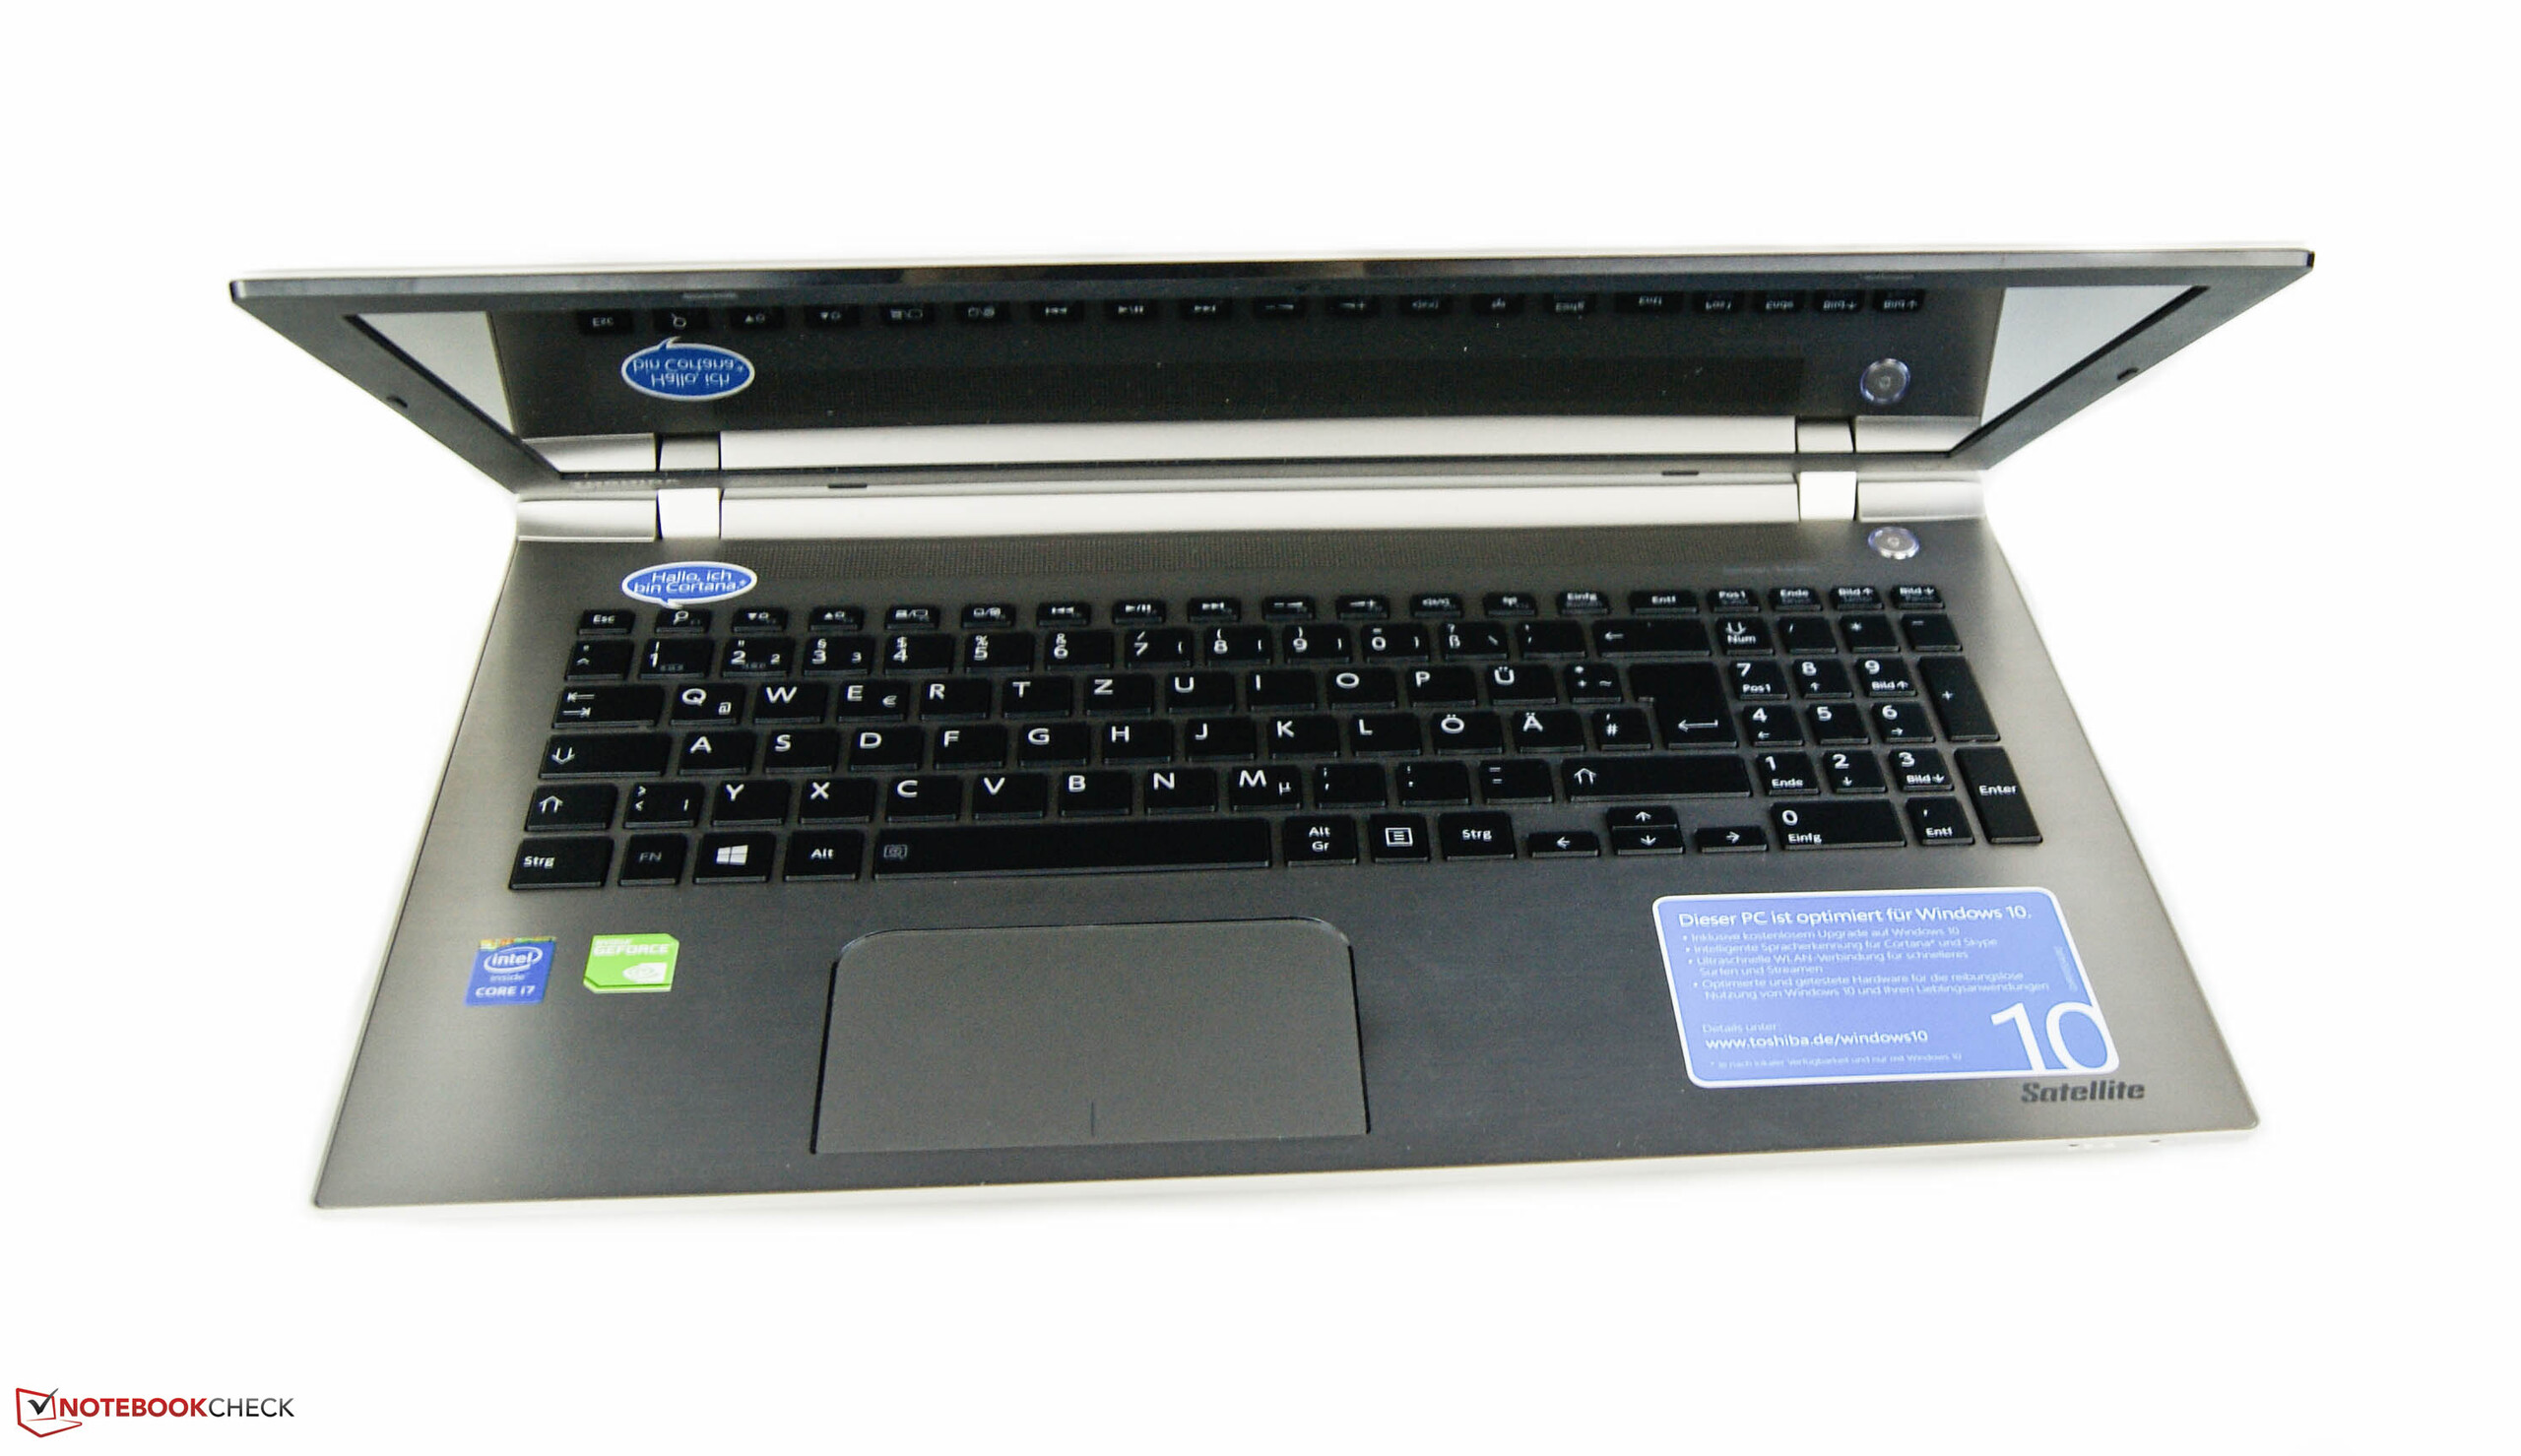
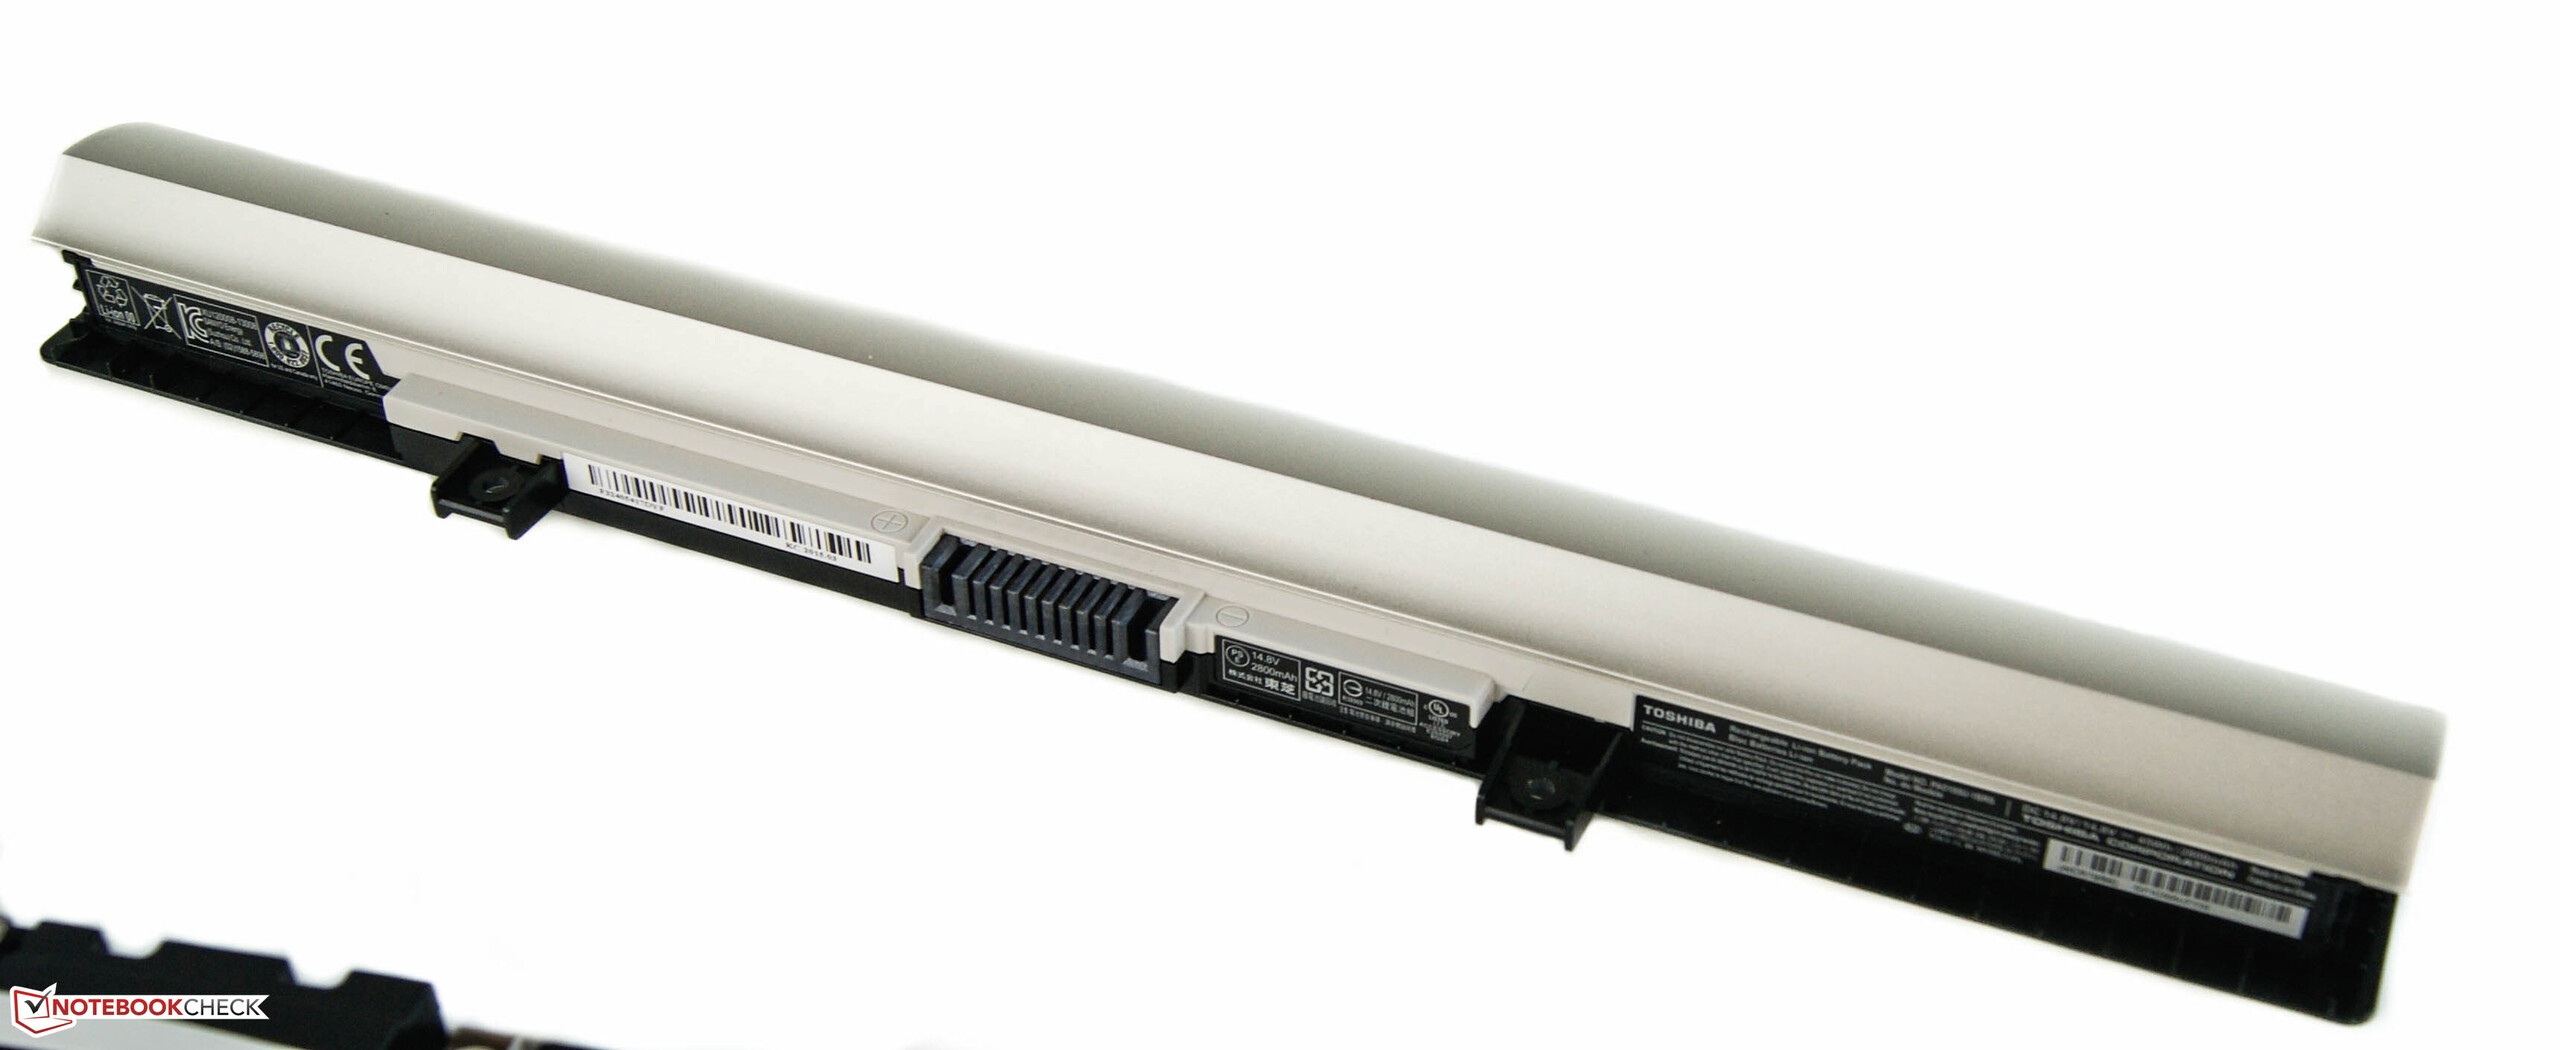
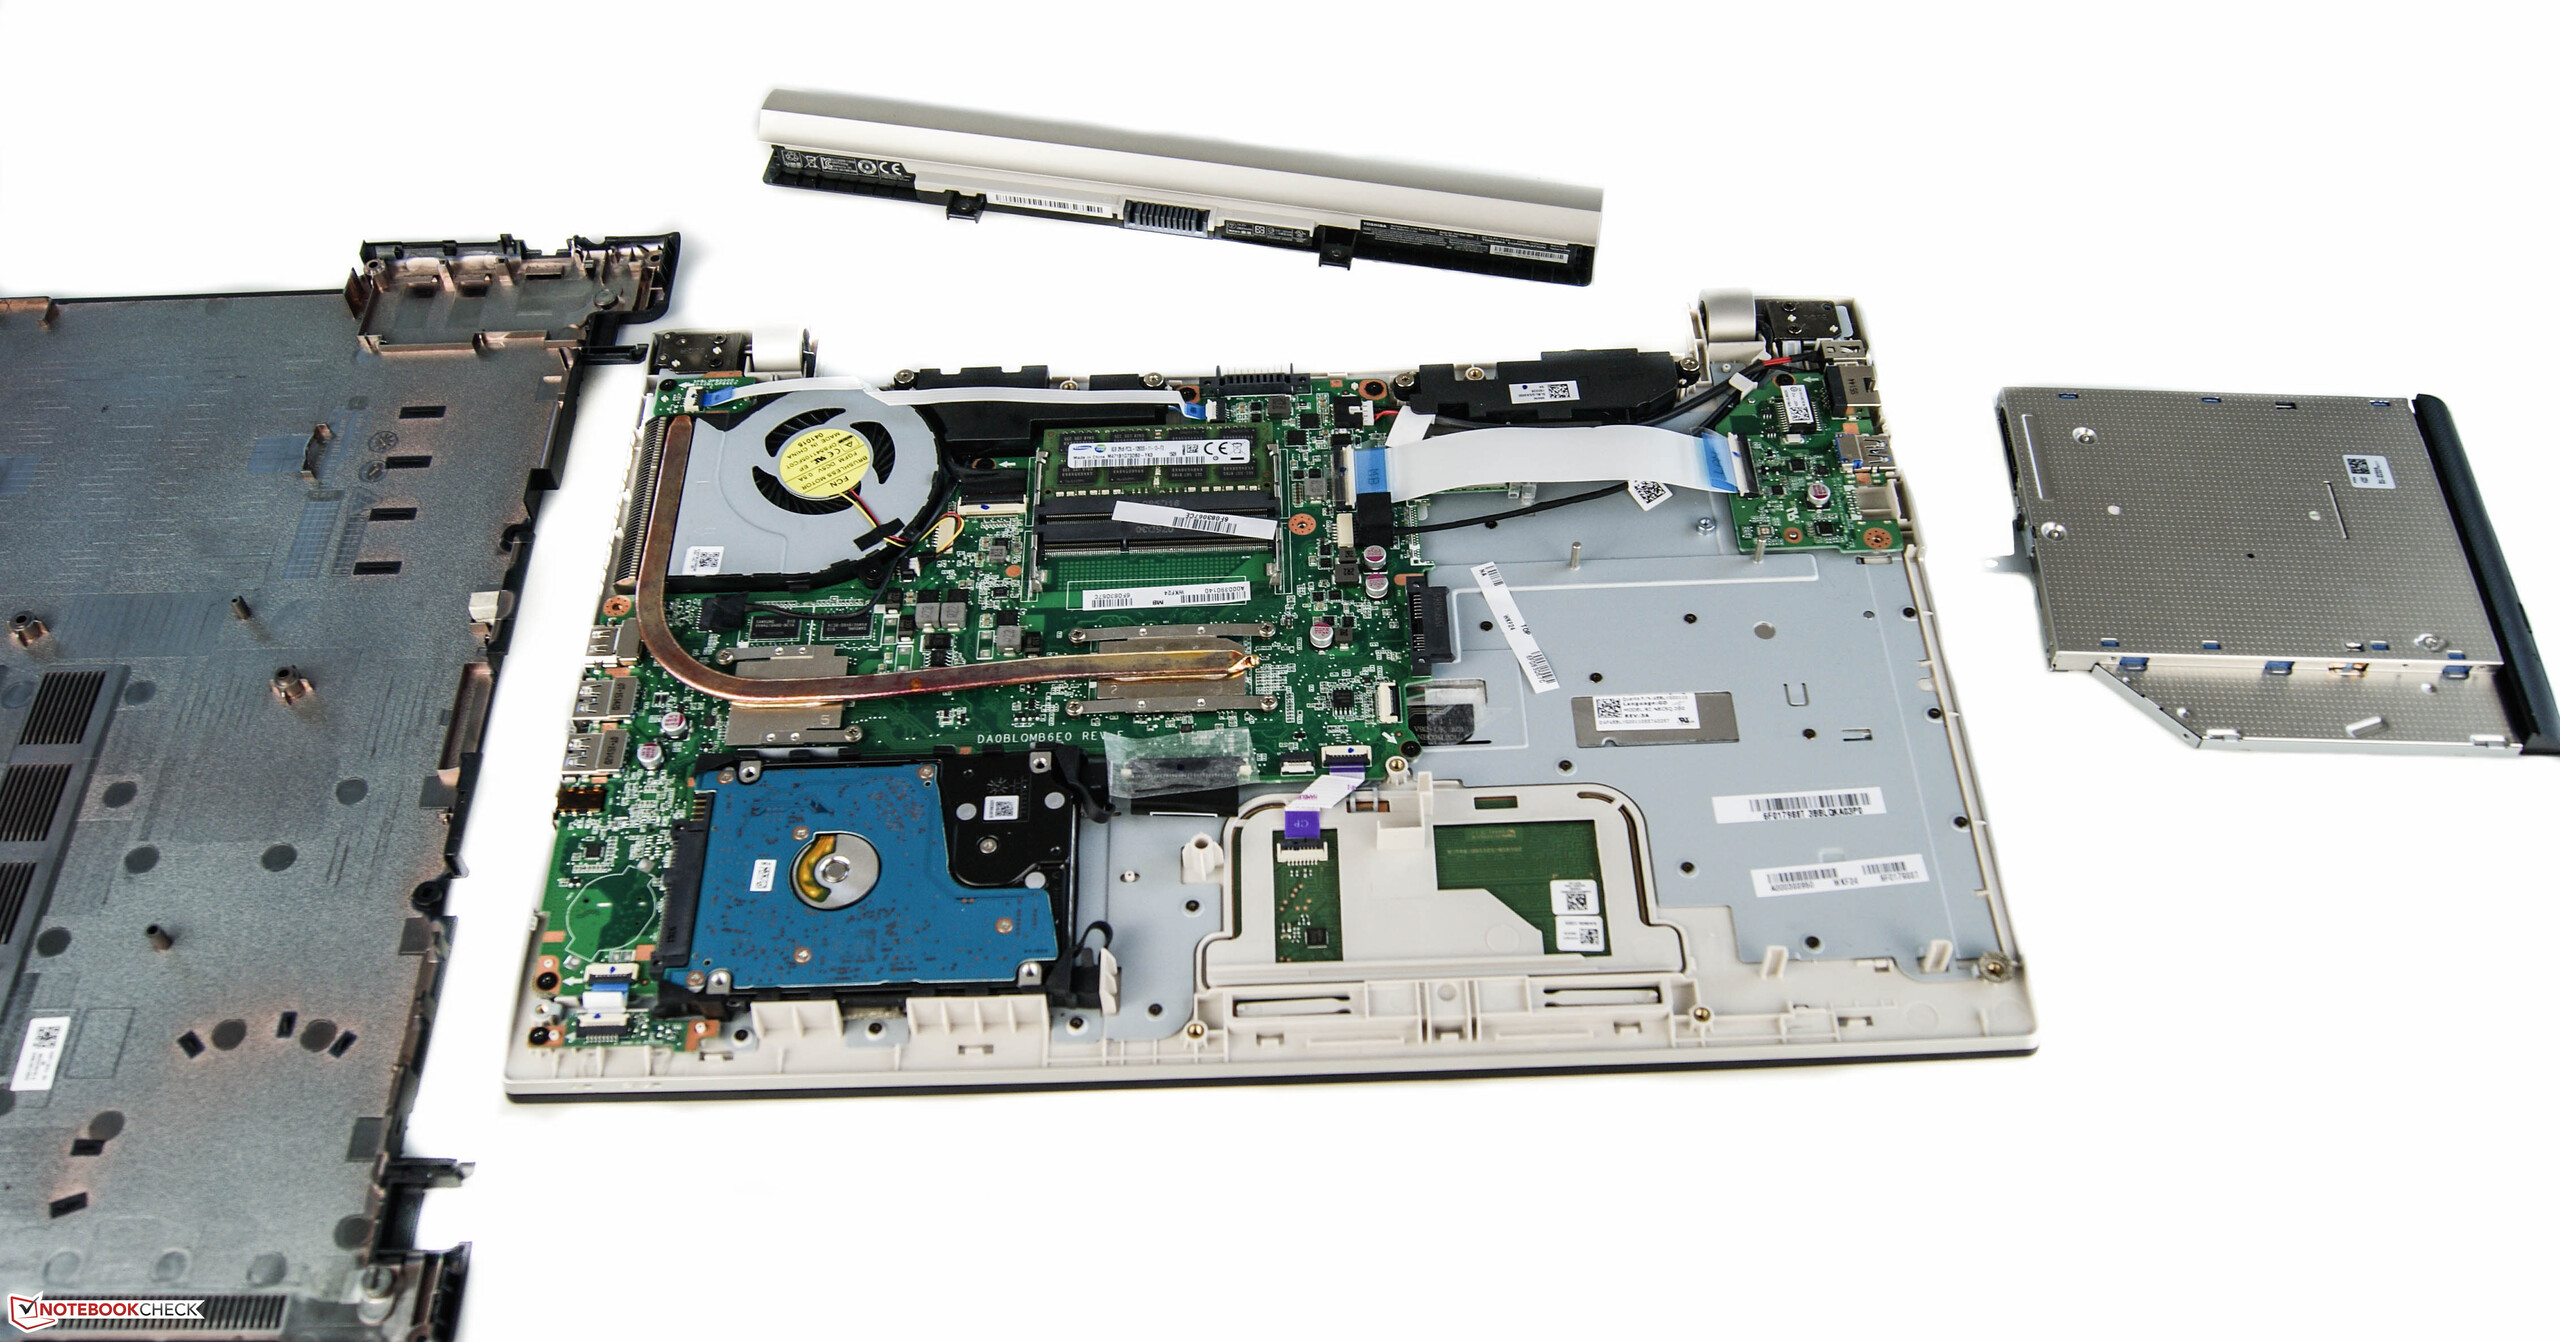
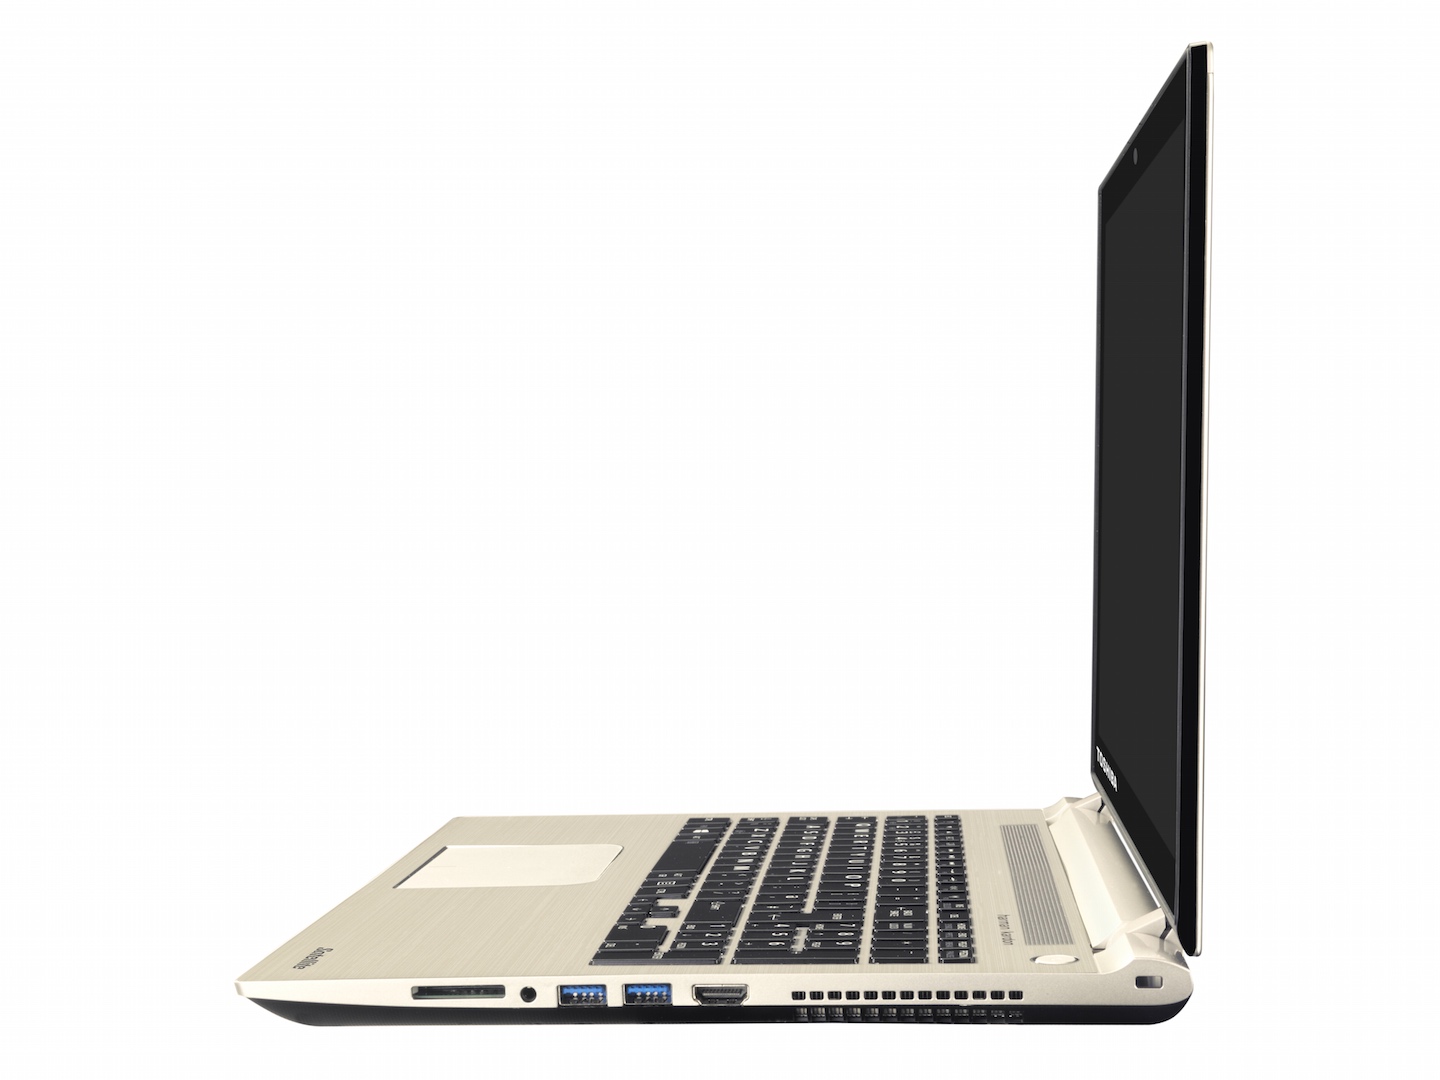
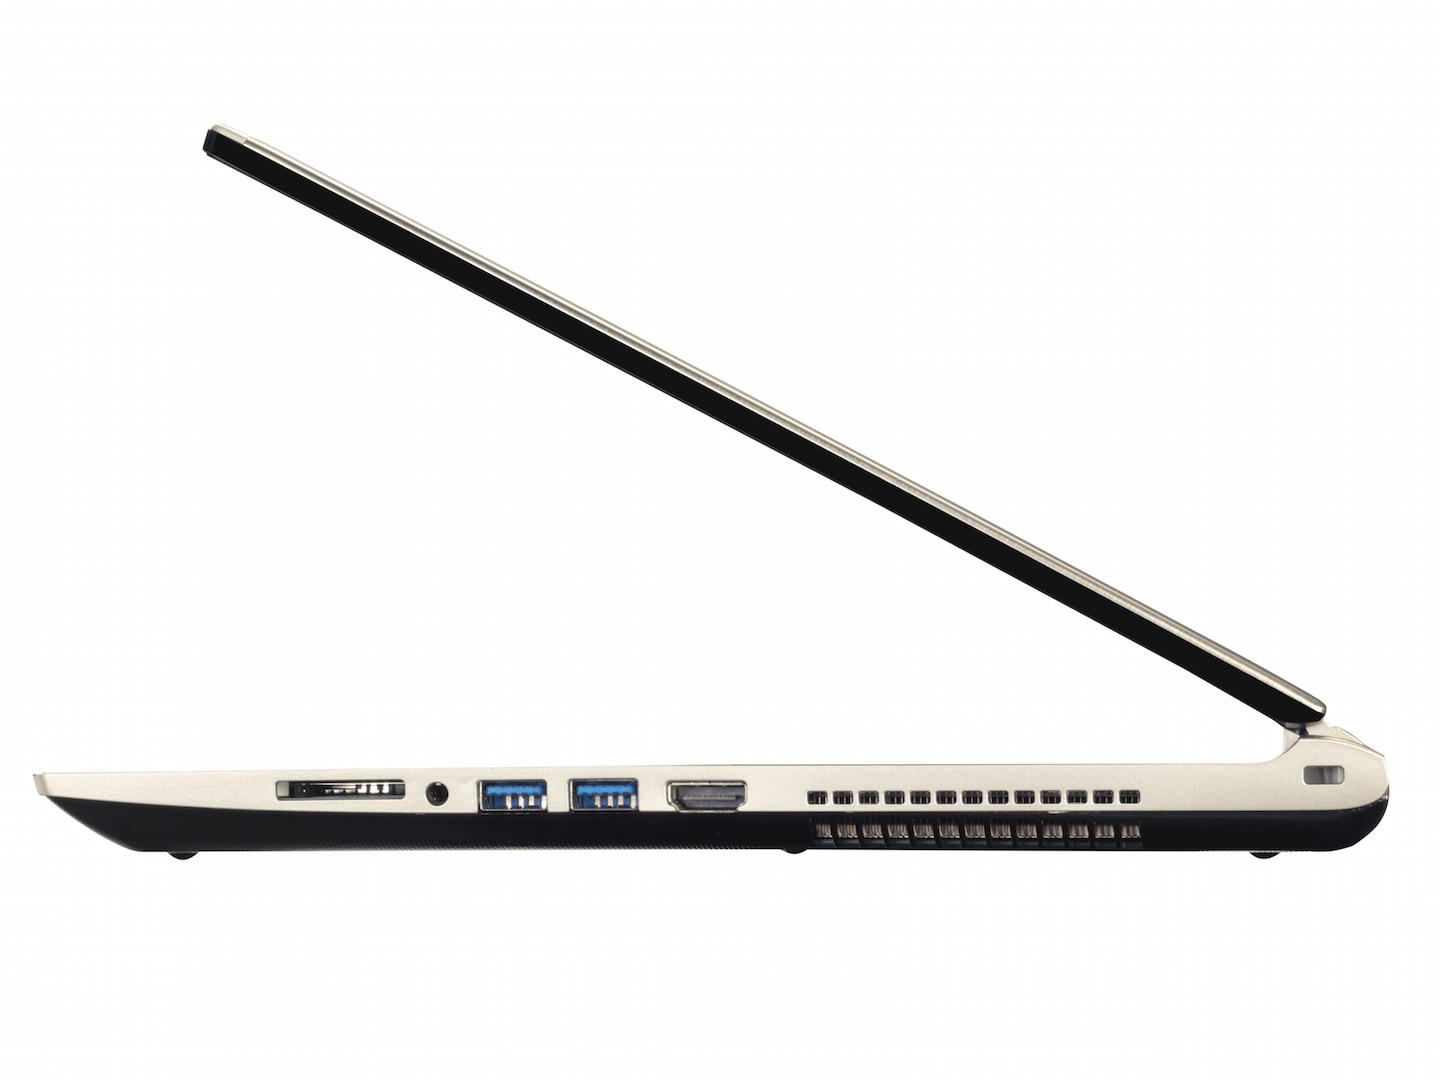
+ 维护升级空间
+ 优秀的系统性能
Cons
- 电池模式屏幕亮度降低
- 高负载下降频问题
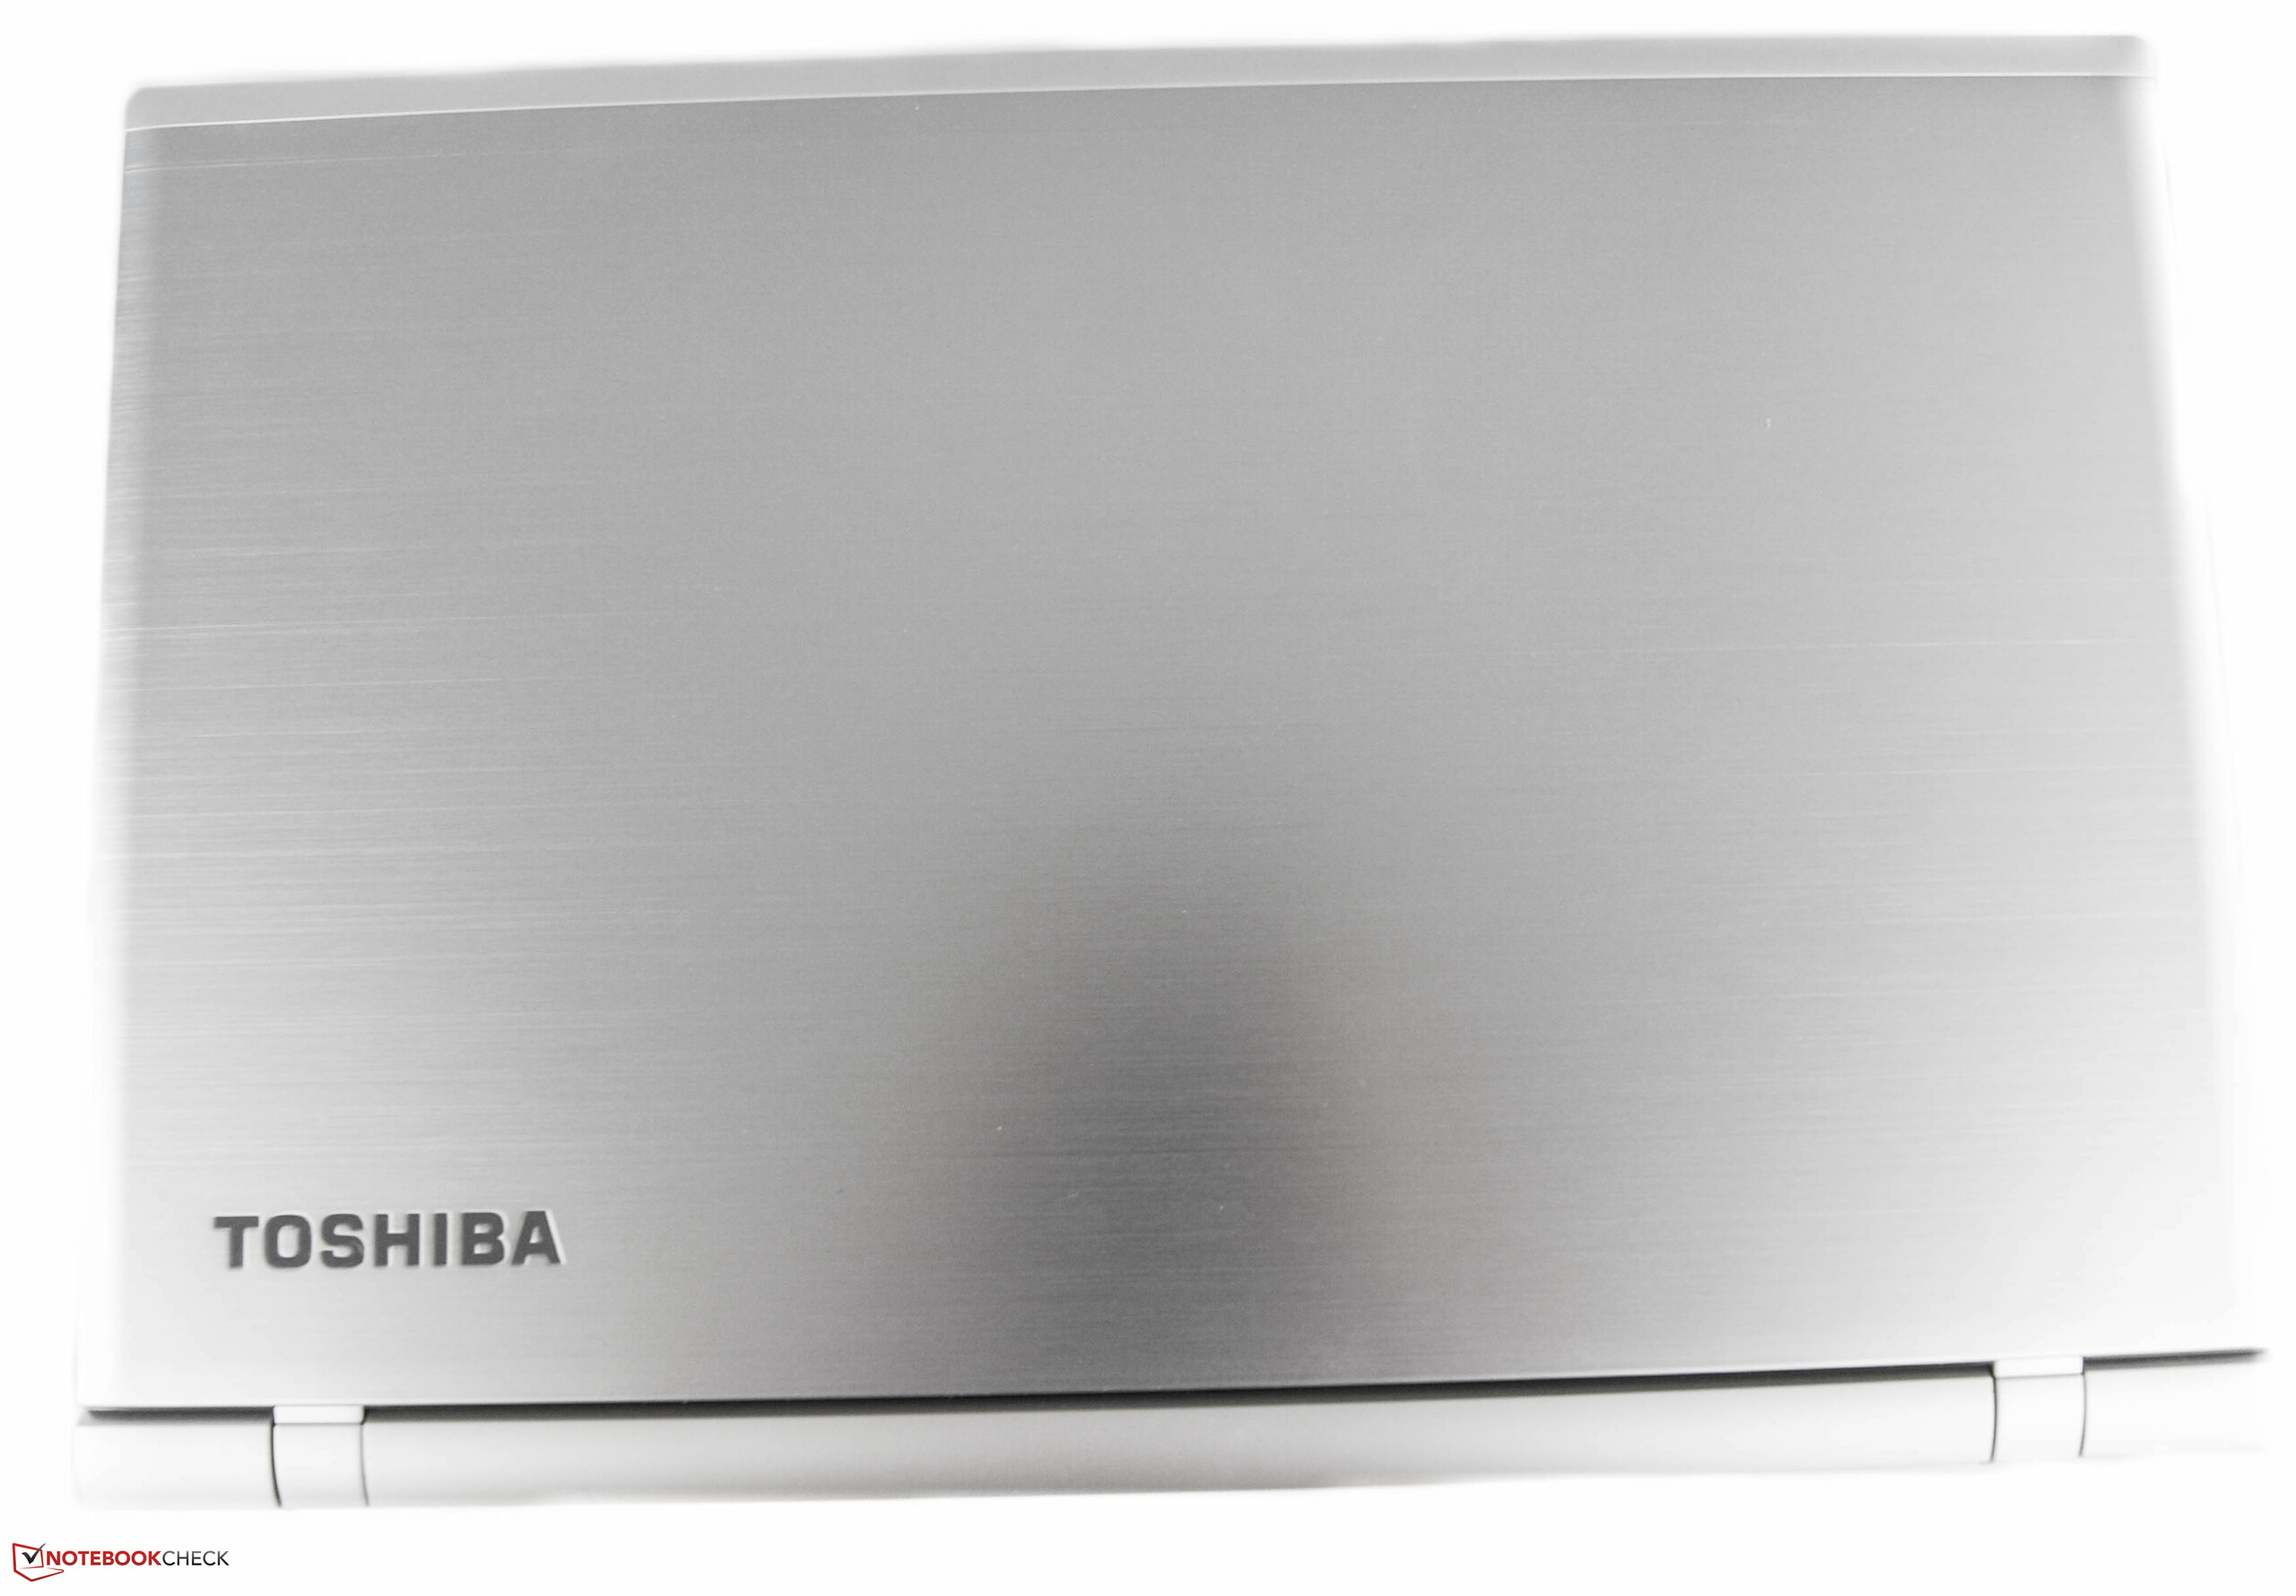
- 工艺缺陷
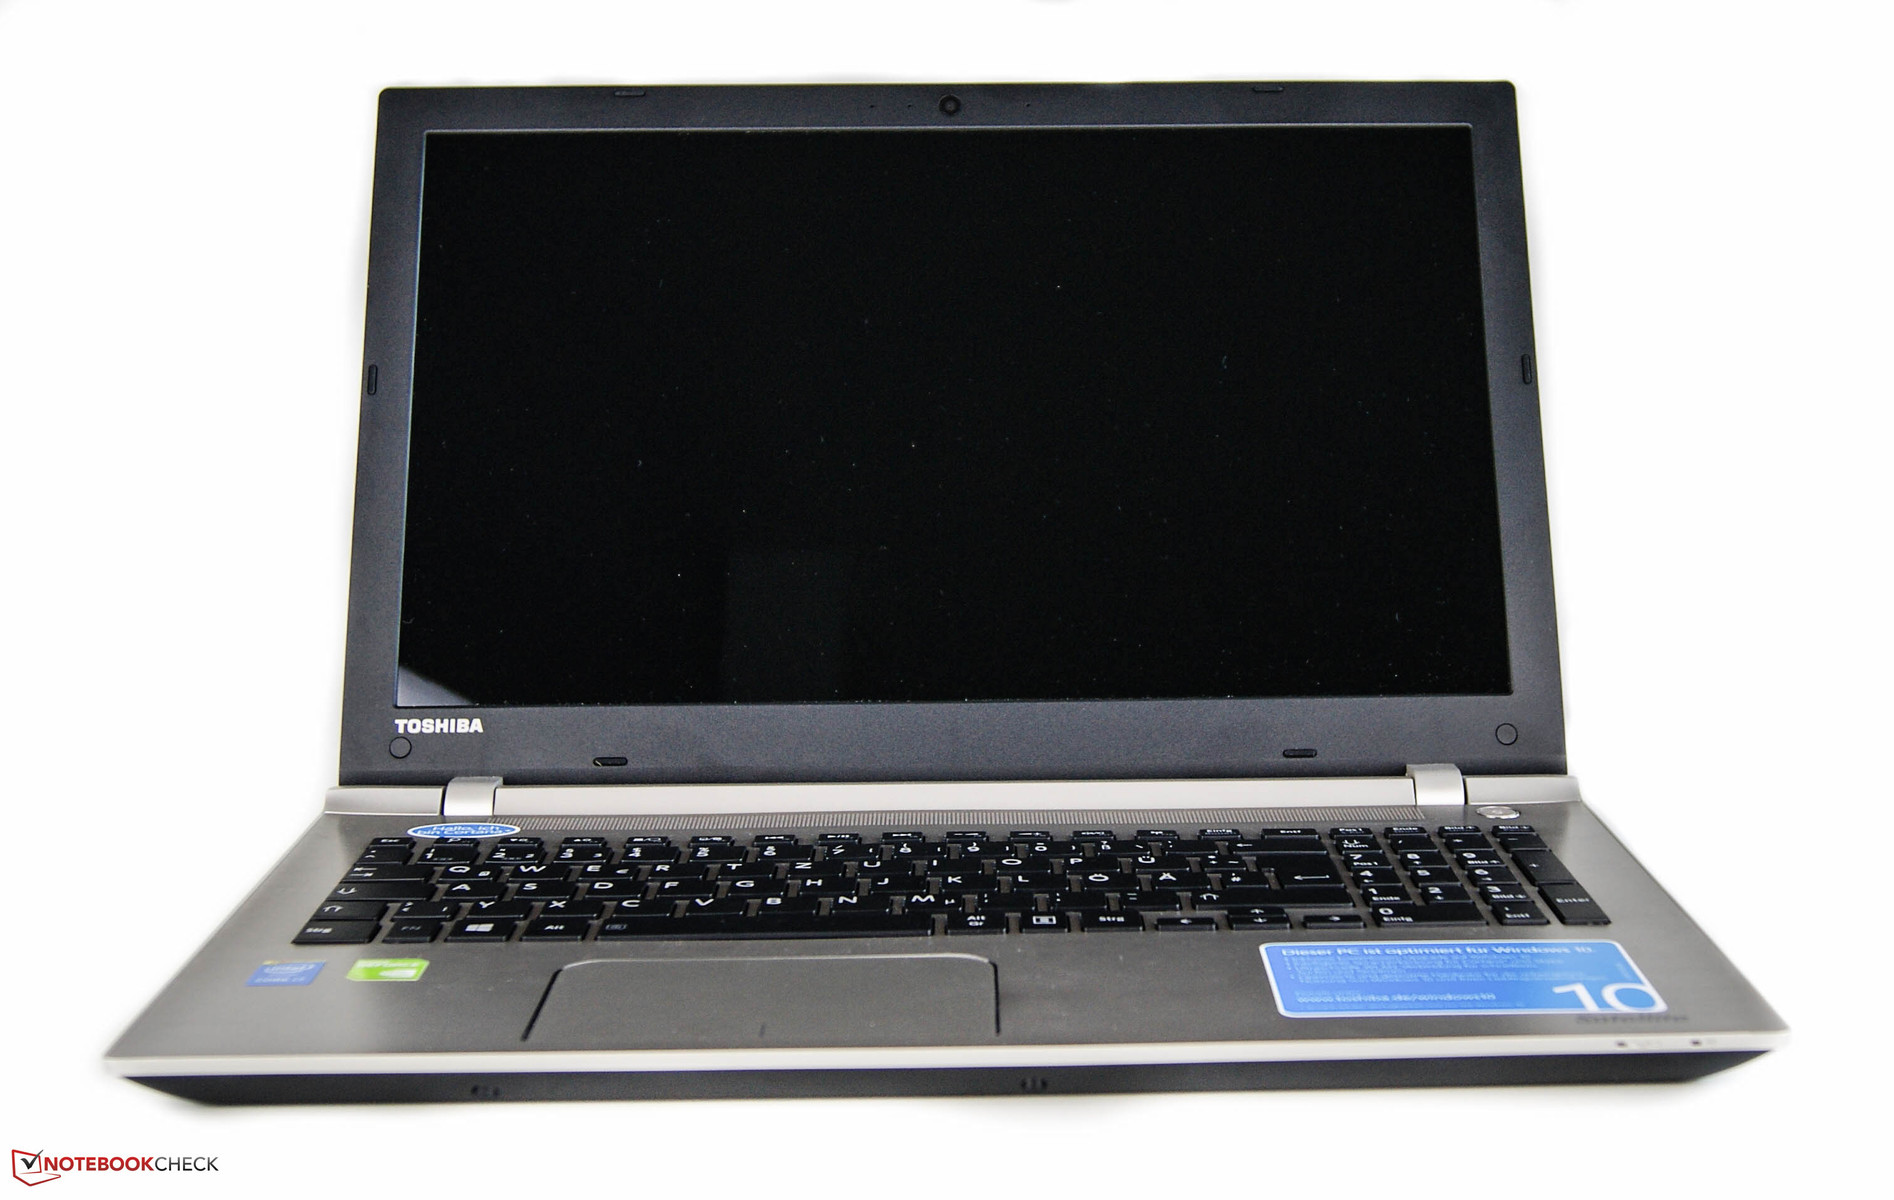
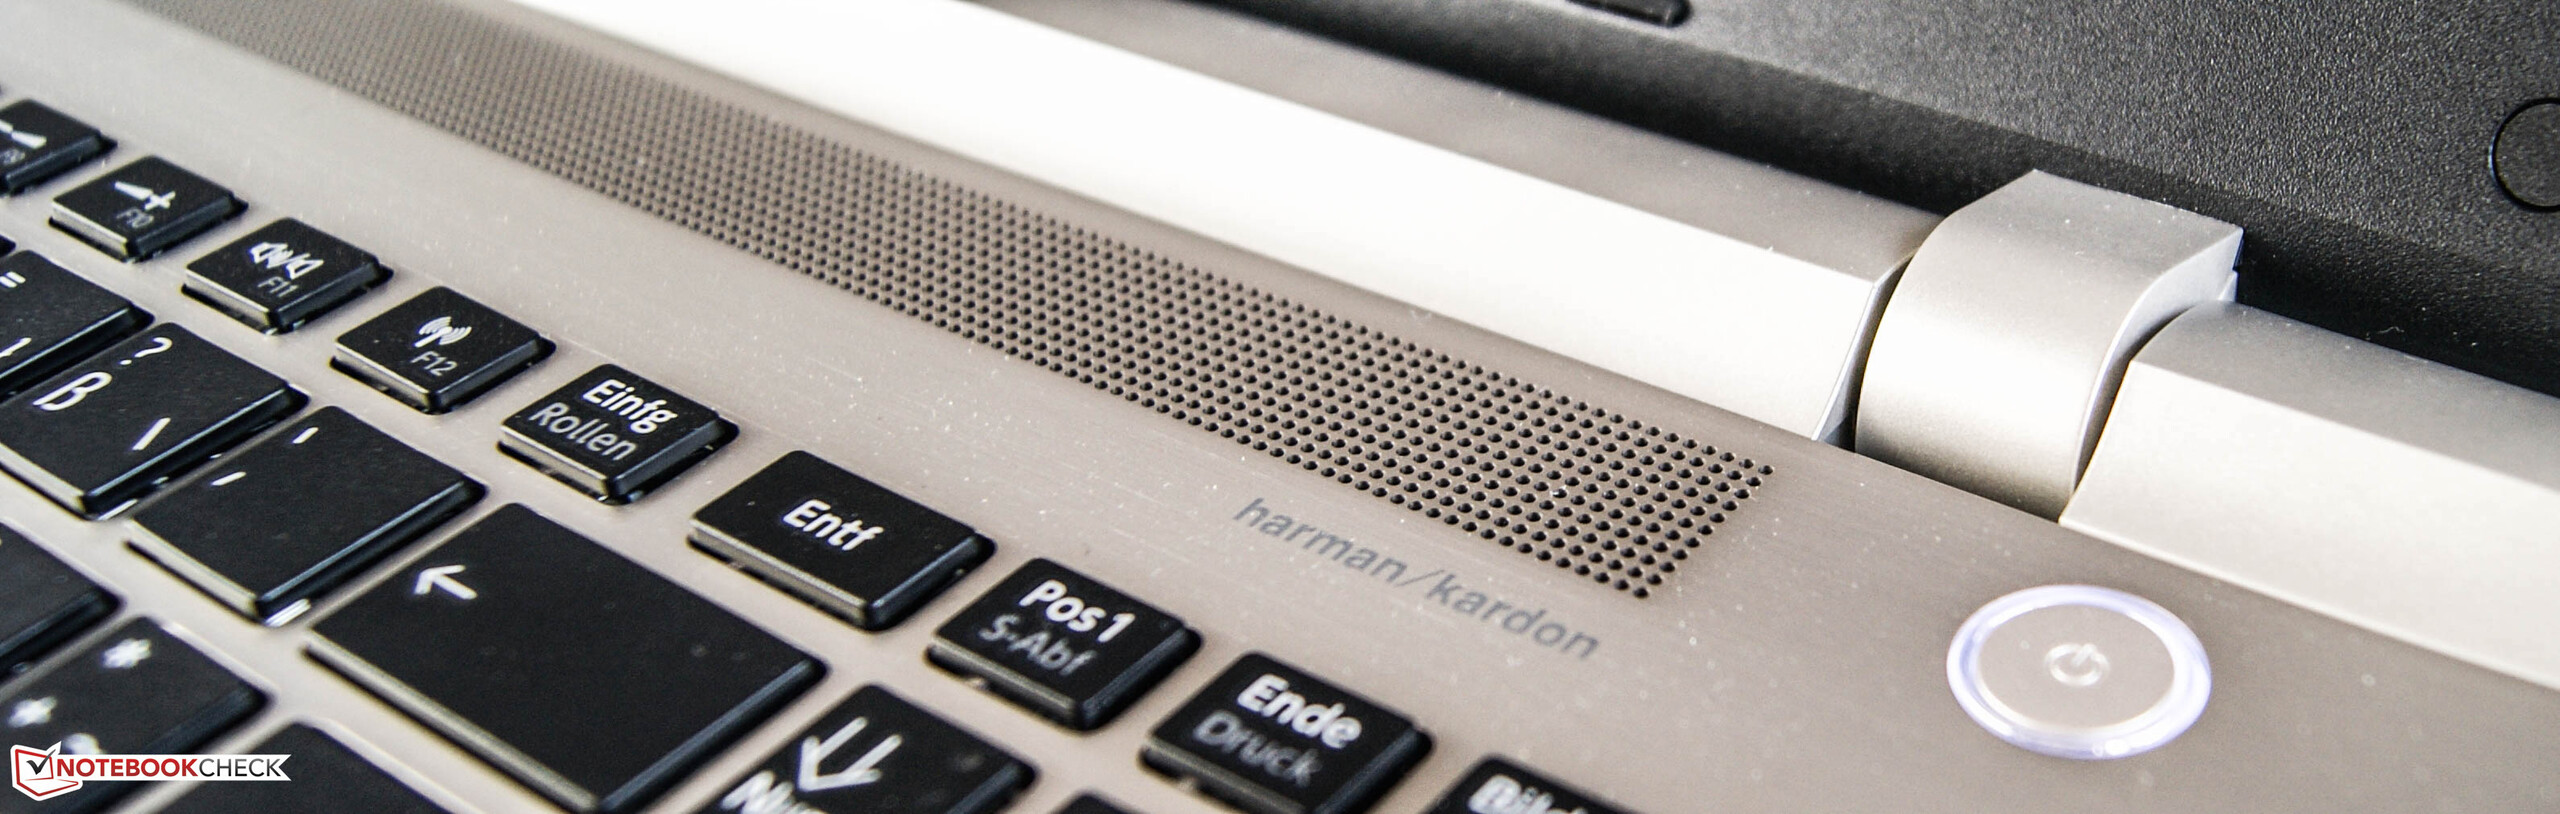
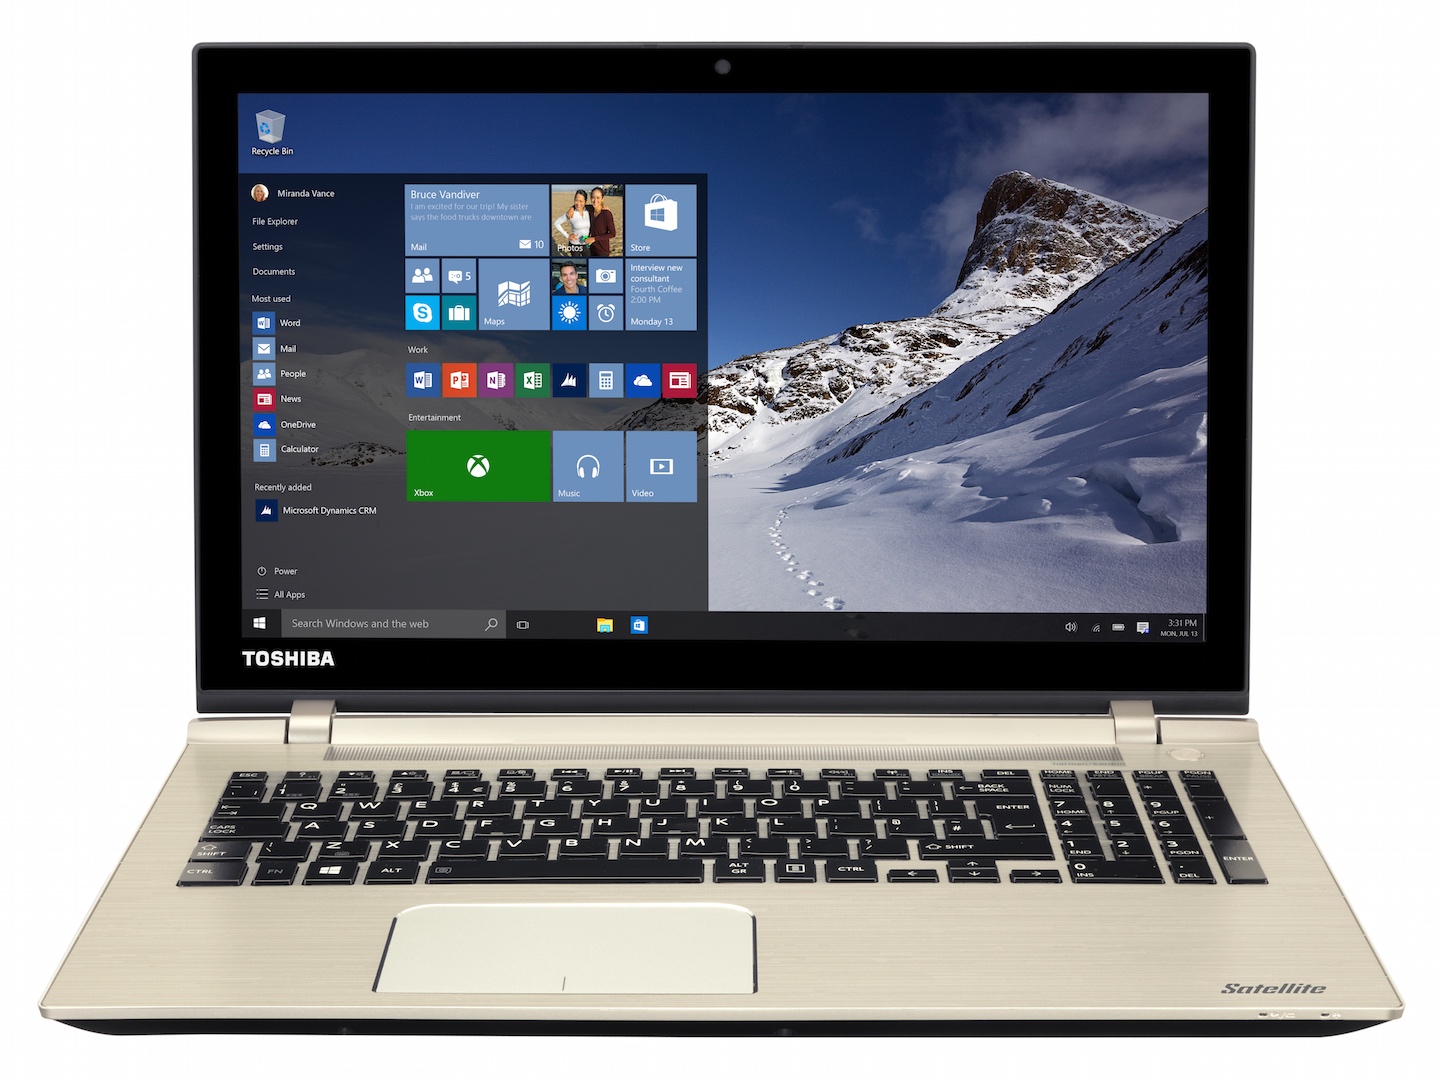
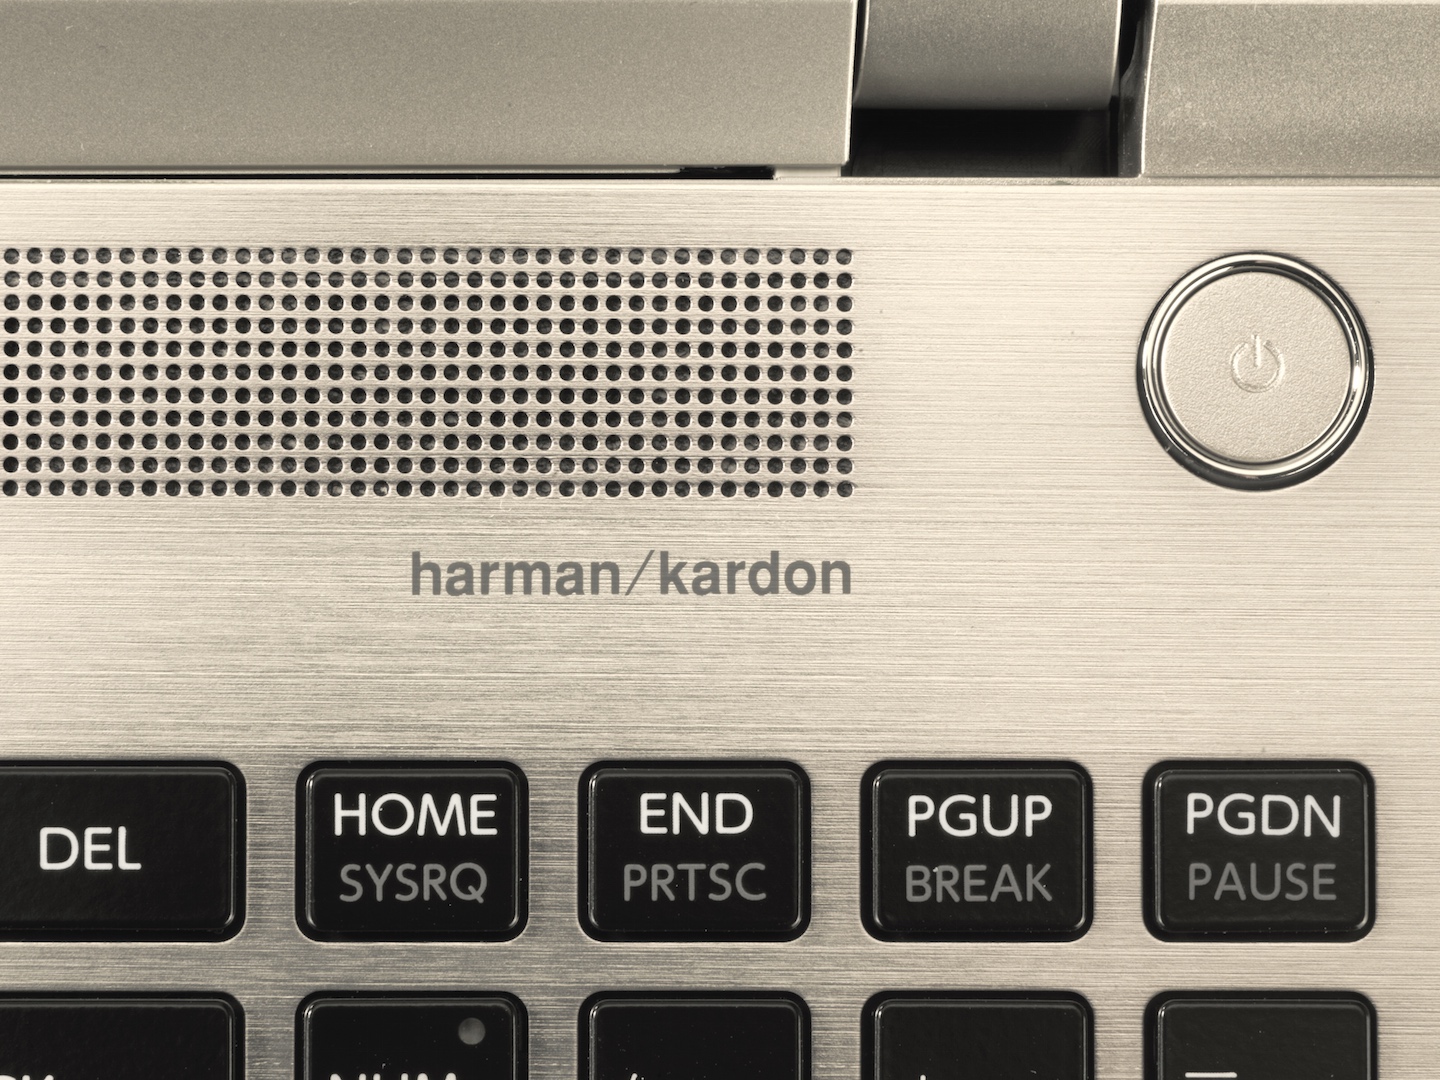
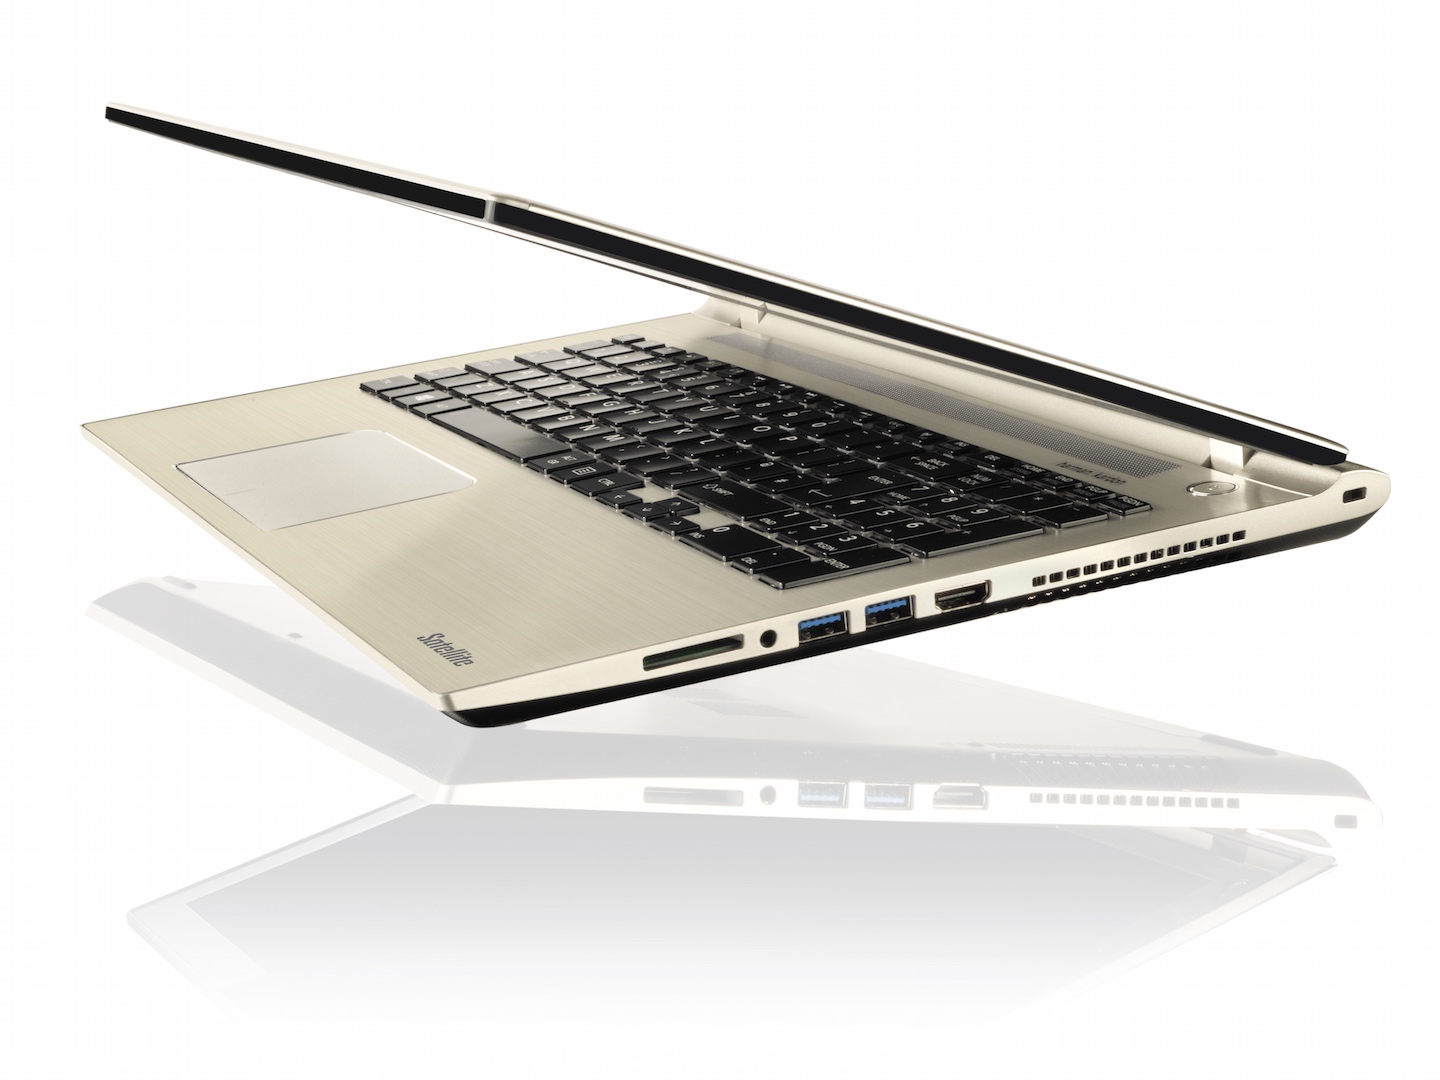
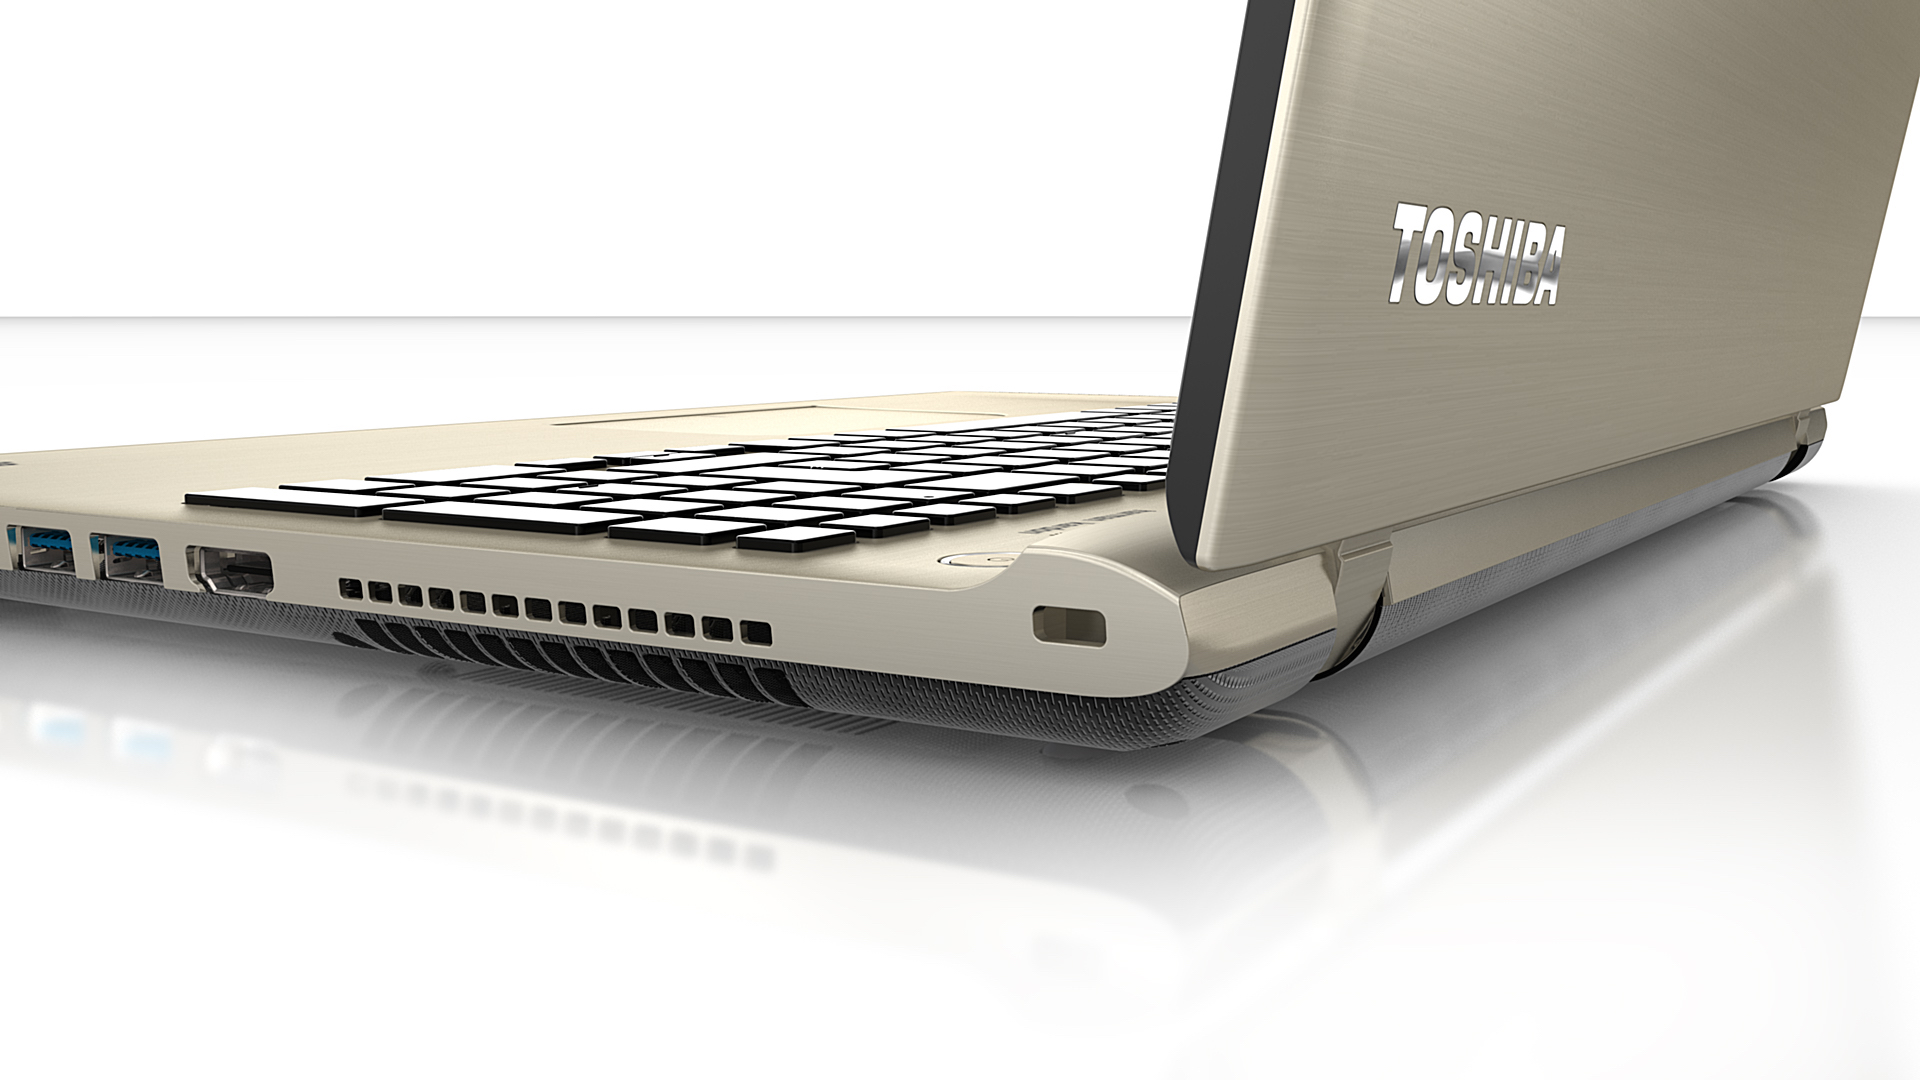
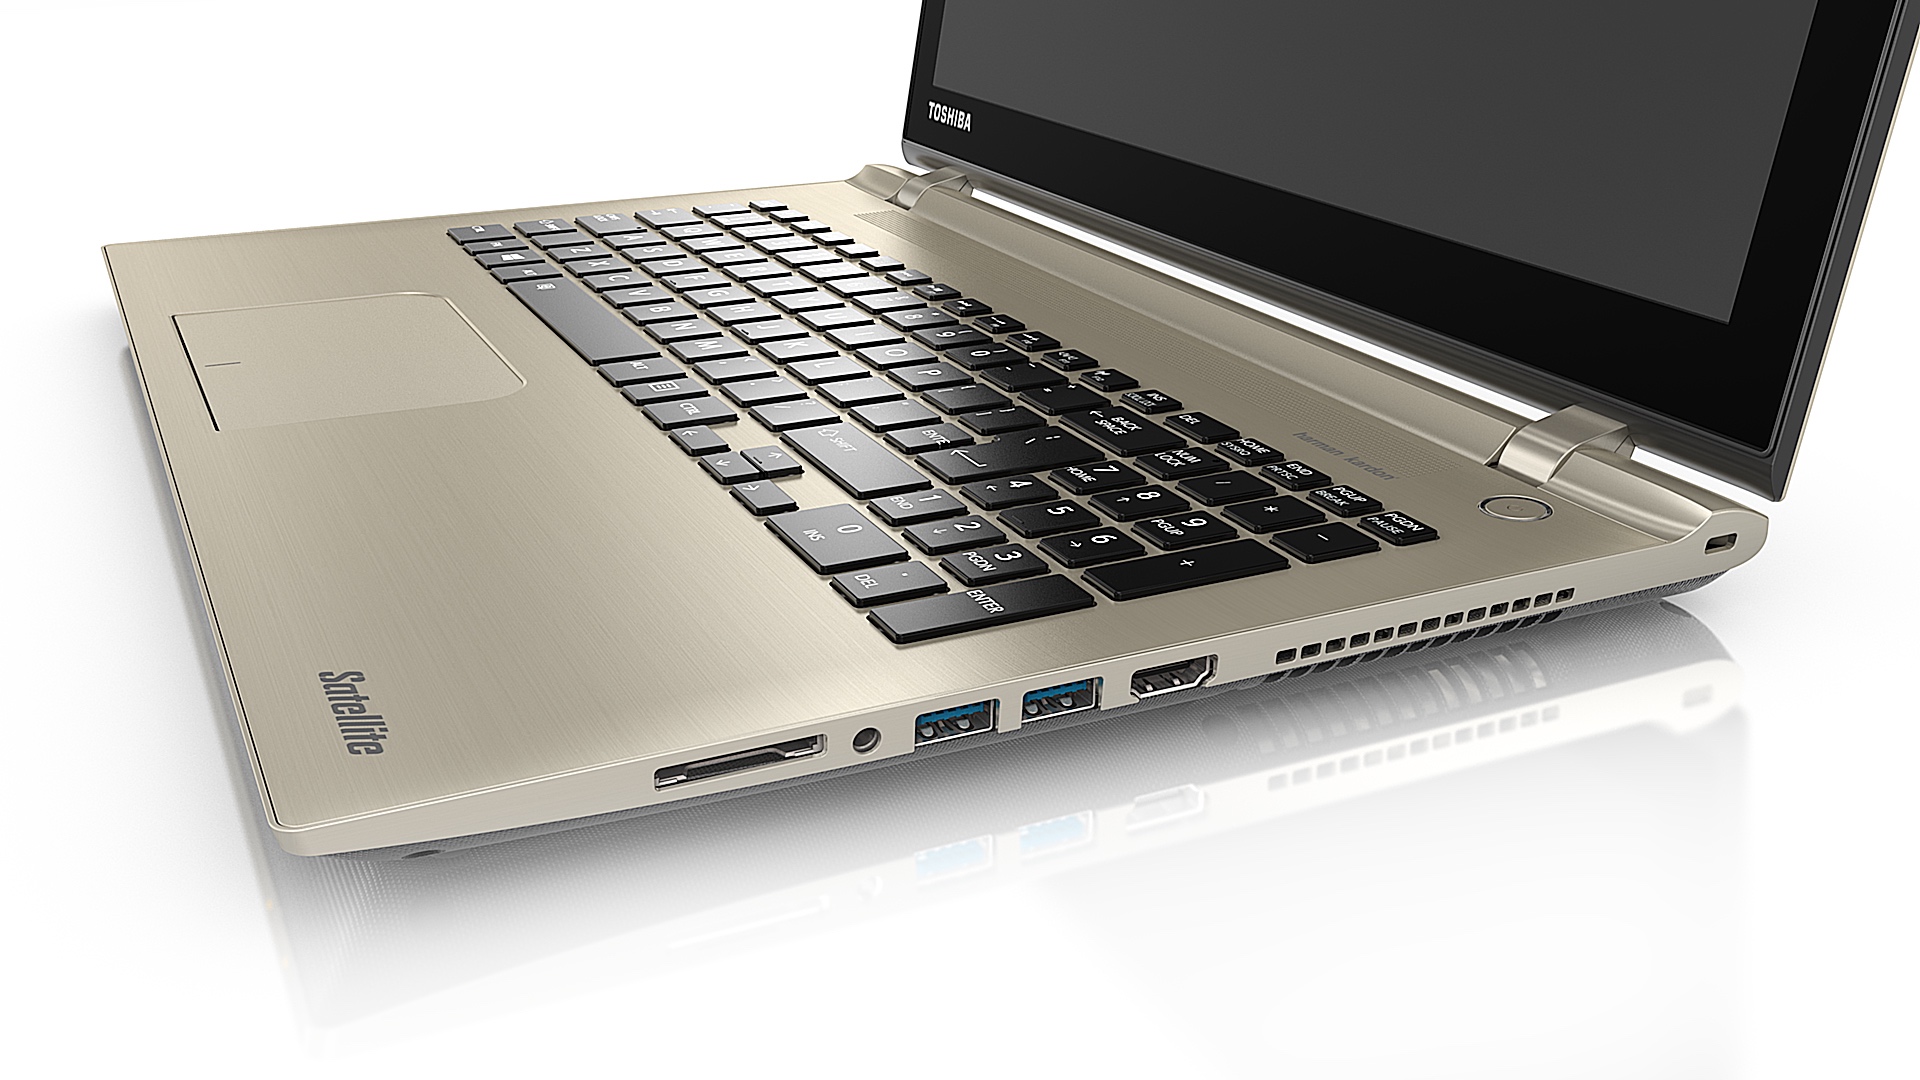
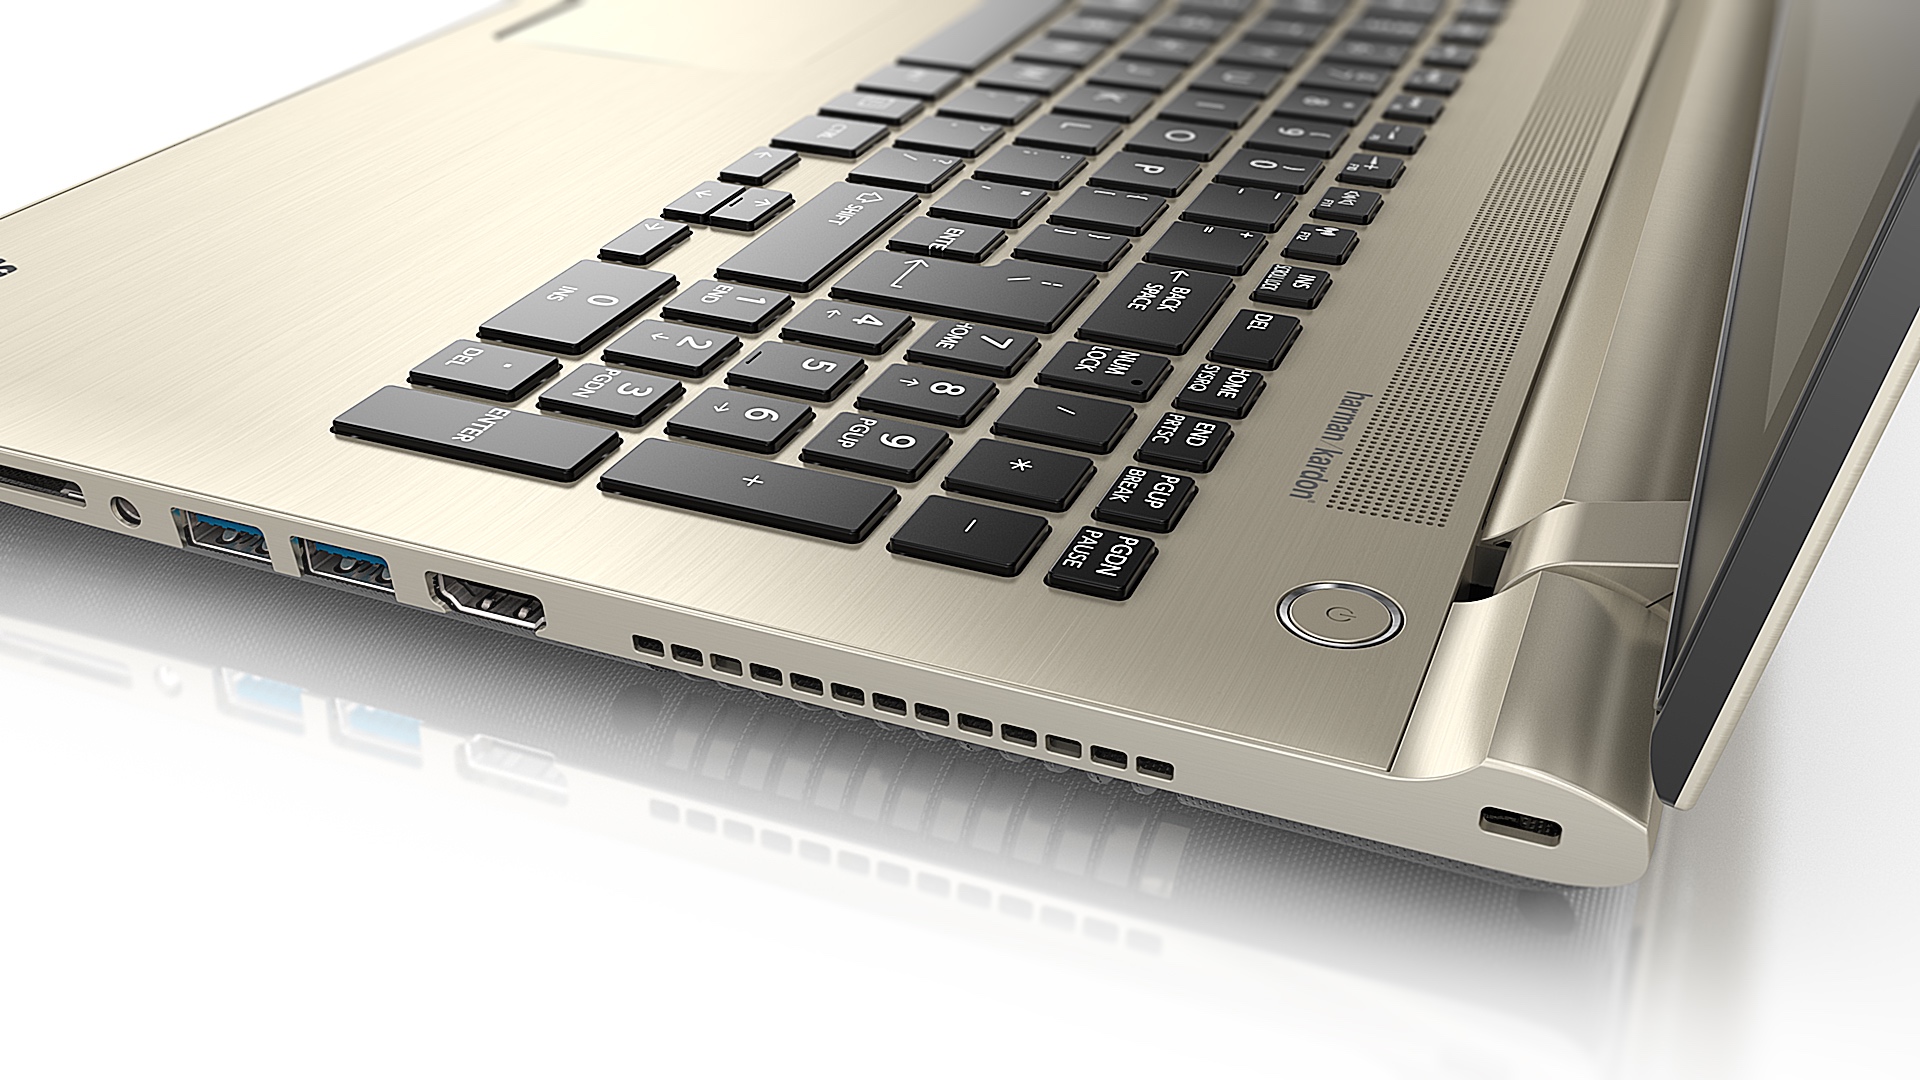
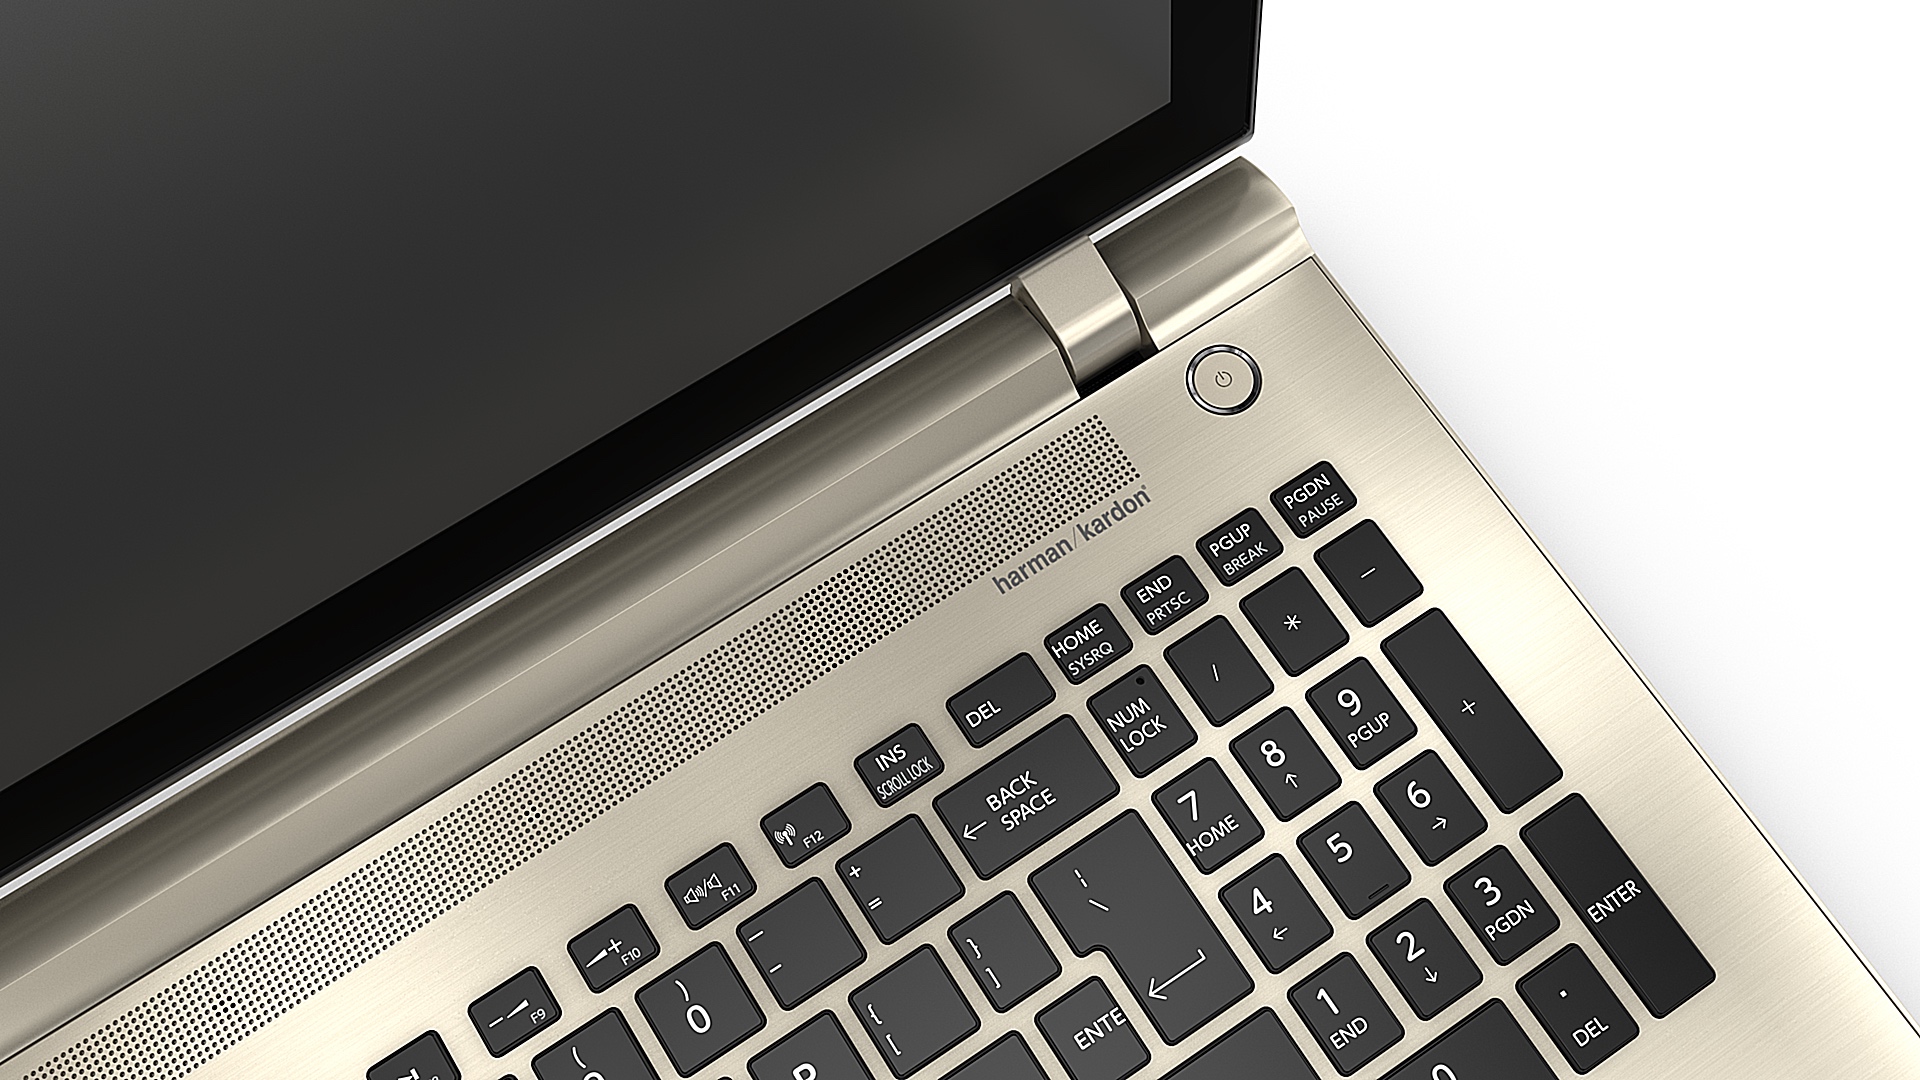
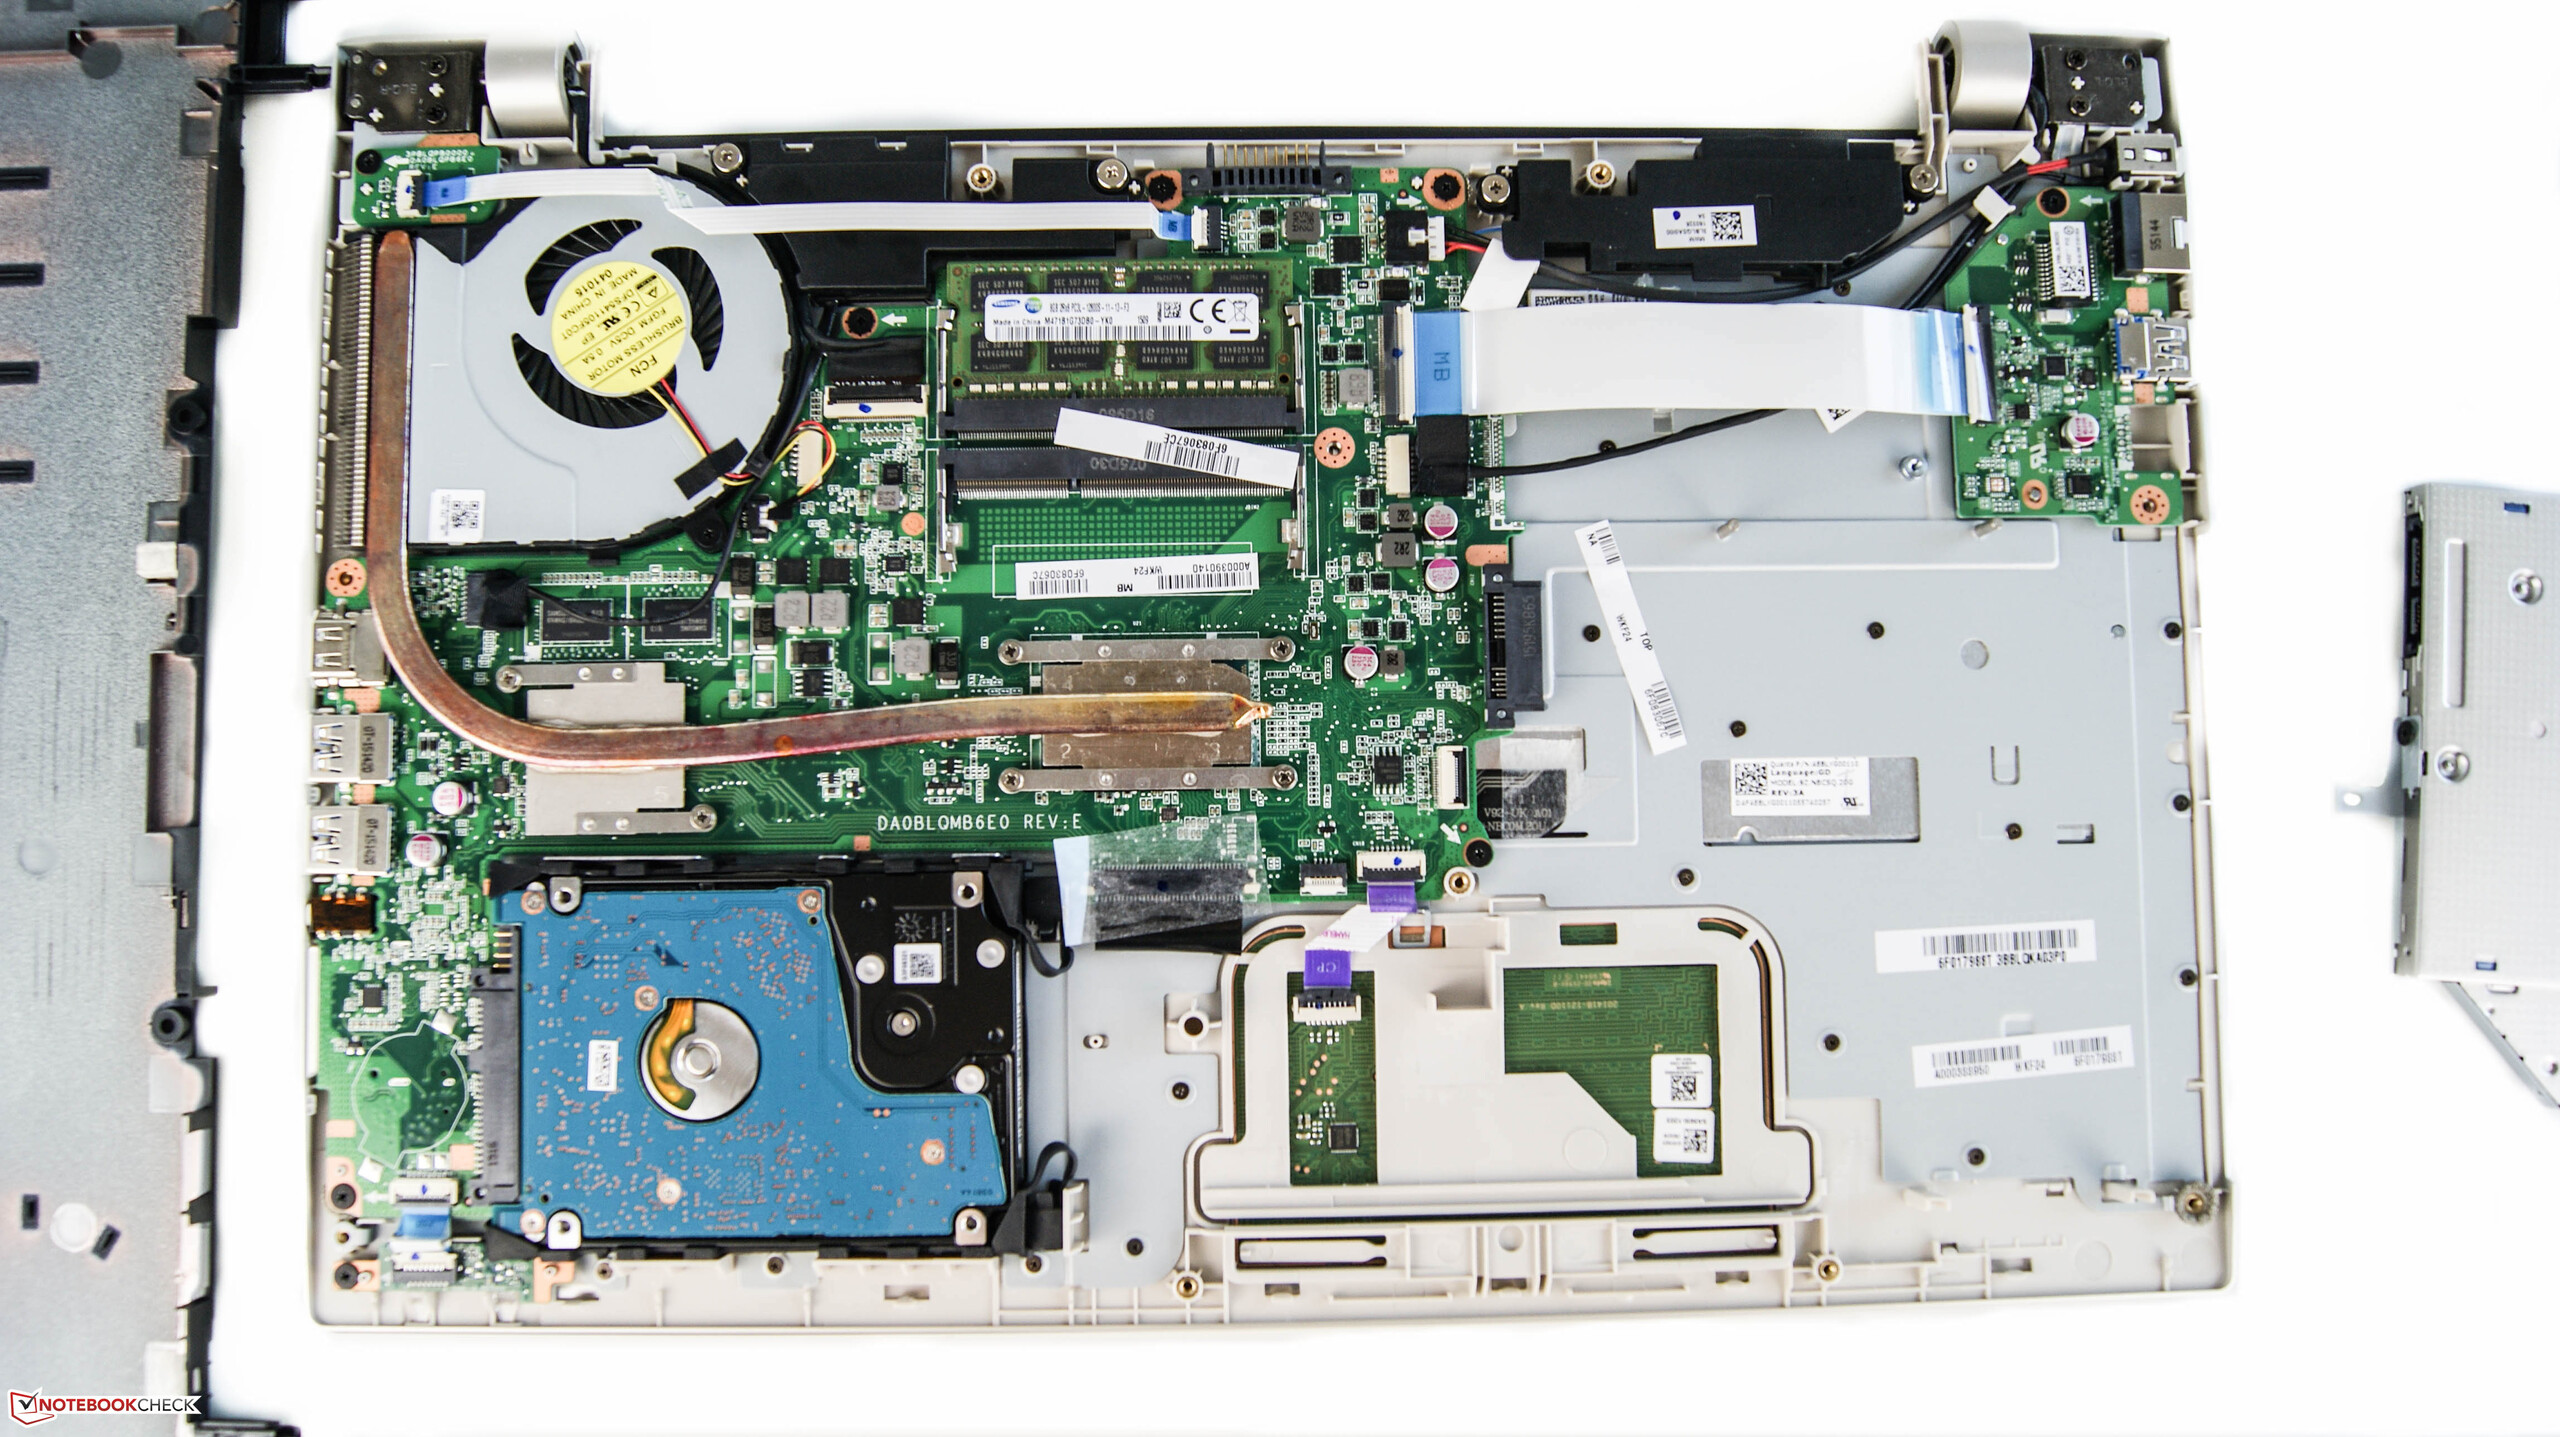
东芝Satellite P50在多媒体设备范围内表现出了强大的潜能。生产商为这款售价1250欧元(约9005人民币)的全功能机型配备了雅致的机身,不过它也有一些缺点。尽管维护升级需要拧下不少螺钉,它可升级的空间却十分大。它配备的输入设备表现十分让人满意。键盘在压力感应上和几个按键的响应上有一些小问题。它采用的全高清屏幕十分全面。不过在使用电池时屏幕亮度下降,以及镜面的反光这两点对使用有些不利影响。它的性能十分充足。散热的控制略微有些问题,在高负载下会有过热降频的问题。除此之外,电池的续航时间也是移动使用的关键所在。它在这方面的表现比较一般,我们的测试机没能坚持一天的工作时间。
尽管东芝Satellite P50并没有特别抢眼,但坚实可靠的表现让它成为了一款全面的产品。
需要更高(游戏)性能的用户可以参考例如微星的PE60或者我们的多媒体笔记本电脑排行榜。
注:本文是基于完整评测的缩减版本,阅读完整的英文评测,请点击这里。
Toshiba Satellite P50-C-10G
-
08/07/2015 v4(old)
Nino Ricchizzi
Multimedia - Weighted Average