 Deutsch
 English
 Español
 Français
 Italiano
 Nederlands
 Polski
 Português
 Русский
 Türkçe
 Svenska
 Chinese
 Magyar
戴尔 Latitude 11 5175 平板电脑简短评测
| |||||||||||||||||||||||||
Brightness Distribution: 86 %
Center on Battery: 461 cd/m²
Contrast: 1027:1 (Black: 0.45 cd/m²)
ΔE Color 4.4 | 0.5-29.43 Ø5
ΔE Greyscale 3.49 | 0.57-98 Ø5.3
80.76% sRGB (Argyll 1.6.3 3D)
53.21% AdobeRGB 1998 (Argyll 1.6.3 3D)
59.3% AdobeRGB 1998 (Argyll 2.2.0 3D)
81.1% sRGB (Argyll 2.2.0 3D)
63.4% Display P3 (Argyll 2.2.0 3D)
Gamma: 2.55
| Dell Latitude 11 5175 HD Graphics 515, 6Y57, Samsung PM871 MZYLN256HCHP | Microsoft Surface Pro 4, Core m3 HD Graphics 515, 6Y30, Samsung MZFLV128 NVMe | HP Elite x2 1011 G1 HD Graphics 5300, 5Y51, Samsung SSD PM851 256 GB MZNTE256HMHP | HP Elite x2 1012 G1 HD Graphics 515, 6Y54, Liteon L8H-256V2G | Lenovo ThinkPad Helix 2 HD Graphics 5300, 5Y71, Toshiba THNSFJ256GDNU 256 GB | HP Spectre x2 12-a003ng K3D42EA HD Graphics 515, 6Y75, Sandisk X300 SD7SN6S-256G-1006 | |
|---|---|---|---|---|---|---|
| Display | 14% | -24% | -11% | -13% | ||
| Display P3 Coverage | 63.4 | 67.5 6% | 44.4 -30% | 53.8 -15% | 52.9 -17% | |
| sRGB Coverage | 81.1 | 96.6 19% | 66.4 -18% | 73.7 -9% | 71.8 -11% | |
| AdobeRGB 1998 Coverage | 59.3 | 69 16% | 45.91 -23% | 53.8 -9% | 52.6 -11% | |
| Response Times | -31% | 20% | -1% | |||
| Response Time Grey 50% / Grey 80% * | 46 ? | 46 ? -0% | 33.2 ? 28% | 47 ? -2% | ||
| Response Time Black / White * | 26 ? | 31 ? -19% | 22.8 ? 12% | 26 ? -0% | ||
| PWM Frequency | 200 | 50 ? -75% | ||||
| Screen | 12% | -31% | -21% | 2% | -23% | |
| Brightness middle | 462 | 389.2 -16% | 364 -21% | 322 -30% | 365 -21% | 353 -24% |
| Brightness | 449 | 392 -13% | 331 -26% | 319 -29% | 342 -24% | 347 -23% |
| Brightness Distribution | 86 | 92 7% | 84 -2% | 97 13% | 86 0% | 91 6% |
| Black Level * | 0.45 | 0.27 40% | 0.44 2% | 0.42 7% | 0.329 27% | 0.44 2% |
| Contrast | 1027 | 1441 40% | 827 -19% | 767 -25% | 1109 8% | 802 -22% |
| Colorchecker dE 2000 * | 4.4 | 3.61 18% | 7.32 -66% | 6.02 -37% | 4.37 1% | 6.09 -38% |
| Colorchecker dE 2000 max. * | 9.21 | 10.06 -9% | ||||
| Greyscale dE 2000 * | 3.49 | 3.8 -9% | 7.37 -111% | 6.29 -80% | 2.8 20% | 6.24 -79% |
| Gamma | 2.55 86% | 2.16 102% | 2.03 108% | 2.4 92% | 2.3 96% | 2.41 91% |
| CCT | 6256 104% | 5969 109% | 6479 100% | 7712 84% | 6595 99% | 7238 90% |
| Color Space (Percent of AdobeRGB 1998) | 53.21 | 63 18% | 42.2 -21% | 47.8 -10% | 46 -14% | |
| Color Space (Percent of sRGB) | 80.76 | 97 20% | 66.1 -18% | 73.2 -9% | 71 -12% | |
| Total Average (Program / Settings) | -2% /
3% | -28% /
-29% | -4% /
-13% | 2% /
2% | -12% /
-18% |
* ... smaller is better
Display Response Times
| ↔ Response Time Black to White | ||
|---|---|---|
| 26 ms ... rise ↗ and fall ↘ combined | ↗ 7.2 ms rise | 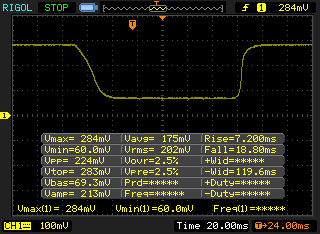 |
| ↘ 18.8 ms fall | ||
| The screen shows relatively slow response rates in our tests and may be too slow for gamers. In comparison, all tested devices range from 0.1 (minimum) to 240 (maximum) ms. » 57 % of all devices are better. This means that the measured response time is worse than the average of all tested devices (21.5 ms). | ||
| ↔ Response Time 50% Grey to 80% Grey | ||
| 46 ms ... rise ↗ and fall ↘ combined | ↗ 19 ms rise | 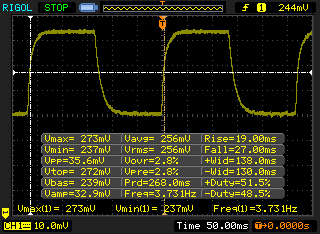 |
| ↘ 27 ms fall | ||
| The screen shows slow response rates in our tests and will be unsatisfactory for gamers. In comparison, all tested devices range from 0.2 (minimum) to 636 (maximum) ms. » 76 % of all devices are better. This means that the measured response time is worse than the average of all tested devices (33.7 ms). | ||
Screen Flickering / PWM (Pulse-Width Modulation)
| Screen flickering / PWM detected | 200 Hz | 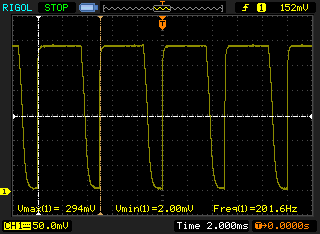 | |
The display backlight flickers at 200 Hz (worst case, e.g., utilizing PWM) . The frequency of 200 Hz is relatively low, so sensitive users will likely notice flickering and experience eyestrain at the stated brightness setting and below. In comparison: 53 % of all tested devices do not use PWM to dim the display. If PWM was detected, an average of 17903 (minimum: 5 - maximum: 3846000) Hz was measured. | |||
| Cinebench R10 | |
| Rendering Multiple CPUs 64Bit (sort by value) | |
| Dell Latitude 11 5175 | |
| Microsoft Surface Pro 4, Core m3 | |
| Lenovo ThinkPad Helix 2 | |
| HP Spectre x2 12-a003ng K3D42EA | |
| Rendering Single CPUs 64Bit (sort by value) | |
| Dell Latitude 11 5175 | |
| Microsoft Surface Pro 4, Core m3 | |
| Lenovo ThinkPad Helix 2 | |
| HP Spectre x2 12-a003ng K3D42EA | |
| PCMark 7 Score | 4289 points | |
| PCMark 8 Home Score Accelerated v2 | 2641 points | |
| PCMark 8 Creative Score Accelerated v2 | 2905 points | |
| PCMark 8 Work Score Accelerated v2 | 3720 points | |
Help | ||

| 3DMark 11 Performance | 951 points | |
| 3DMark Ice Storm Standard Score | 35822 points | |
| 3DMark Cloud Gate Standard Score | 3748 points | |
| 3DMark Fire Strike Score | 545 points | |
| 3DMark Fire Strike Extreme Score | 274 points | |
Help | ||
| low | med. | high | ultra | |
| BioShock Infinite (2013) | 32.99 | 17.76 | 15.32 | 4.39 |
| Battlefield 4 (2013) | 22.56 | 15.23 | 9.69 | 5.64 |
| Rise of the Tomb Raider (2016) | 7.96 | 5.18 |
(±) The maximum temperature on the upper side is 44.1 °C / 111 F, compared to the average of 33.8 °C / 93 F, ranging from 20.7 to 53.2 °C for the class Tablet.
(±) The bottom heats up to a maximum of 43.3 °C / 110 F, compared to the average of 33.3 °C / 92 F
(+) In idle usage, the average temperature for the upper side is 29.3 °C / 85 F, compared to the device average of 30 °C / 86 F.
| Dell Latitude 11 5175 HD Graphics 515, 6Y57, Samsung PM871 MZYLN256HCHP | HP Elite x2 1011 G1 HD Graphics 5300, 5Y51, Samsung SSD PM851 256 GB MZNTE256HMHP | HP Elite x2 1012 G1 HD Graphics 515, 6Y54, Liteon L8H-256V2G | Lenovo ThinkPad Helix 2 HD Graphics 5300, 5Y71, Toshiba THNSFJ256GDNU 256 GB | HP Spectre x2 12-a003ng K3D42EA HD Graphics 515, 6Y75, Sandisk X300 SD7SN6S-256G-1006 | |
|---|---|---|---|---|---|
| Power Consumption | 21% | -46% | -15% | -37% | |
| Idle Minimum * | 2.7 | 1.5 44% | 3.7 -37% | 2 26% | 4.5 -67% |
| Idle Average * | 5.8 | 4 31% | 6.8 -17% | 6 -3% | 7.7 -33% |
| Idle Maximum * | 6.6 | 5 24% | 7.6 -15% | 6.6 -0% | 8.3 -26% |
| Load Average * | 15.2 | 13.9 9% | 22.5 -48% | 17.6 -16% | 19.8 -30% |
| Load Maximum * | 16.1 | 16.9 -5% | 34.5 -114% | 29.7 -84% | 20.6 -28% |
* ... smaller is better
| Off / Standby | |
| Idle | |
| Load |
|
| Dell Latitude 11 5175 35 Wh | Microsoft Surface Pro 4, Core m3 38 Wh | HP Elite x2 1011 G1 54 Wh | HP Elite x2 1012 G1 37 Wh | Lenovo ThinkPad Helix 2 35 Wh | HP Spectre x2 12-a003ng K3D42EA 42 Wh | |
|---|---|---|---|---|---|---|
| Battery Runtime | -2% | 55% | -6% | 8% | 1% | |
| Reader / Idle | 793 | 791 0% | 1063 34% | 732 -8% | 964 22% | 954 20% |
| H.264 | 411 | 658 60% | 432 5% | 360 -12% | ||
| WiFi v1.3 | 426 | 488 15% | 675 58% | 443 4% | 361 -15% | |
| Load | 172 | 138 -20% | 288 67% | 130 -24% | 197 15% | 166 -3% |
| WiFi | 396 |
Pros
Cons
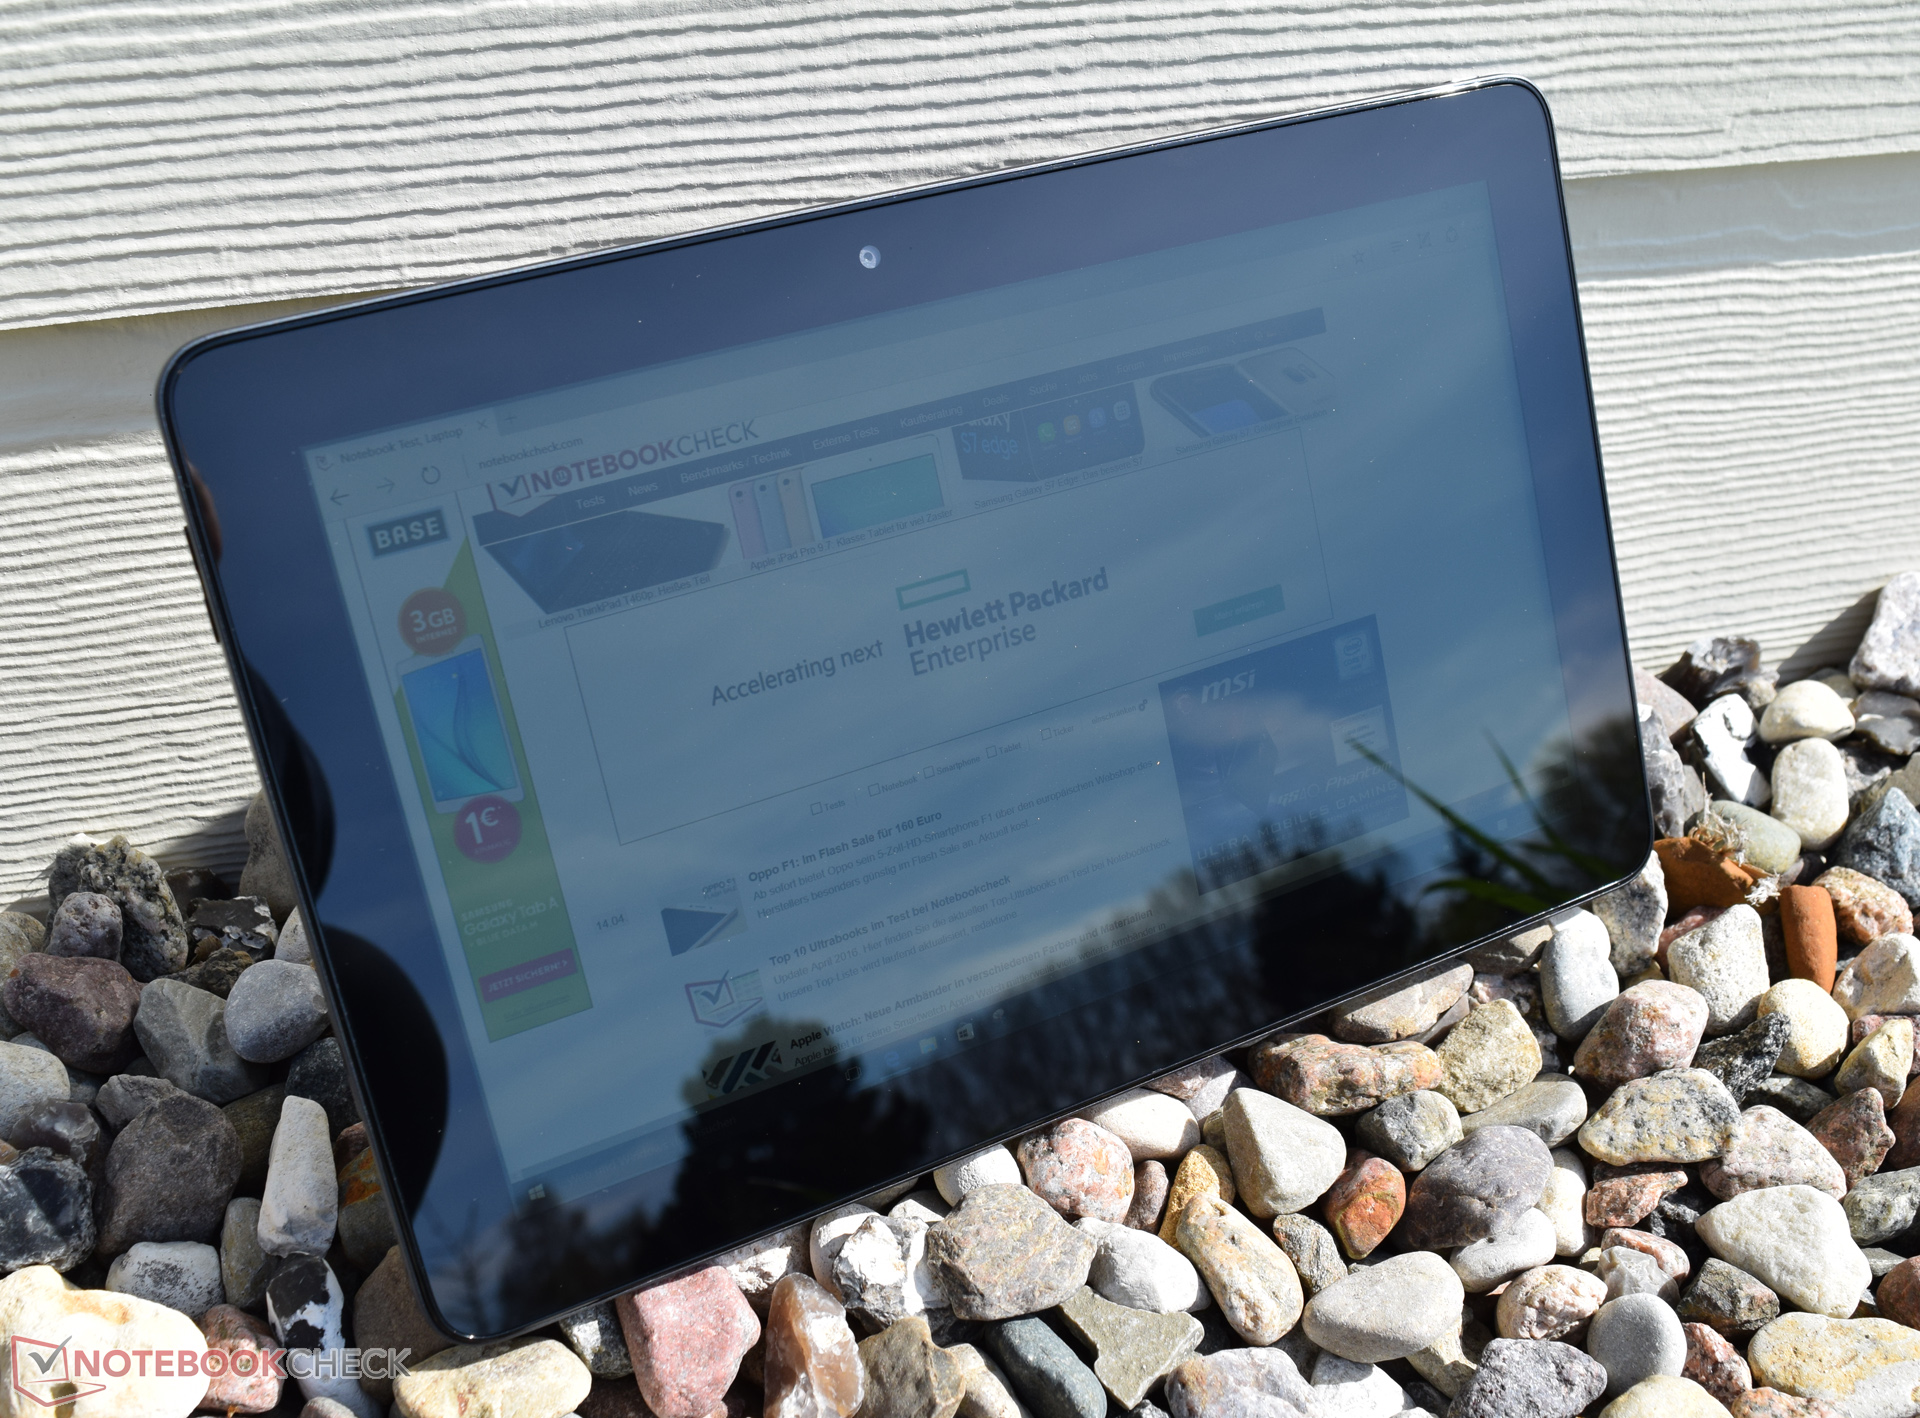
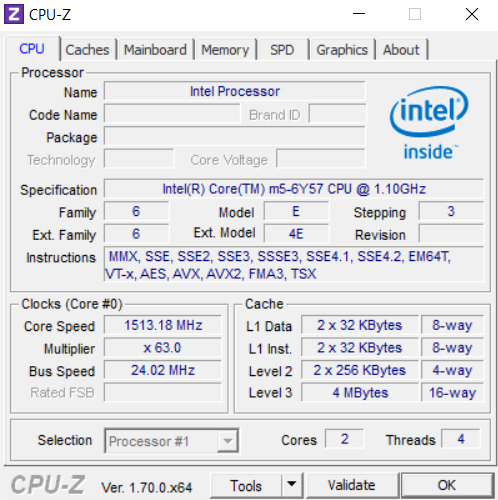
戴尔的Latitude 11 5175是一台设计简洁的优良商务平板电脑。英特尔酷睿m5-6Y57处理器可以为日常办公提供足够的性能。低功耗让它可以使用被动散热。搭配的256 GB固态硬盘的优秀读取写入速度保证了系统运行的流畅。全高清触控屏幕提供了非常优秀的亮度,可以适合户外阳光下使用。它的触控功能响应准确迅速。同时,IPS屏幕面板的出色可视角度稳定性也让人无可挑剔。它的另外一个优势是优秀的电池续航时间,可以保证长时间的移动使用。
这台平板电脑是不错的入门商务设备。不过,如果想要得到最高的工作效率,用户无法避免需要考虑戴尔为11 5175设计的配件。键盘底座可以说是必不可少的额外消费。
戴尔Latitude 11 5175也有一些让我们难以满意的地方。它的处理器性能无法完全得到发挥。因此它的性能表现难免会打折扣。搭配酷睿m3的微软Surface Pro 4相比性能更高。它的屏幕由于色域覆盖一般也很难满足专业用户的需要。
感兴趣的用户可以参考我们列出的戴尔Latitude 11 5175的优缺点。可以接受色彩一般的1080p屏幕的用户完全可以把它加入收藏夹。同时它的处理器性能尽管受到了一定限制,仍然可以满足办公的需要。几乎没有任何一台平板电脑可以长时间持续利用酷睿m处理器的潜能。
注:本文是基于完整评测的缩减版本,阅读完整的英文评测,请点击这里。
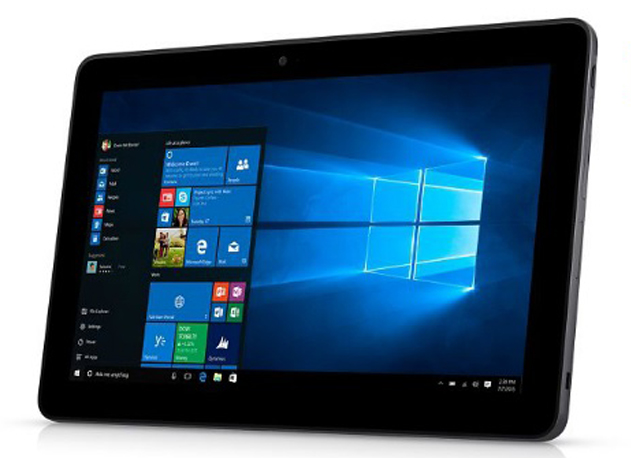
Dell Latitude 11 5175
-
04/19/2016 v5.1(old)
Sebastian Bade