 Deutsch
 English
 Español
 Français
 Italiano
 Nederlands
 Polski
 Português
 Русский
 Türkçe
 Svenska
 Chinese
 Magyar
酷比魔方 i7 Book CDK09 变形本简短评测

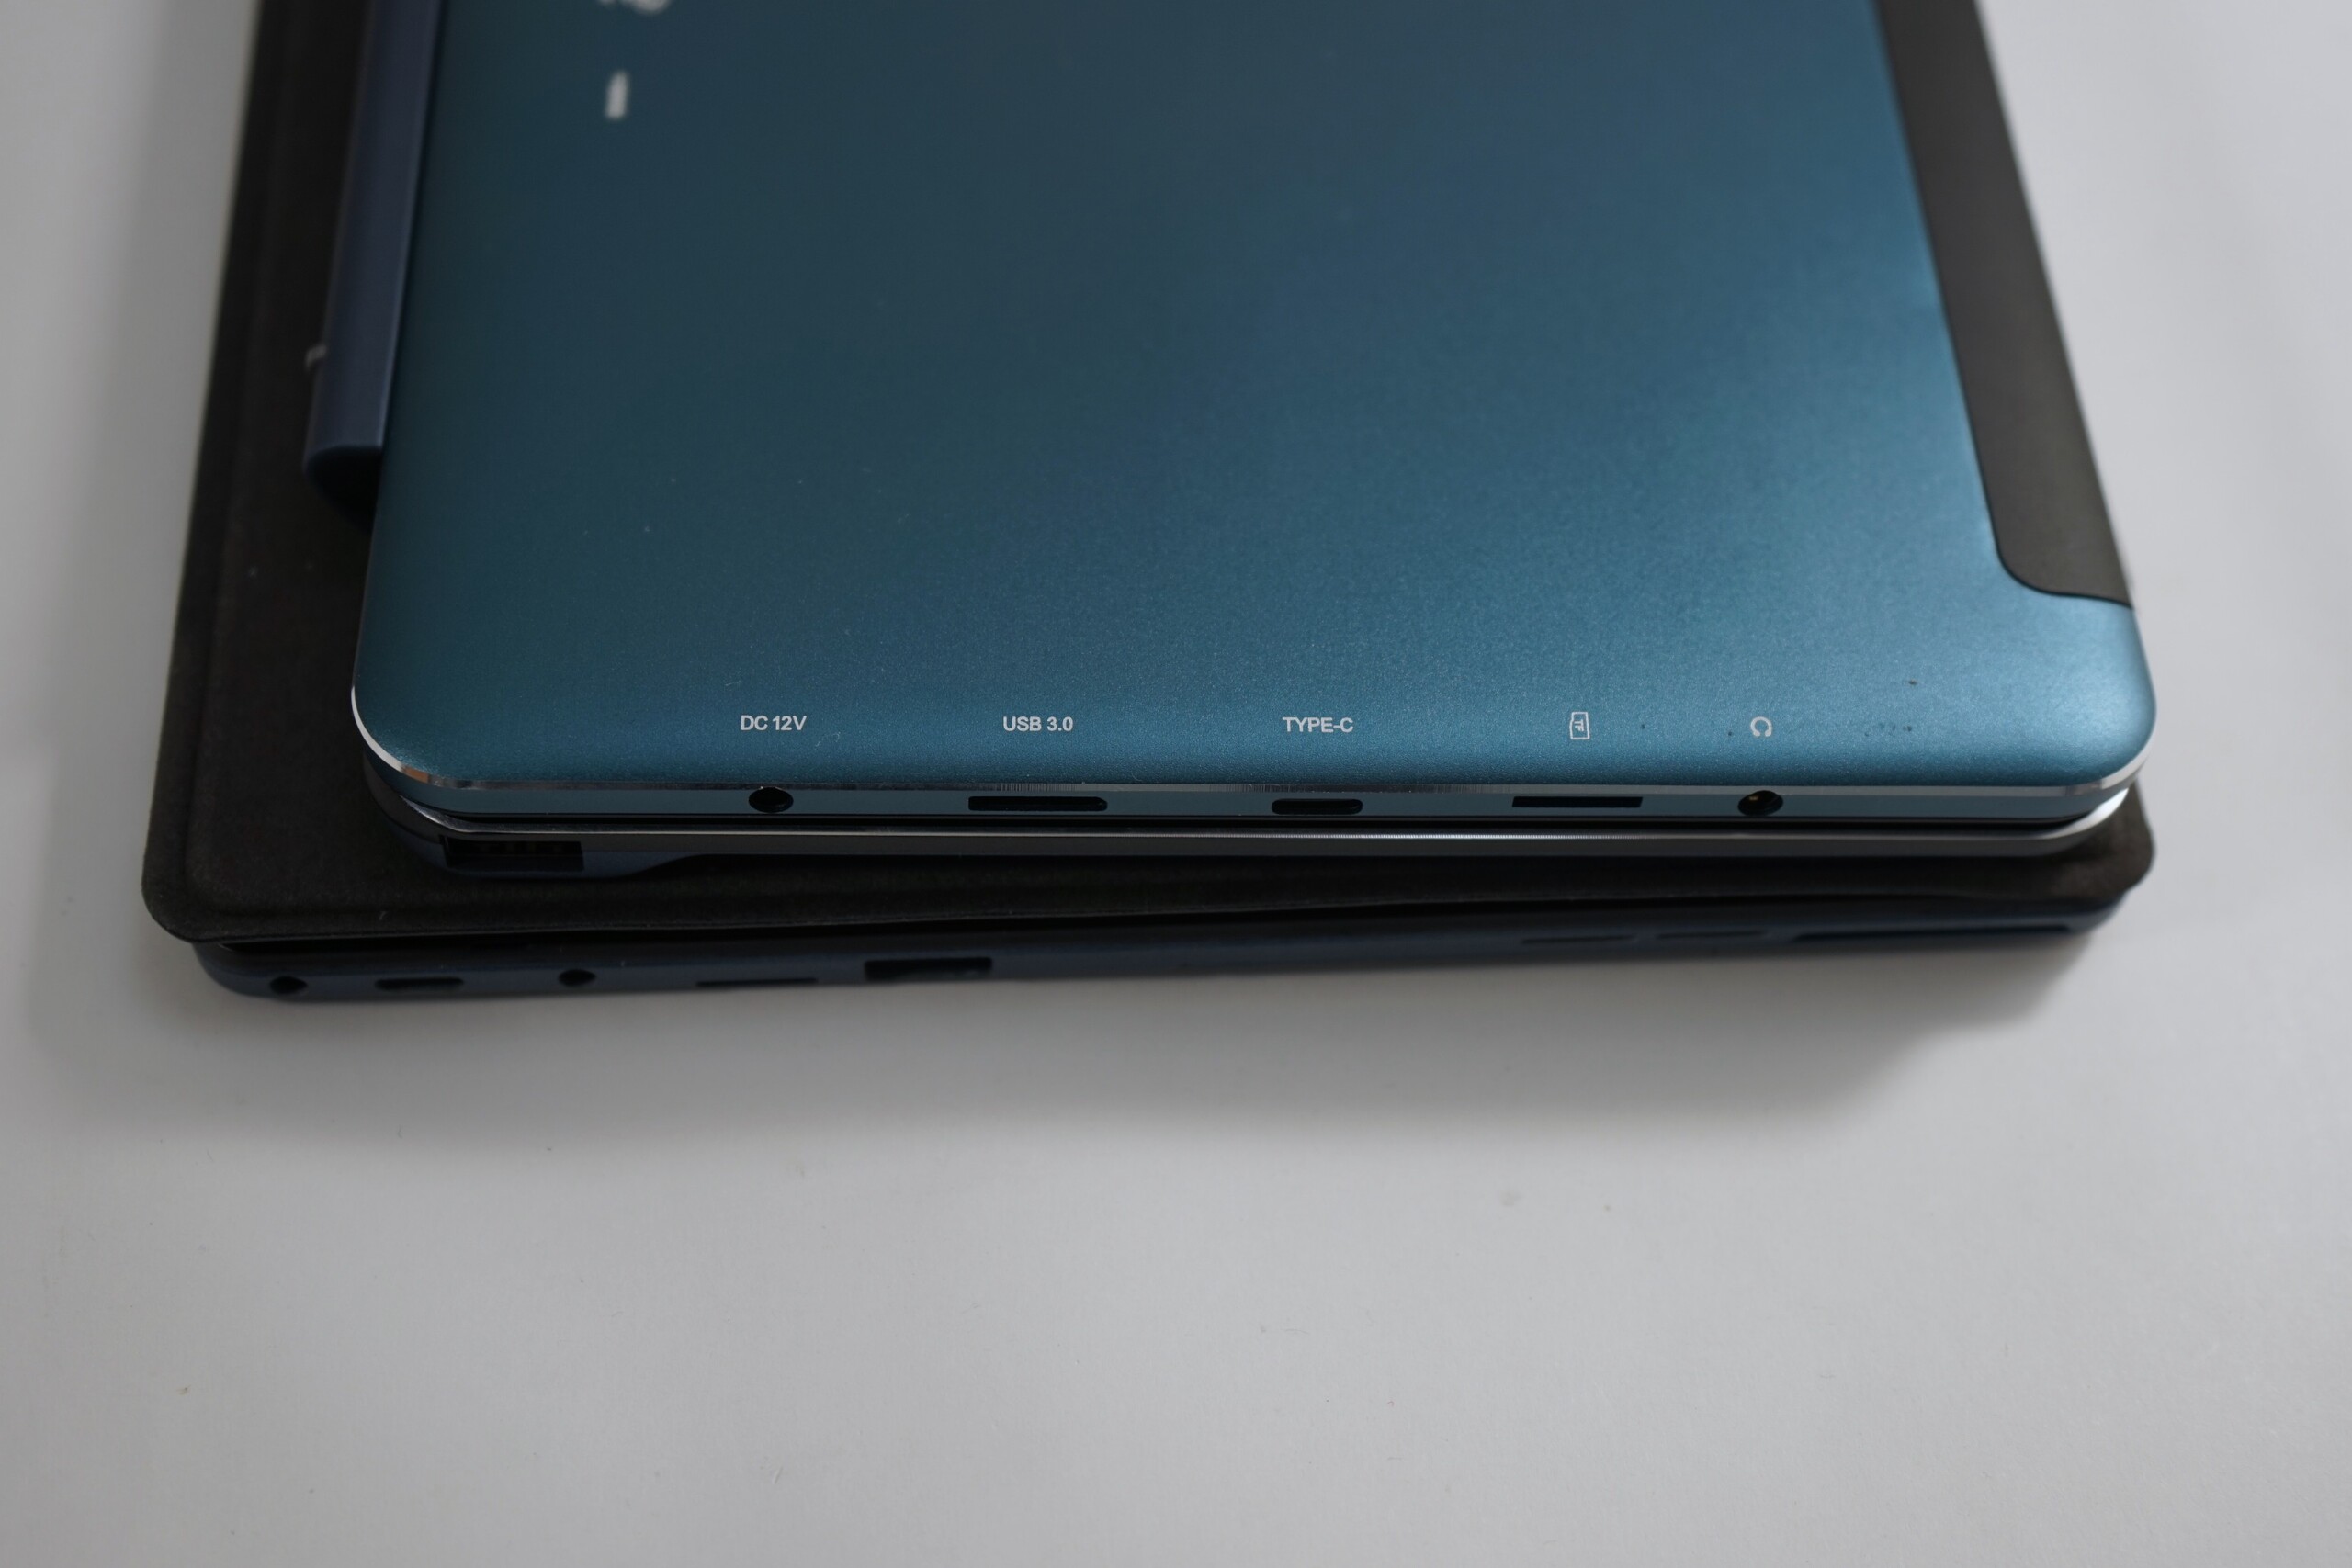
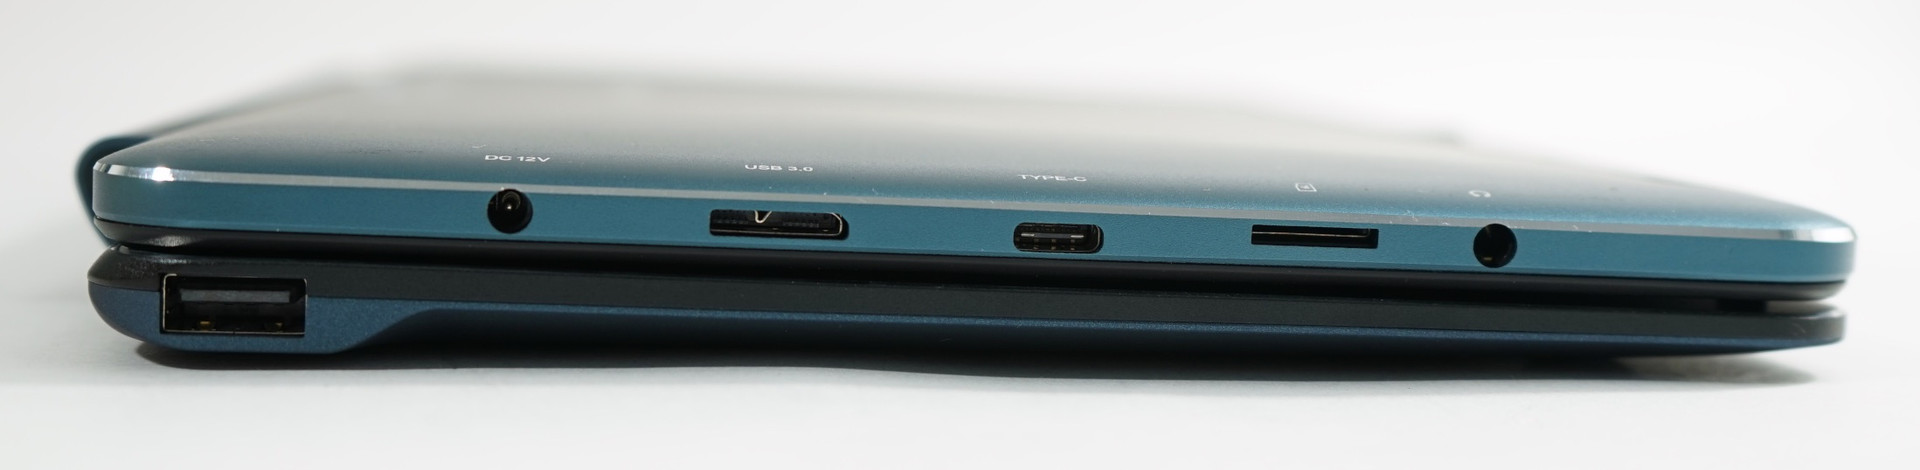
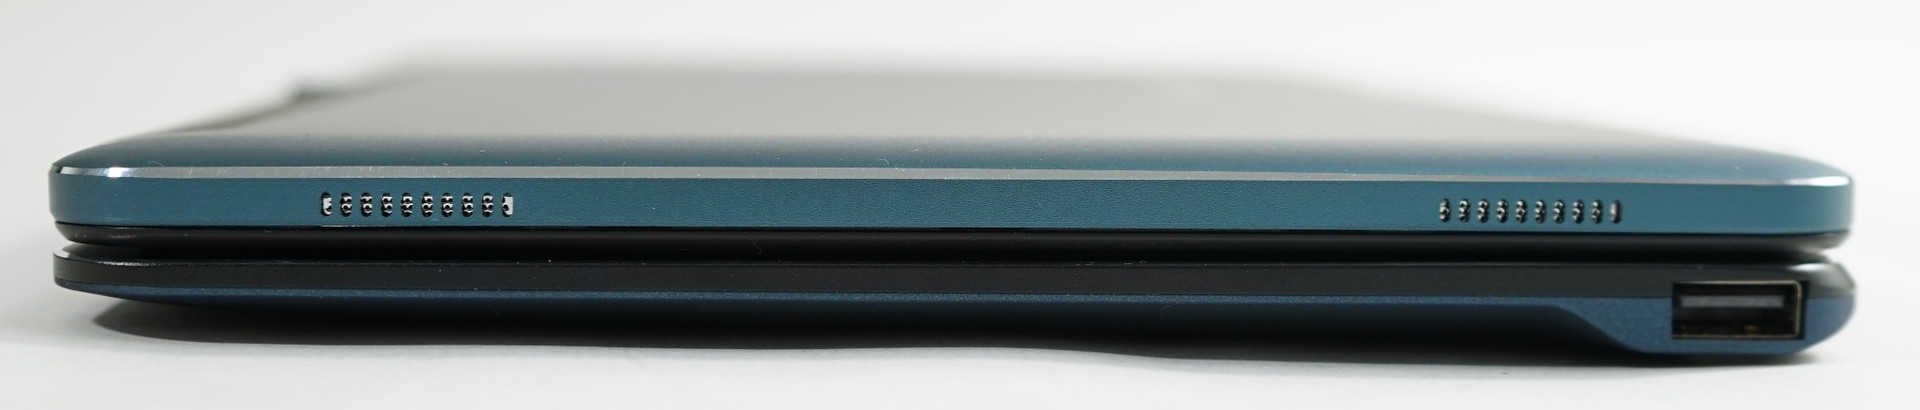
Connectivity
| SD Card Reader | |
| maximum SDCardreader Maximum Transfer Rate | |
| average SDCardreader Average Transfer Rate |
| Networking | |
| Cube i7 Book CDK09 | |
| iperf3 transmit AX12 |
|
| iperf3 receive AX12 |
|
| MSI CX61 2QC 2970M MS-16GD | |
| iperf3 transmit AX12 |
|
| iperf3 receive AX12 |
|
| MSI PE60 2QD | |
| iperf3 transmit AX12 |
|
| iperf3 receive AX12 |
|
| Intel NUC5i5RYH | |
| iperf3 transmit AX12 |
|
| iperf3 receive AX12 |
|
| Microsoft Surface Pro 4, Core i5, 128GB | |
| iperf3 transmit AX12 |
|
| iperf3 receive AX12 |
|
| Lenovo ThinkPad T460s-20FA003GGE | |
| iperf3 transmit AX12 |
|
| iperf3 receive AX12 |
|
| MSI GT72S-6QEG16SR421BW | |
| iperf3 transmit AX12 |
|
| iperf3 receive AX12 |
|
| Apple MacBook Pro Retina 13 inch 2013-10 | |
| iperf3 transmit AX12 |
|
| iperf3 receive AX12 |
|
| |||||||||||||||||||||||||
Brightness Distribution: 89 %
Center on Battery: 384 cd/m²
Contrast: 1038:1 (Black: 0.37 cd/m²)
ΔE Color 5.8 | 0.5-29.43 Ø5
ΔE Greyscale 5.1 | 0.57-98 Ø5.3
Gamma: 2.4
| Cube i7 Book CDK09 Samsung LTN140W1-L01, , 1920x1080, 10.60 | Microsoft Surface 3 Panasonic MEI9001, , 1920x1280, 10.80 | Microsoft Surface Pro 4, Core i5, 128GB Samsung 123YL01-001 ID: SDC3853, , 2736x1824, 12.30 | Cube i9 KDC0000, , 1920x1200, 12.20 | |
|---|---|---|---|---|
| Display | ||||
| Display P3 Coverage | 68.8 | 65 | 65.7 | |
| sRGB Coverage | 98.7 | 96.5 | 88.7 | |
| AdobeRGB 1998 Coverage | 70.4 | 67 | 65.1 | |
| Response Times | ||||
| Response Time Grey 50% / Grey 80% * | 46 ? | 37.2 ? | ||
| Response Time Black / White * | 31.2 ? | 24 ? | ||
| PWM Frequency | 50 ? | 200 ? | ||
| Screen | 19% | 14% | 4% | |
| Brightness middle | 384 | 399 4% | 413 8% | 263 -32% |
| Brightness | 370 | 380 3% | 396 7% | 263 -29% |
| Brightness Distribution | 89 | 90 1% | 87 -2% | 77 -13% |
| Black Level * | 0.37 | 0.49 -32% | 0.36 3% | 0.28 24% |
| Contrast | 1038 | 814 -22% | 1147 11% | 939 -10% |
| Colorchecker dE 2000 * | 5.8 | 1.66 71% | 3.09 47% | 4.1 29% |
| Colorchecker dE 2000 max. * | 19.8 | 3.24 84% | 12.1 39% | |
| Greyscale dE 2000 * | 5.1 | 2.75 46% | 3.92 23% | 3.8 25% |
| Gamma | 2.4 92% | 2.22 99% | 2.3 96% | 2.25 98% |
| CCT | 7125 91% | 6358 102% | 7333 89% | 6433 101% |
| Color Space (Percent of AdobeRGB 1998) | 64.4 | 61 | 57.7 | |
| Color Space (Percent of sRGB) | 98.8 | 97 | 76.2 | |
| Total Average (Program / Settings) | 19% /
19% | 14% /
14% | 4% /
4% |
* ... smaller is better
| Cinebench R15 | |
| CPU Single 64Bit | |
| Cube i7 Book CDK09 | |
| Microsoft Surface Pro 4, Core m3 | |
| Cube i9 | |
| Microsoft Surface 3 | |
| CPU Multi 64Bit | |
| Cube i7 Book CDK09 | |
| Microsoft Surface Pro 4, Core m3 | |
| Cube i9 | |
| Microsoft Surface 3 | |
| PCMark 8 Home Score Accelerated v2 | 2976 points | |
Help | ||
| Cube i7 Book CDK09 FORESEE 64GB O1229B | Cube i9 FORESEE 128GB O1229B | Microsoft Surface 3 128 GB eMMC Flash | Microsoft Surface Pro 4, Core m3 Samsung MZFLV128 NVMe | |
|---|---|---|---|---|
| CrystalDiskMark 3.0 | 2% | -64% | 49% | |
| Read Seq | 433.2 | 337 -22% | 149.3 -66% | 663 53% |
| Write Seq | 157 | 208 32% | 47.99 -69% | 158.2 1% |
| Read 512 | 252.4 | 197 -22% | 133.7 -47% | 313.1 24% |
| Write 512 | 130.7 | 199 52% | 39.9 -69% | 158.2 21% |
| Read 4k | 14.72 | 18.4 25% | 12.64 -14% | 30.14 105% |
| Write 4k | 51.3 | 56.8 11% | 9.52 -81% | 68 33% |
| Read 4k QD32 | 121.3 | 22.7 -81% | 27.94 -77% | 243.7 101% |
| Write 4k QD32 | 96.2 | 116 21% | 11.2 -88% | 149.2 55% |

| 3DMark - 1280x720 Sky Diver Graphics | |
| Cube i9 | |
| Cube i7 Book CDK09 | |
| Acer Aspire Switch 12S SW7-272-M3A0 | |
| 3DMark 06 Standard Score | 6599 points | |
Help | ||
(+) The maximum temperature on the upper side is 39 °C / 102 F, compared to the average of 35.3 °C / 96 F, ranging from 19.6 to 55.7 °C for the class Convertible.
(-) The bottom heats up to a maximum of 46 °C / 115 F, compared to the average of 36.8 °C / 98 F
(+) The palmrests and touchpad are reaching skin temperature as a maximum (35 °C / 95 F) and are therefore not hot.
(-) The average temperature of the palmrest area of similar devices was 28.1 °C / 82.6 F (-6.9 °C / -12.4 F).
Cube i7 Book CDK09 audio analysis
(±) | speaker loudness is average but good (72 dB)
Bass 100 - 315 Hz
(-) | nearly no bass - on average 22.8% lower than median
(+) | bass is linear (3.7% delta to prev. frequency)
Mids 400 - 2000 Hz
(±) | higher mids - on average 9.2% higher than median
(-) | mids are not linear (16% delta to prev. frequency)
Highs 2 - 16 kHz
(±) | higher highs - on average 11.3% higher than median
(±) | linearity of highs is average (10.1% delta to prev. frequency)
Overall 100 - 16.000 Hz
(-) | overall sound is not linear (46.1% difference to median)
Compared to same class
» 99% of all tested devices in this class were better, 0% similar, 1% worse
» The best had a delta of 6%, average was 21%, worst was 57%
Compared to all devices tested
» 95% of all tested devices were better, 0% similar, 5% worse
» The best had a delta of 4%, average was 25%, worst was 134%
Apple MacBook 12 (Early 2016) 1.1 GHz audio analysis
(+) | speakers can play relatively loud (83.6 dB)
Bass 100 - 315 Hz
(±) | reduced bass - on average 11.3% lower than median
(±) | linearity of bass is average (14.2% delta to prev. frequency)
Mids 400 - 2000 Hz
(+) | balanced mids - only 2.4% away from median
(+) | mids are linear (5.5% delta to prev. frequency)
Highs 2 - 16 kHz
(+) | balanced highs - only 2% away from median
(+) | highs are linear (4.5% delta to prev. frequency)
Overall 100 - 16.000 Hz
(+) | overall sound is linear (10.2% difference to median)
Compared to same class
» 5% of all tested devices in this class were better, 2% similar, 93% worse
» The best had a delta of 5%, average was 19%, worst was 53%
Compared to all devices tested
» 3% of all tested devices were better, 1% similar, 96% worse
» The best had a delta of 4%, average was 25%, worst was 134%
Microsoft Surface Pro 4, Core i5, 128GB audio analysis
(-) | not very loud speakers (71.6 dB)
Bass 100 - 315 Hz
(±) | reduced bass - on average 11.3% lower than median
(±) | linearity of bass is average (7% delta to prev. frequency)
Mids 400 - 2000 Hz
(+) | balanced mids - only 1.3% away from median
(+) | mids are linear (5.3% delta to prev. frequency)
Highs 2 - 16 kHz
(+) | balanced highs - only 3.4% away from median
(+) | highs are linear (4.8% delta to prev. frequency)
Overall 100 - 16.000 Hz
(±) | linearity of overall sound is average (19.2% difference to median)
Compared to same class
» 40% of all tested devices in this class were better, 7% similar, 52% worse
» The best had a delta of 6%, average was 21%, worst was 57%
Compared to all devices tested
» 41% of all tested devices were better, 7% similar, 52% worse
» The best had a delta of 4%, average was 25%, worst was 134%
Acer Aspire Switch 12S SW7-272-M3A0 audio analysis
(-) | not very loud speakers (68 dB)
Analysis not possible as minimum curve is missing or too high
| Off / Standby | |
| Idle | |
| Load |
|
| Battery Runtime - WiFi Websurfing | |
| Microsoft Surface Pro 4, Core m3 | |
| Microsoft Surface 3 | |
| Cube i7 Book CDK09 | |
| Cube i9 | |
Pros
Cons
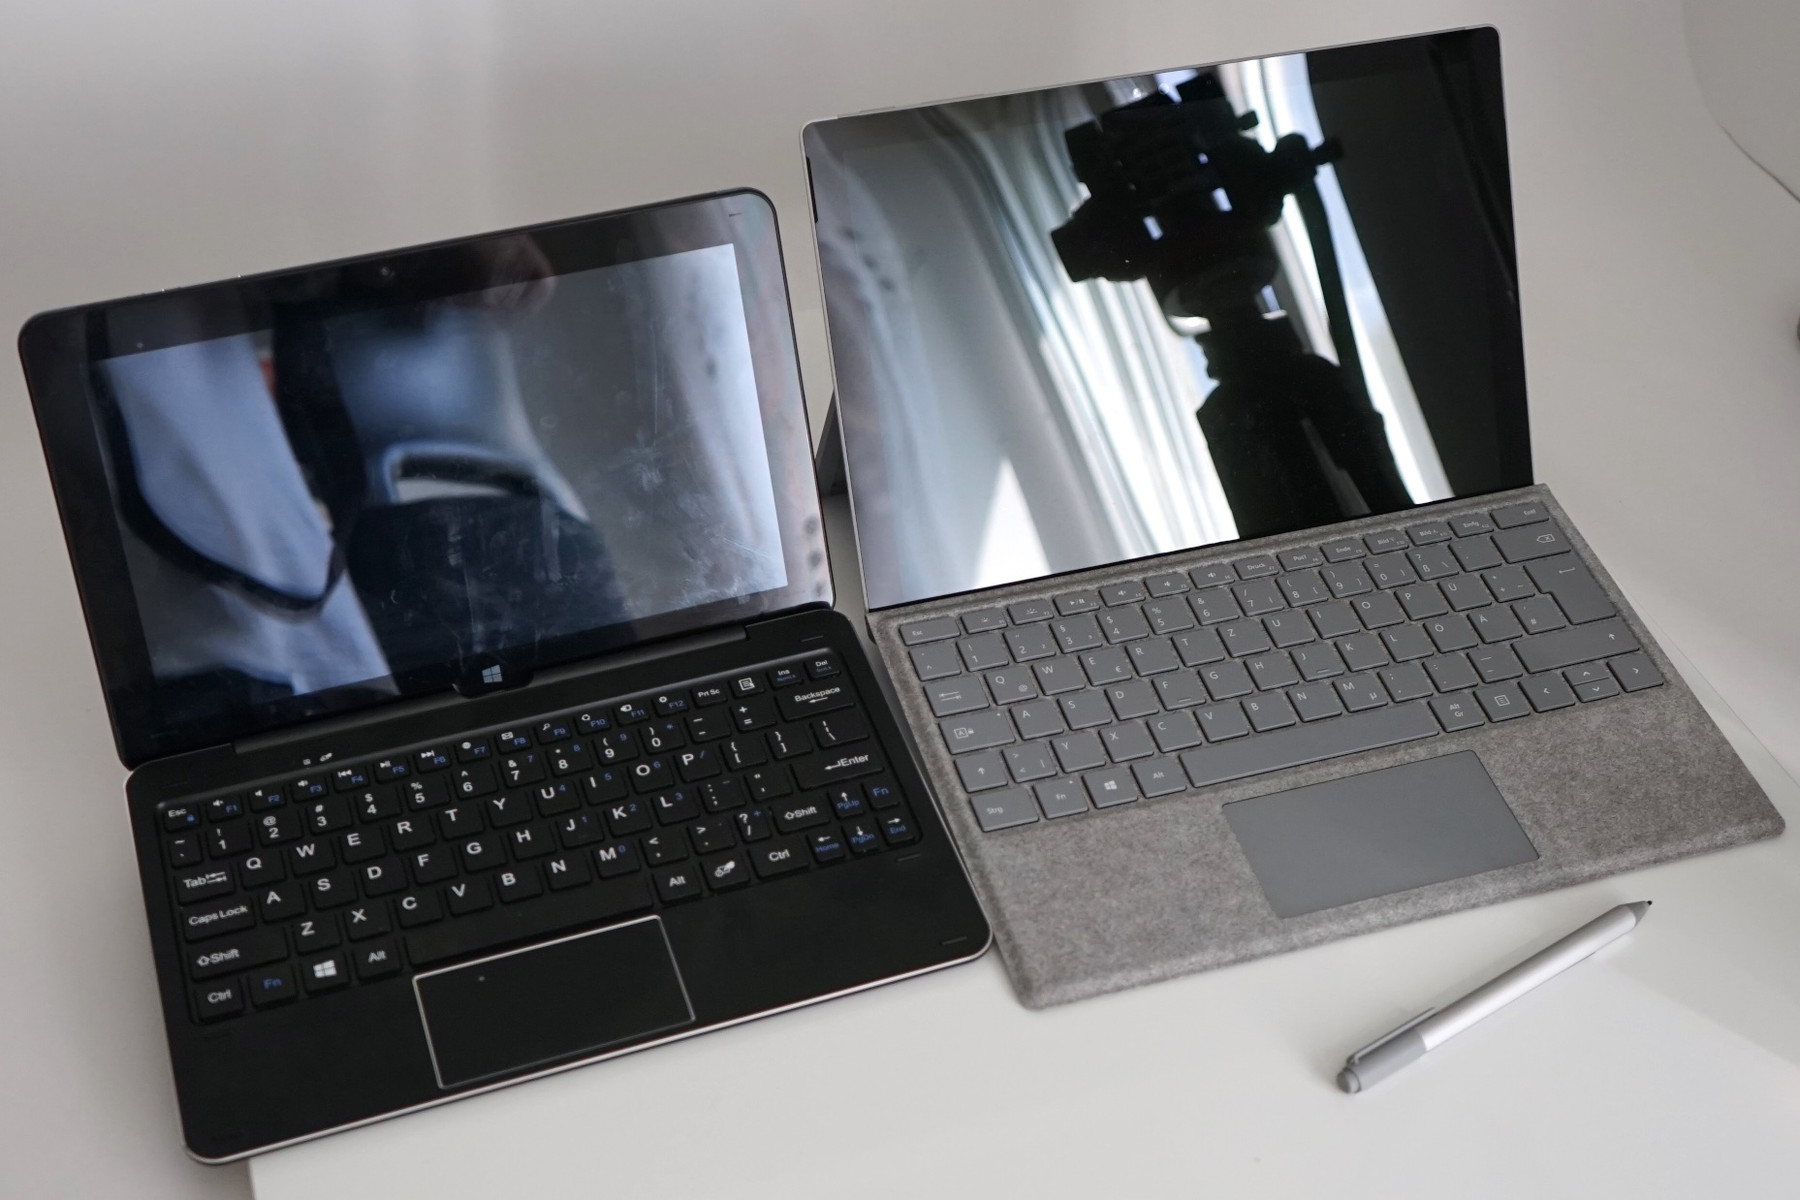
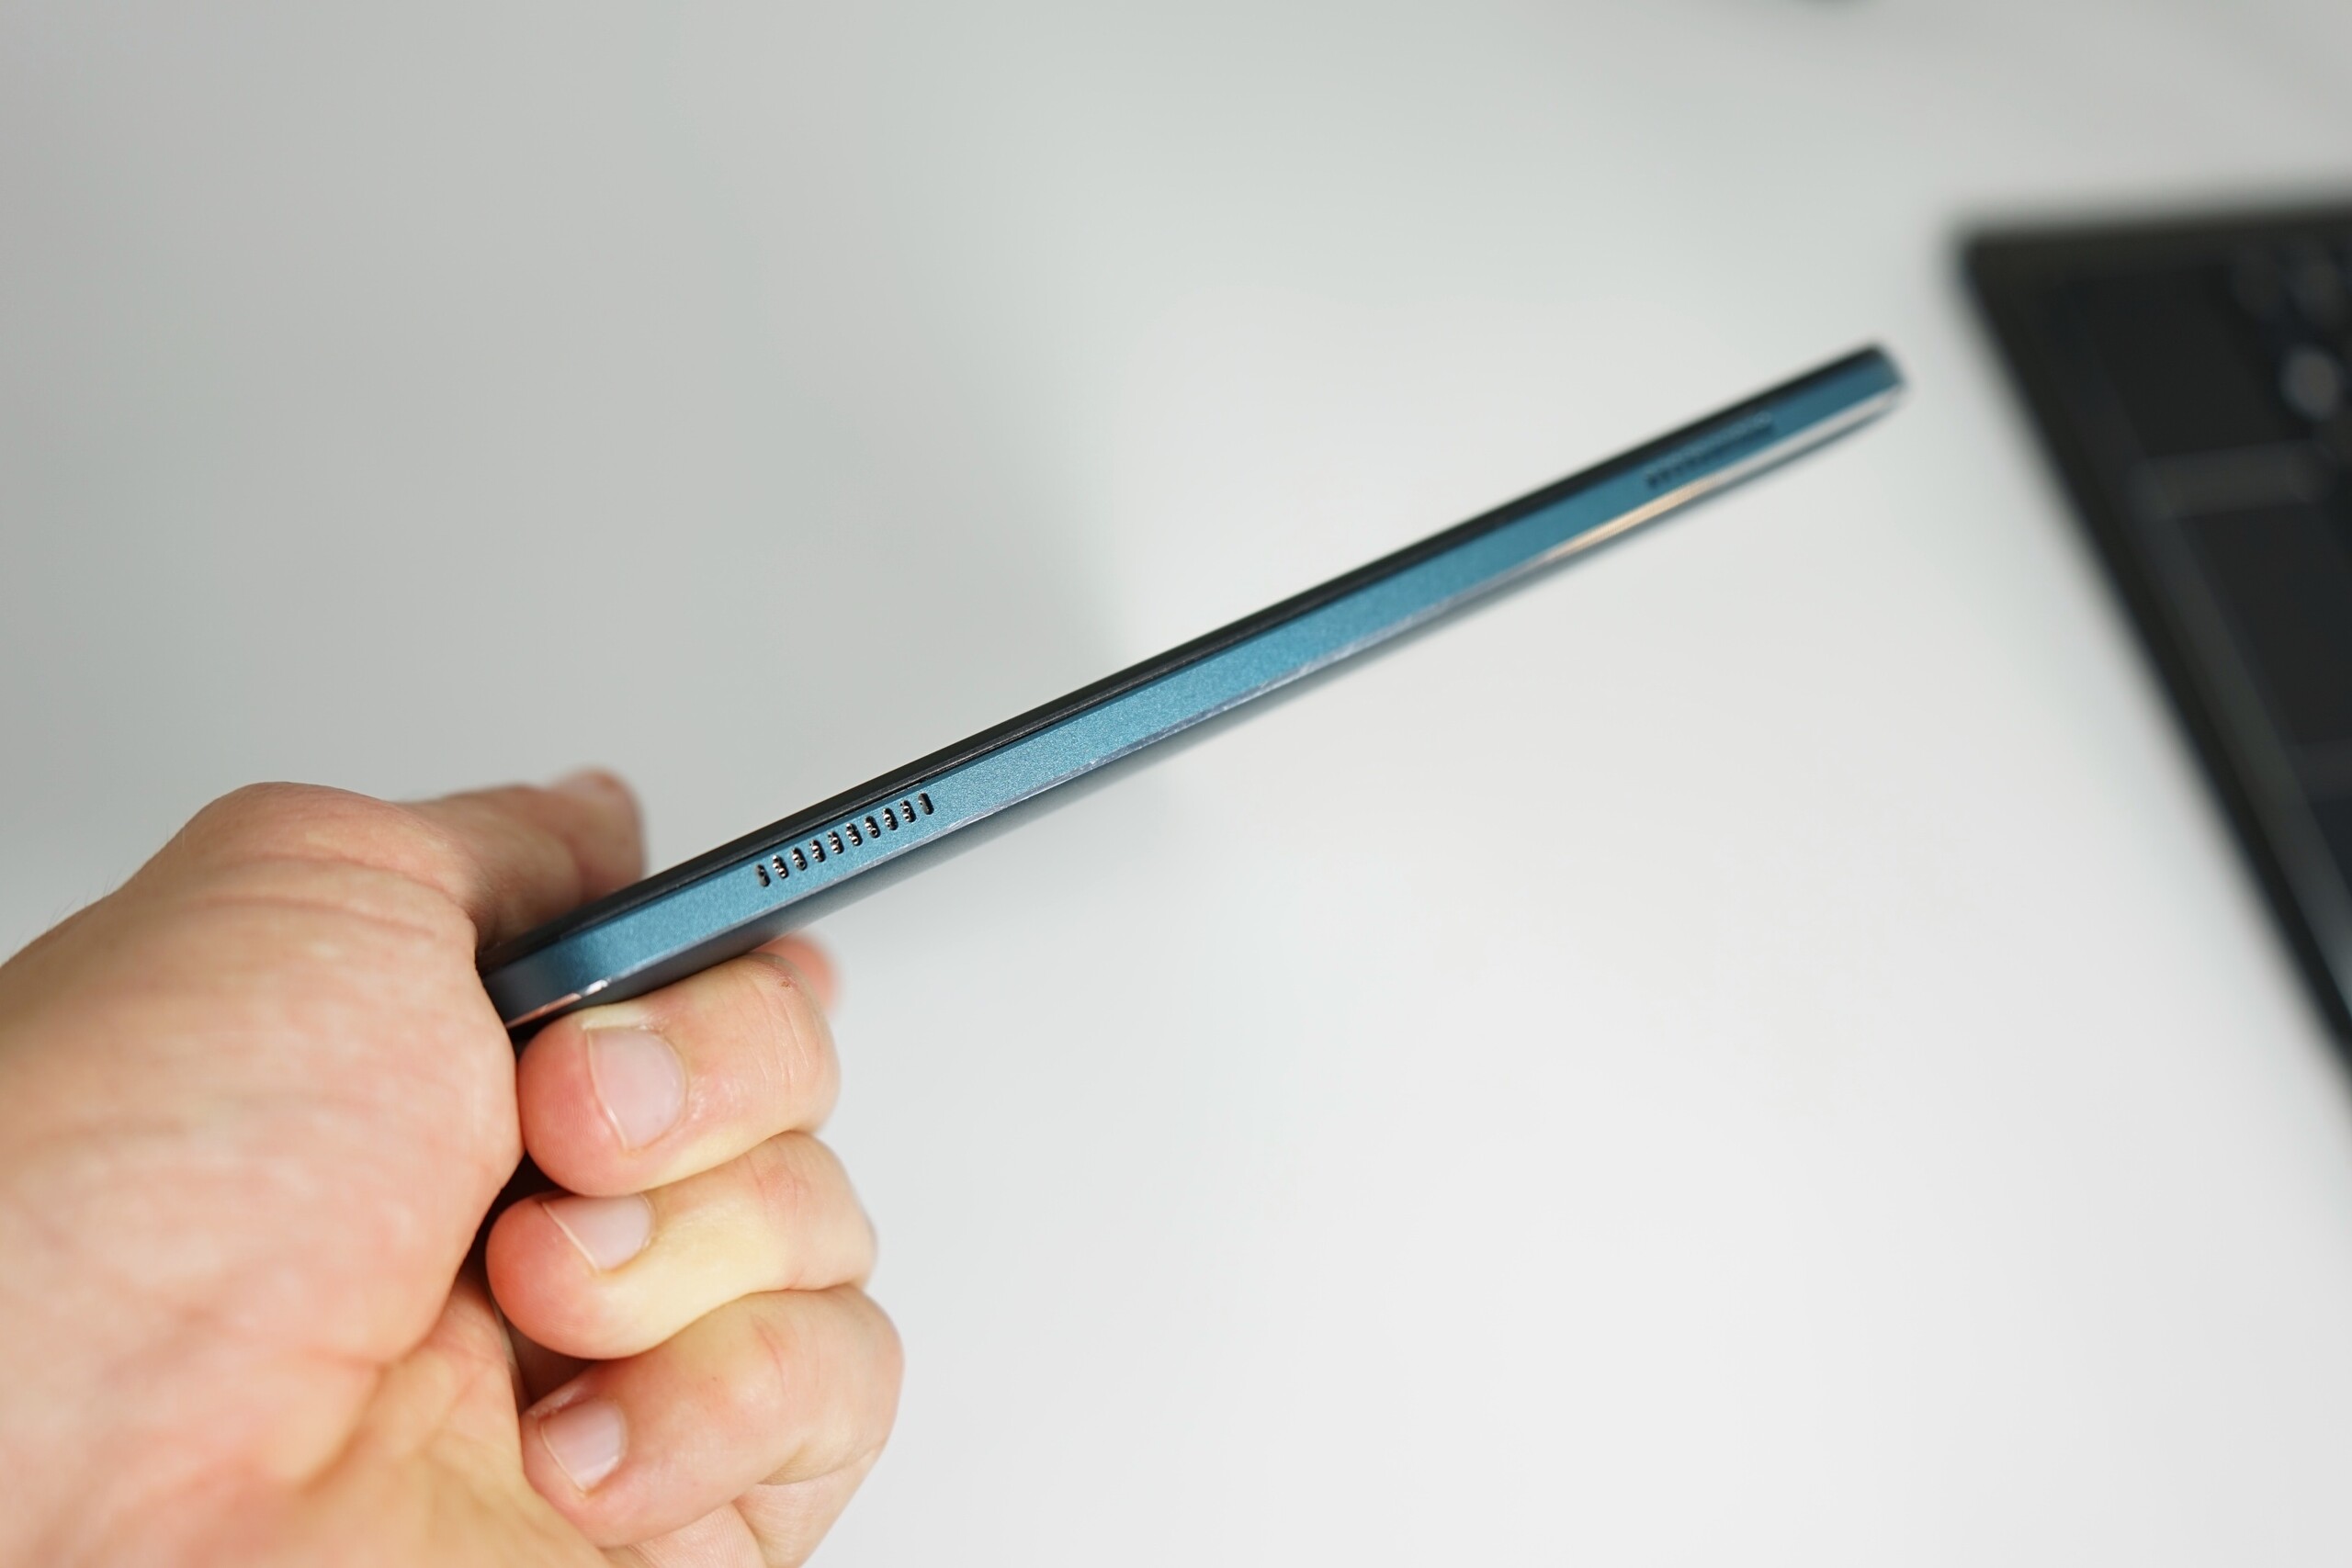
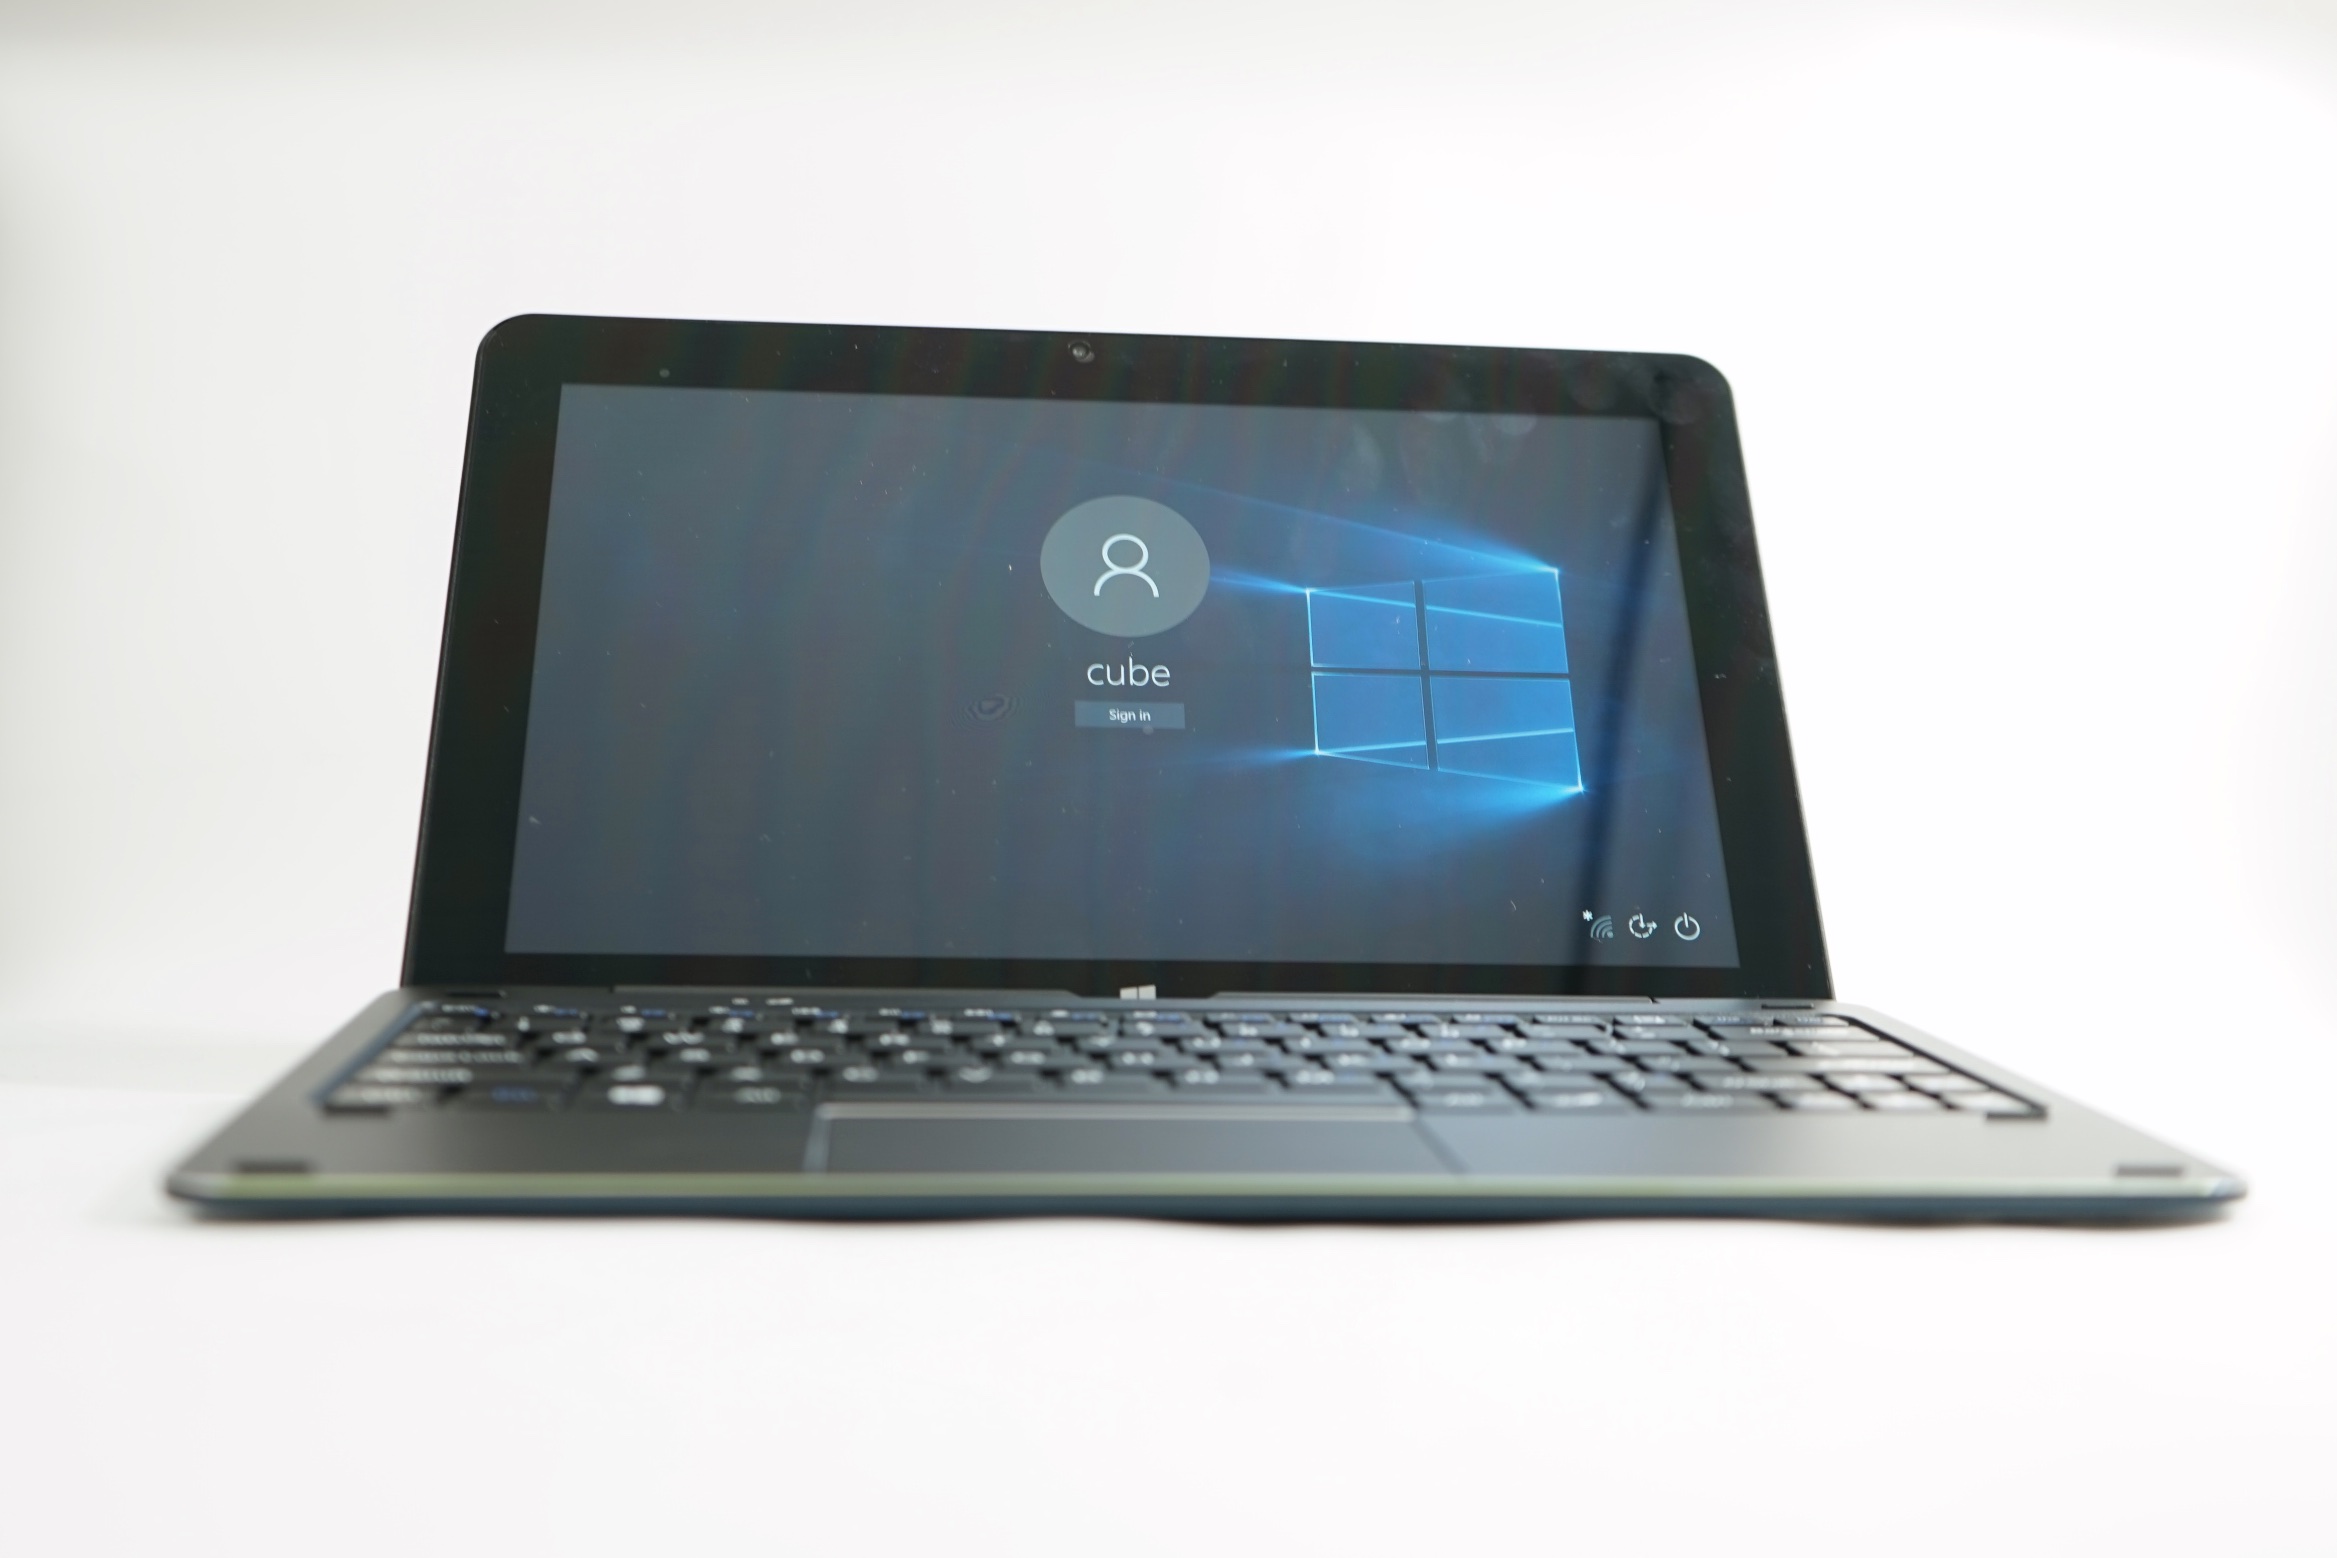
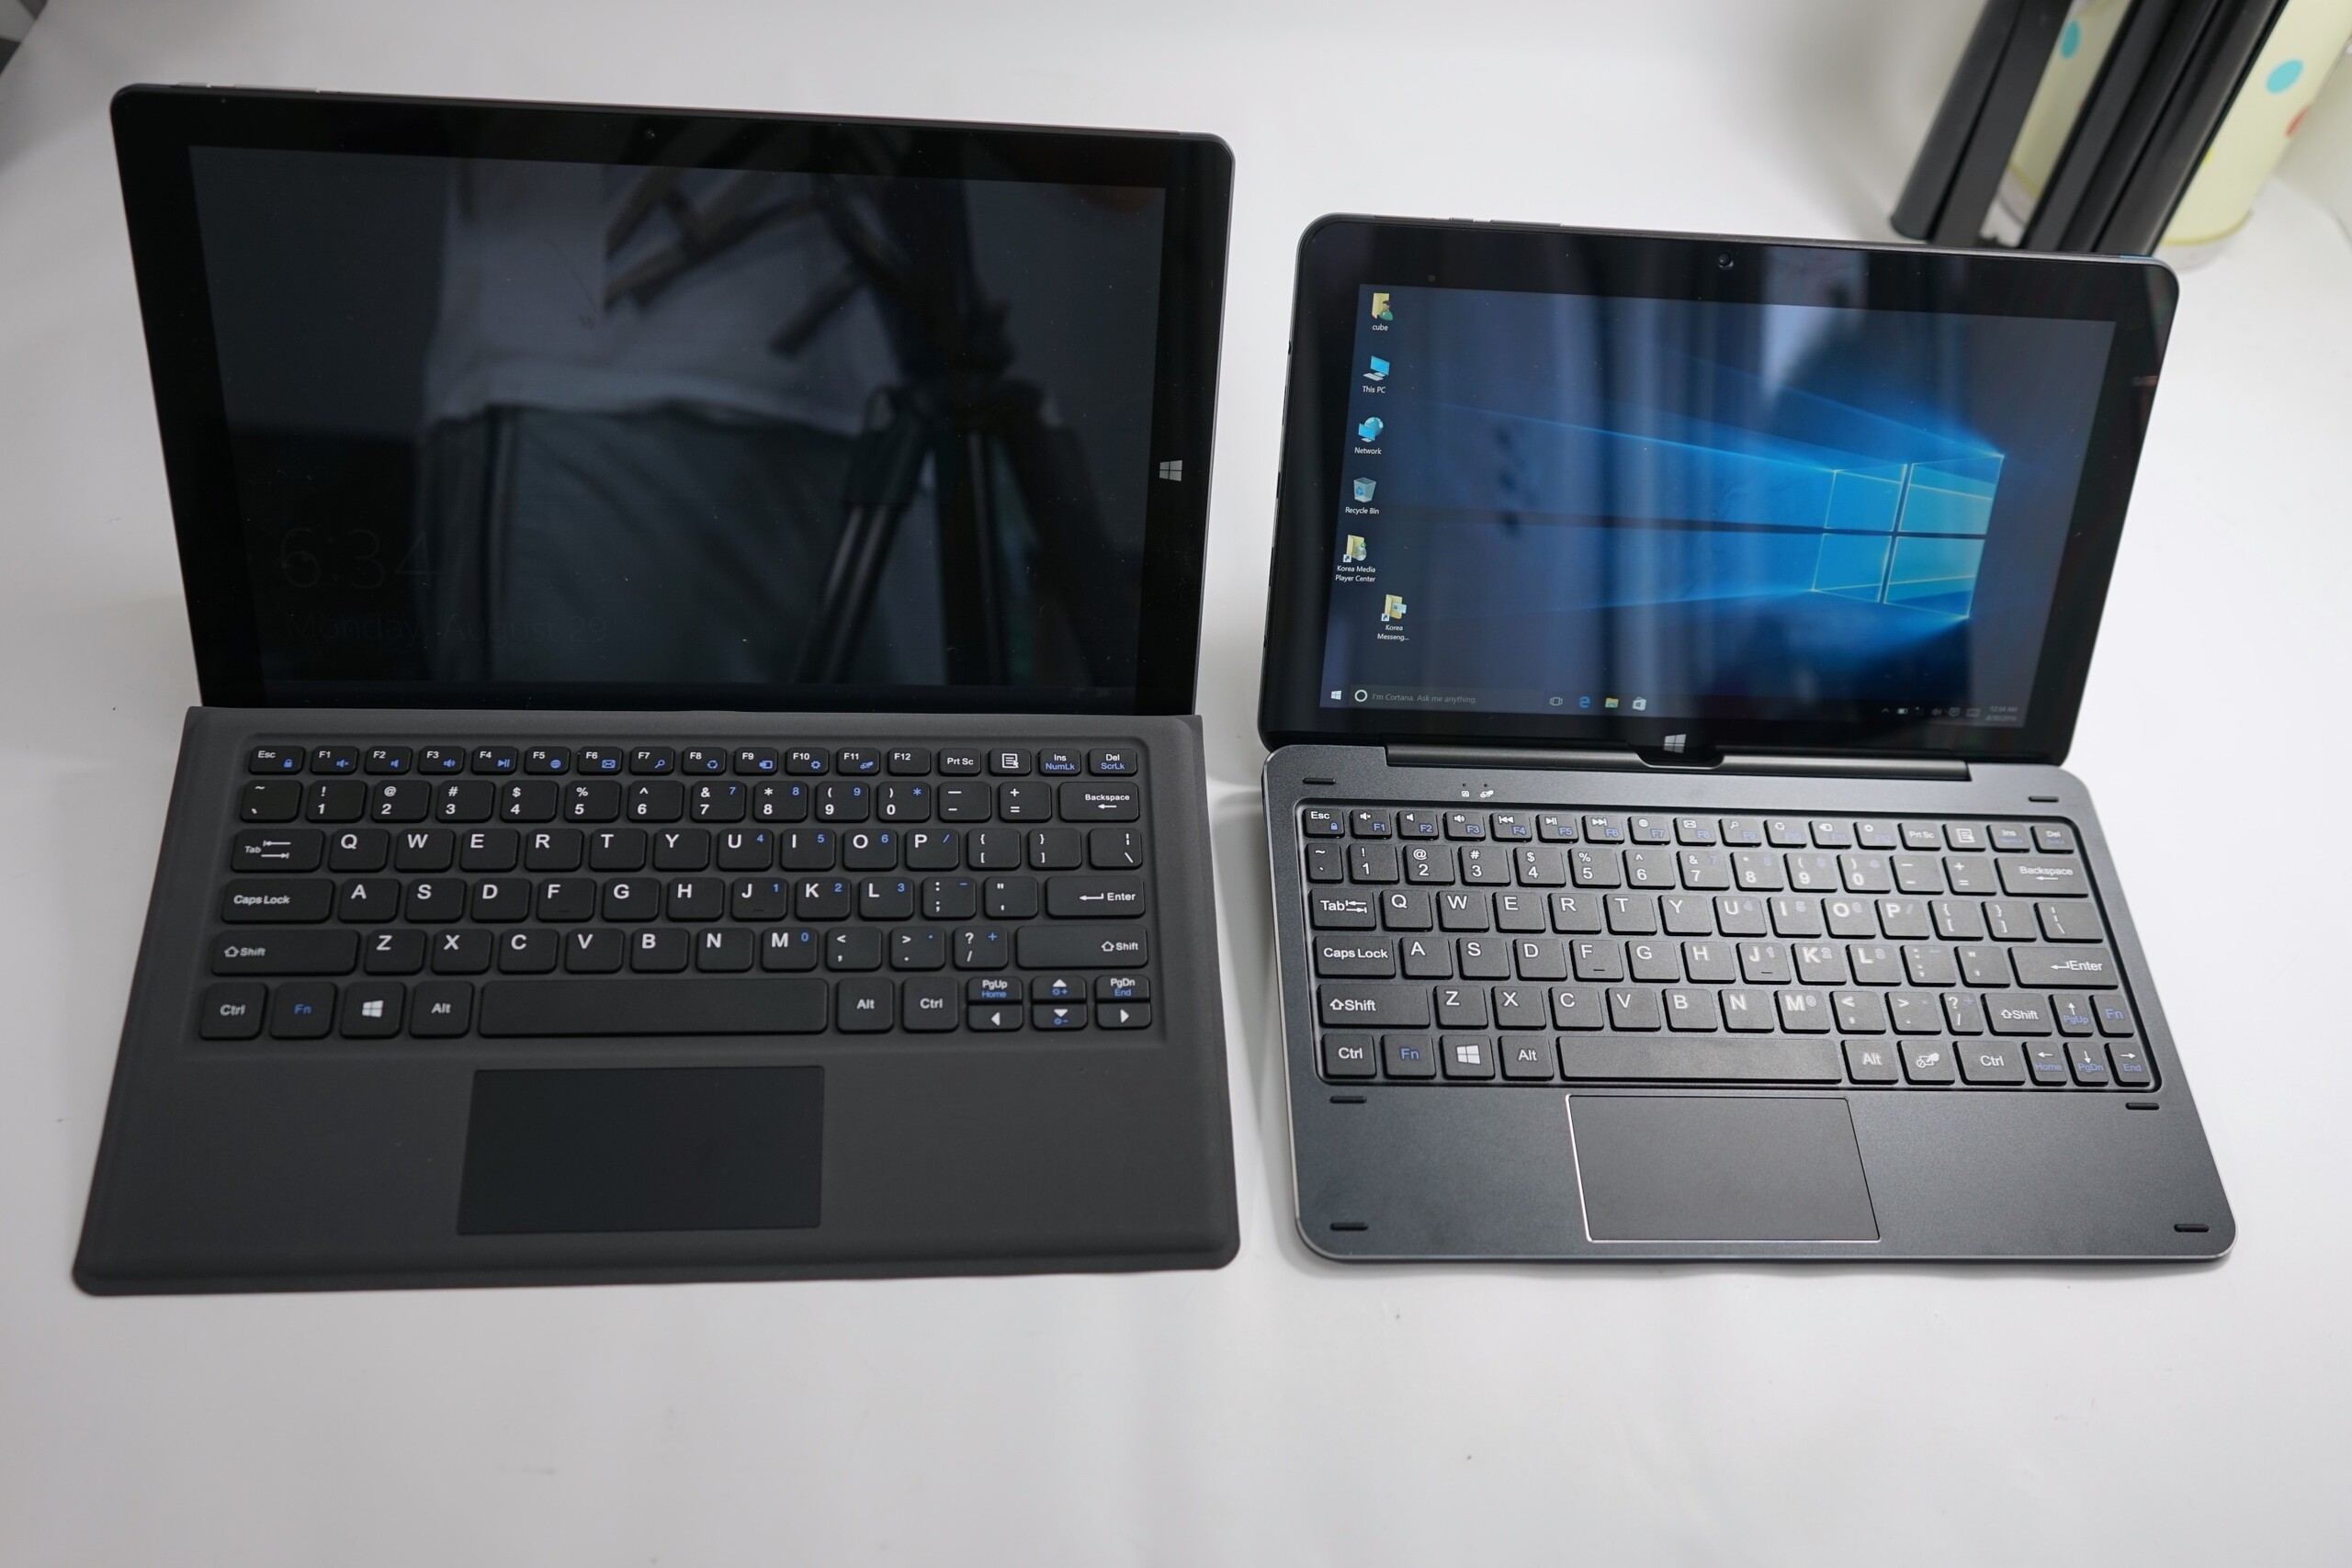
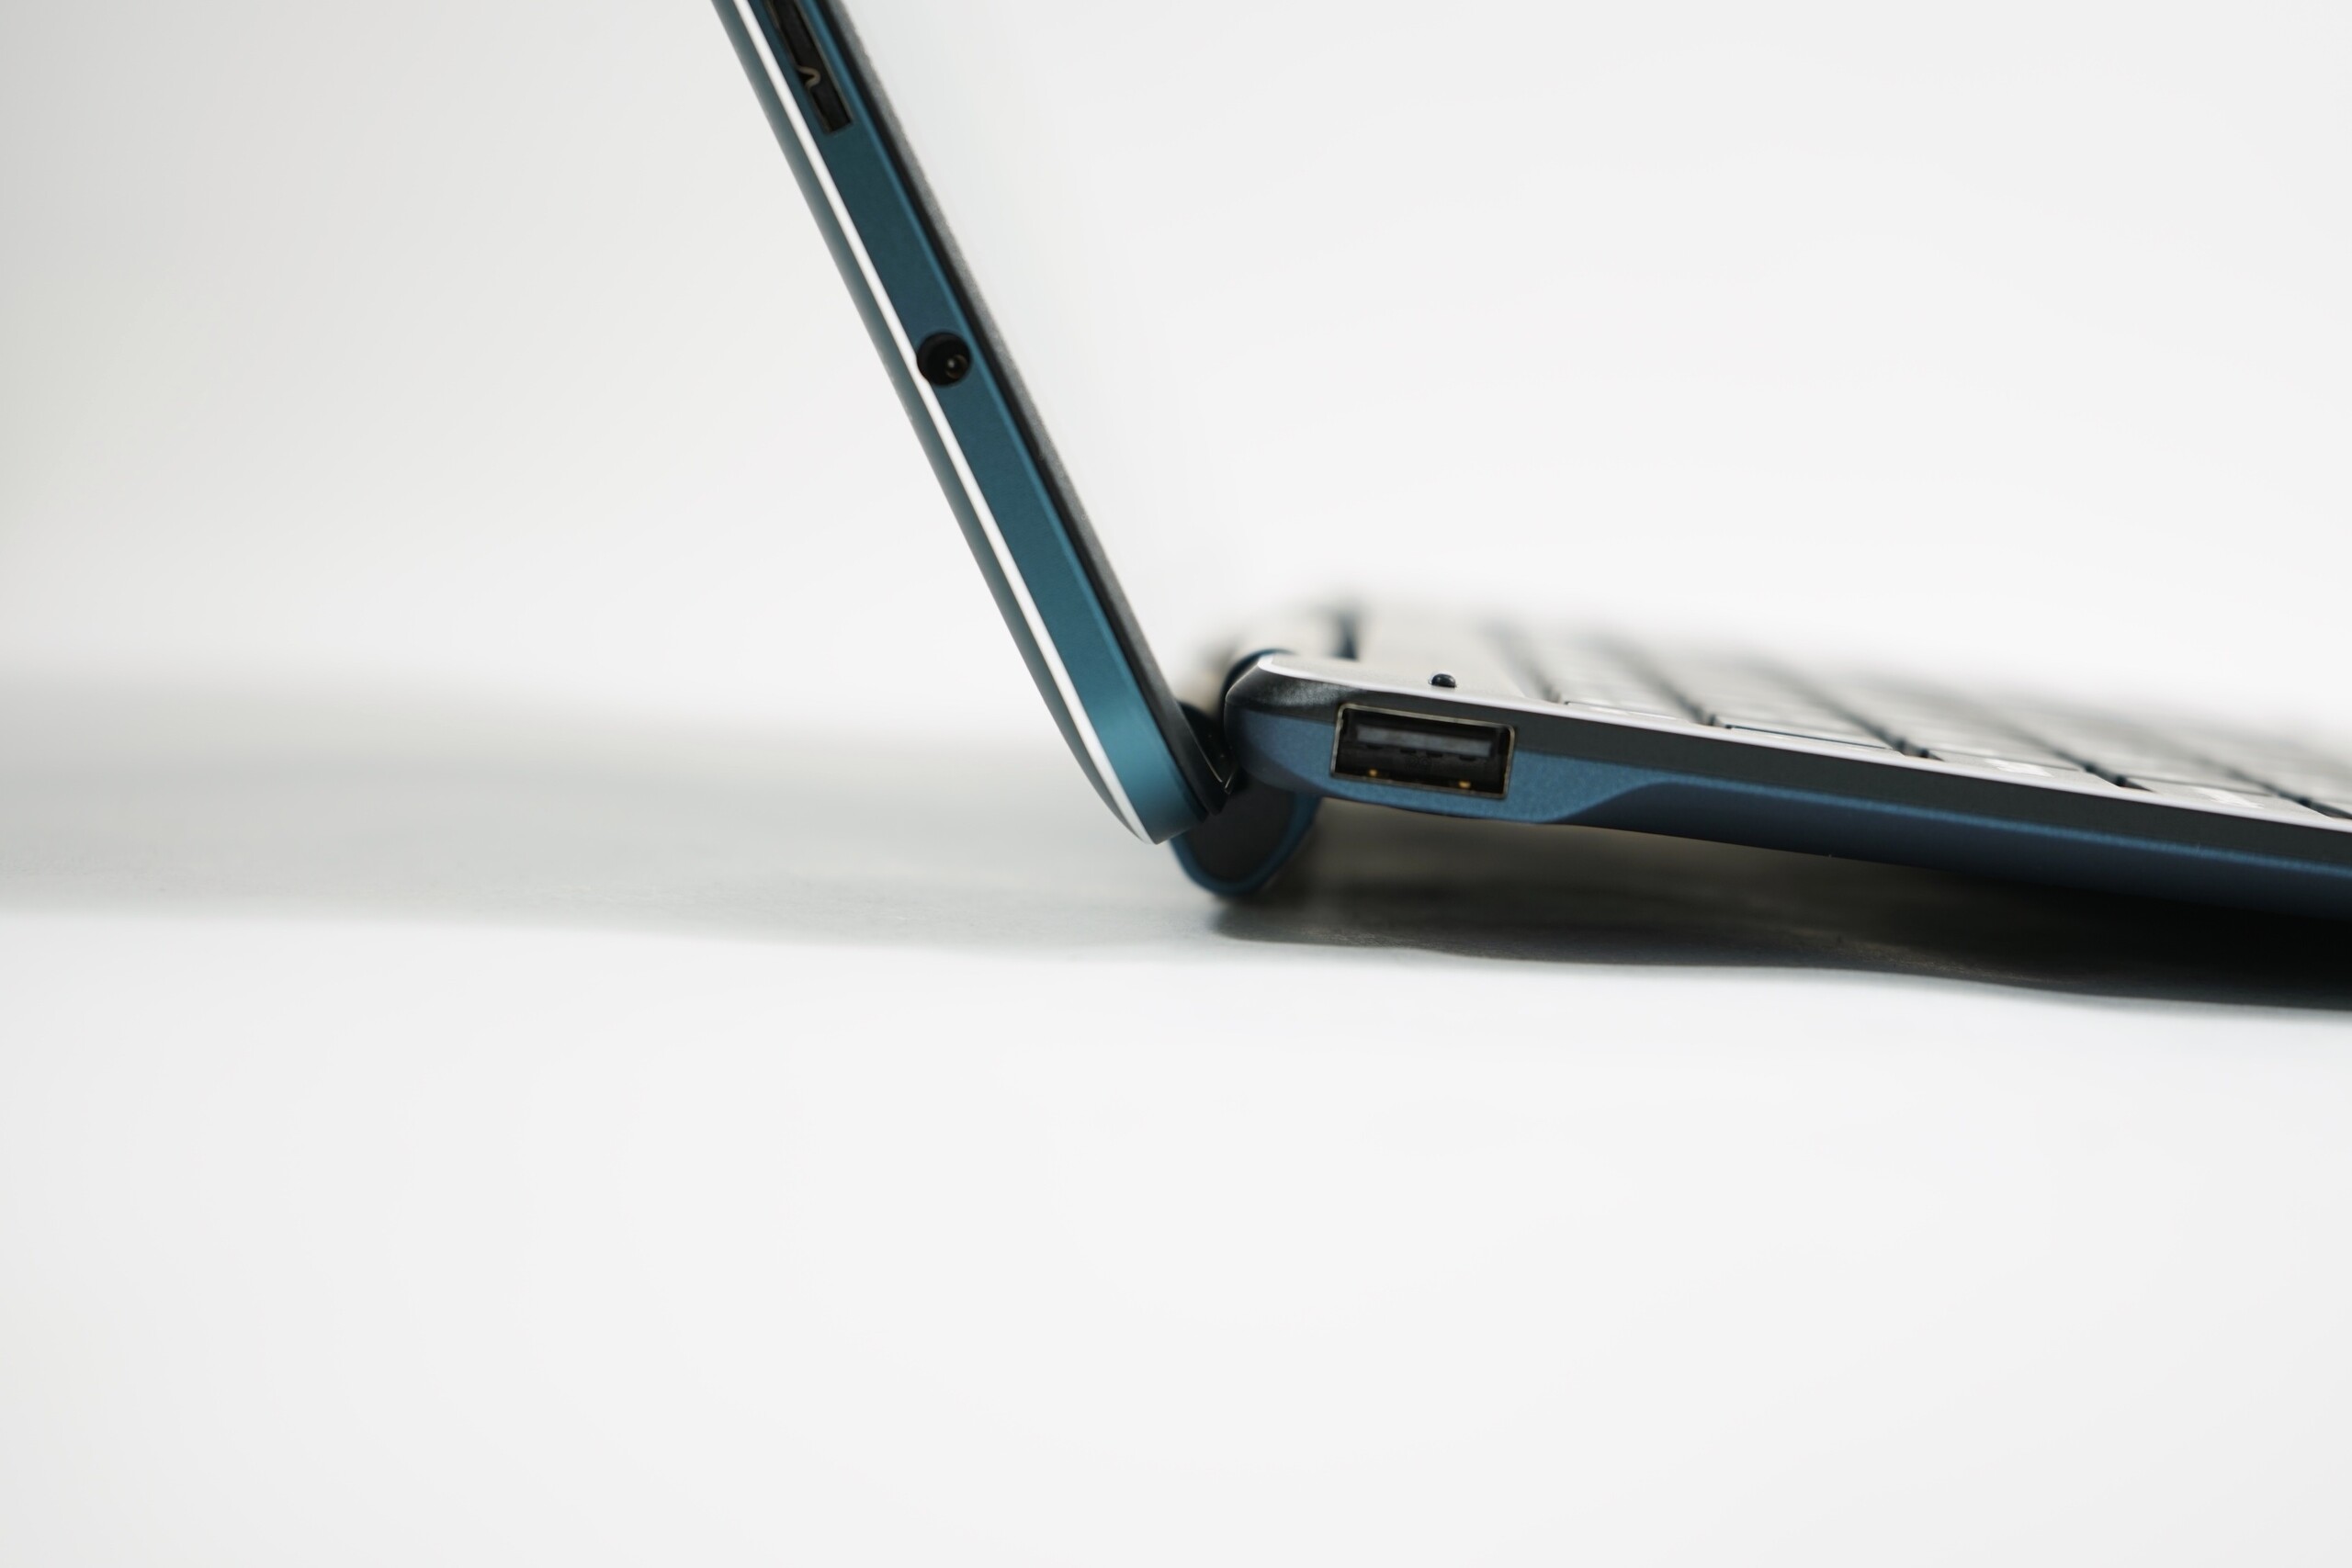
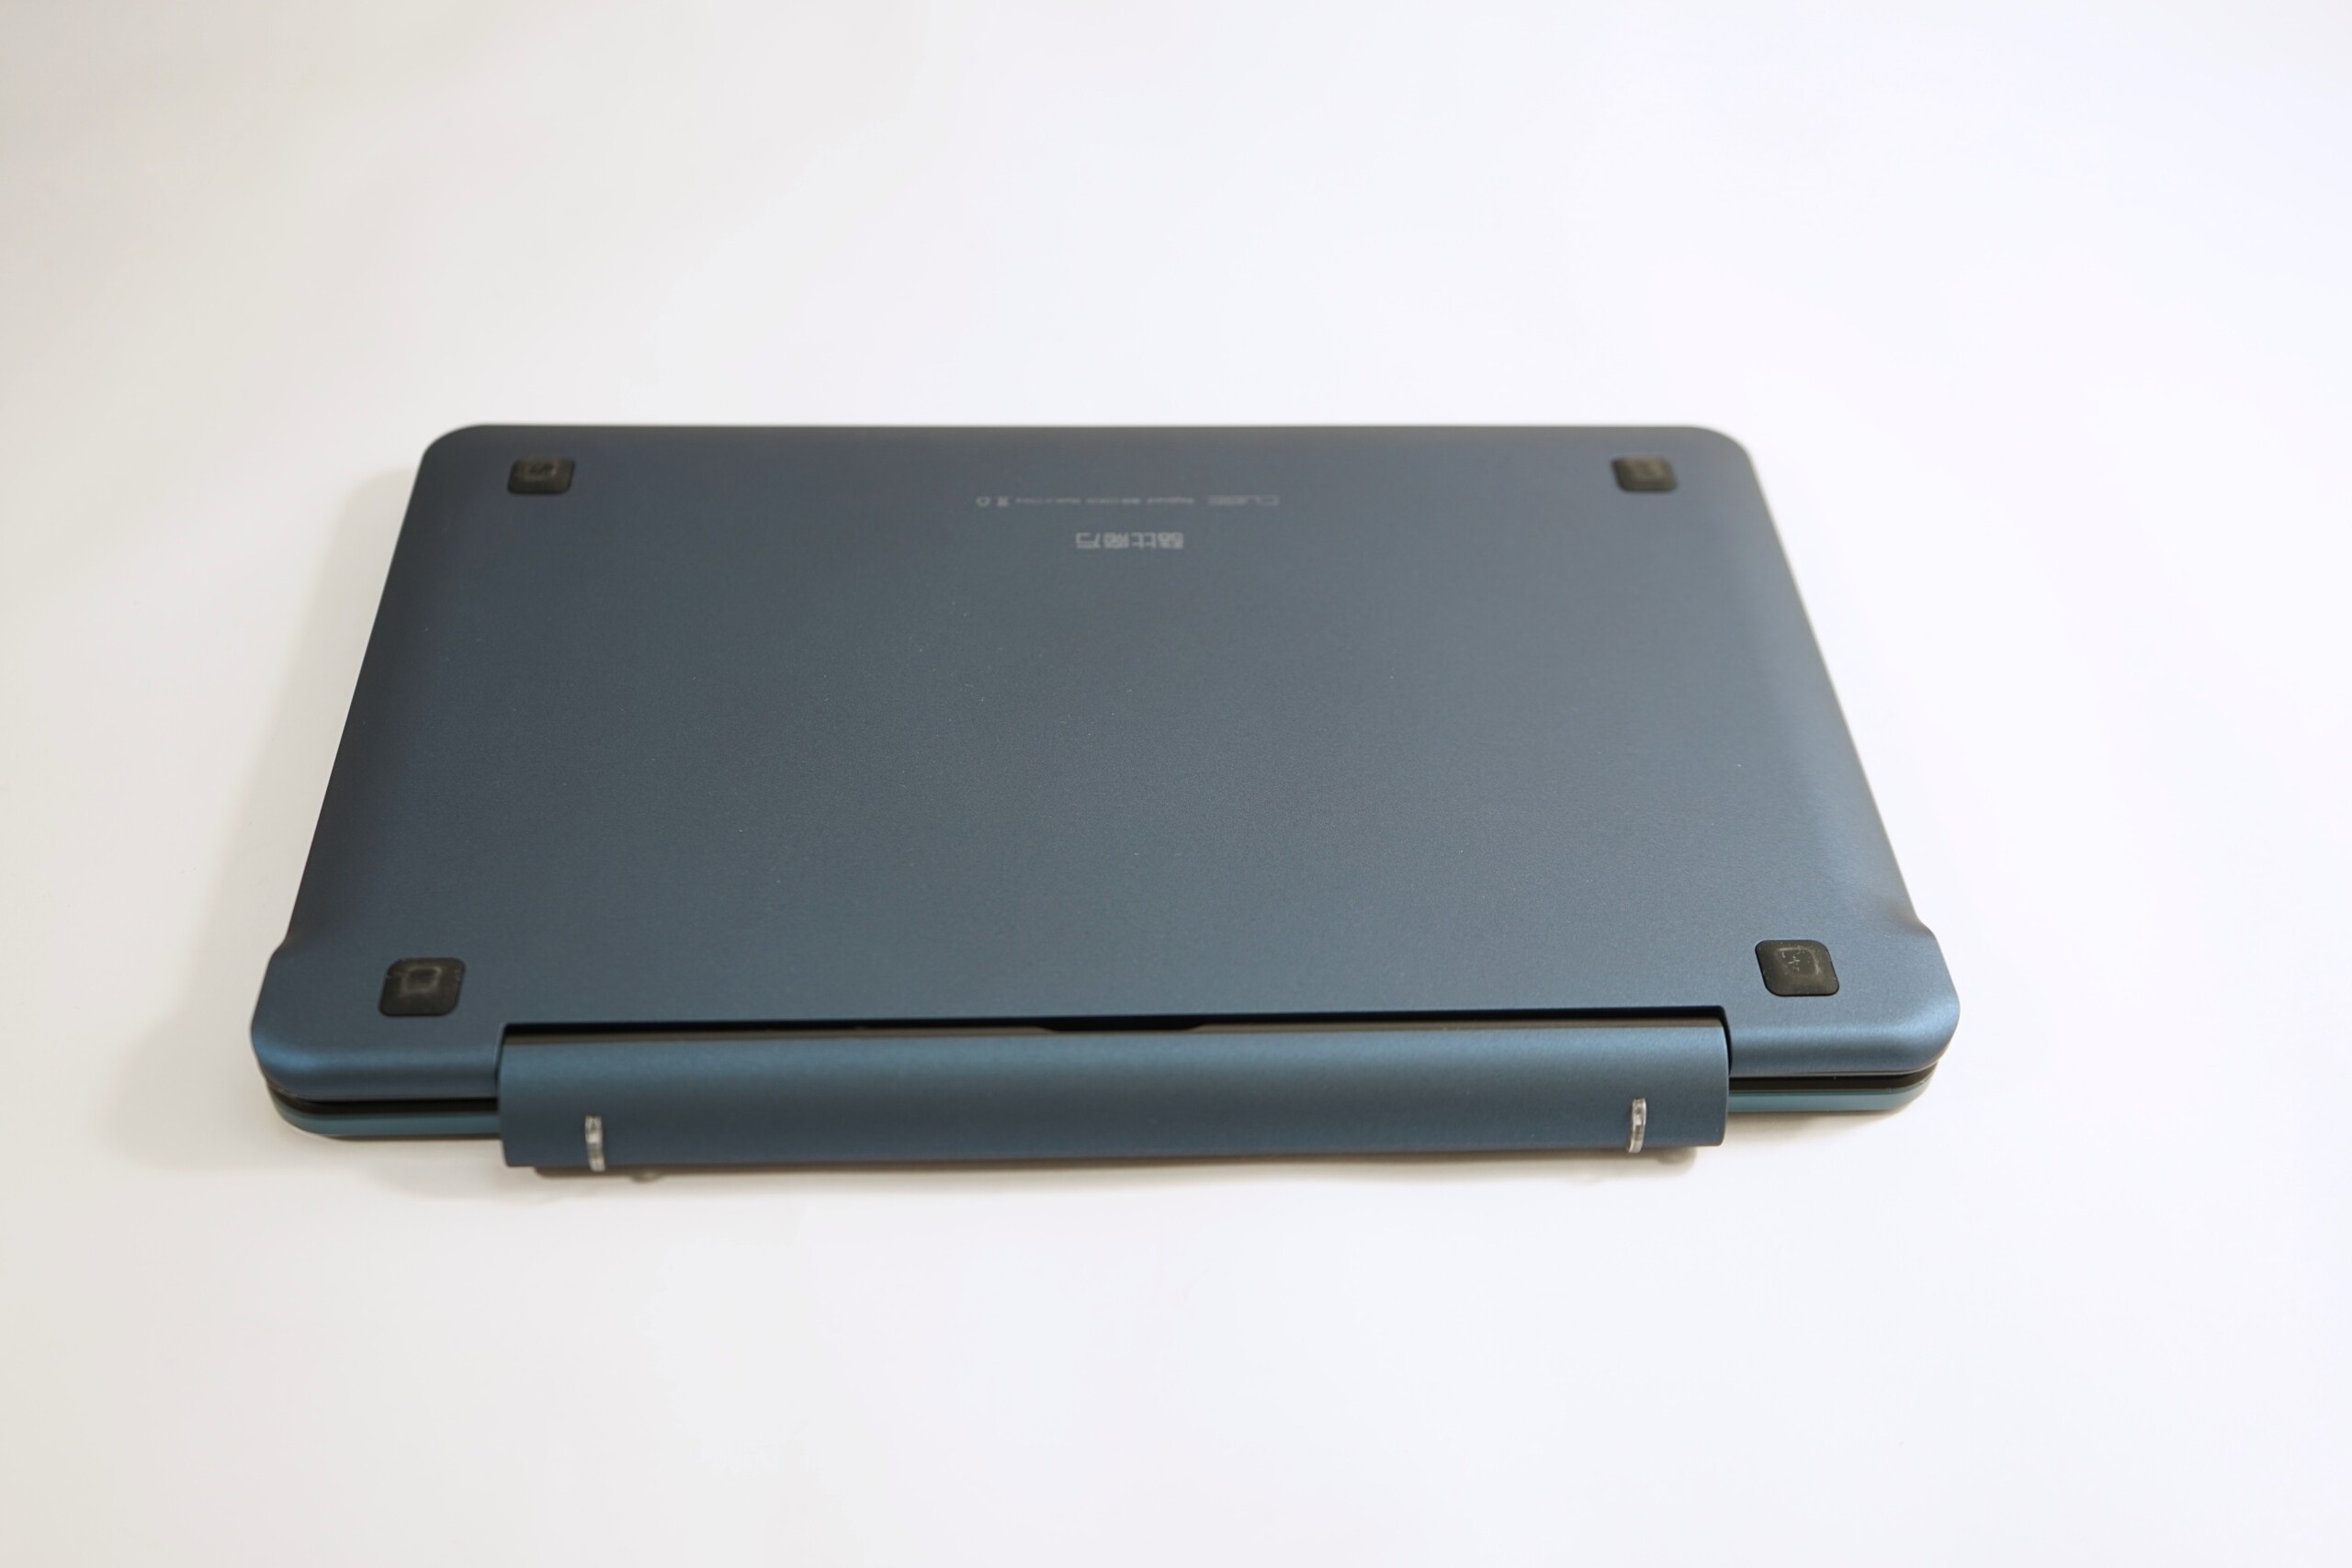
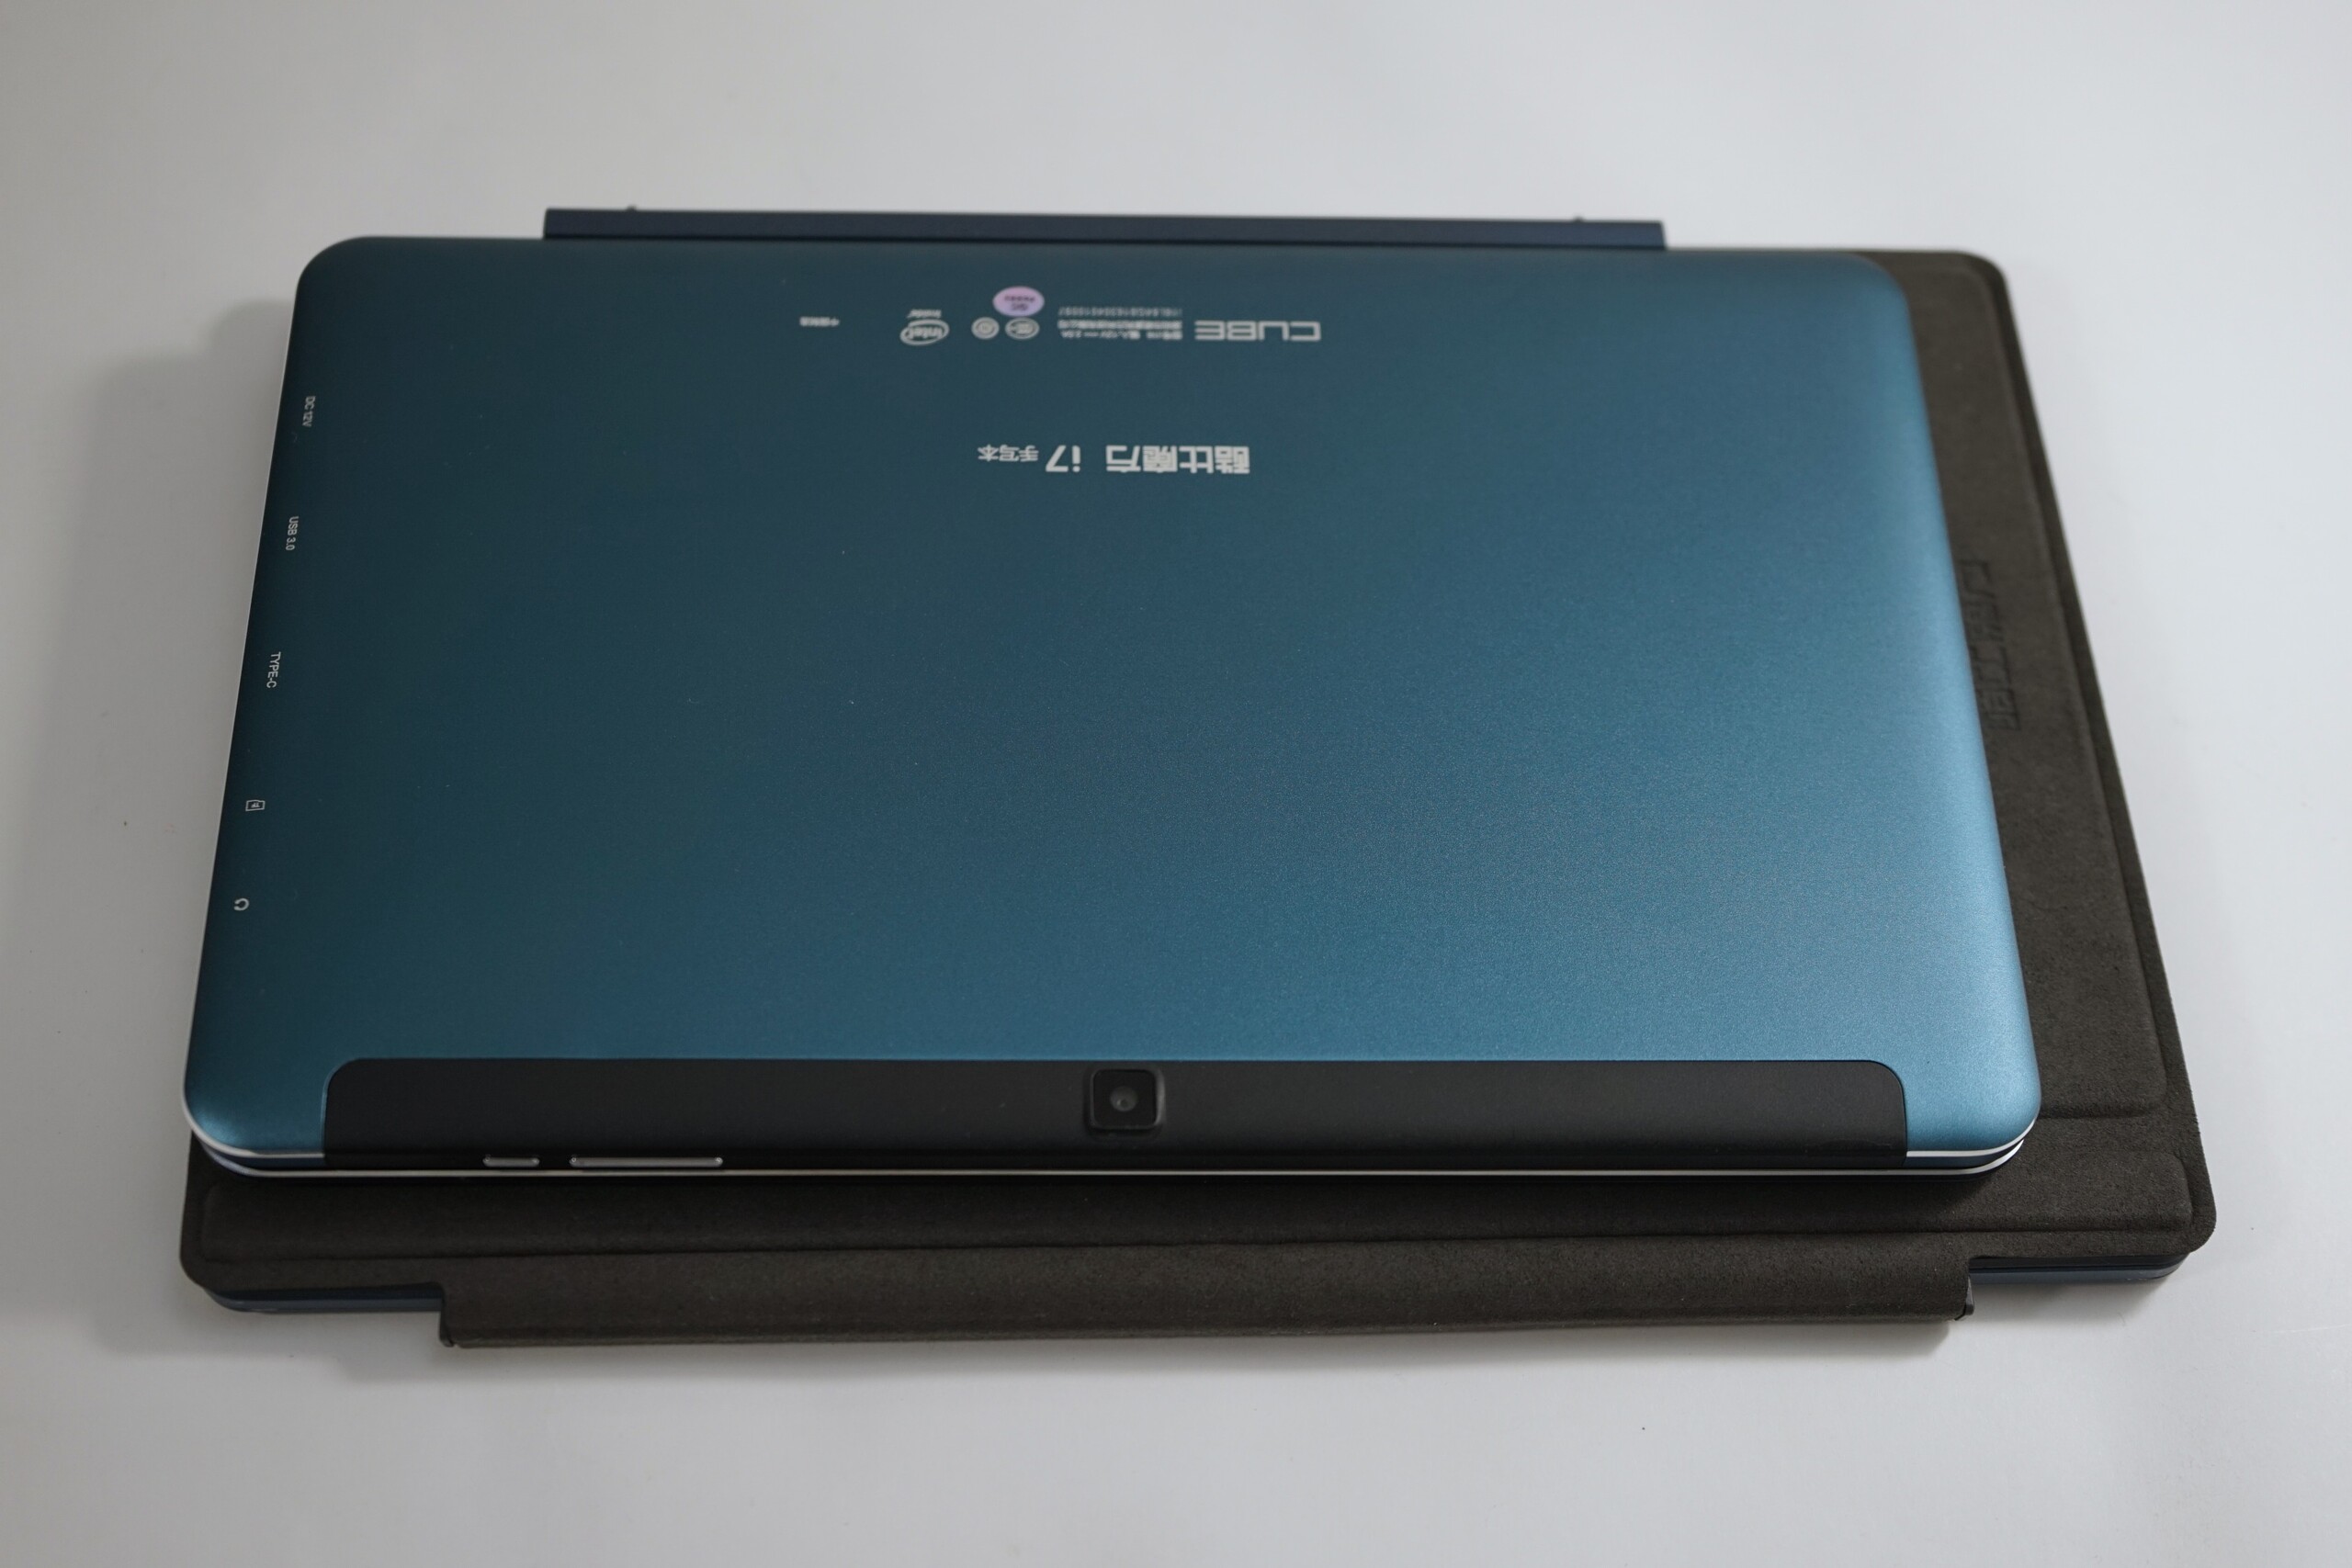
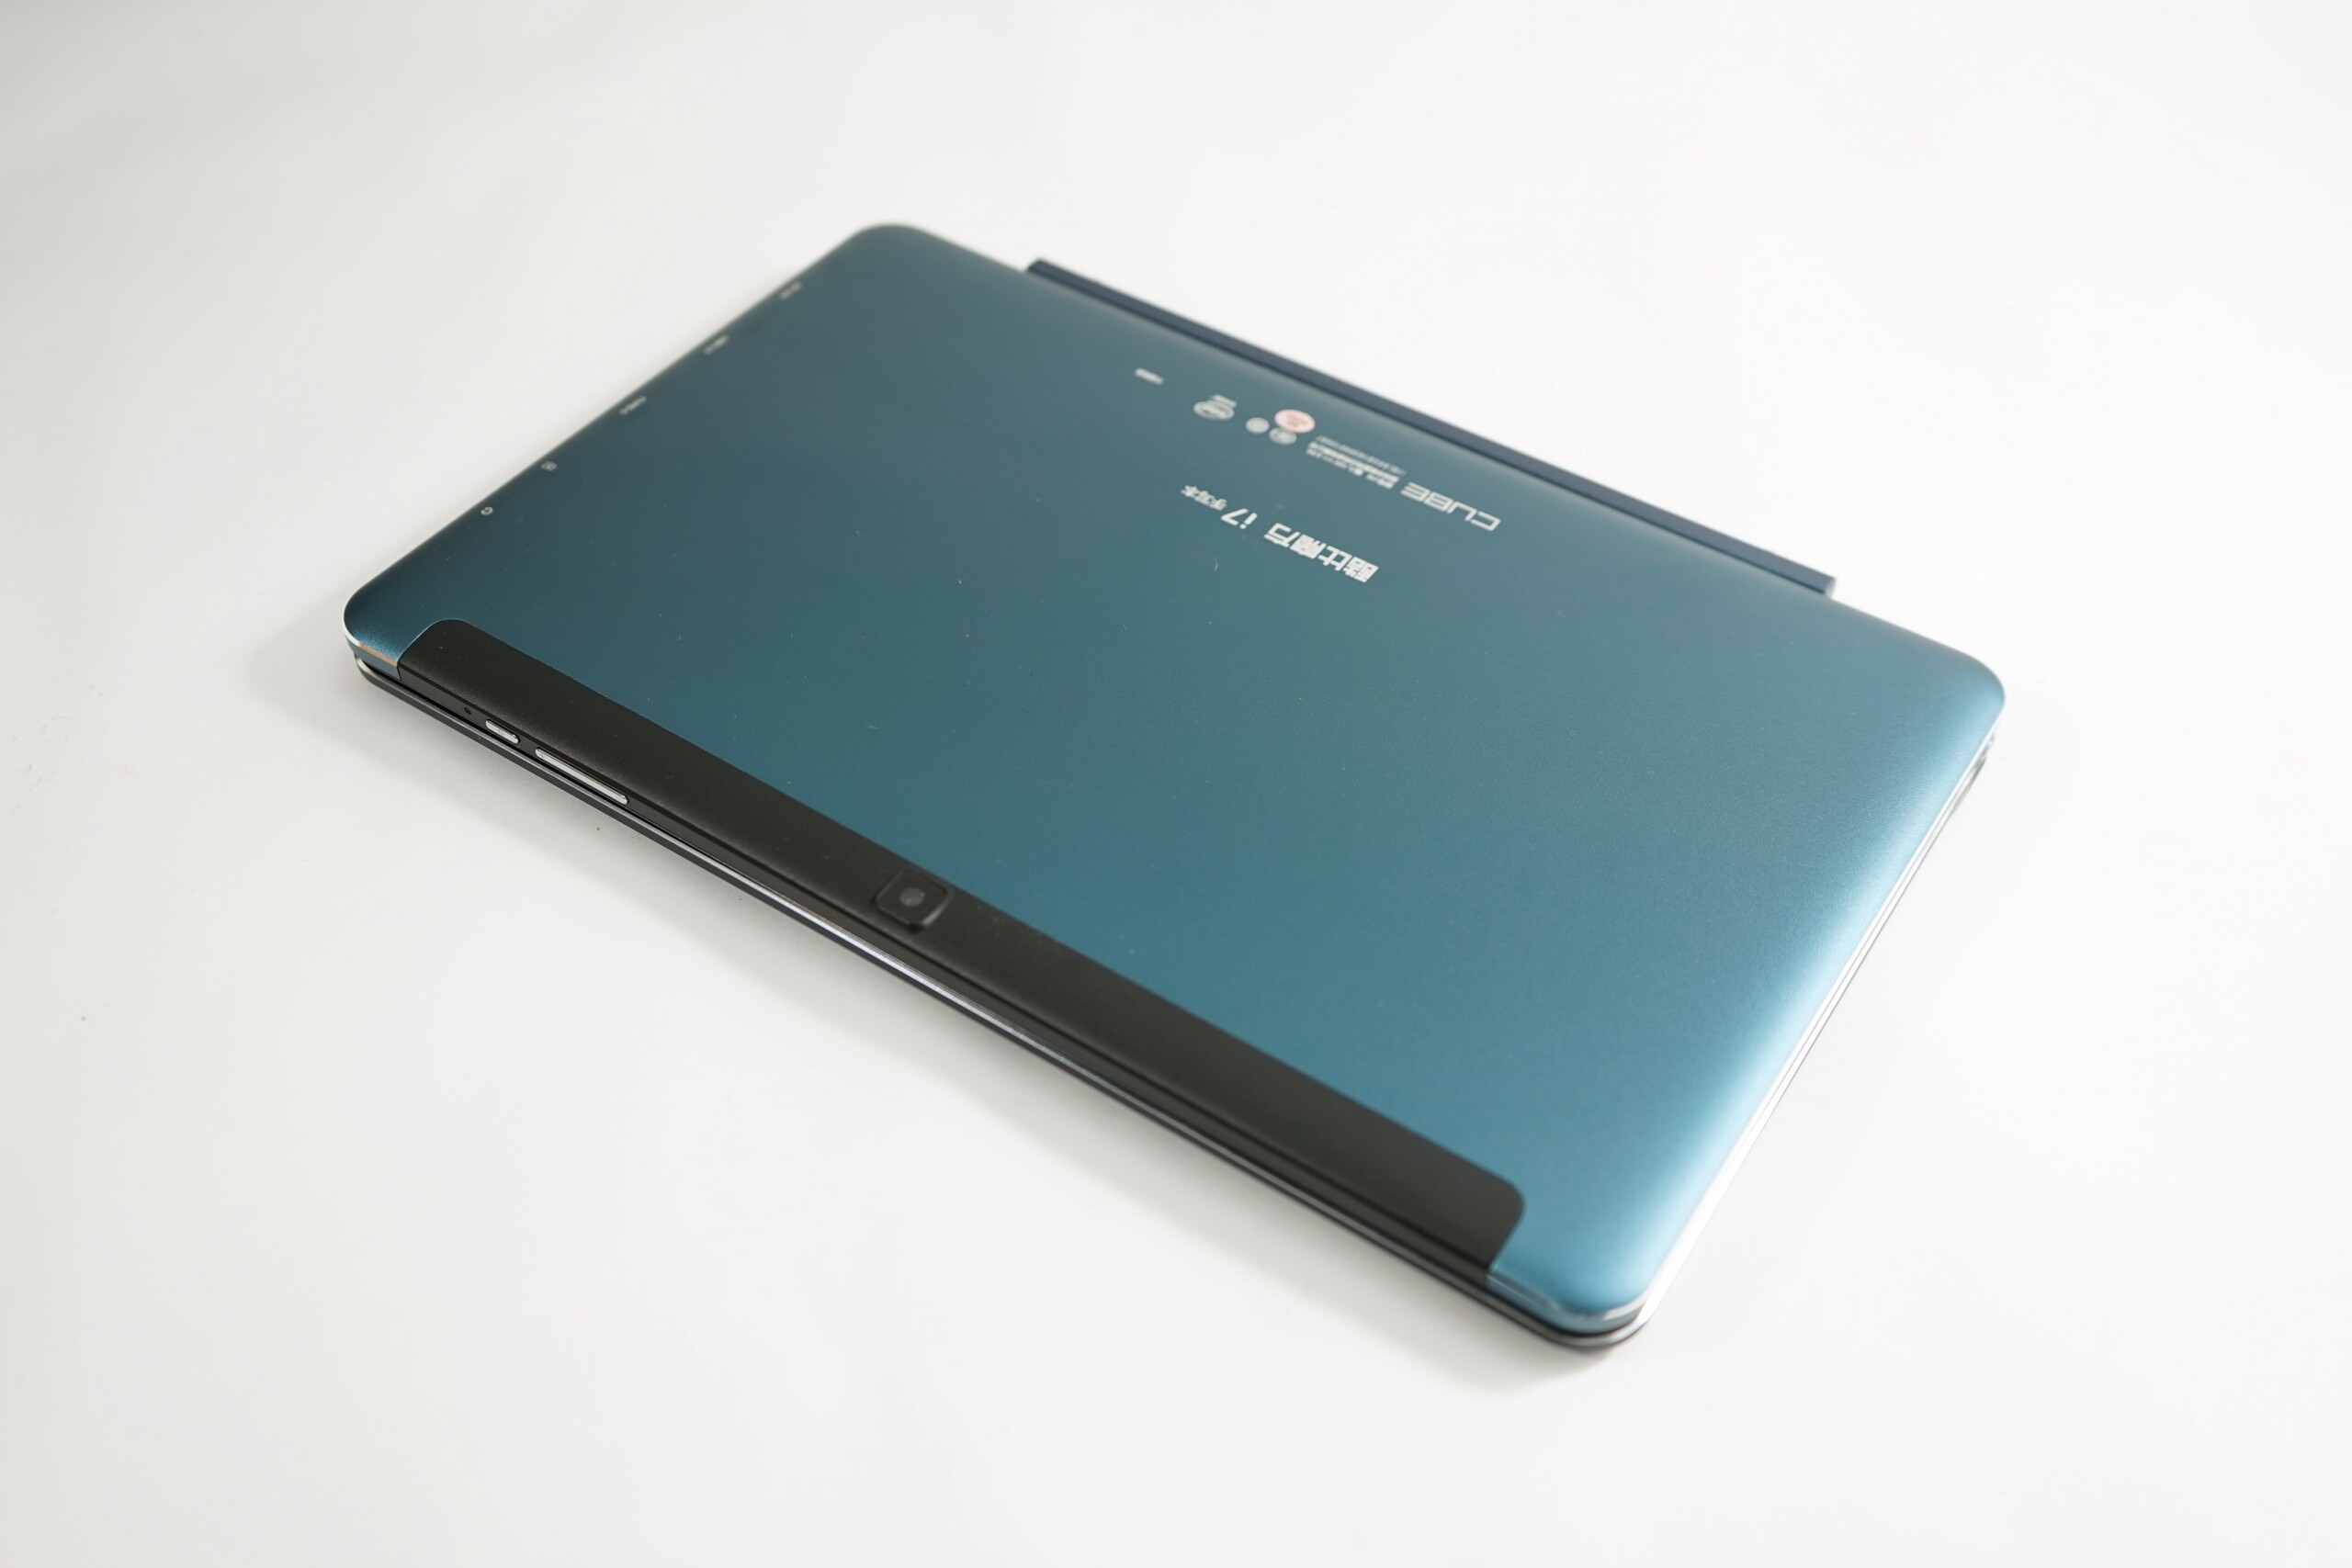
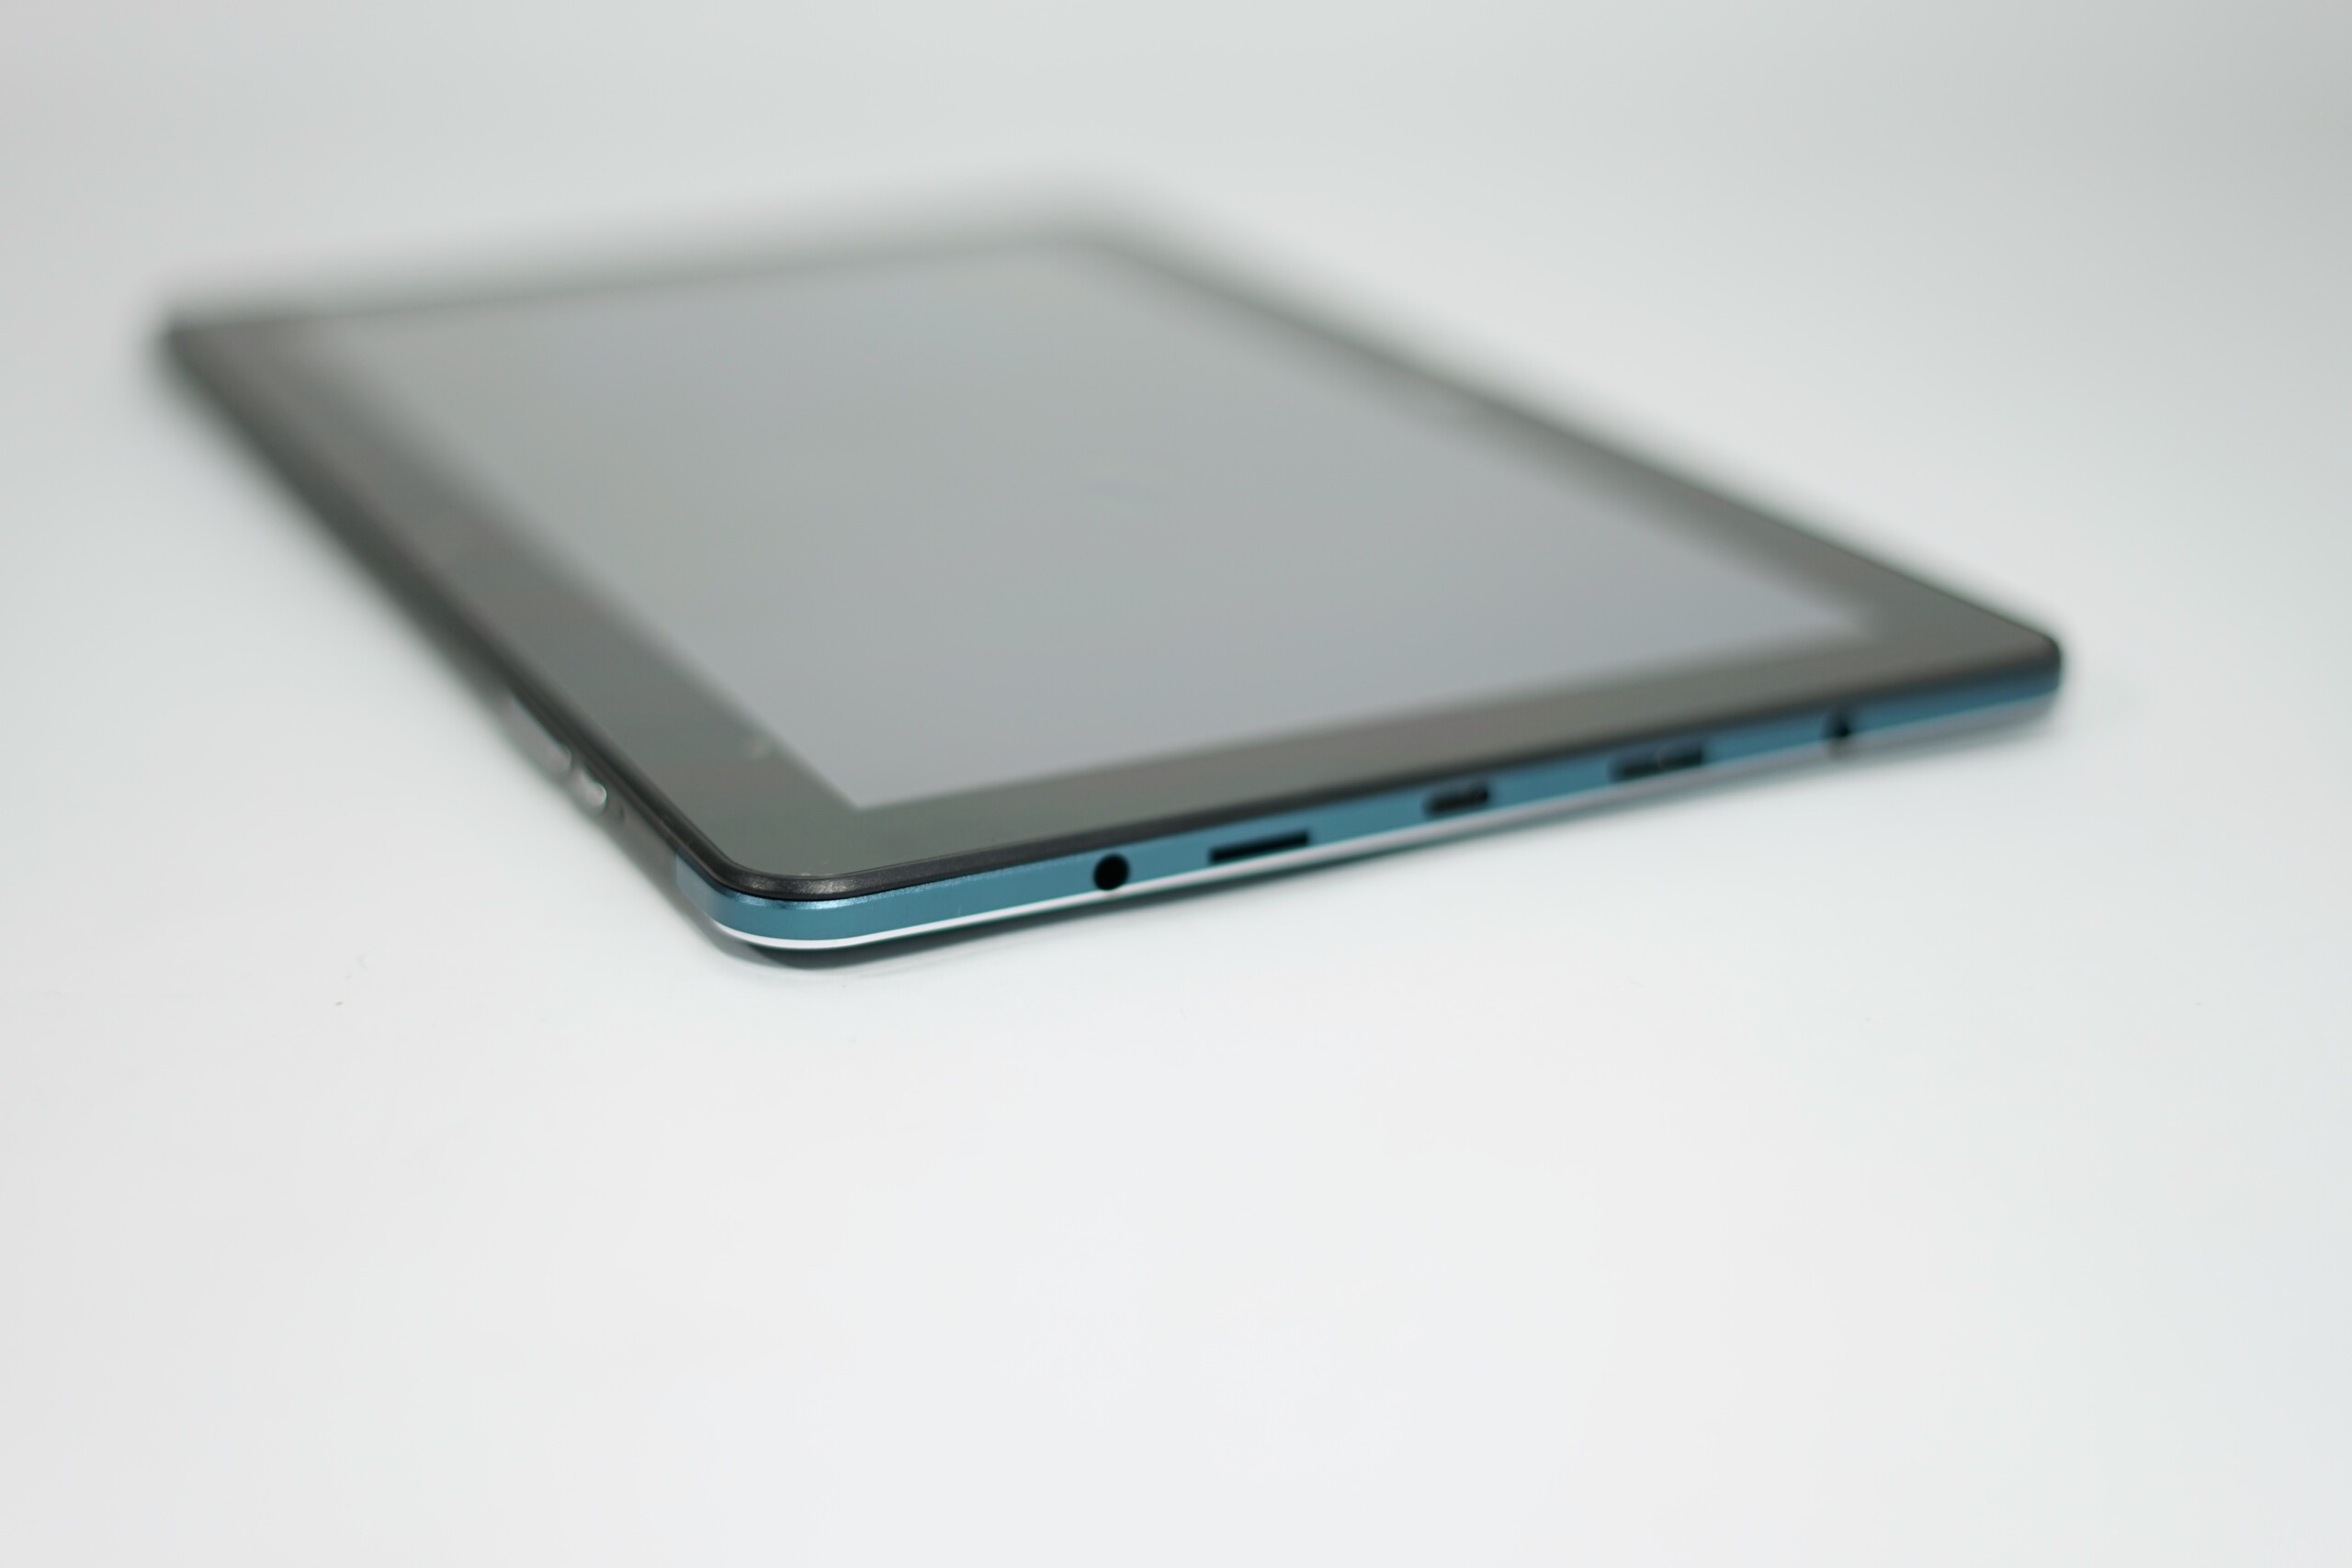
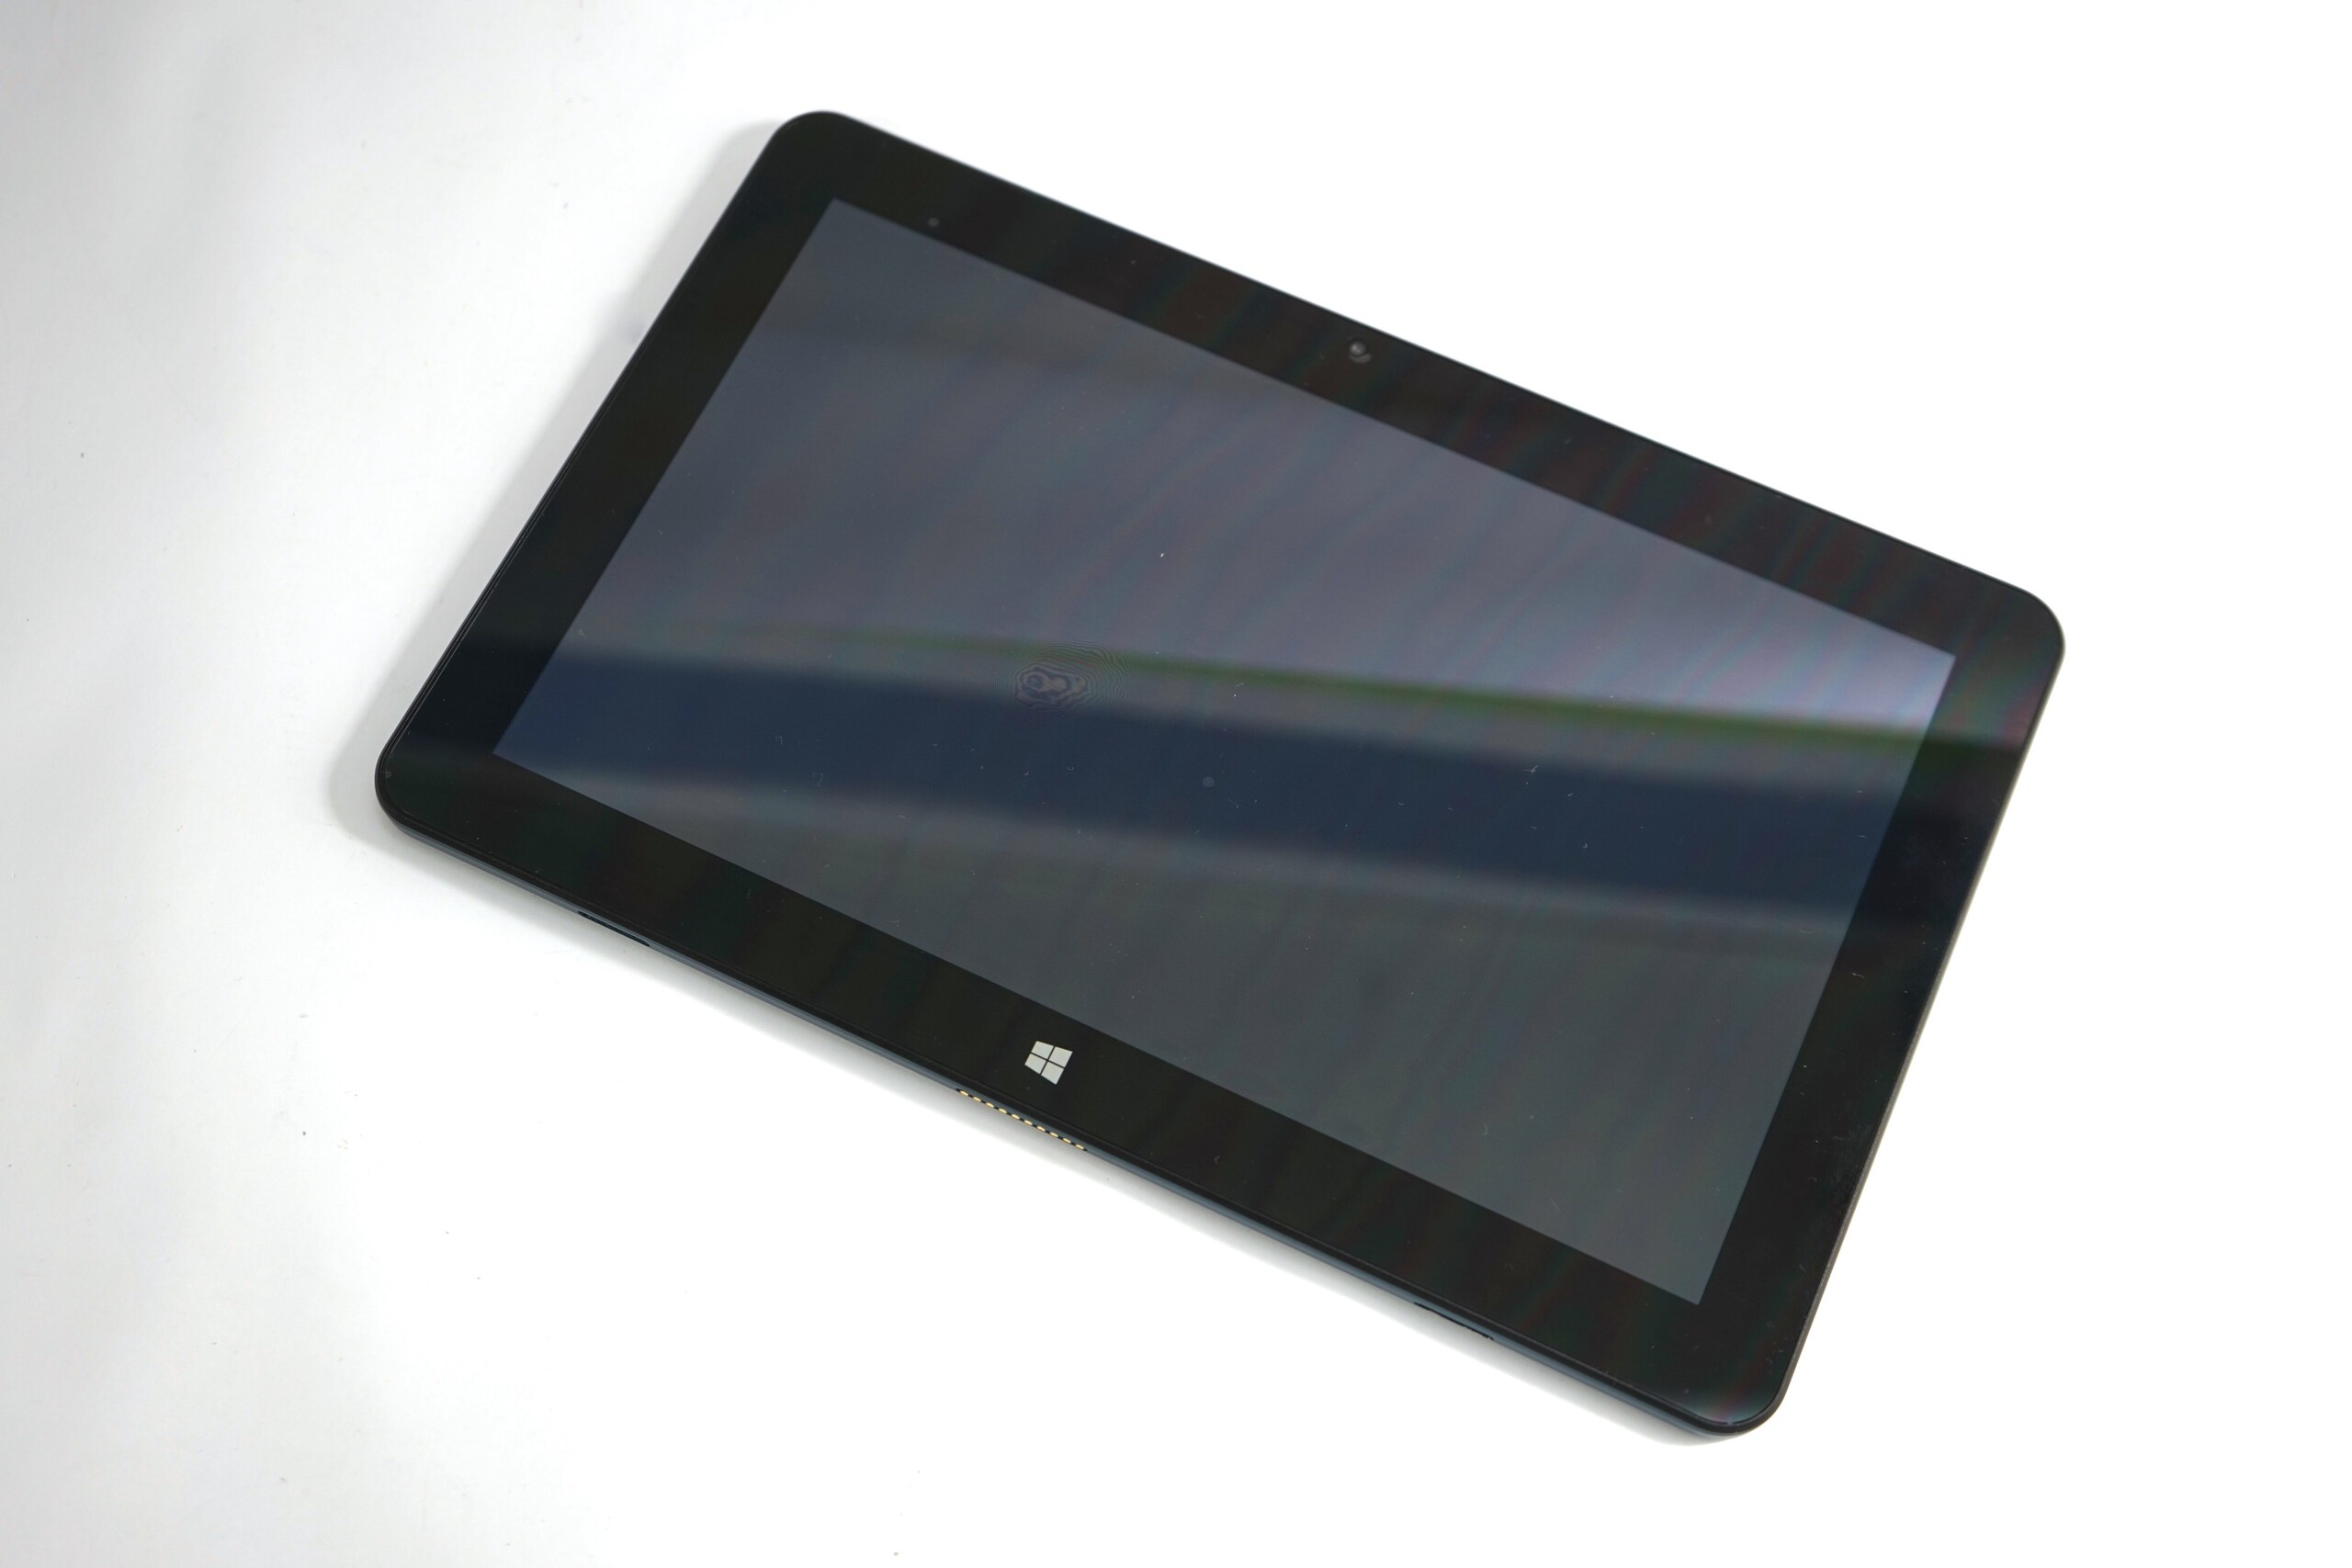
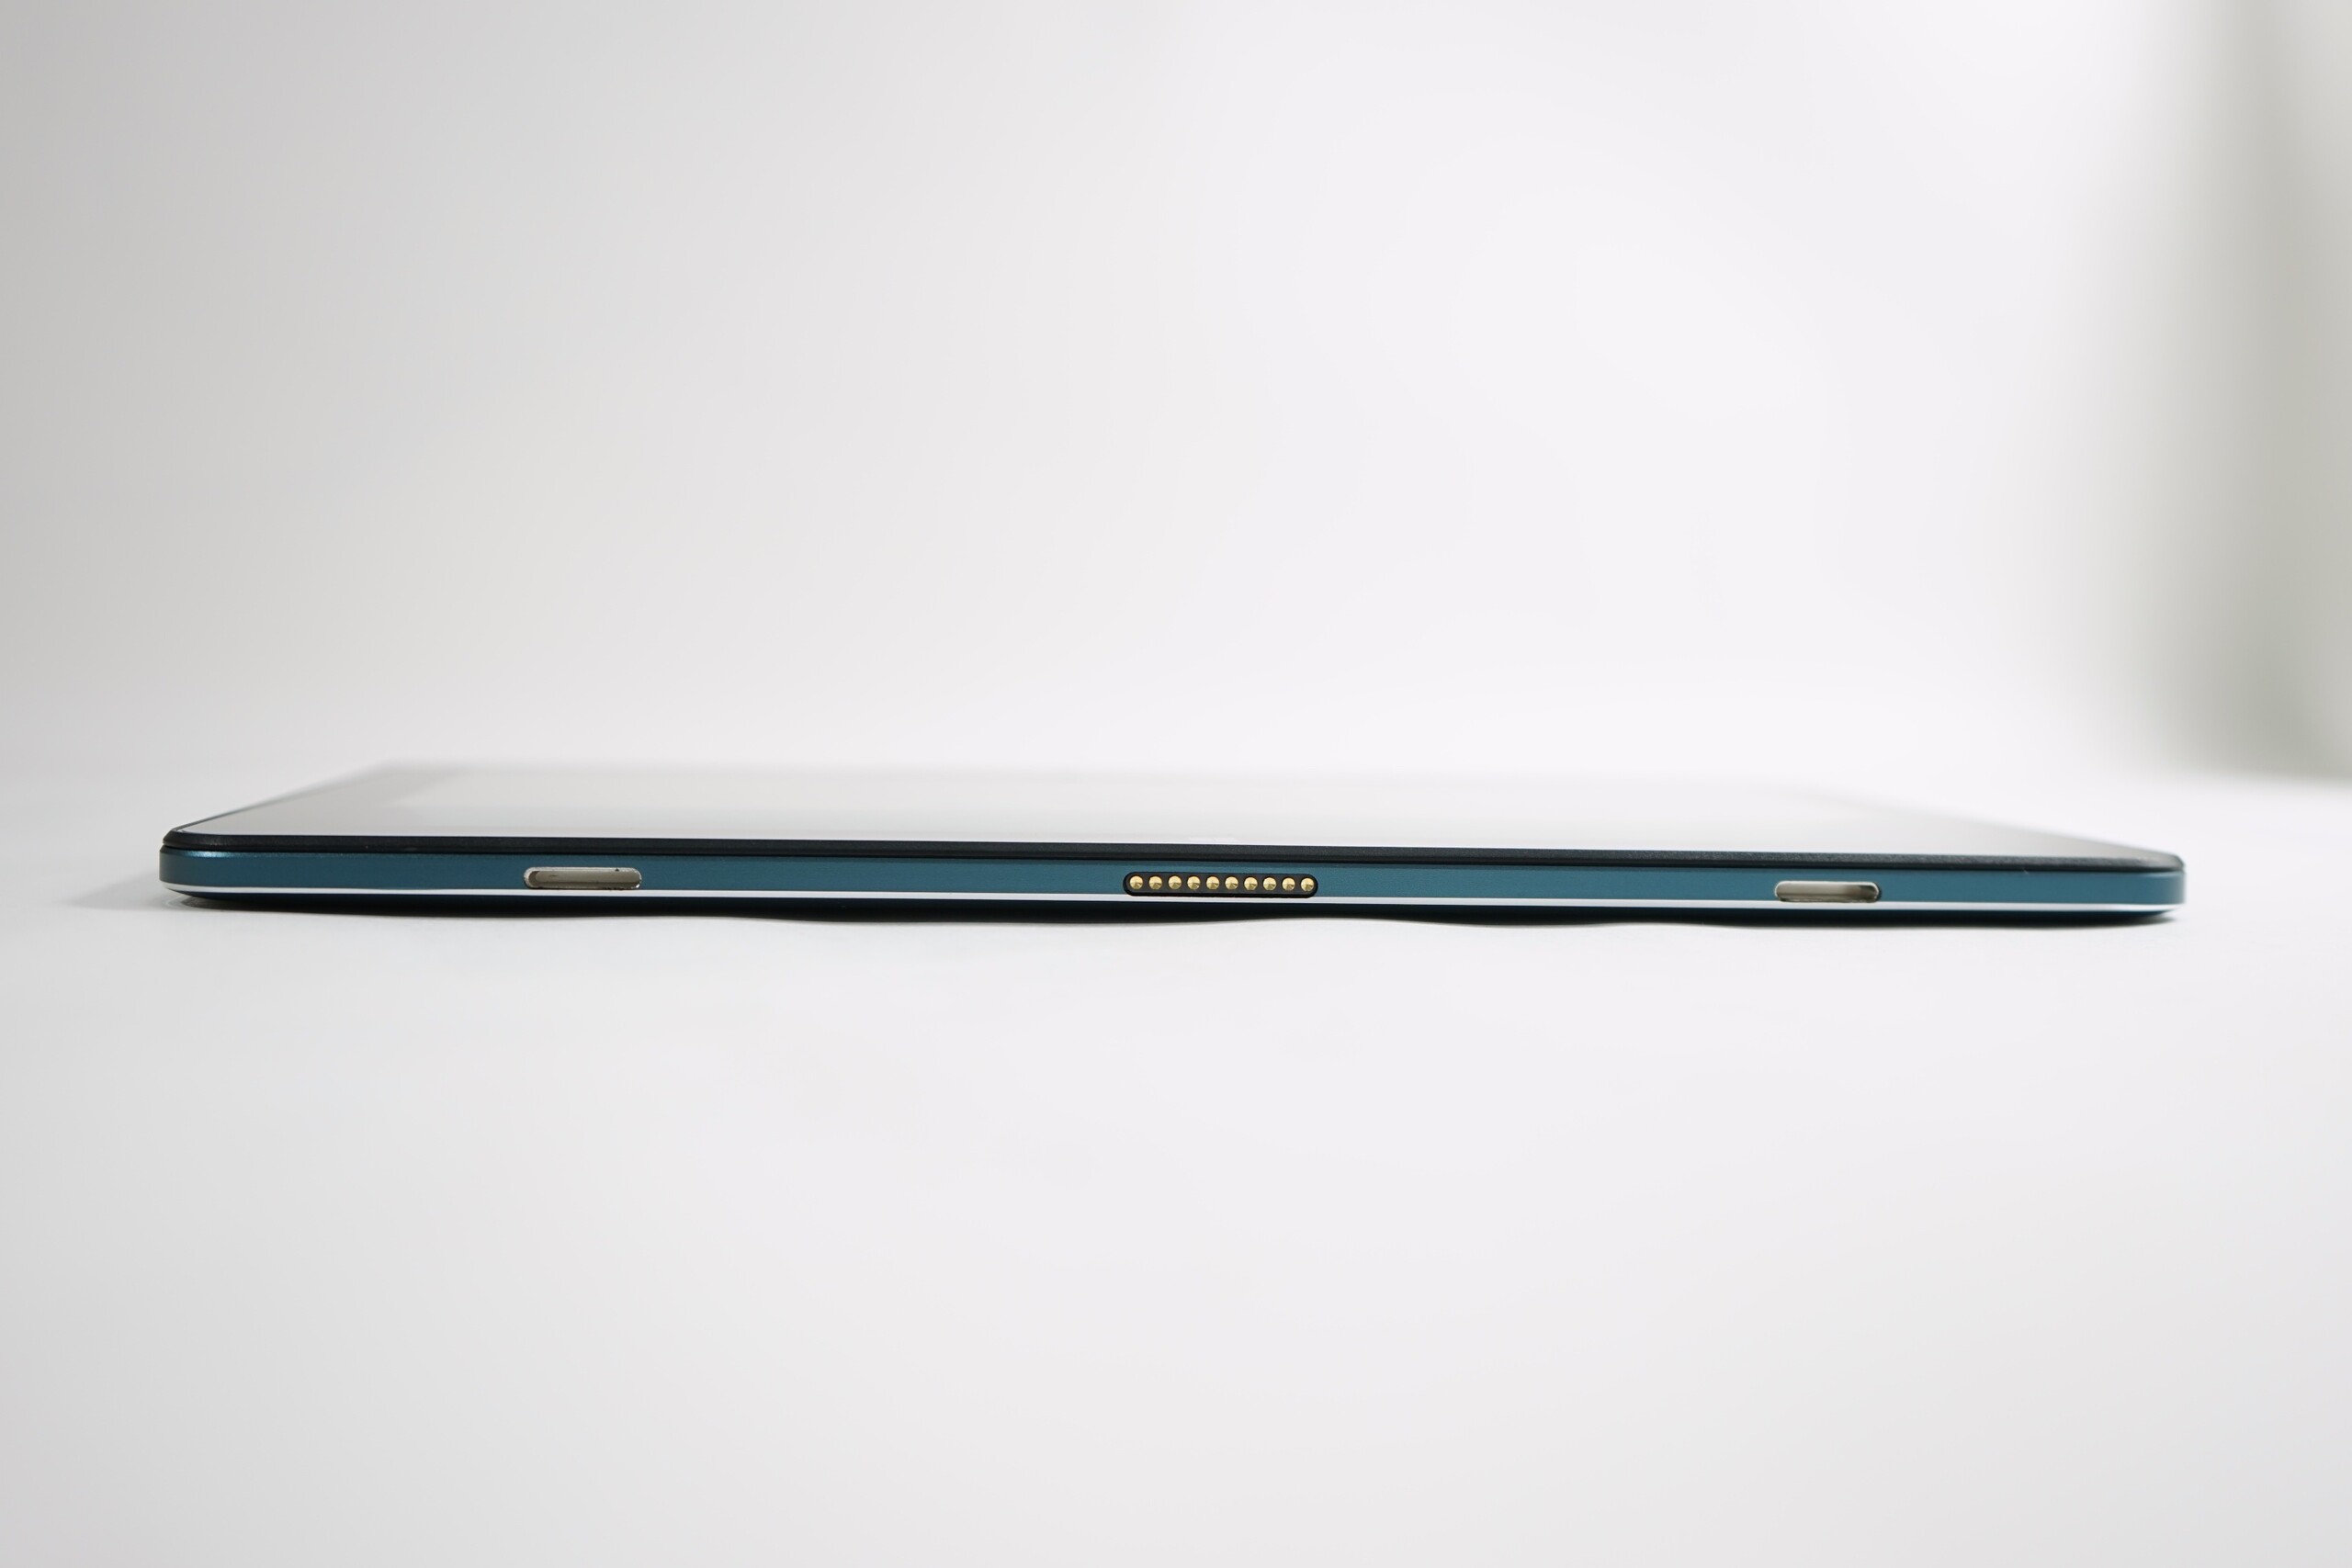
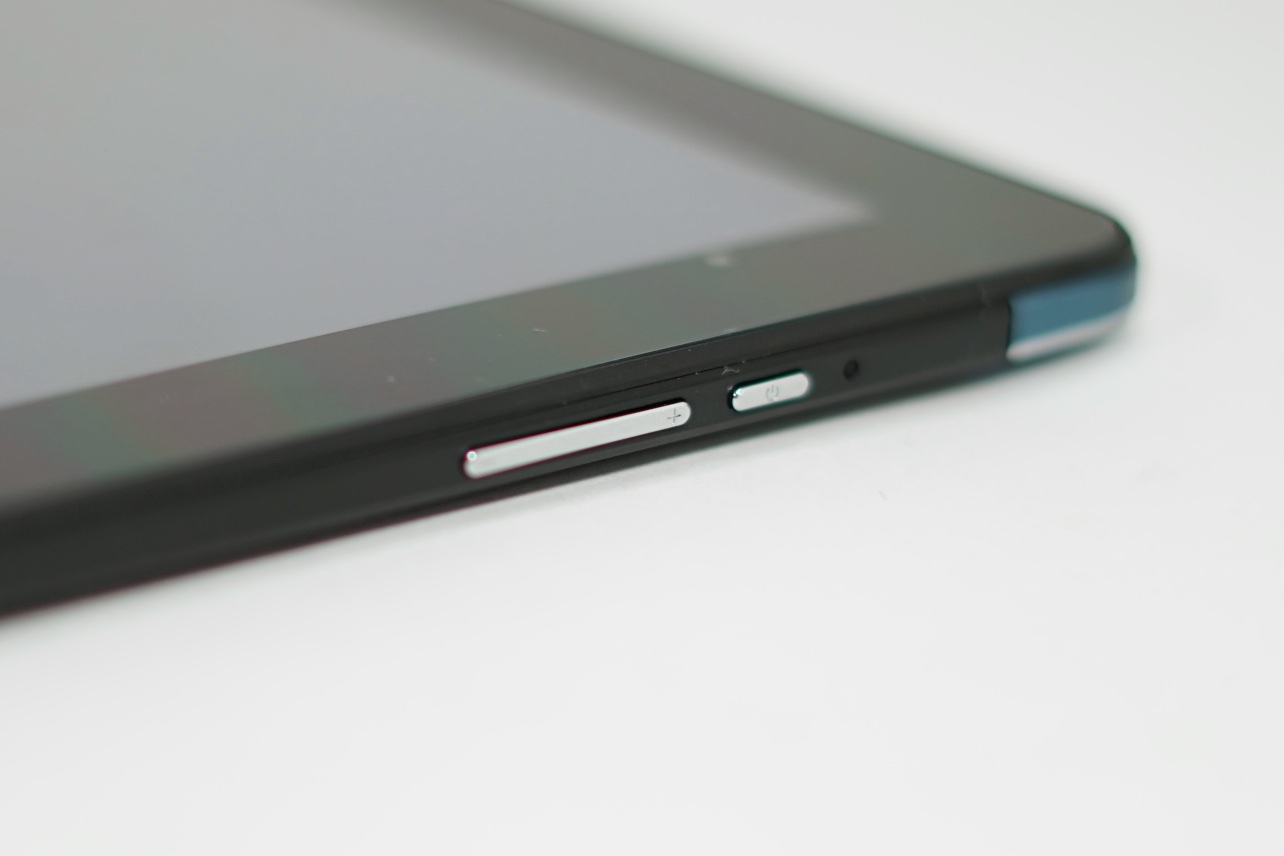
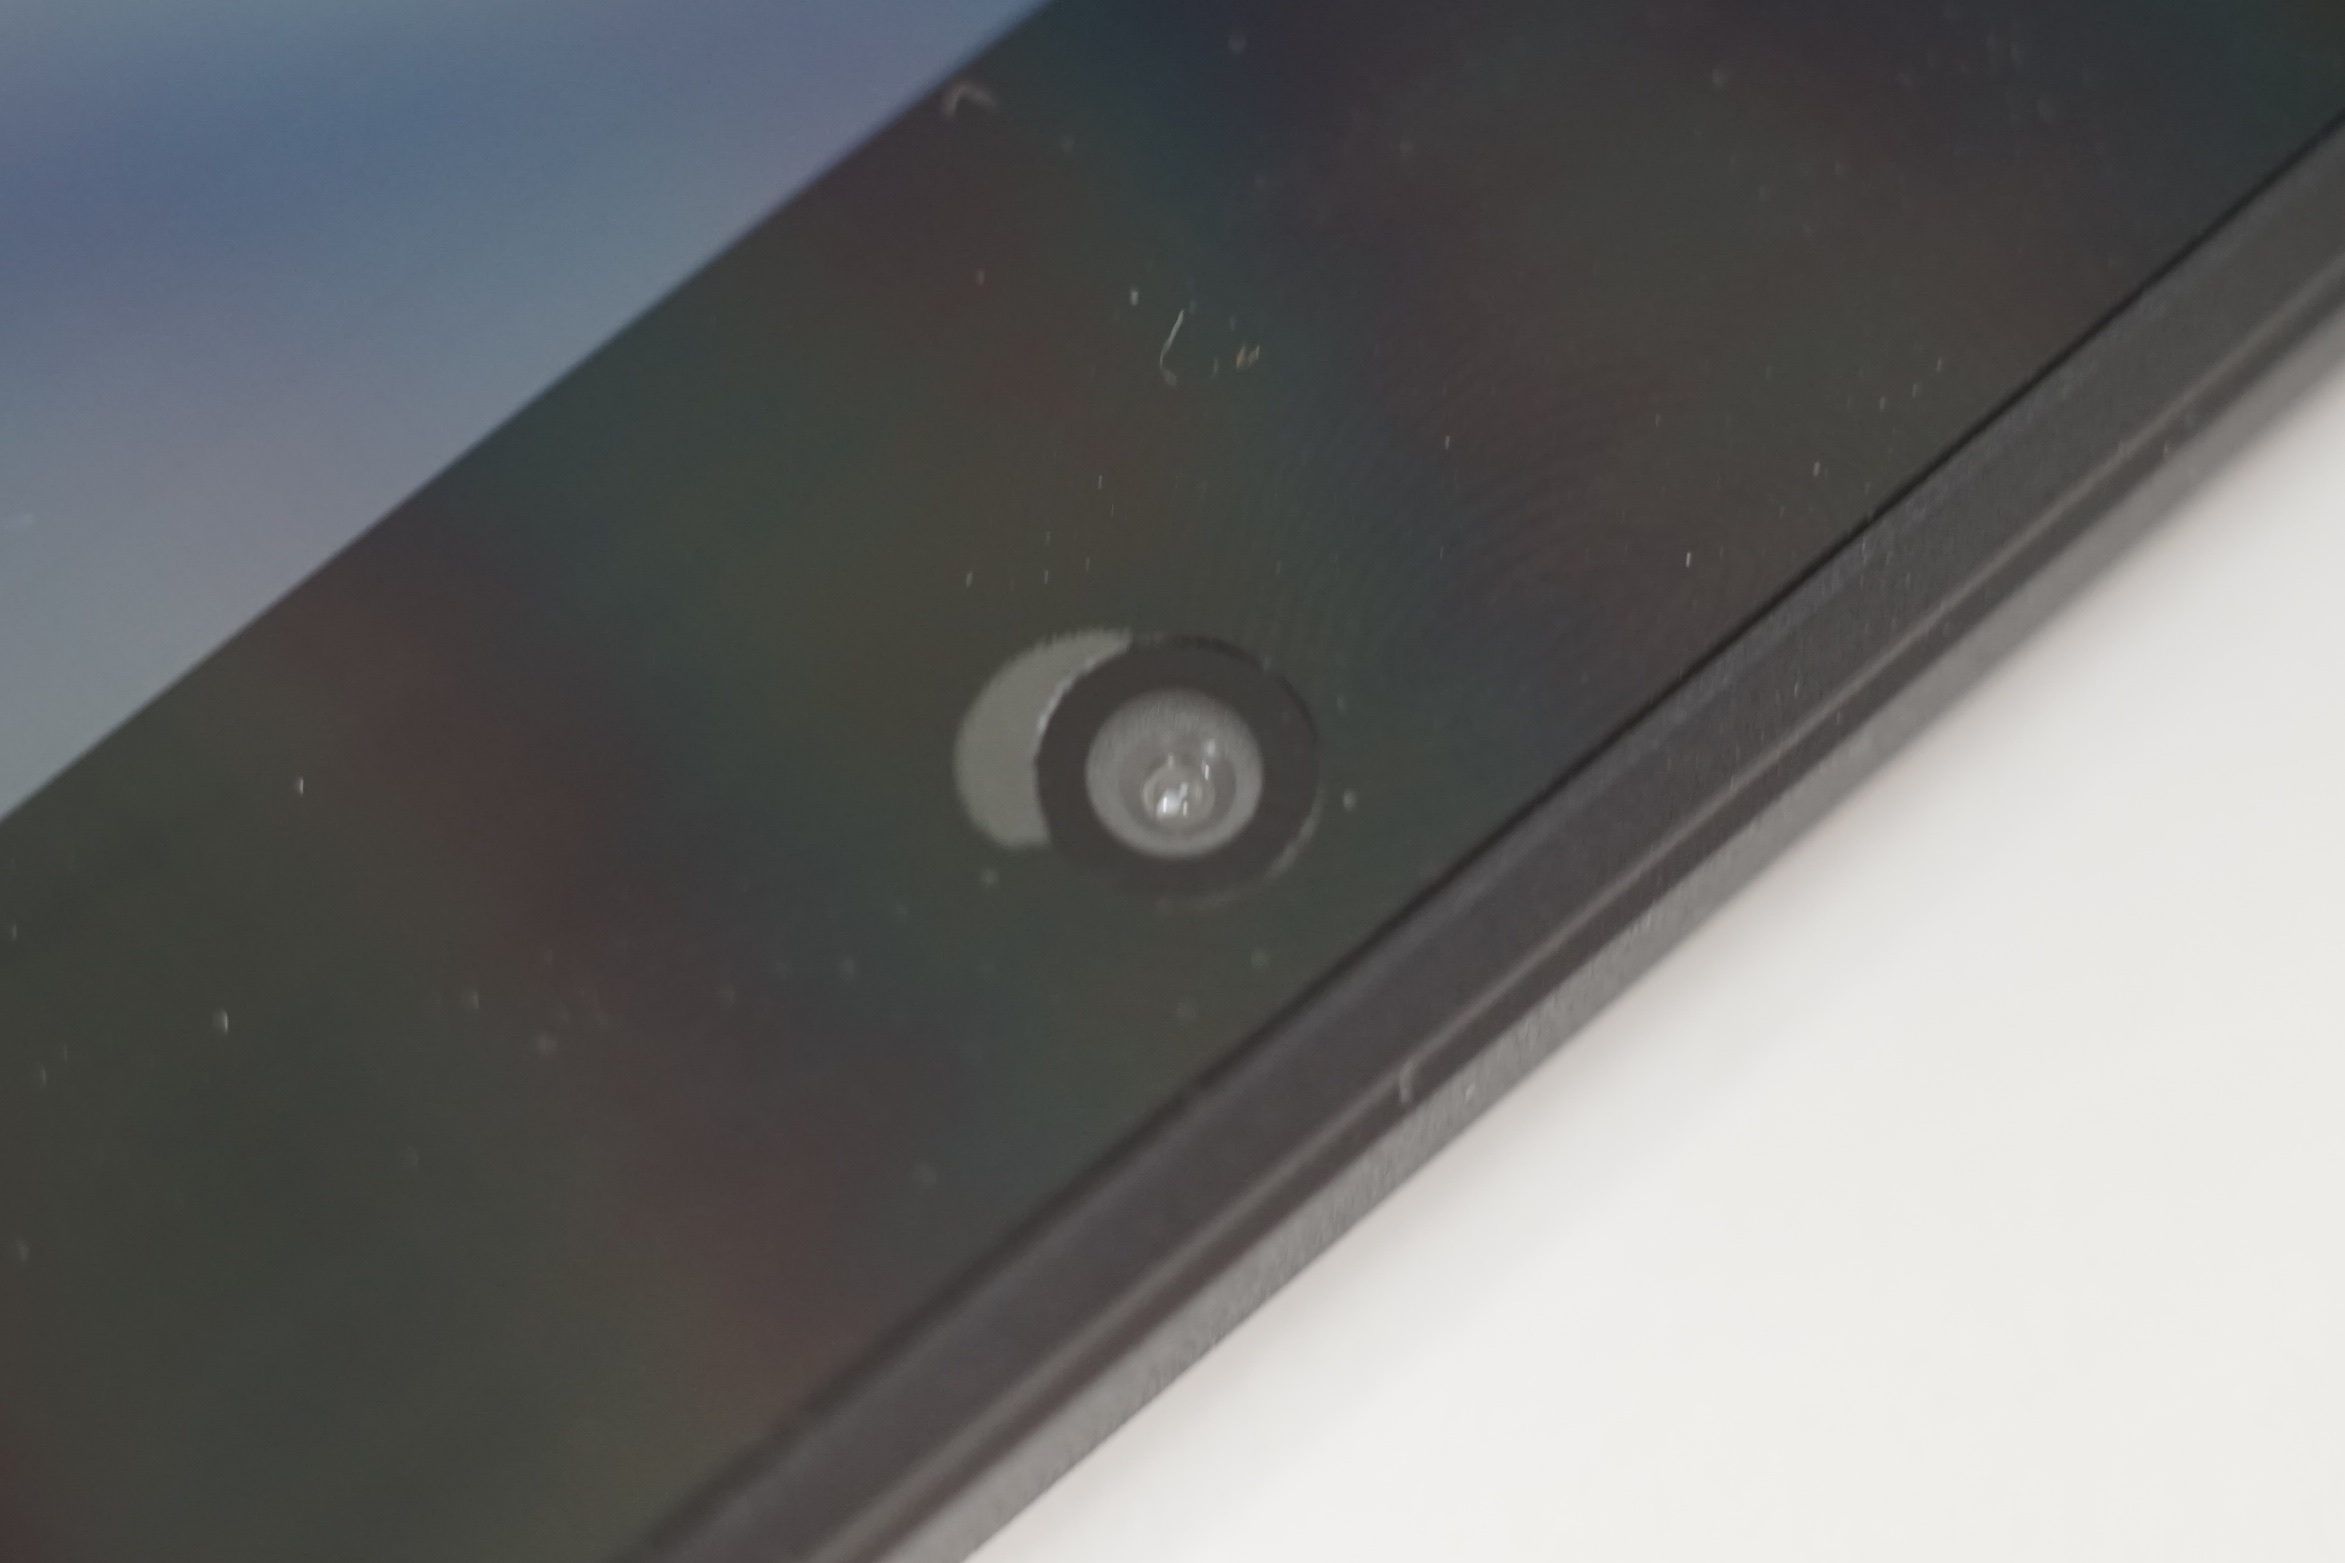
带有键盘扩展坞的酷比魔方i7以它的价格给我们留下了很好的印象。它的制造工艺,设计与其内置的Core m3处理器的性能都是显著的加分项。它的屏幕的优势在于良好的可视角度和对比度,尽管色彩还原度不是很好。续航能力处于平均水平,电池无法支撑最高亮度下进行四个小时的中等负载使用。酷比魔方在固态硬盘、扬声器、相机、触摸板方面有明显的缩水痕迹。酷比魔方i7现在在GearBest有售,包含运费的售价为315欧元(约合352美金)(优惠价,原价为556欧元,约合622美金)。但17.5%的消费税会使得价格上涨到700欧元(约合783美金),且德国19%的进口税可能要被计入在总价内。GearBest提供名为"Germany Express"的选项据称是无需支付这些费用的。但是,它需要被送回中国才能够得到保修。
注:本文是基于完整评测的缩减版本,阅读完整的英文评测,请点击这里。
Cube i7 Book CDK09
-
09/28/2016 v5.1(old)
Peter Strasser, Klaus Hinum