 Deutsch
 English
 Español
 Français
 Italiano
 Nederlands
 Polski
 Português
 Русский
 Türkçe
 Svenska
 Chinese
 Magyar
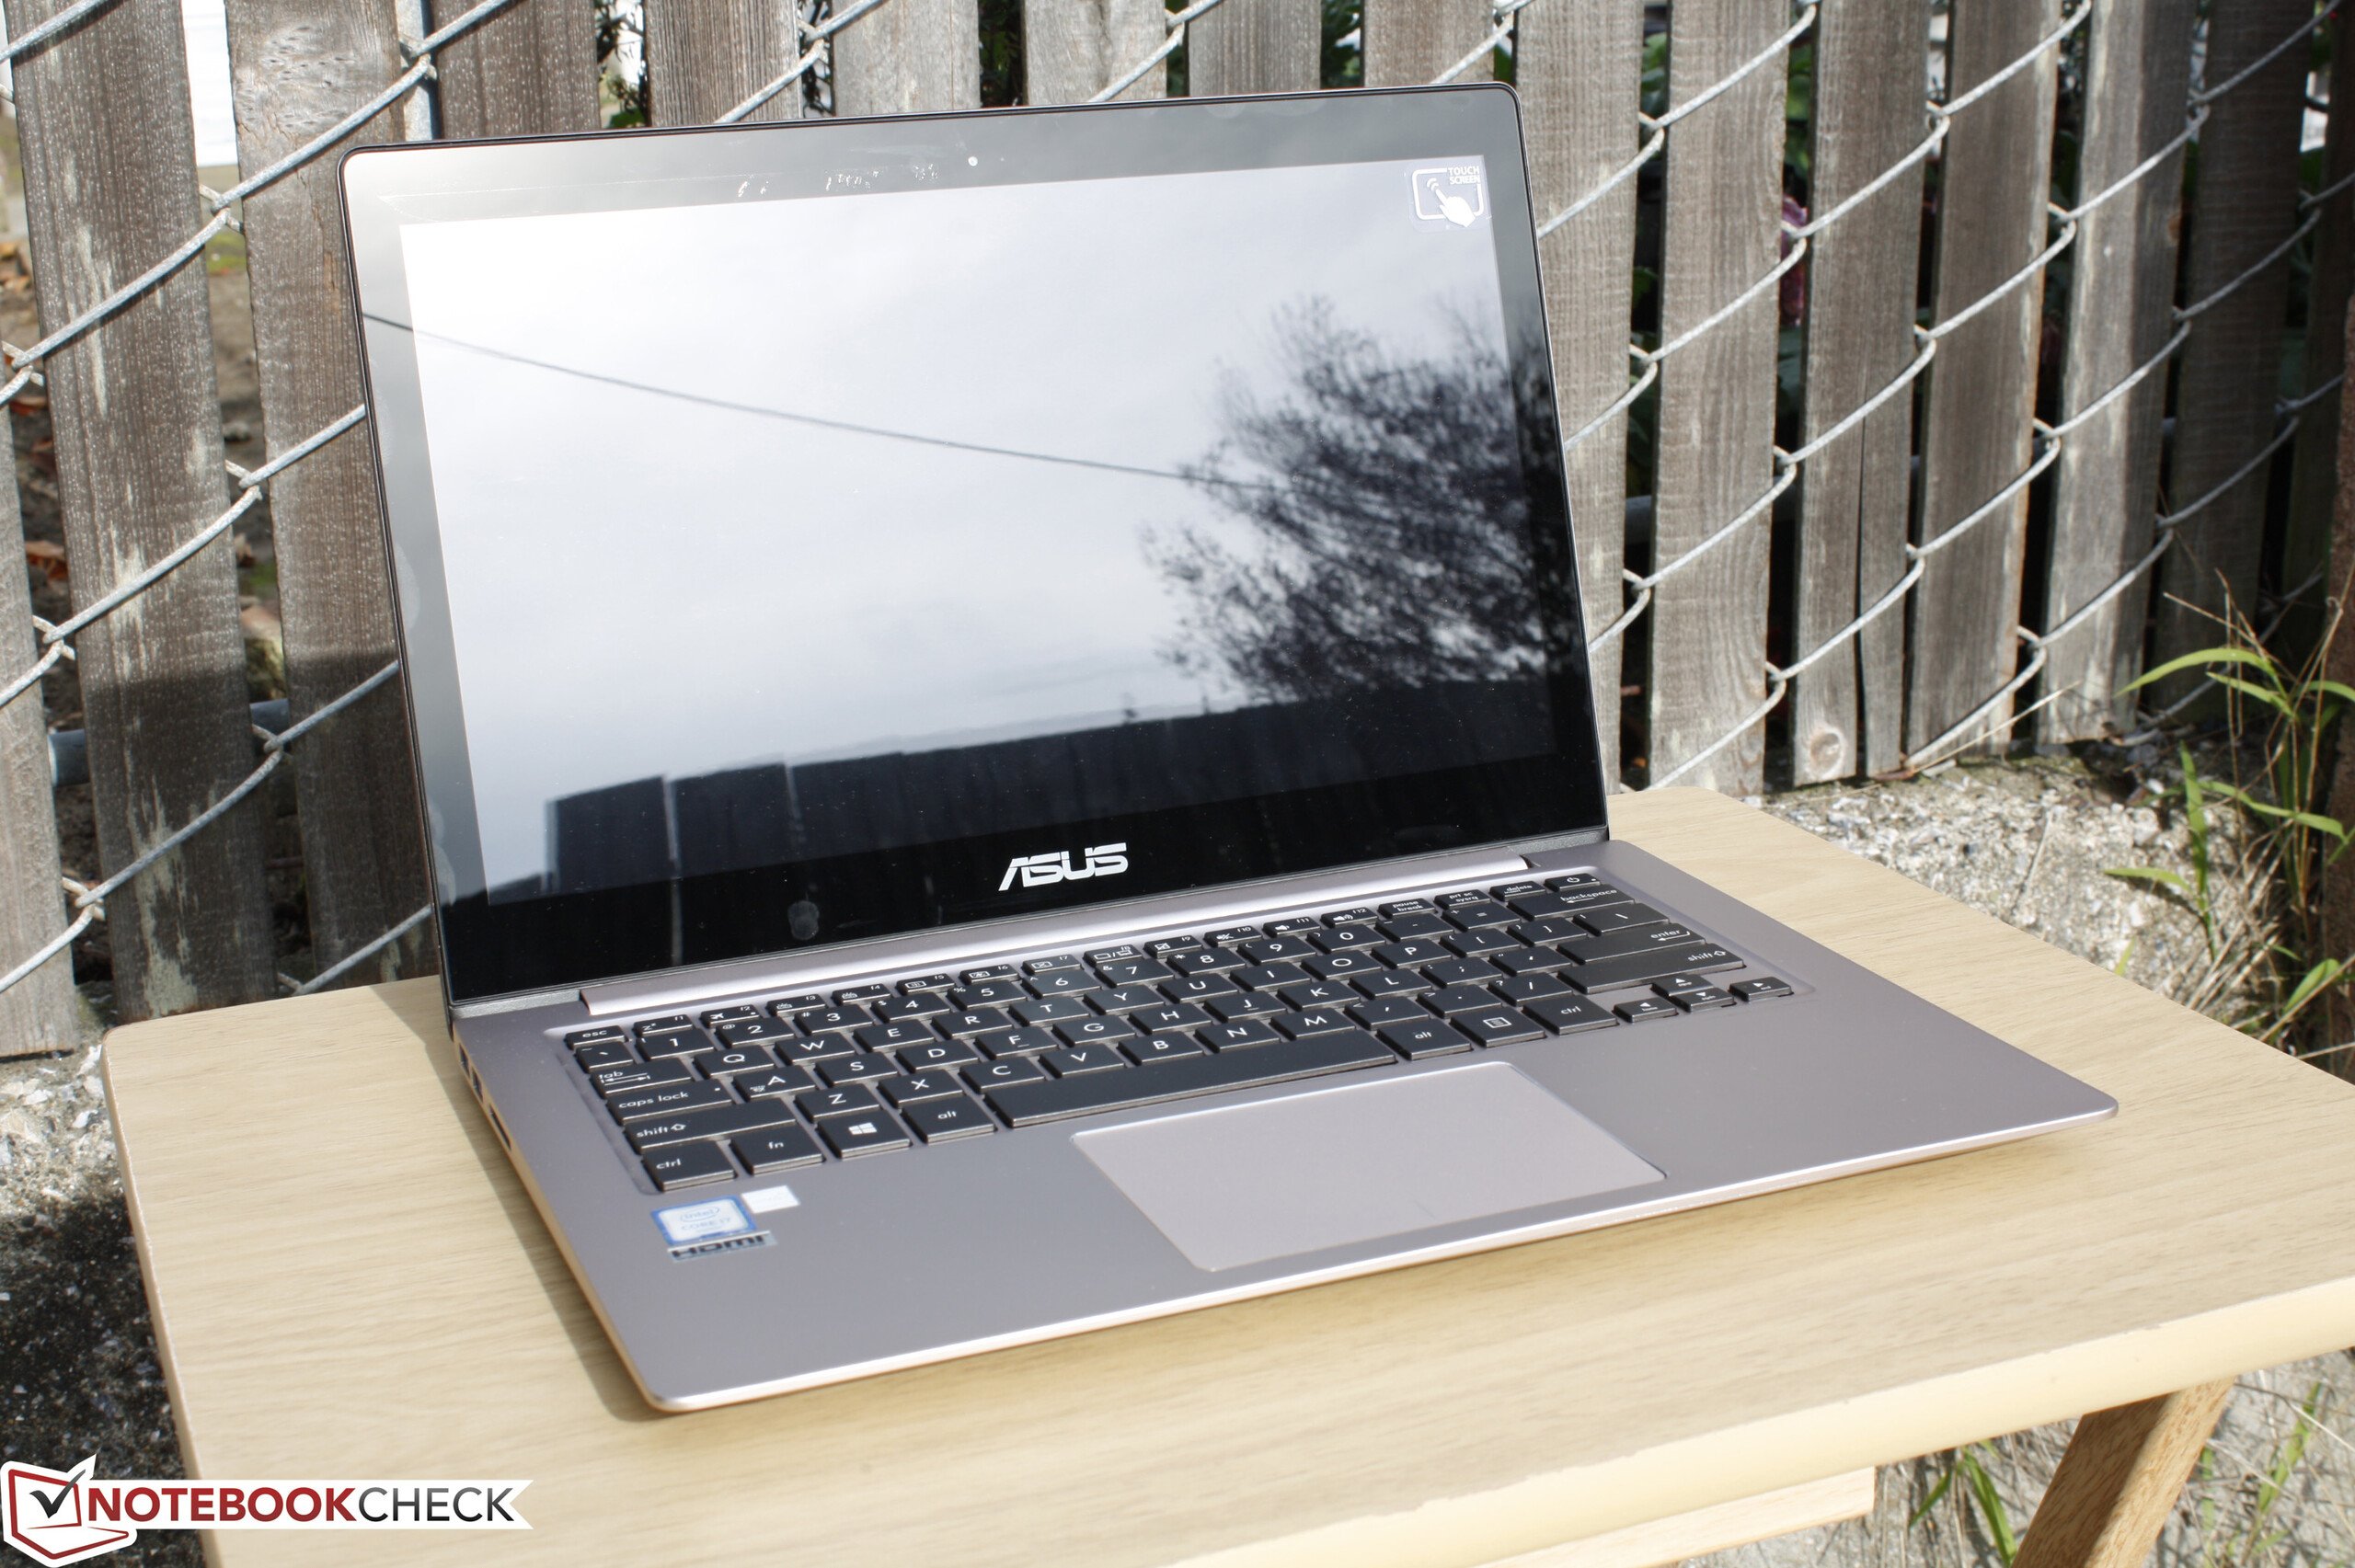
华硕 Zenbook UX303UB-DH74T 笔记本电脑简短评测


| |||||||||||||||||||||||||
Brightness Distribution: 84 %
Center on Battery: 291.4 cd/m²
Contrast: 305:1 (Black: 0.954 cd/m²)
ΔE Color 4.63 | 0.5-29.43 Ø5
ΔE Greyscale 5.65 | 0.57-98 Ø5.3
85.2% sRGB (Argyll 1.6.3 3D)
55.2% AdobeRGB 1998 (Argyll 1.6.3 3D)
62.5% AdobeRGB 1998 (Argyll 2.2.0 3D)
85.4% sRGB (Argyll 2.2.0 3D)
60.9% Display P3 (Argyll 2.2.0 3D)
Gamma: 2.16
| Asus Zenbook UX303UB-DH74T 13.30, 3200x1800 | Asus Zenbook UX303UB-R4100T 13.30, 1920x1080 | Asus Zenbook UX305LA-FC012H 13.30, 1920x1080 | HP Spectre x360 13-4104ng 13.30, 2560x1440 | HP Envy 13-d000ng 13.30, 3200x1800 | Dell XPS 13 2016 i7 256GB QHD 13.30, 3200x1800 | |
|---|---|---|---|---|---|---|
| Display | 9% | 5% | 9% | 4% | 6% | |
| Display P3 Coverage | 60.9 | 66.9 10% | 63.9 5% | 66.8 10% | 64 5% | 63.6 4% |
| sRGB Coverage | 85.4 | 92.3 8% | 91.6 7% | 92.8 9% | 88.8 4% | 93.6 10% |
| AdobeRGB 1998 Coverage | 62.5 | 67.6 8% | 65 4% | 67.3 8% | 65 4% | 65.5 5% |
| Response Times | -46% | 47% | 13% | 93% | ||
| Response Time Grey 50% / Grey 80% * | 44.4 ? | 68 ? -53% | 24 ? 46% | 37.6 ? 15% | 40 ? 10% | |
| Response Time Black / White * | 36 ? | 35 ? 3% | 19 ? 47% | 26 ? 28% | 30 ? 17% | |
| PWM Frequency | 1389 | 178 ? -87% | 1316 ? -5% | 4900 ? 253% | ||
| Screen | 46% | 54% | 40% | 21% | 59% | |
| Brightness middle | 291.4 | 385 32% | 349 20% | 324 11% | 291 0% | 285 -2% |
| Brightness | 270 | 394 46% | 338 25% | 324 20% | 276 2% | 281 4% |
| Brightness Distribution | 84 | 89 6% | 87 4% | 90 7% | 82 -2% | 90 7% |
| Black Level * | 0.954 | 0.41 57% | 0.25 74% | 0.34 64% | 0.63 34% | 0.18 81% |
| Contrast | 305 | 939 208% | 1396 358% | 953 212% | 462 51% | 1583 419% |
| Colorchecker dE 2000 * | 4.63 | 3.84 17% | 5.49 -19% | 4.36 6% | 2.76 40% | 4.89 -6% |
| Greyscale dE 2000 * | 5.65 | 3.79 33% | 5.43 4% | 4.62 18% | 2.61 54% | 5.16 9% |
| Gamma | 2.16 102% | 2.23 99% | 2.17 101% | 2.18 101% | 2.31 95% | 2.15 102% |
| CCT | 6320 103% | 6499 100% | 7055 92% | 6857 95% | 6731 97% | 7106 91% |
| Color Space (Percent of AdobeRGB 1998) | 55.2 | 60 9% | 60 9% | 60 9% | 57.5 4% | 59 7% |
| Color Space (Percent of sRGB) | 85.2 | 92 8% | 92 8% | 93 9% | 88.7 4% | 93 9% |
| Total Average (Program / Settings) | 3% /
20% | 30% /
42% | 32% /
34% | 13% /
16% | 53% /
55% |
* ... smaller is better
Display Response Times
| ↔ Response Time Black to White | ||
|---|---|---|
| 36 ms ... rise ↗ and fall ↘ combined | ↗ 15.6 ms rise | 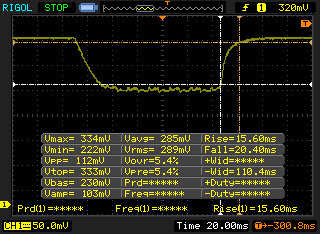 |
| ↘ 20.4 ms fall | ||
| The screen shows slow response rates in our tests and will be unsatisfactory for gamers. In comparison, all tested devices range from 0.1 (minimum) to 240 (maximum) ms. » 93 % of all devices are better. This means that the measured response time is worse than the average of all tested devices (21.5 ms). | ||
| ↔ Response Time 50% Grey to 80% Grey | ||
| 44.4 ms ... rise ↗ and fall ↘ combined | ↗ 19.6 ms rise | 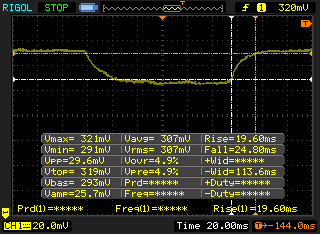 |
| ↘ 24.8 ms fall | ||
| The screen shows slow response rates in our tests and will be unsatisfactory for gamers. In comparison, all tested devices range from 0.2 (minimum) to 636 (maximum) ms. » 72 % of all devices are better. This means that the measured response time is worse than the average of all tested devices (33.8 ms). | ||
Screen Flickering / PWM (Pulse-Width Modulation)
| Screen flickering / PWM detected | 1389 Hz | 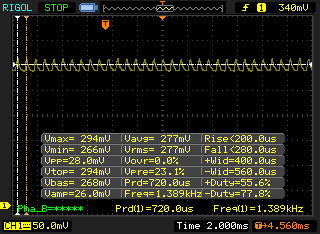 | |
The display backlight flickers at 1389 Hz (worst case, e.g., utilizing PWM) . The frequency of 1389 Hz is quite high, so most users sensitive to PWM should not notice any flickering. In comparison: 53 % of all tested devices do not use PWM to dim the display. If PWM was detected, an average of 17942 (minimum: 5 - maximum: 3846000) Hz was measured. | |||

| Cinebench R15 | |
| CPU Single 64Bit (sort by value) | |
| Asus Zenbook UX303UB-DH74T | |
| Eurocom Shark 4 | |
| HP EliteBook Folio 1040 G2 | |
| Dell Inspiron 17 5759-5118 | |
| Toshiba Tecra Z40 A-147 | |
| CPU Multi 64Bit (sort by value) | |
| Asus Zenbook UX303UB-DH74T | |
| Eurocom Shark 4 | |
| HP EliteBook Folio 1040 G2 | |
| Dell Inspiron 17 5759-5118 | |
| Toshiba Tecra Z40 A-147 | |
| Cinebench R11.5 | |
| CPU Single 64Bit (sort by value) | |
| Asus Zenbook UX303UB-DH74T | |
| Eurocom Shark 4 | |
| HP EliteBook Folio 1040 G2 | |
| Dell Inspiron 17 5759-5118 | |
| Toshiba Tecra Z40 A-147 | |
| CPU Multi 64Bit (sort by value) | |
| Asus Zenbook UX303UB-DH74T | |
| Eurocom Shark 4 | |
| HP EliteBook Folio 1040 G2 | |
| Dell Inspiron 17 5759-5118 | |
| Toshiba Tecra Z40 A-147 | |
| Cinebench R10 | |
| Rendering Multiple CPUs 32Bit (sort by value) | |
| Asus Zenbook UX303UB-DH74T | |
| Eurocom Shark 4 | |
| HP EliteBook Folio 1040 G2 | |
| Dell Inspiron 17 5759-5118 | |
| Rendering Single 32Bit (sort by value) | |
| Asus Zenbook UX303UB-DH74T | |
| Eurocom Shark 4 | |
| HP EliteBook Folio 1040 G2 | |
| Dell Inspiron 17 5759-5118 | |
| PCMark 7 - Score (sort by value) | |
| Asus Zenbook UX303UB-DH74T | |
| Apple MacBook Air 13 inch 2015-03 | |
| HP Spectre 13-4001ng x360 | |
| Dell XPS 13 2016 i7 256GB QHD | |
| Asus Zenbook UX305CA-EHM1 | |
| PCMark 8 | |
| Home Score Accelerated v2 (sort by value) | |
| Asus Zenbook UX303UB-DH74T | |
| Apple MacBook Air 13 inch 2015-03 | |
| HP Spectre 13-4001ng x360 | |
| Dell XPS 13 2016 i7 256GB QHD | |
| Asus Zenbook UX305CA-EHM1 | |
| Work Score Accelerated v2 (sort by value) | |
| Asus Zenbook UX303UB-DH74T | |
| Apple MacBook Air 13 inch 2015-03 | |
| HP Spectre 13-4001ng x360 | |
| Dell XPS 13 2016 i7 256GB QHD | |
| Asus Zenbook UX305CA-EHM1 | |
| Creative Score Accelerated v2 (sort by value) | |
| Asus Zenbook UX303UB-DH74T | |
| Apple MacBook Air 13 inch 2015-03 | |
| HP Spectre 13-4001ng x360 | |
| Asus Zenbook UX305CA-EHM1 | |
| PCMark 7 Score | 5135 points | |
| PCMark 8 Home Score Accelerated v2 | 2918 points | |
| PCMark 8 Creative Score Accelerated v2 | 3837 points | |
| PCMark 8 Work Score Accelerated v2 | 3862 points | |
Help | ||

| Asus Zenbook UX303UB-DH74T GeForce 940M, 6500U, CUK Cyclone SSD 1TB | Aorus X3 Plus v5 GeForce GTX 970M, 6700HQ, Samsung SM951 MZVPV512HDGL m.2 PCI-e | Dell XPS 13 2016 i7 256GB QHD HD Graphics 520, 6500U, Samsung PM951 NVMe MZ-VLV256D | Lenovo Yoga 900-13ISK 80MK HD Graphics 520, 6500U, Samsung SSD PM871 MZNLN512HCJH | Lenovo Ideapad Y700-17 80QK7709PB GeForce GTX 960M, 6700HQ, Samsung SSD 850 EVO 500GB | |
|---|---|---|---|---|---|
| AS SSD | 151% | 53% | 18% | 11% | |
| Copy Game MB/s | 392.8 | 927 136% | 298.7 -24% | ||
| Copy Program MB/s | 233.7 | 368.6 58% | 249.6 7% | ||
| Copy ISO MB/s | 382.5 | 1158 203% | 364.5 -5% | ||
| Score Total | 882 | 2652 201% | 1603 82% | 1129 28% | 853 -3% |
| Score Write | 373 | 630 69% | 391 5% | 429 15% | 279 -25% |
| Score Read | 333 | 1345 304% | 809 143% | 458 38% | 372 12% |
| Access Time Write * | 0.051 | 0.032 37% | 0.034 33% | 0.039 24% | 0.035 31% |
| Access Time Read * | 0.14 | 0.041 71% | 0.071 49% | 0.054 61% | 0.053 62% |
| 4K-64 Write | 261.1 | 368.3 41% | 263.7 1% | 303 16% | 138.6 -47% |
| 4K-64 Read | 256.9 | 1113 333% | 698 172% | 374.8 46% | 286 11% |
| 4K Write | 71.3 | 114 60% | 97.6 37% | 80.6 13% | 93.7 31% |
| 4K Read | 25.99 | 46.24 78% | 38.21 47% | 32.29 24% | 34.86 34% |
| Seq Write | 409.8 | 1474 260% | 301.2 -27% | 454.6 11% | 470.2 15% |
| Seq Read | 505 | 1859 268% | 735 46% | 505 0% | 514 2% |
* ... smaller is better
| 3DMark 11 | |
| 1280x720 Performance GPU (sort by value) | |
| Asus Zenbook UX303UB-DH74T | |
| Nexoc M731III W670RBQ | |
| Microsoft Surface Pro 4 Core i7 | |
| Lenovo Flex 2 Pro-15 | |
| HP Envy 13-d000ng | |
| 1280x720 Performance (sort by value) | |
| Asus Zenbook UX303UB-DH74T | |
| Nexoc M731III W670RBQ | |
| Microsoft Surface Pro 4 Core i7 | |
| Lenovo Flex 2 Pro-15 | |
| HP Envy 13-d000ng | |
| 3DMark | |
| 1920x1080 Fire Strike Score (sort by value) | |
| Asus Zenbook UX303UB-DH74T | |
| Nexoc M731III W670RBQ | |
| Microsoft Surface Pro 4 Core i7 | |
| Lenovo Flex 2 Pro-15 | |
| HP Envy 13-d000ng | |
| 1280x720 Cloud Gate Standard Score (sort by value) | |
| Asus Zenbook UX303UB-DH74T | |
| Nexoc M731III W670RBQ | |
| Microsoft Surface Pro 4 Core i7 | |
| Lenovo Flex 2 Pro-15 | |
| HP Envy 13-d000ng | |
| 1280x720 Ice Storm Standard Score (sort by value) | |
| Asus Zenbook UX303UB-DH74T | |
| Nexoc M731III W670RBQ | |
| Microsoft Surface Pro 4 Core i7 | |
| Lenovo Flex 2 Pro-15 | |
| HP Envy 13-d000ng | |
| 3DMark 11 Performance | 2291 points | |
| 3DMark Ice Storm Standard Score | 17839 points | |
| 3DMark Cloud Gate Standard Score | 5995 points | |
| 3DMark Fire Strike Score | 1347 points | |
| 3DMark Fire Strike Extreme Score | 680 points | |
Help | ||
| low | med. | high | ultra | |
| Tomb Raider (2013) | 60.3 | 32.7 | 16.2 | |
| BioShock Infinite (2013) | 43.2 | 38.5 | 13.3 | |
| Metro: Last Light (2013) | 32.9 | 21.8 | 10.8 | |
| Thief (2014) | 23.9 | 19.3 | 8.9 | |
| Batman: Arkham Knight (2015) | 21 | |||
| Fallout 4 (2015) | 20 | 11 | 9 |
| Asus Zenbook UX303UB-DH74T GeForce 940M, 6500U, CUK Cyclone SSD 1TB | Lenovo Yoga 900-13ISK 80MK HD Graphics 520, 6500U, Samsung SSD PM871 MZNLN512HCJH | Dell XPS 13 2016 i7 256GB QHD HD Graphics 520, 6500U, Samsung PM951 NVMe MZ-VLV256D | HP Spectre 13-4001ng x360 HD Graphics 5500, 5500U, ADATA AXNS381E-256GM-B | Acer Aspire V3-372-50LK HD Graphics 520, 6200U, Toshiba HG6 THNSNJ256G8NU | |
|---|---|---|---|---|---|
| Noise | 3% | -2% | -0% | 3% | |
| Idle Minimum * | 29.8 | 29.7 -0% | 31.8 -7% | 29.6 1% | 31.5 -6% |
| Idle Average * | 29.8 | 29.8 -0% | 31.8 -7% | 29.6 1% | 31.5 -6% |
| Idle Maximum * | 29.8 | 30 -1% | 34.8 -17% | 29.6 1% | 31.5 -6% |
| Load Average * | 37.4 | 32 14% | 34.8 7% | 38.6 -3% | 32.4 13% |
| Load Maximum * | 40.3 | 38.5 4% | 34.8 14% | 41 -2% | 32.3 20% |
* ... smaller is better
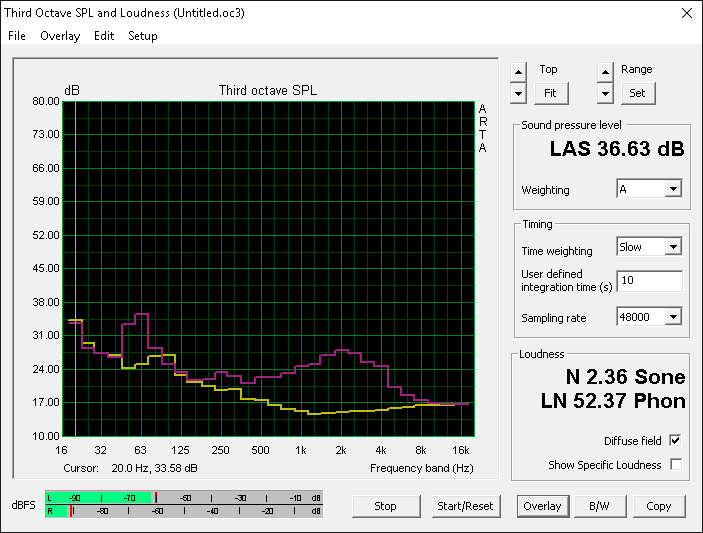
Noise Level
| Idle |
| 29.8 / 29.8 / 29.8 dB(A) |
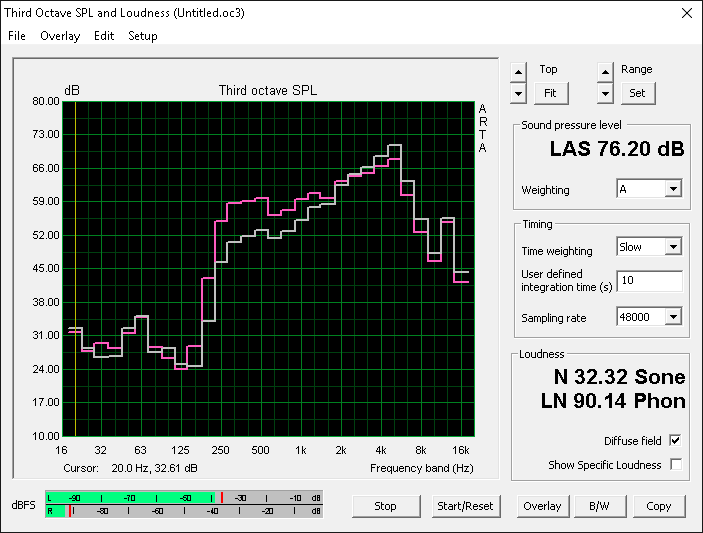
| Load |
| 37.4 / 40.3 dB(A) |
 | ||
30 dB silent 40 dB(A) audible 50 dB(A) loud |
||
min: | ||
(±) The maximum temperature on the upper side is 45 °C / 113 F, compared to the average of 35.9 °C / 97 F, ranging from 21.4 to 59 °C for the class Subnotebook.
(±) The bottom heats up to a maximum of 42 °C / 108 F, compared to the average of 39.4 °C / 103 F
(+) In idle usage, the average temperature for the upper side is 24.1 °C / 75 F, compared to the device average of 30.7 °C / 87 F.
(+) The palmrests and touchpad are cooler than skin temperature with a maximum of 31.6 °C / 88.9 F and are therefore cool to the touch.
(-) The average temperature of the palmrest area of similar devices was 28.3 °C / 82.9 F (-3.3 °C / -6 F).
| Asus Zenbook UX303UB-DH74T 50 Wh | Asus Zenbook UX303UB-R4100T 50 Wh | Lenovo Yoga 900-13ISK 80MK 66 Wh | HP Spectre x360 13-4104ng 56 Wh | HP Envy 13-d000ng 45 Wh | Dell XPS 13 2016 i7 256GB QHD 56 Wh | |
|---|---|---|---|---|---|---|
| Battery Runtime | 32% | 26% | 47% | -5% | 18% | |
| Reader / Idle | 617 | 997 62% | 844 37% | 517 -16% | 784 27% | |
| WiFi v1.3 | 341 | 410 20% | 403 18% | 500 47% | 324 -5% | 432 27% |
| Load | 103 | 118 15% | 128 24% | 108 5% | 103 0% |
Pros
Cons

Zenbook系列依然有一些很好的超极本,如果用户对360度转轴和可拆卸键盘不感兴趣的话。这款QHD机型却有些原地踏步。是的,它的分辨率超高,显示锐利,不过对于屏幕来说并不只有像素数而已。例如在背光亮度,对比度和色彩准确度等方面它都弱于全高清机型。它的响应速度也低于平均水平,但还好它没有使用频闪控制屏幕亮度。最后,它的电池续航也受到了影响,尽管内部硬件得到了升级,但屏幕需要更大功率。
我们并不是不喜欢QHD或者UHD屏幕。不过,它们不应该以牺牲别的重要方面为代价。售价较低的全高清机型可能对于大部分用户来说是更好的选择。
注:本文是基于完整评测的缩减版本,阅读完整的英文评测,请点击这里。
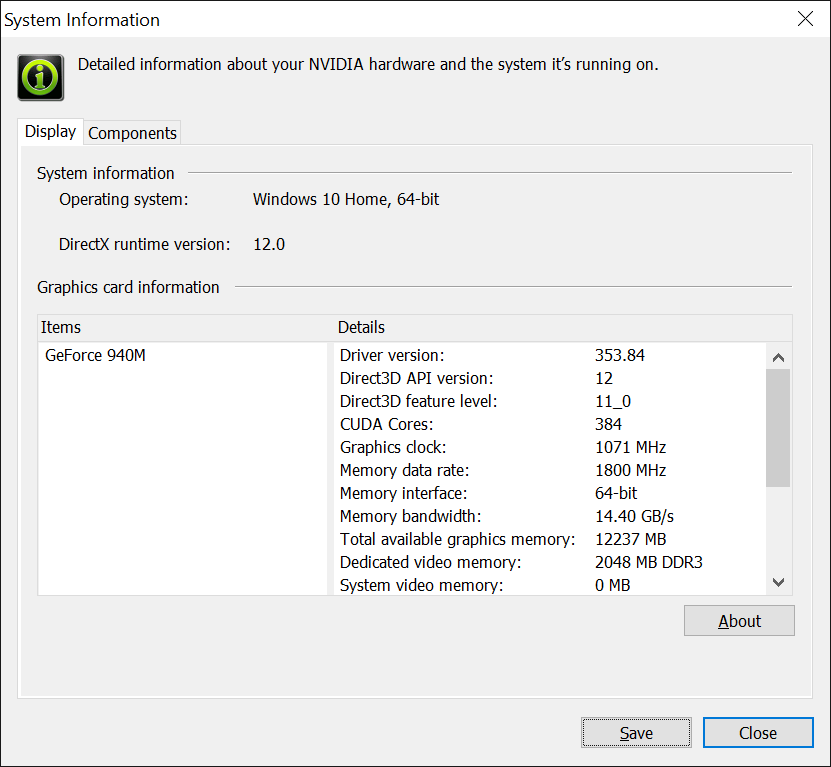
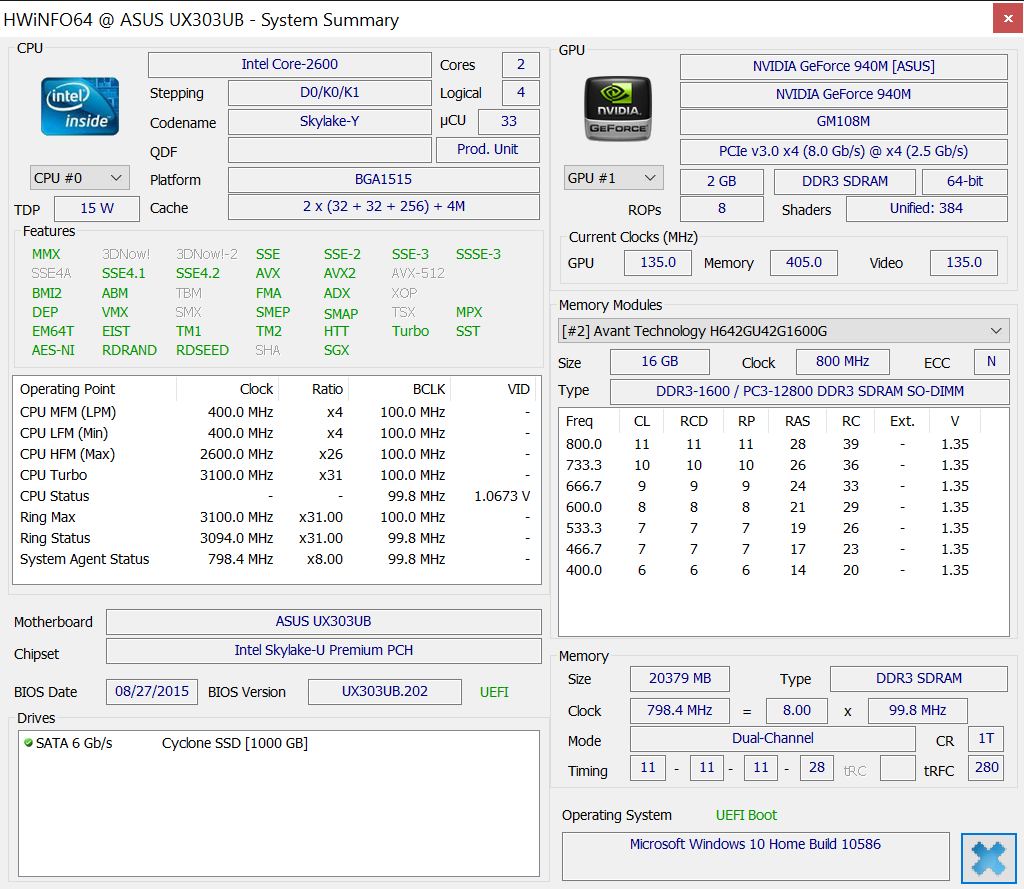
Asus Zenbook UX303UB-DH74T
-
01/12/2016 v4.1(old)
Allen Ngo
Pricecompare
