 Deutsch
 English
 Español
 Français
 Italiano
 Nederlands
 Polski
 Português
 Русский
 Türkçe
 Svenska
 Chinese
 Magyar
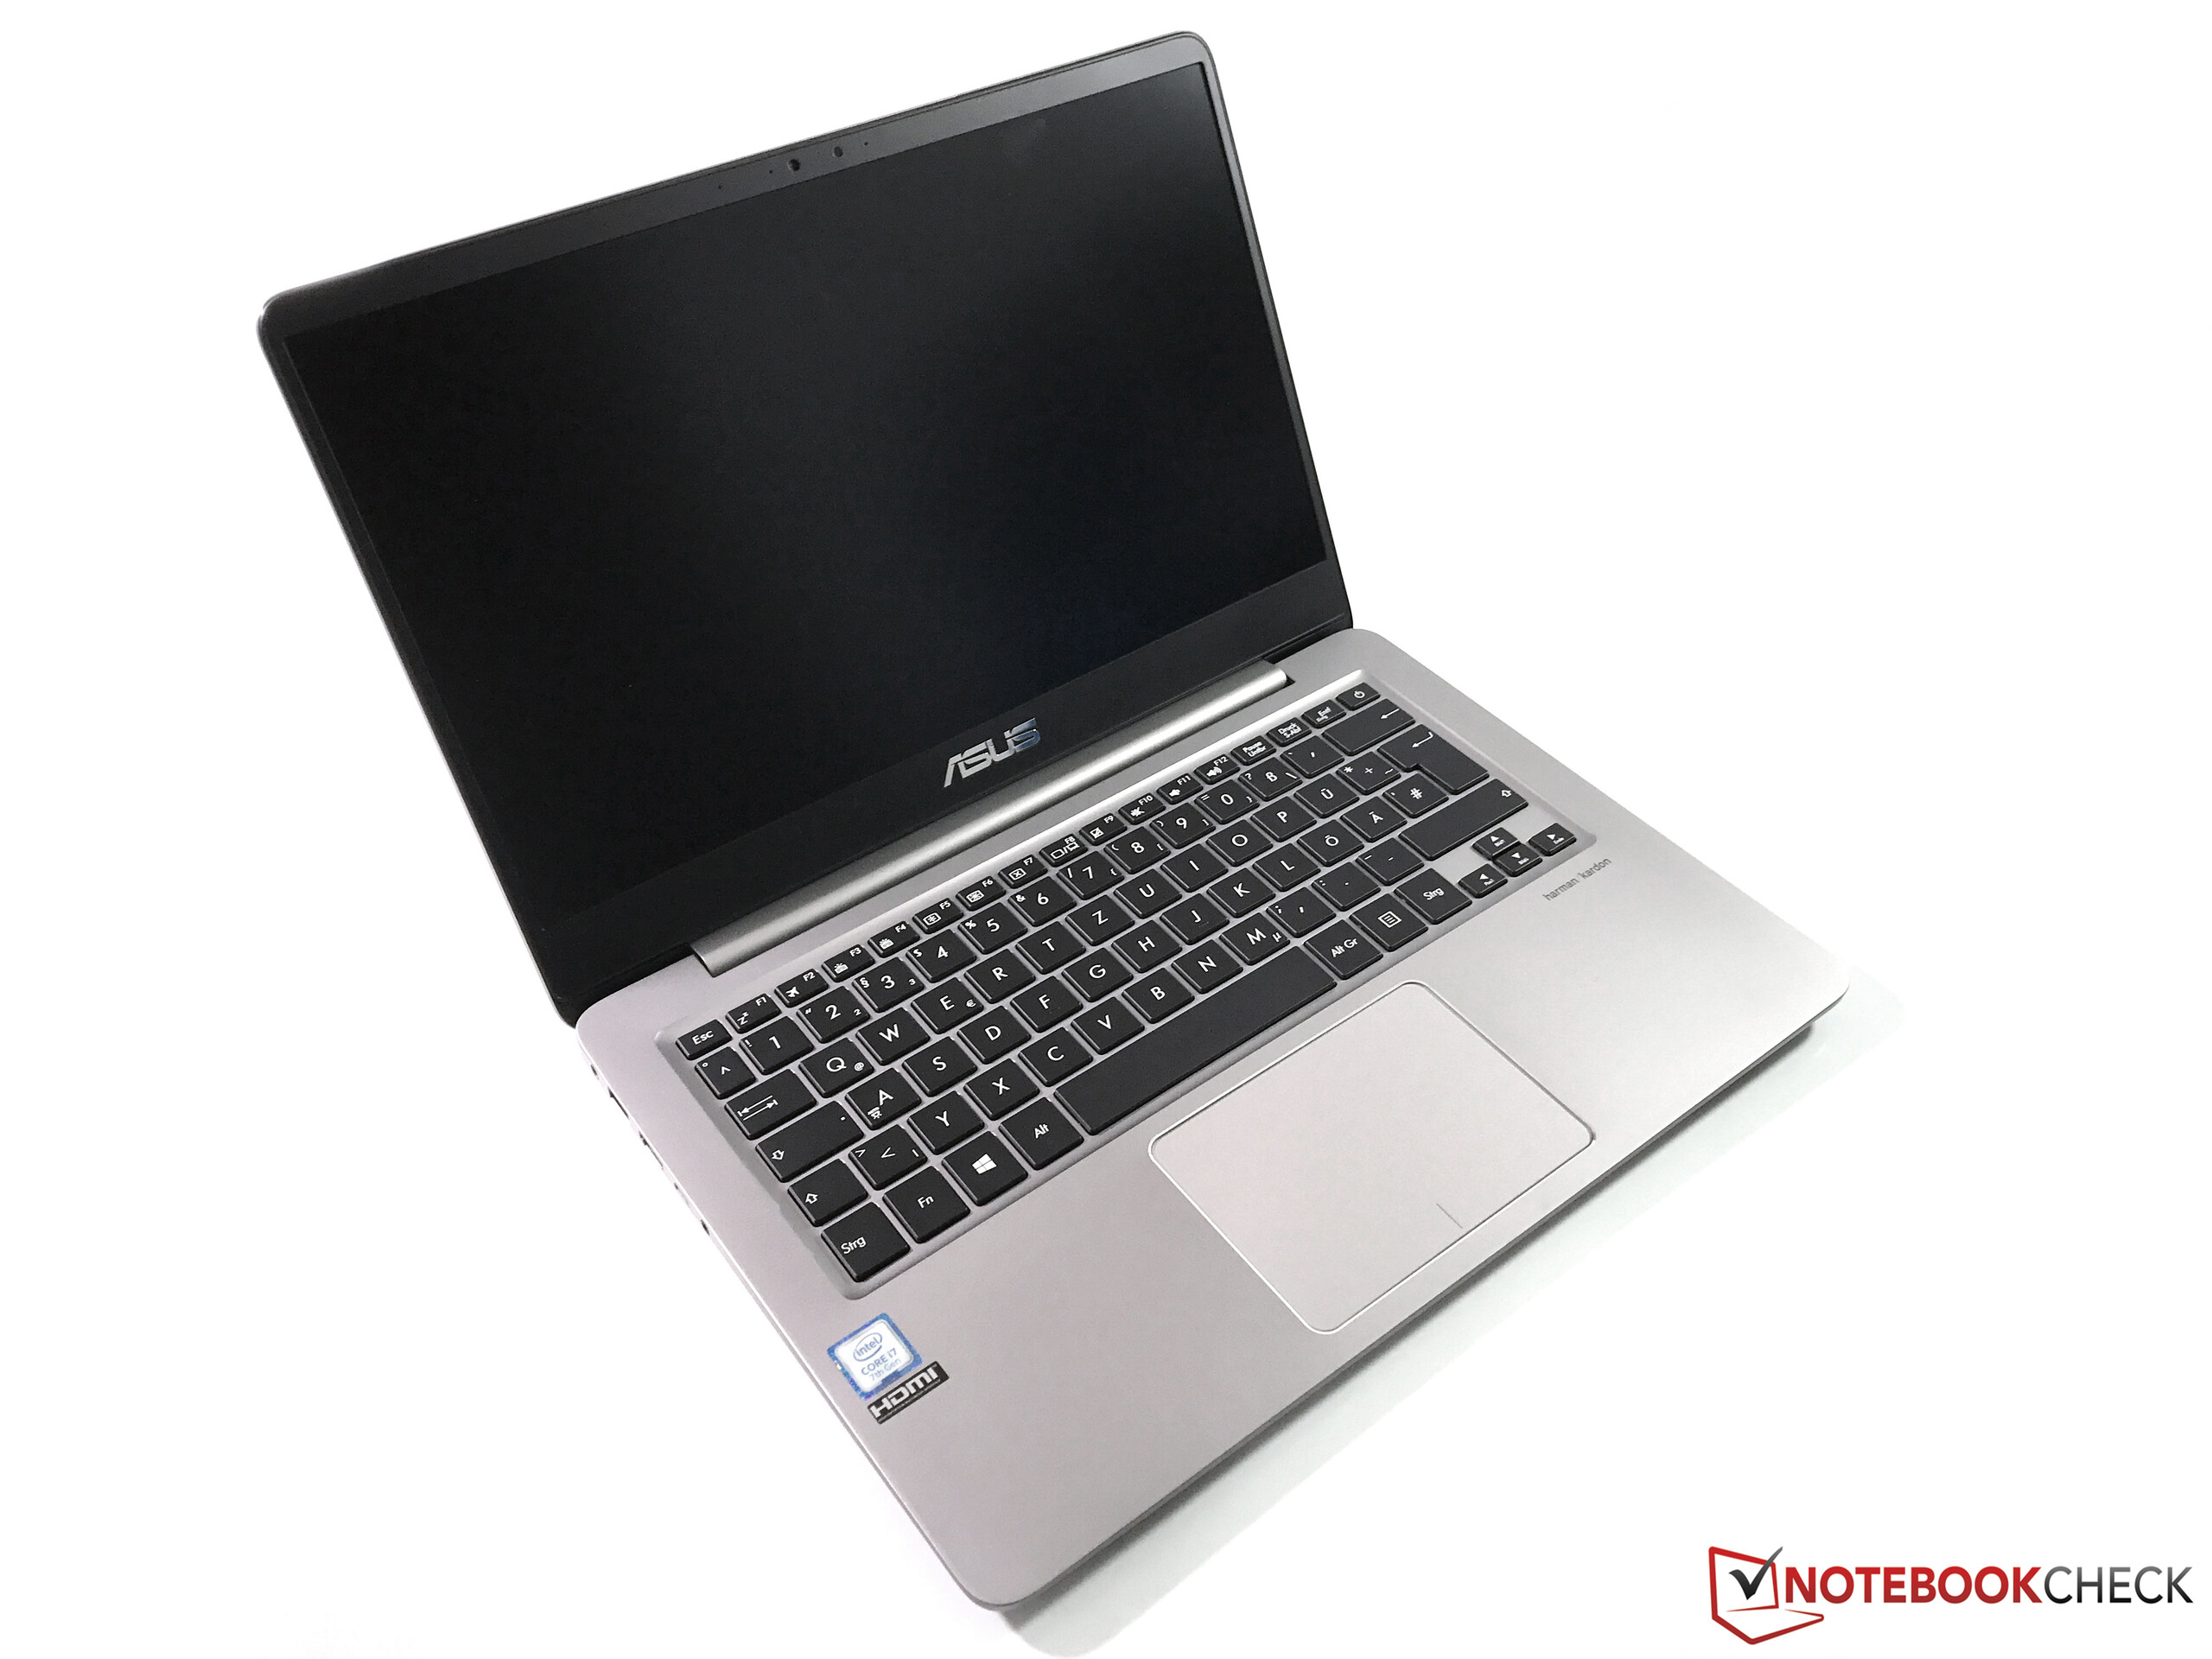
华硕 ZenBook UX3410UA 笔记本电脑简短评测
| SD Card Reader | |
| average JPG Copy Test (av. of 3 runs) | |
| Acer Swift 5 SF514-51-59AV | |
| Lenovo Yoga 710-14IKB 80V4002HGE | |
| Asus Zenbook UX310UQ-GL011T | |
| Asus Zenbook UX3410UA | |
| Acer TravelMate X3 X349-M-7261 | |
| maximum AS SSD Seq Read Test (1GB) | |
| Acer Swift 5 SF514-51-59AV | |
| Lenovo Yoga 710-14IKB 80V4002HGE | |
| Asus Zenbook UX310UQ-GL011T | |
| Asus Zenbook UX3410UA | |
| Acer TravelMate X3 X349-M-7261 | |
Screen Flickering / PWM (Pulse-Width Modulation)
| Screen flickering / PWM not detected | 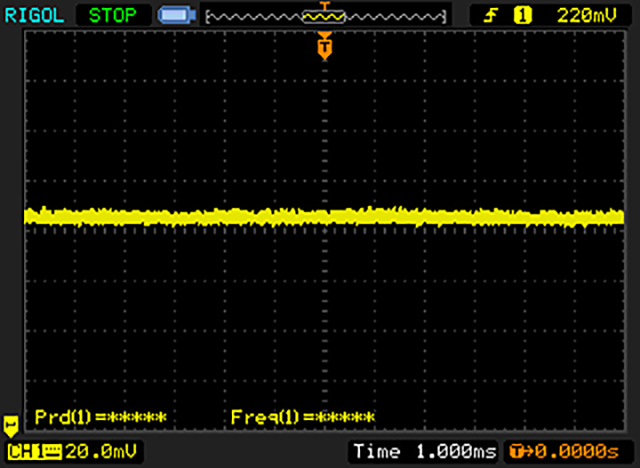 | ||
In comparison: 53 % of all tested devices do not use PWM to dim the display. If PWM was detected, an average of 17900 (minimum: 5 - maximum: 3846000) Hz was measured. | |||
| |||||||||||||||||||||||||
Brightness Distribution: 87 %
Center on Battery: 376 cd/m²
Contrast: 1175:1 (Black: 0.32 cd/m²)
ΔE Color 3.2 | 0.5-29.43 Ø5
ΔE Greyscale 4.4 | 0.57-98 Ø5.3
98.98% sRGB (Argyll 1.6.3 3D)
63.78% AdobeRGB 1998 (Argyll 1.6.3 3D)
69.4% AdobeRGB 1998 (Argyll 2.2.0 3D)
99.1% sRGB (Argyll 2.2.0 3D)
67.7% Display P3 (Argyll 2.2.0 3D)
Gamma: 2.12
| Asus Zenbook UX3410UA ChiMei N140HCE-EN1, , 1920x1080, 14.00 | Asus Zenbook UX310UQ-GL011T AU Optronics AUO142D, , 1920x1080, 13.30 | Acer Swift 5 SF514-51-59AV AU Optronics B140HAN3.2, , 1920x1080, 14.00 | Acer TravelMate X3 X349-M-7261 AU Optronics B140HAN02.1, , 1920x1080, 14.00 | Lenovo Yoga 710-14IKB 80V4002HGE AU Optronics B140HAN03.0, , 1920x1080, 14.00 | |
|---|---|---|---|---|---|
| Display | -10% | -7% | -45% | -9% | |
| Display P3 Coverage | 67.7 | 61.9 -9% | 62.8 -7% | 36.97 -45% | 62 -8% |
| sRGB Coverage | 99.1 | 88.3 -11% | 91.3 -8% | 55.6 -44% | 89.5 -10% |
| AdobeRGB 1998 Coverage | 69.4 | 63 -9% | 64.3 -7% | 38.2 -45% | 63.3 -9% |
| Response Times | 6% | -19% | -5% | -29% | |
| Response Time Grey 50% / Grey 80% * | 33 ? | 39 ? -18% | 51 ? -55% | 42 ? -27% | 53 ? -61% |
| Response Time Black / White * | 34 ? | 24 ? 29% | 28 ? 18% | 28 ? 18% | 33 ? 3% |
| PWM Frequency | 50 ? | 50 ? | |||
| Screen | -26% | -22% | -21% | -34% | |
| Brightness middle | 376 | 247 -34% | 393 5% | 230 -39% | 340 -10% |
| Brightness | 355 | 240 -32% | 338 -5% | 226 -36% | 302 -15% |
| Brightness Distribution | 87 | 90 3% | 79 -9% | 86 -1% | 77 -11% |
| Black Level * | 0.32 | 0.43 -34% | 0.29 9% | 0.2 37% | 0.31 3% |
| Contrast | 1175 | 574 -51% | 1355 15% | 1150 -2% | 1097 -7% |
| Colorchecker dE 2000 * | 3.2 | 4.74 -48% | 6.17 -93% | 5.07 -58% | 6.75 -111% |
| Colorchecker dE 2000 max. * | 7.1 | 9.14 -29% | 11.21 -58% | 10.07 -42% | 12.4 -75% |
| Greyscale dE 2000 * | 4.4 | 4.87 -11% | 6.8 -55% | 3.64 17% | 8.47 -93% |
| Gamma | 2.12 104% | 2.57 86% | 2.27 97% | 2.46 89% | 2.22 99% |
| CCT | 7440 87% | 7450 87% | 6873 95% | 6521 100% | 6557 99% |
| Color Space (Percent of AdobeRGB 1998) | 63.78 | 57 -11% | 51 -20% | 35 -45% | 58 -9% |
| Color Space (Percent of sRGB) | 98.98 | 88 -11% | 91 -8% | 55 -44% | 89 -10% |
| Total Average (Program / Settings) | -10% /
-18% | -16% /
-19% | -24% /
-24% | -24% /
-28% |
* ... smaller is better
Display Response Times
| ↔ Response Time Black to White | ||
|---|---|---|
| 34 ms ... rise ↗ and fall ↘ combined | ↗ 15 ms rise |  |
| ↘ 19 ms fall | ||
| The screen shows slow response rates in our tests and will be unsatisfactory for gamers. In comparison, all tested devices range from 0.1 (minimum) to 240 (maximum) ms. » 89 % of all devices are better. This means that the measured response time is worse than the average of all tested devices (21.5 ms). | ||
| ↔ Response Time 50% Grey to 80% Grey | ||
| 33 ms ... rise ↗ and fall ↘ combined | ↗ 14 ms rise | 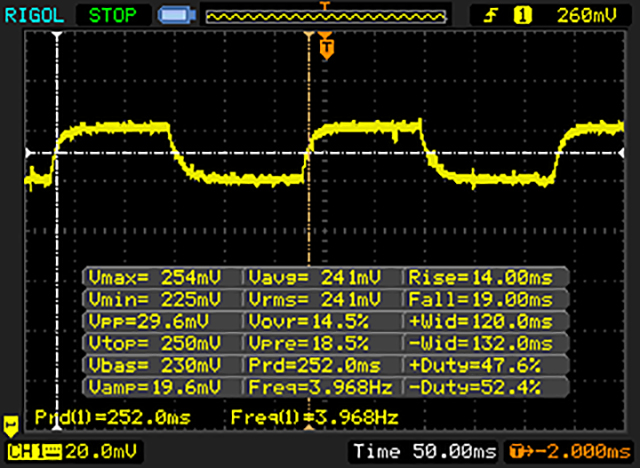 |
| ↘ 19 ms fall | ||
| The screen shows slow response rates in our tests and will be unsatisfactory for gamers. In comparison, all tested devices range from 0.2 (minimum) to 636 (maximum) ms. » 38 % of all devices are better. This means that the measured response time is similar to the average of all tested devices (33.7 ms). | ||
| PCMark 8 | |
| Home Score Accelerated v2 | |
| Asus Zenbook UX3410UA | |
| Asus Zenbook UX310UQ-GL011T | |
| Acer TravelMate X3 X349-M-7261 | |
| Acer Swift 5 SF514-51-59AV | |
| Lenovo Yoga 710-14IKB 80V4002HGE | |
| Work Score Accelerated v2 | |
| Asus Zenbook UX3410UA | |
| Asus Zenbook UX310UQ-GL011T | |
| Acer TravelMate X3 X349-M-7261 | |
| PCMark 8 Home Score Accelerated v2 | 3965 points | |
| PCMark 8 Work Score Accelerated v2 | 5033 points | |
Help | ||
| Asus Zenbook UX3410UA SanDisk SD8SN8U512G1002 | Asus Zenbook UX310UQ-GL011T SanDisk SD8SNAT256G1002 | Acer Swift 5 SF514-51-59AV SK Hynix HFS256G39TND-N210A | Acer TravelMate X3 X349-M-7261 Liteonit CV3-8D512 | Lenovo Yoga 710-14IKB 80V4002HGE Samsung MZYTY256HDHP | |
|---|---|---|---|---|---|
| CrystalDiskMark 3.0 | -18% | -6% | 8% | 3% | |
| Read Seq | 494.5 | 468.1 -5% | 517 5% | 484.1 -2% | 490.5 -1% |
| Write Seq | 461.7 | 319.2 -31% | 258.1 -44% | 449.8 -3% | 452.3 -2% |
| Read 512 | 328 | 318.6 -3% | 355 8% | 399.1 22% | 386.2 18% |
| Write 512 | 419.7 | 272.8 -35% | 258.5 -38% | 355.1 -15% | 219.9 -48% |
| Read 4k | 27.53 | 22.03 -20% | 29.65 8% | 33.44 21% | 34.35 25% |
| Write 4k | 56.5 | 72.1 28% | 77.3 37% | 67.5 19% | 91.2 61% |
| Read 4k QD32 | 351 | 147.4 -58% | 277.1 -21% | 368.5 5% | 378.9 8% |
| Write 4k QD32 | 249.3 | 200.2 -20% | 242.5 -3% | 280.6 13% | 152.2 -39% |

| 3DMark | |
| 1280x720 Cloud Gate Standard Graphics | |
| Dell XPS 13 2016 9350 (FHD, i7-6560U) | |
| Asus Zenbook UX3410UA | |
| HP ProBook 440 G4-Y8B51EA | |
| Asus Zenbook UX310UQ-GL011T | |
| Acer Swift 5 SF514-51-59AV | |
| Asus X302UV-FN016T | |
| Acer TravelMate X3 X349-M-7261 | |
| HP ProBook 430 G4-Y8B47EA | |
| Lenovo Yoga 710-14IKB 80V4002HGE | |
| 1920x1080 Fire Strike Graphics | |
| HP ProBook 440 G4-Y8B51EA | |
| Asus Zenbook UX310UQ-GL011T | |
| Asus X302UV-FN016T | |
| Dell XPS 13 2016 9350 (FHD, i7-6560U) | |
| Asus Zenbook UX3410UA | |
| Acer TravelMate X3 X349-M-7261 | |
| Lenovo Yoga 710-14IKB 80V4002HGE | |
| HP ProBook 430 G4-Y8B47EA | |
| 3DMark 11 Performance | 1863 points | |
| 3DMark Cloud Gate Standard Score | 7237 points | |
| 3DMark Fire Strike Score | 1019 points | |
Help | ||
| low | med. | high | ultra | |
| Tomb Raider (2013) | 100.1 | 47.2 | 29.4 | 13.5 |
| BioShock Infinite (2013) | 62.9 | 32.7 | 28.5 | 9.2 |
| Battlefield 4 (2013) | 49.2 | 32.9 | 23.6 | |
| The Witcher 3 (2015) | 15.8 | 10.3 | ||
| Rise of the Tomb Raider (2016) | 21.5 | 13.3 |
Noise Level
| Idle |
| 29.9 / 29.9 / 35.2 dB(A) |
| Load |
| 43.5 / 43.8 dB(A) |
 | ||
30 dB silent 40 dB(A) audible 50 dB(A) loud |
||
min: | ||
| Asus Zenbook UX3410UA i7-7500U, HD Graphics 620 | Asus Zenbook UX310UQ-GL011T 6500U, GeForce 940MX | Acer Swift 5 SF514-51-59AV i5-7200U, HD Graphics 620 | Acer TravelMate X3 X349-M-7261 6500U, HD Graphics 520 | Lenovo Yoga 710-14IKB 80V4002HGE i5-7200U, HD Graphics 620 | |
|---|---|---|---|---|---|
| Noise | 5% | 10% | 8% | 7% | |
| off / environment * | 29.9 | 30.5 -2% | 30.5 -2% | 31.15 -4% | 30.16 -1% |
| Idle Minimum * | 29.9 | 30.5 -2% | 30.5 -2% | 31.5 -5% | 30.16 -1% |
| Idle Average * | 29.9 | 30.5 -2% | 30.5 -2% | 31.5 -5% | 30.16 -1% |
| Idle Maximum * | 35.2 | 31.5 11% | 30.5 13% | 31.5 11% | 30.5 13% |
| Load Average * | 43.5 | 36.2 17% | 32.25 26% | 31.7 27% | 37.2 14% |
| Load Maximum * | 43.8 | 40 9% | 32.6 26% | 34.1 22% | 37 16% |
* ... smaller is better
(+) The maximum temperature on the upper side is 39.4 °C / 103 F, compared to the average of 35.9 °C / 97 F, ranging from 21.4 to 59 °C for the class Subnotebook.
(+) The bottom heats up to a maximum of 35.2 °C / 95 F, compared to the average of 39.4 °C / 103 F
(+) In idle usage, the average temperature for the upper side is 28.1 °C / 83 F, compared to the device average of 30.7 °C / 87 F.
(+) The palmrests and touchpad are cooler than skin temperature with a maximum of 31.5 °C / 88.7 F and are therefore cool to the touch.
(-) The average temperature of the palmrest area of similar devices was 28.3 °C / 82.9 F (-3.2 °C / -5.8 F).
Asus Zenbook UX3410UA audio analysis
(±) | speaker loudness is average but good (78.9 dB)
Bass 100 - 315 Hz
(-) | nearly no bass - on average 17.2% lower than median
(±) | linearity of bass is average (10.2% delta to prev. frequency)
Mids 400 - 2000 Hz
(+) | balanced mids - only 2.3% away from median
(+) | mids are linear (4.1% delta to prev. frequency)
Highs 2 - 16 kHz
(+) | balanced highs - only 4.7% away from median
(+) | highs are linear (2.4% delta to prev. frequency)
Overall 100 - 16.000 Hz
(±) | linearity of overall sound is average (17.3% difference to median)
Compared to same class
» 38% of all tested devices in this class were better, 10% similar, 51% worse
» The best had a delta of 5%, average was 19%, worst was 53%
Compared to all devices tested
» 27% of all tested devices were better, 8% similar, 65% worse
» The best had a delta of 4%, average was 25%, worst was 134%
Acer Swift 5 SF514-51-59AV audio analysis
(-) | not very loud speakers (66 dB)
Bass 100 - 315 Hz
(±) | reduced bass - on average 14.7% lower than median
(±) | linearity of bass is average (13.5% delta to prev. frequency)
Mids 400 - 2000 Hz
(±) | higher mids - on average 5.3% higher than median
(±) | linearity of mids is average (7.3% delta to prev. frequency)
Highs 2 - 16 kHz
(+) | balanced highs - only 3.9% away from median
(±) | linearity of highs is average (8.1% delta to prev. frequency)
Overall 100 - 16.000 Hz
(±) | linearity of overall sound is average (22% difference to median)
Compared to same class
» 71% of all tested devices in this class were better, 6% similar, 23% worse
» The best had a delta of 5%, average was 19%, worst was 53%
Compared to all devices tested
» 58% of all tested devices were better, 7% similar, 35% worse
» The best had a delta of 4%, average was 25%, worst was 134%
| Off / Standby | |
| Idle | |
| Load |
|
| Asus Zenbook UX3410UA i7-7500U, HD Graphics 620, 1920x1080, 14.00 | Asus Zenbook UX310UQ-GL011T 6500U, GeForce 940MX, 1920x1080, 13.30 | Acer Swift 5 SF514-51-59AV i5-7200U, HD Graphics 620, 1920x1080, 14.00 | Acer TravelMate X3 X349-M-7261 6500U, HD Graphics 520, 1920x1080, 14.00 | Lenovo Yoga 710-14IKB 80V4002HGE i5-7200U, HD Graphics 620, 1920x1080, 14.00 | |
|---|---|---|---|---|---|
| Power Consumption | -8% | -4% | -8% | 3% | |
| Idle Minimum * | 3.7 | 3 19% | 3.6 3% | 4.9 -32% | 3.7 -0% |
| Idle Average * | 6 | 5.6 7% | 7 -17% | 7.3 -22% | 7.16 -19% |
| Idle Maximum * | 6.78 | 6.8 -0% | 9.3 -37% | 9.4 -39% | 8.3 -22% |
| Load Average * | 37.3 | 48.7 -31% | 37 1% | 26 30% | 30.4 18% |
| Load Maximum * | 47.4 | 63 -33% | 32.6 31% | 36 24% | 30.3 36% |
* ... smaller is better
| Asus Zenbook UX3410UA i7-7500U, HD Graphics 620, 48 Wh | Asus Zenbook UX310UQ-GL011T 6500U, GeForce 940MX, 48 Wh | Acer Swift 5 SF514-51-59AV i5-7200U, HD Graphics 620, 53.9 Wh | Acer TravelMate X3 X349-M-7261 6500U, HD Graphics 520, 48.9 Wh | Lenovo Yoga 710-14IKB 80V4002HGE i5-7200U, HD Graphics 620, 53 Wh | |
|---|---|---|---|---|---|
| Battery Runtime | -8% | 3% | -18% | 8% | |
| Reader / Idle | 1063 | 878 -17% | 1014 -5% | 675 -37% | 957 -10% |
| H.264 | 607 | 419 -31% | 555 -9% | 400 -34% | 520 -14% |
| WiFi v1.3 | 443 | 486 10% | 549 24% | 392 -12% | 561 27% |
| Load | 98 | 103 5% | 100 2% | 109 11% | 126 29% |
Pros
Cons
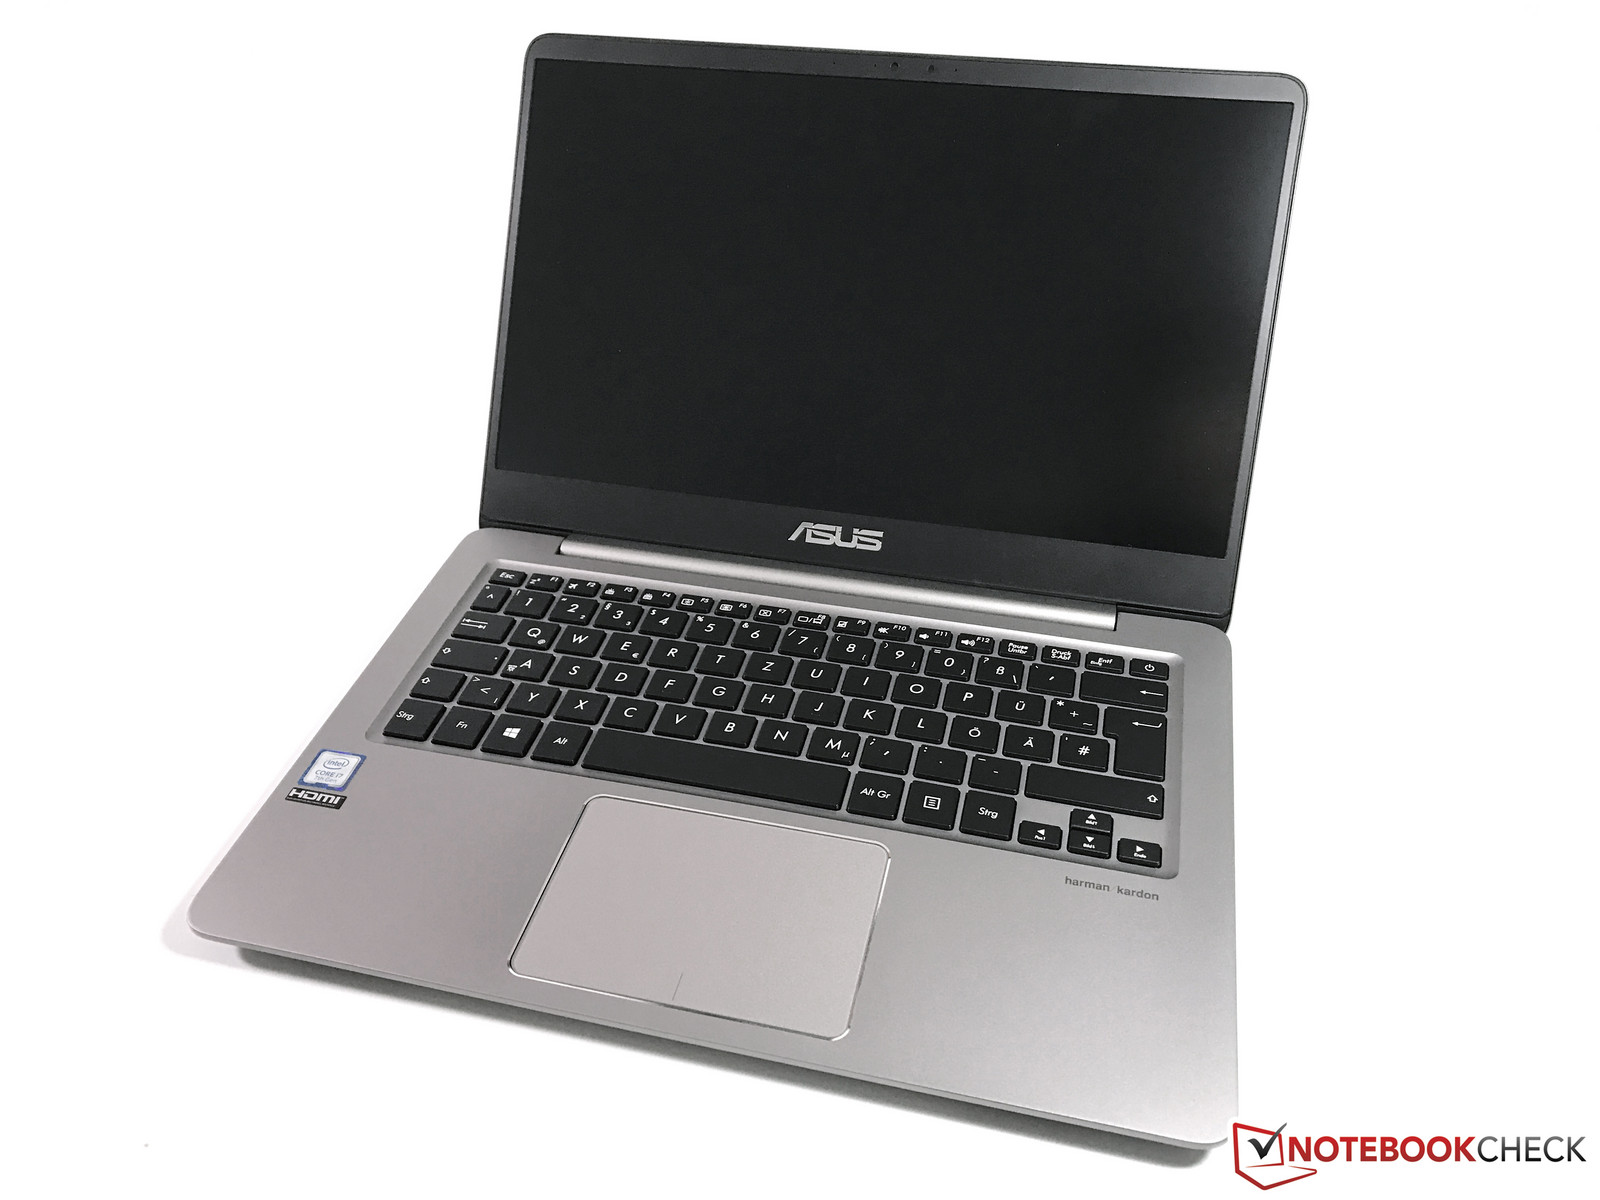
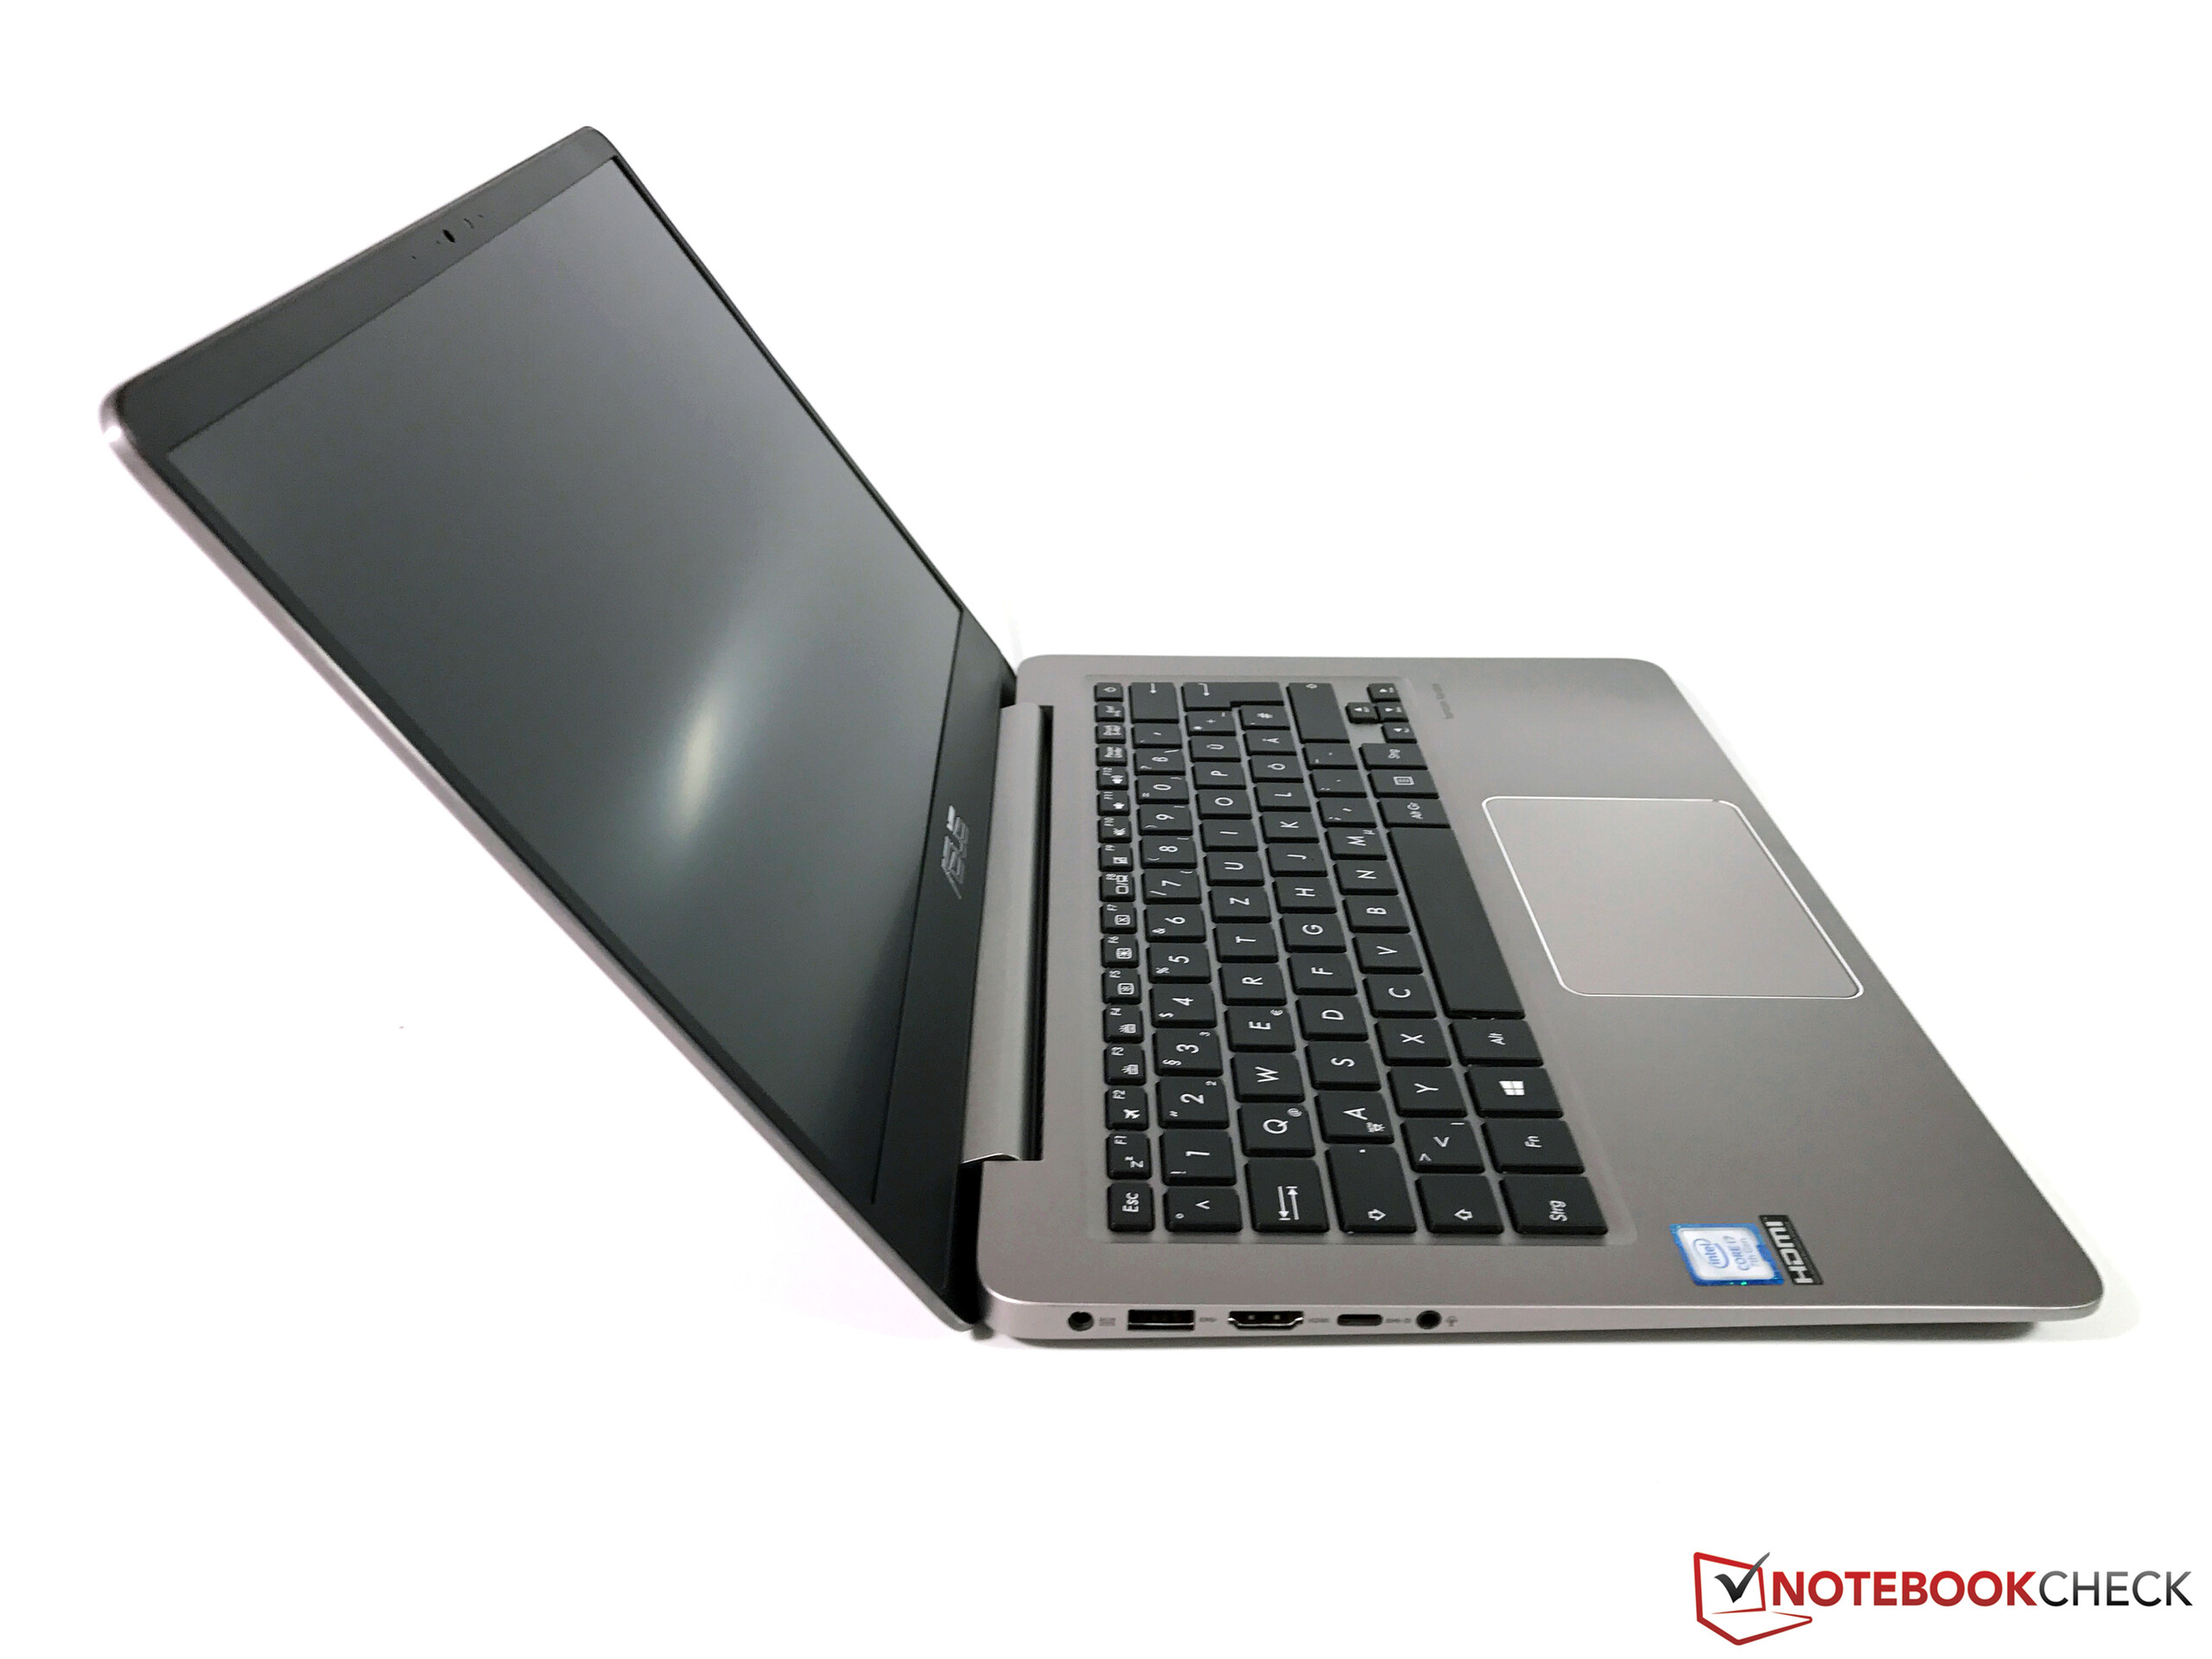
全新的华硕ZenBook UC3410UA紧跟着增大屏幕尺寸的潮流。它的14寸屏幕在13寸的机身内显得十分合适,同时除了稍短的无线上网续航时间外相比标准版的UX310没有什么其他劣势。相反的,稍厚的屏幕上盖让它更加稳定,出色的IPS屏幕也轻松地在各个方面都超出了UX310中TN屏幕的表现。
ZenBook UX3410UA搭配大屏幕变得更有魅力。华硕为它选择了一块非常优秀的雾面全高清IPS屏幕。
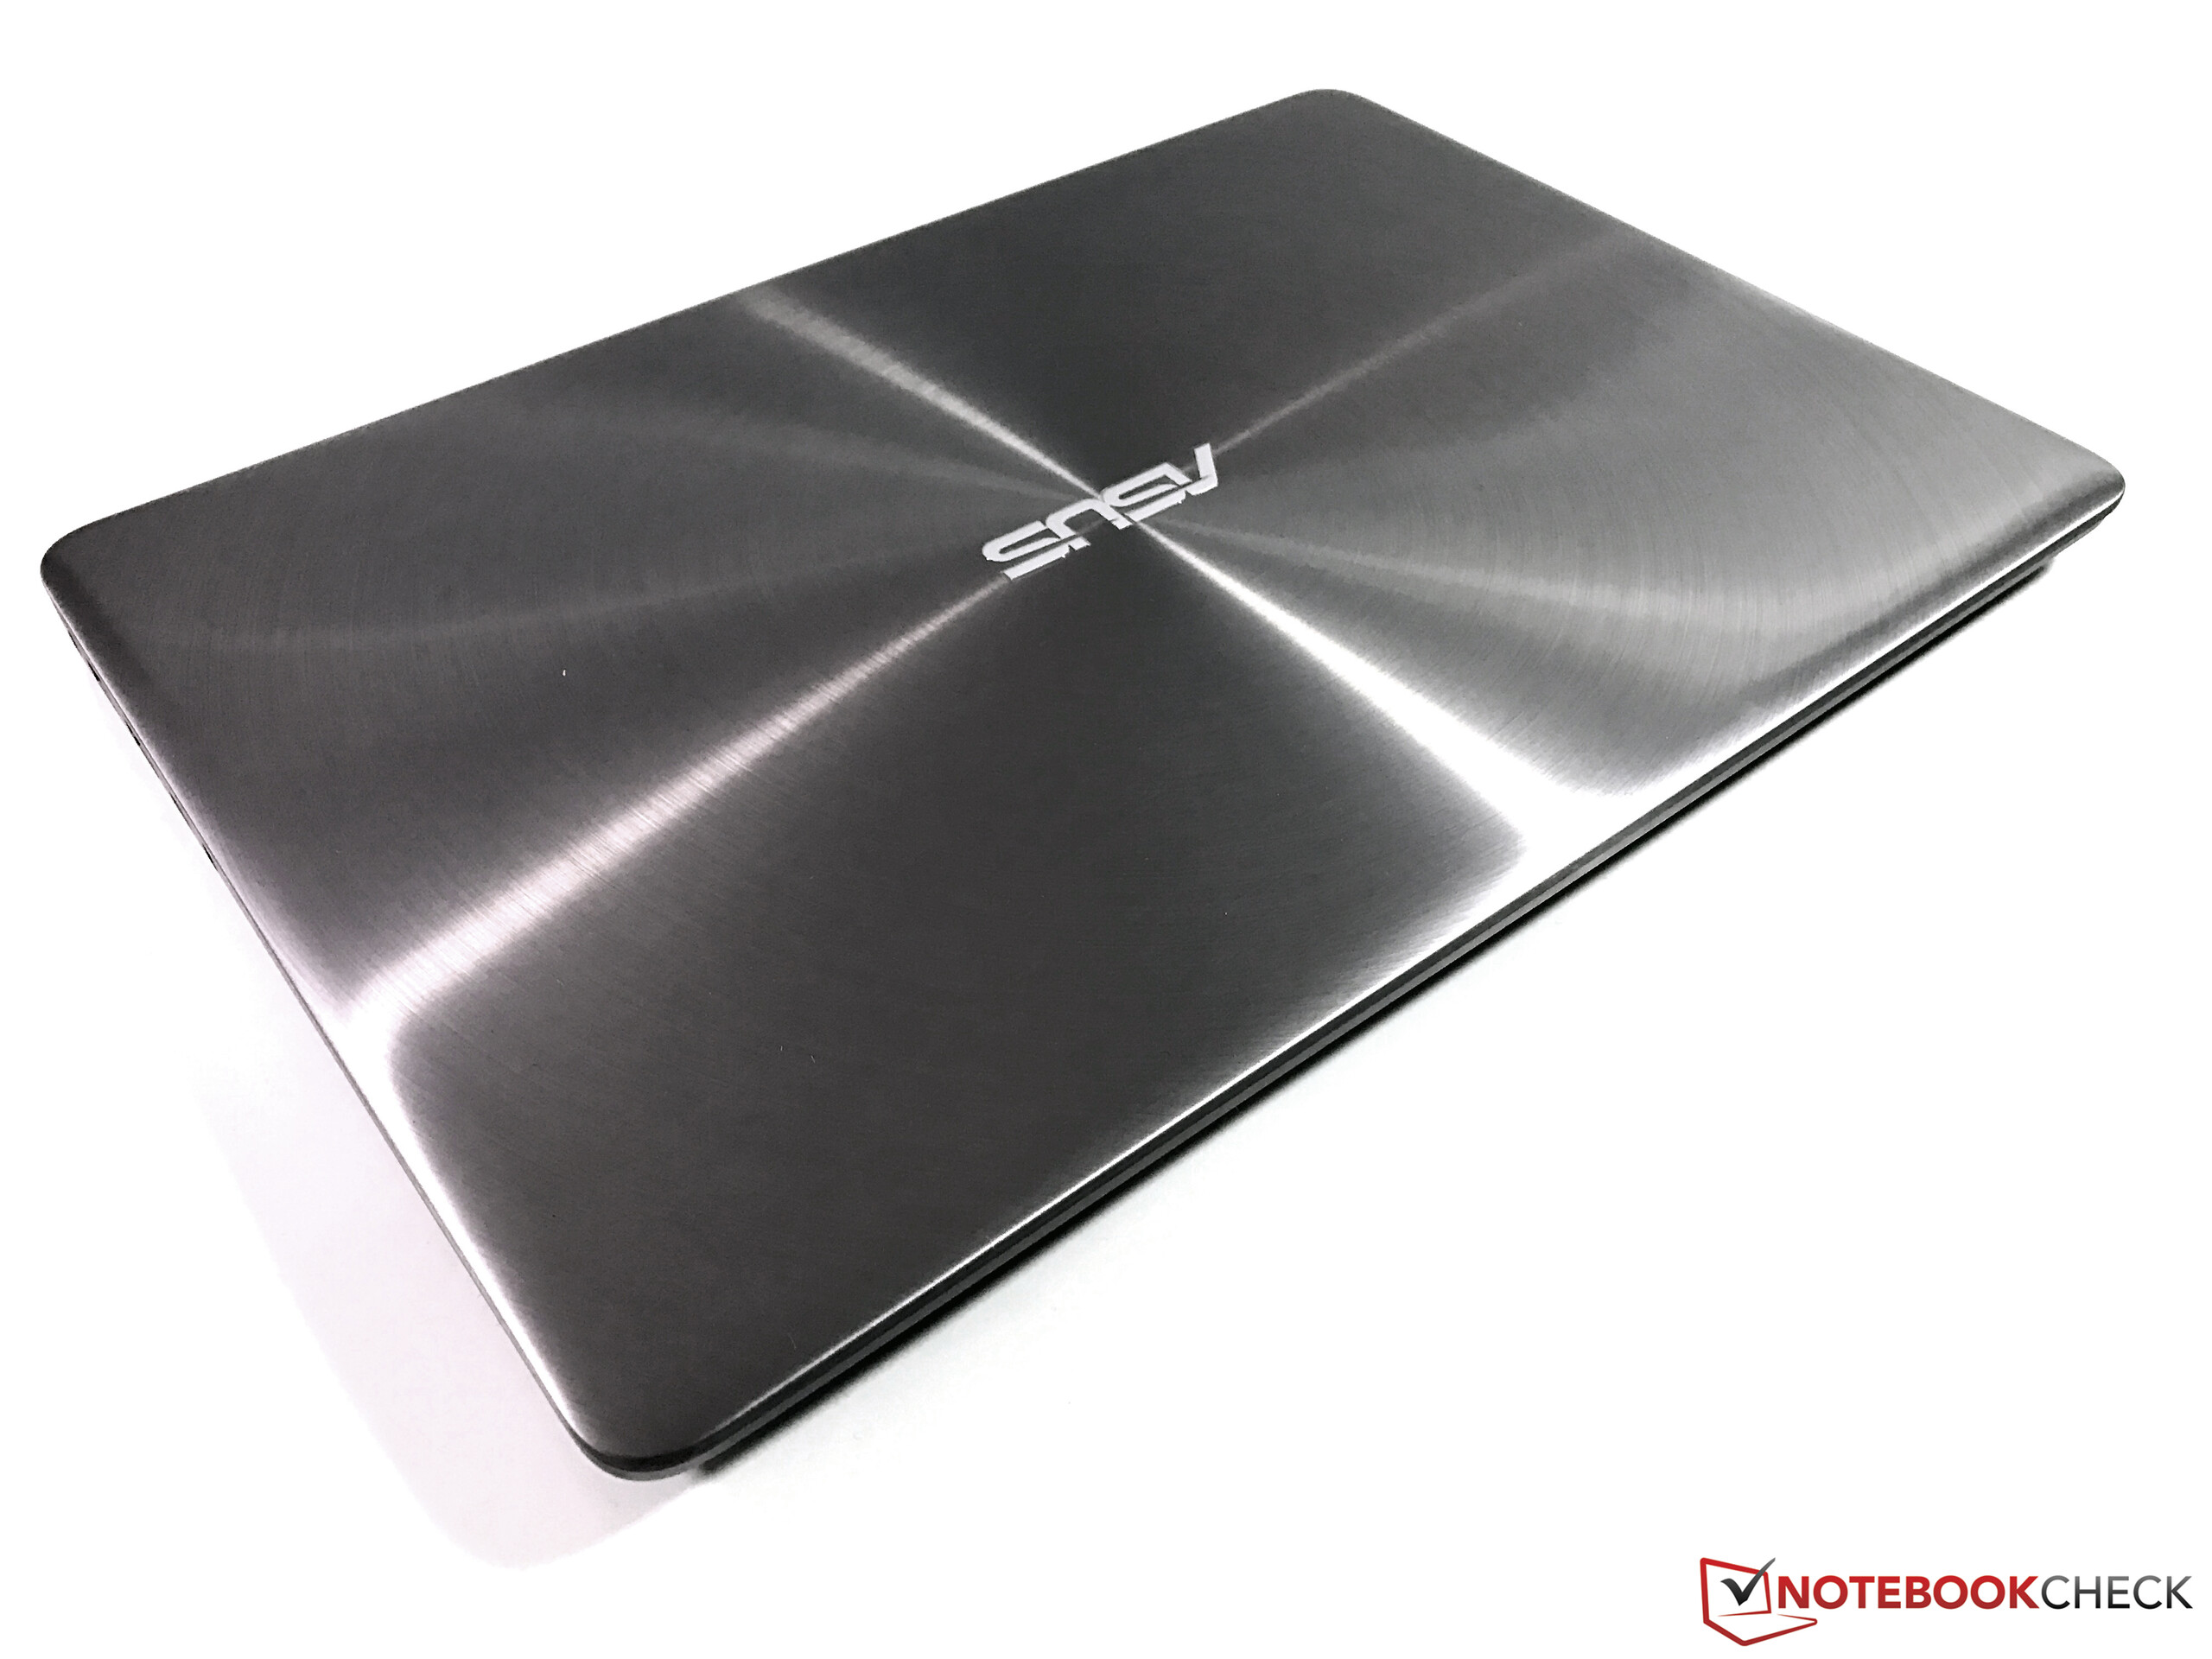
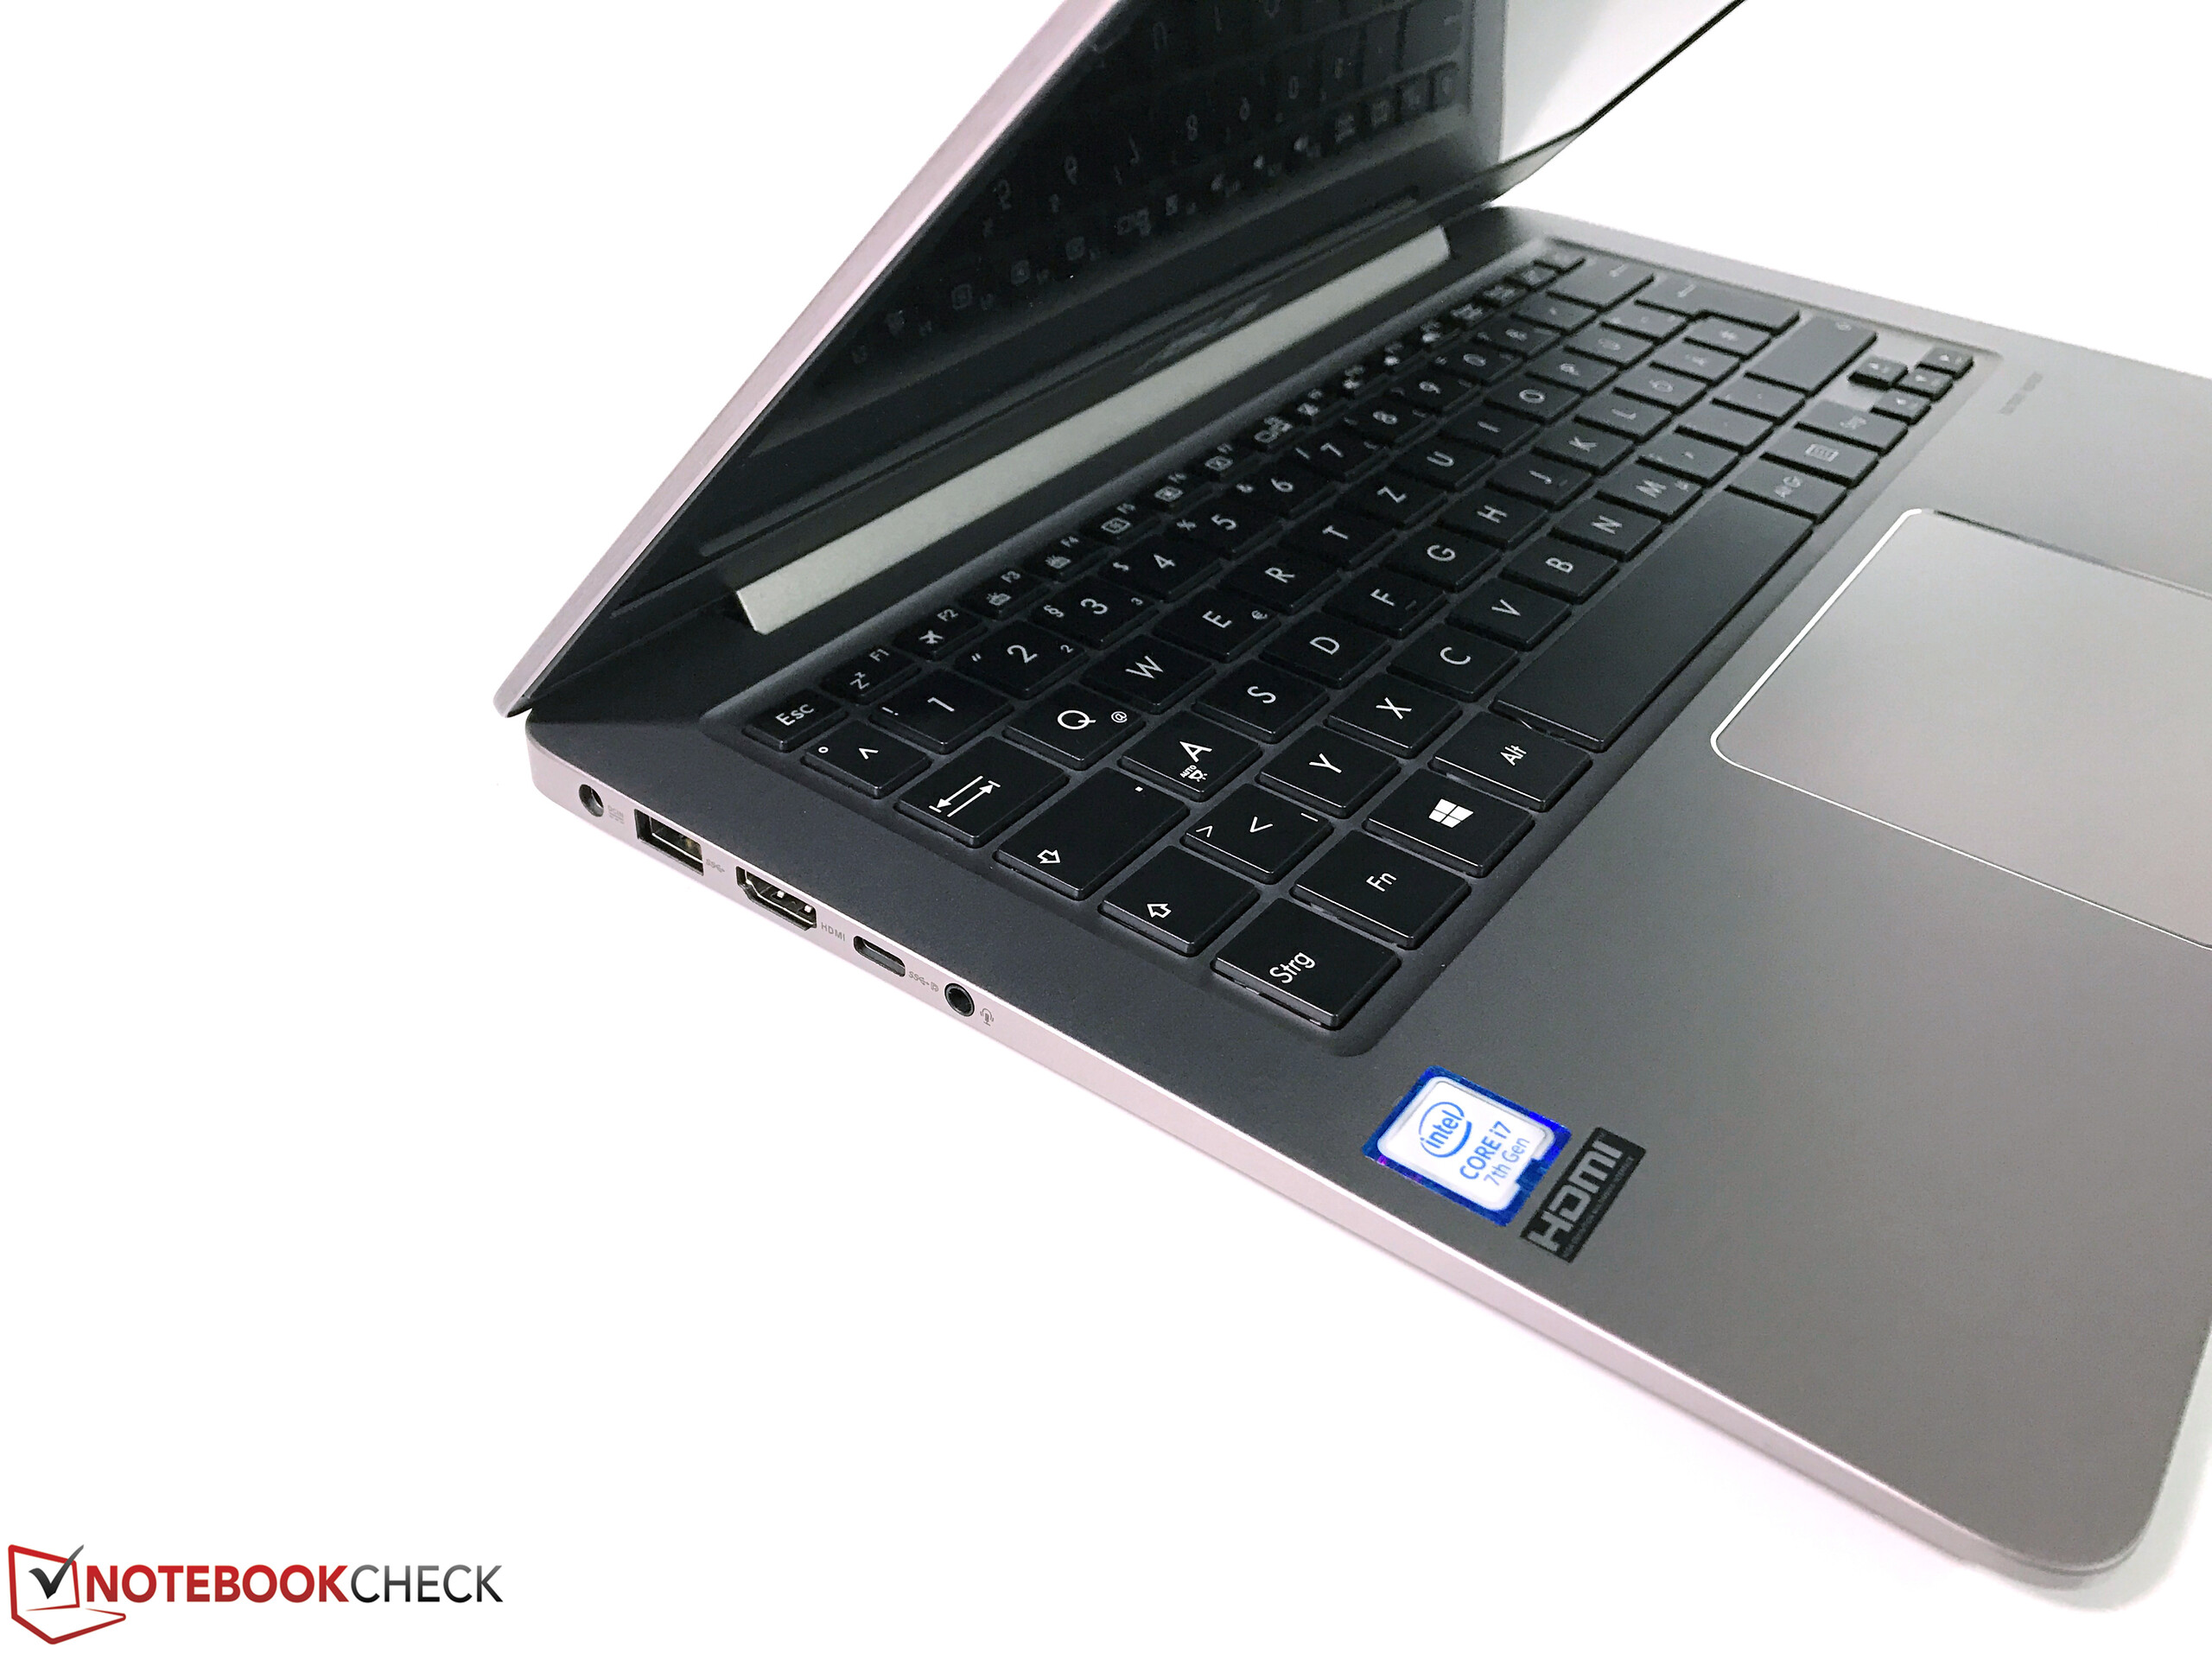
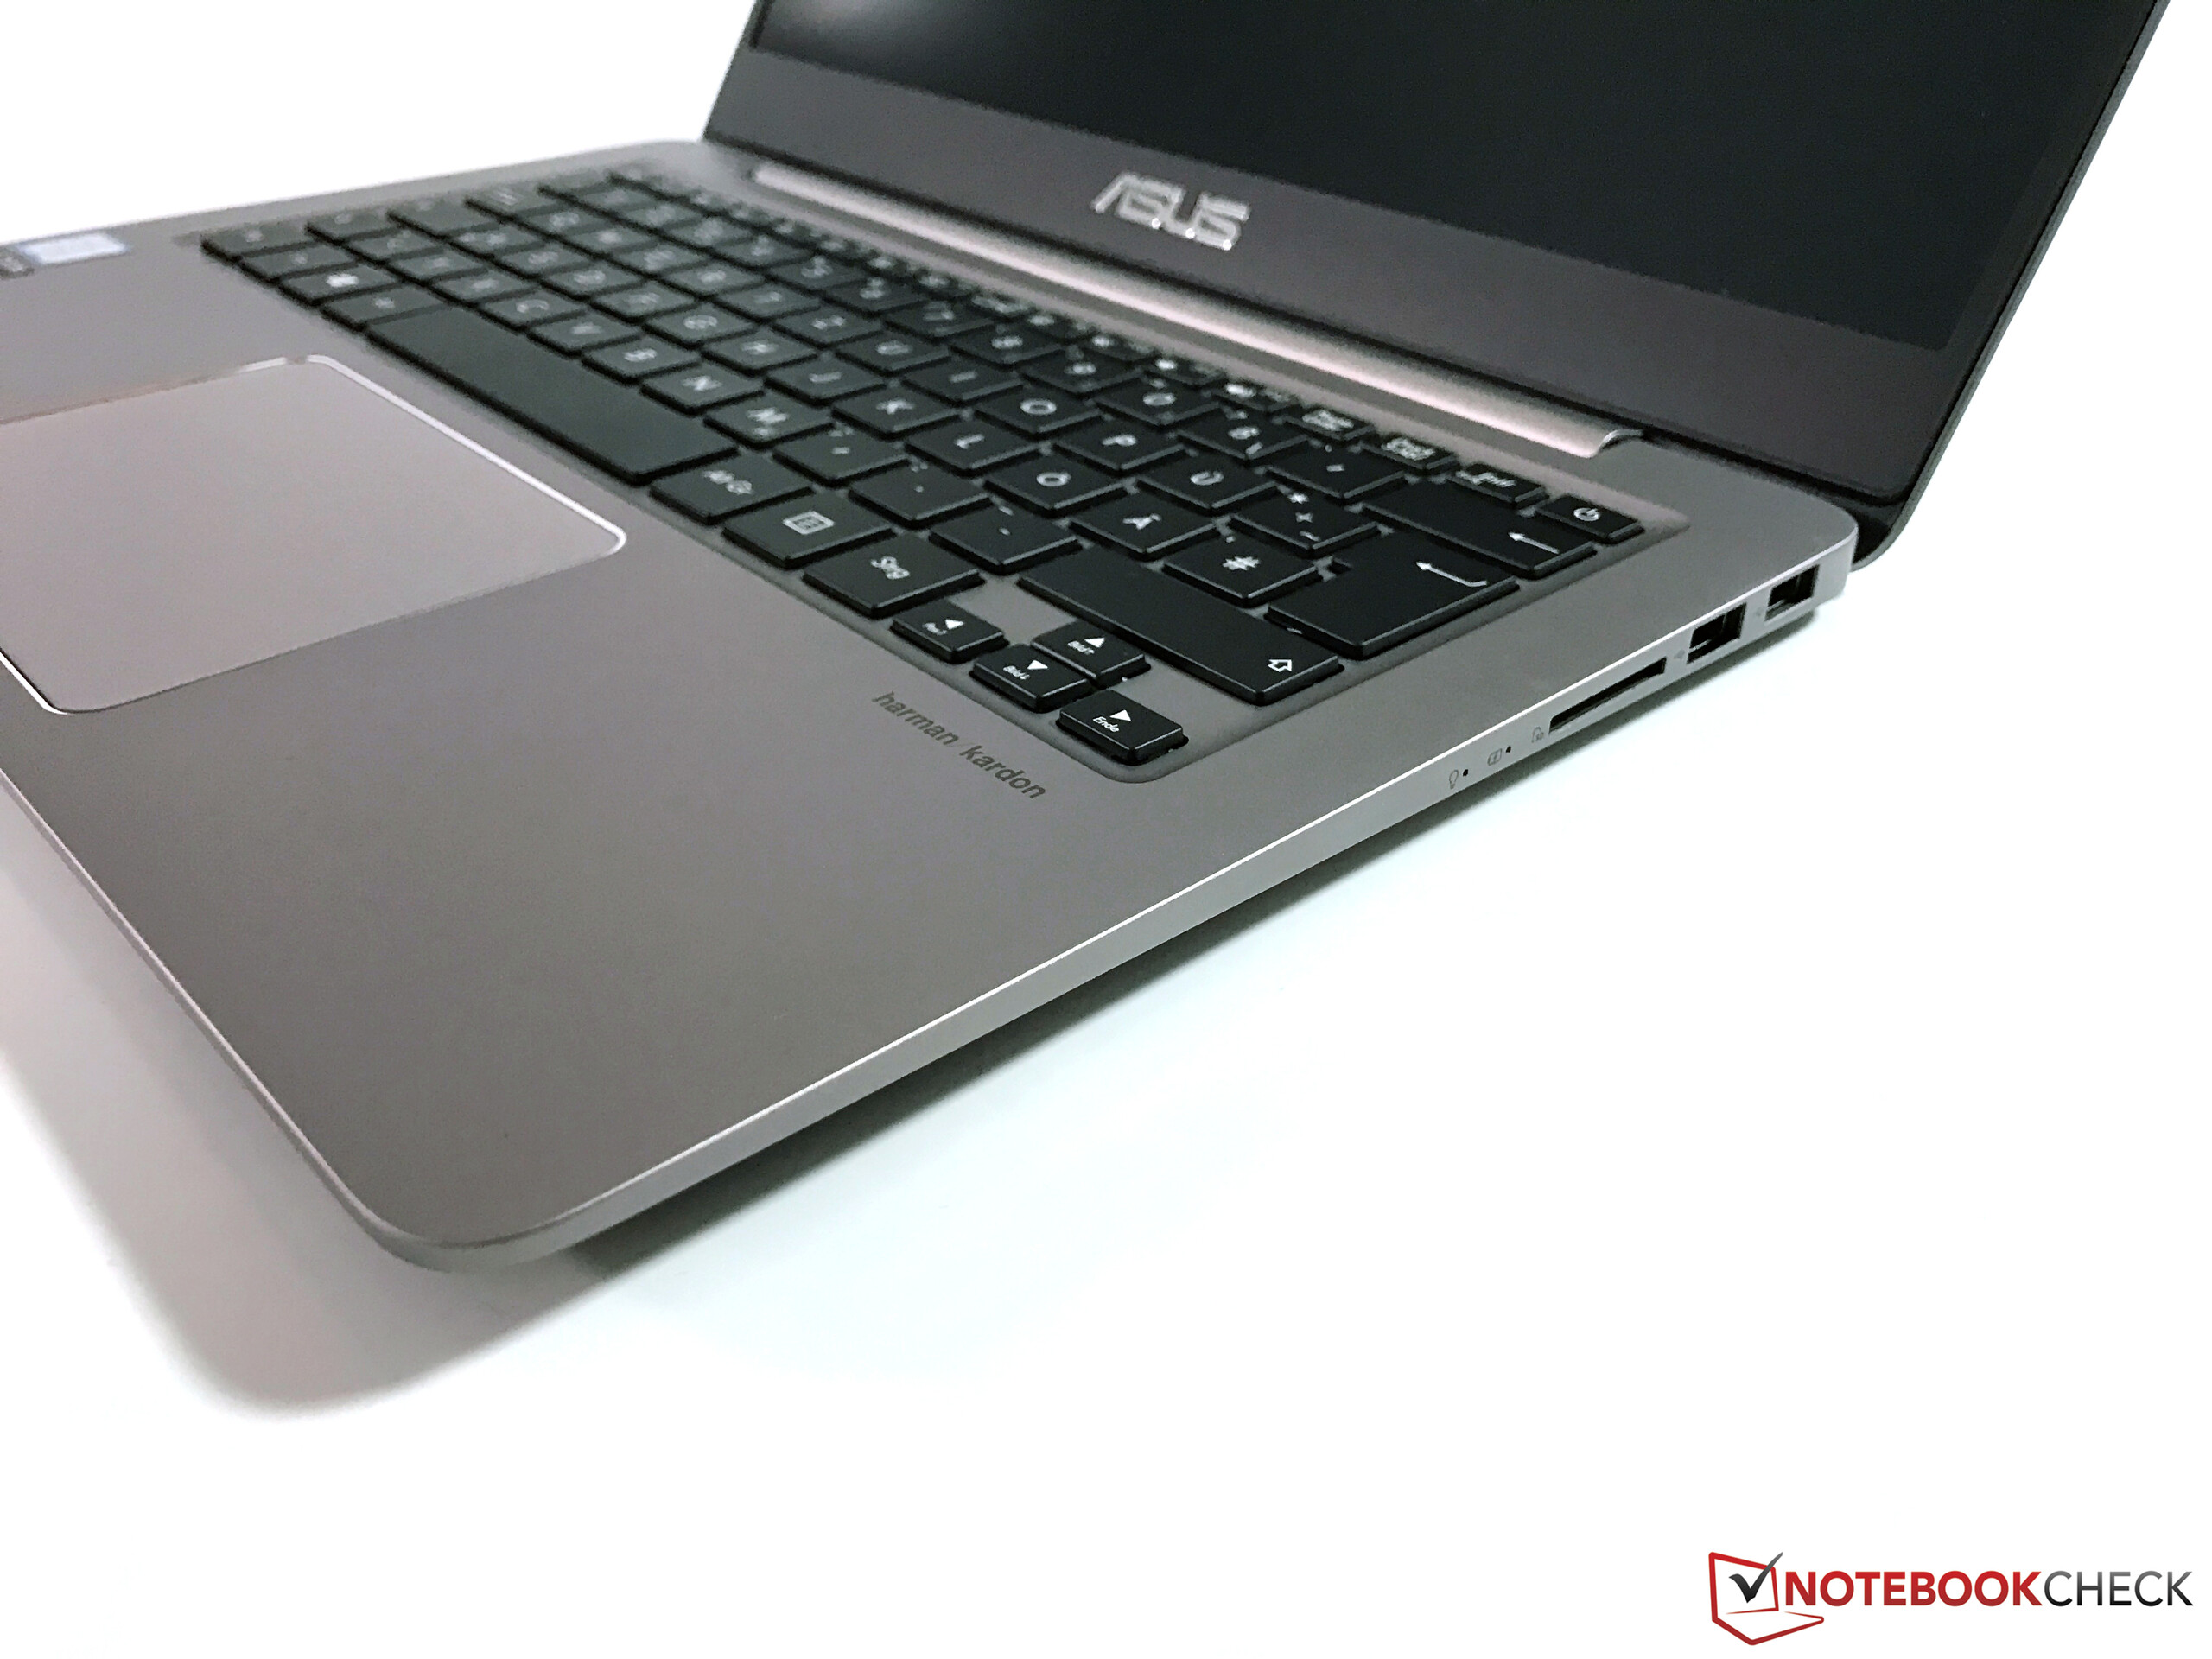
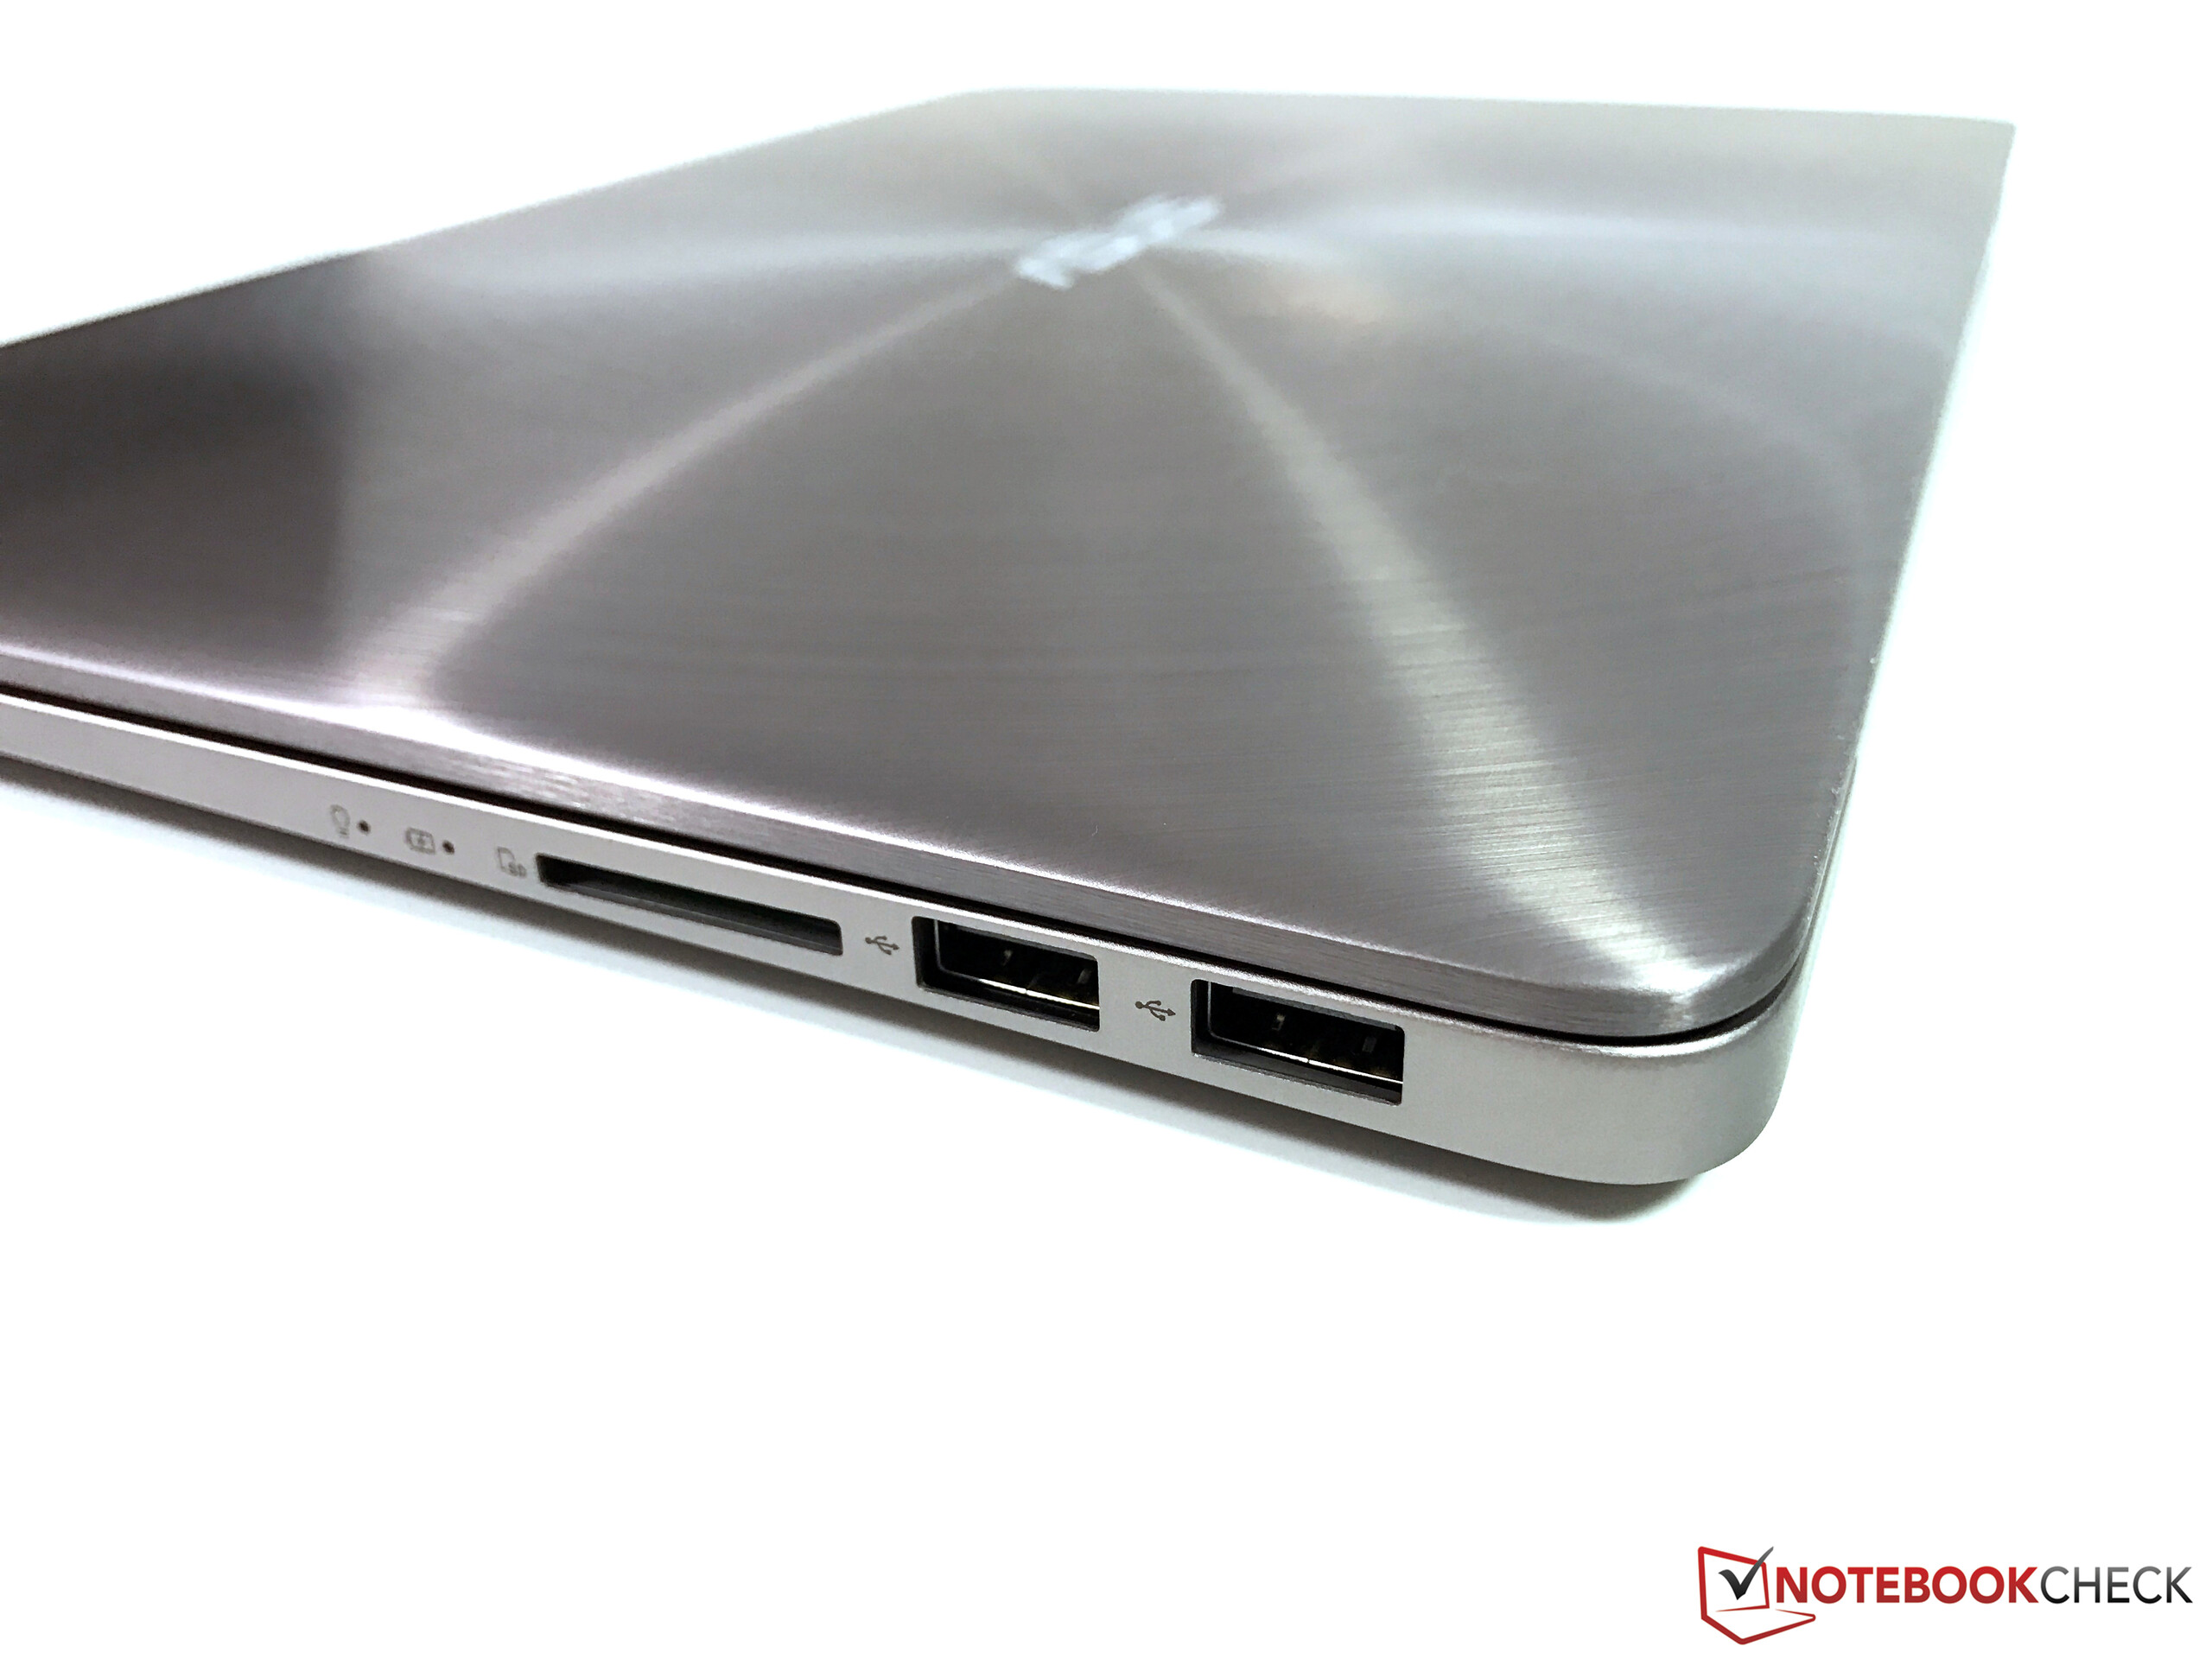
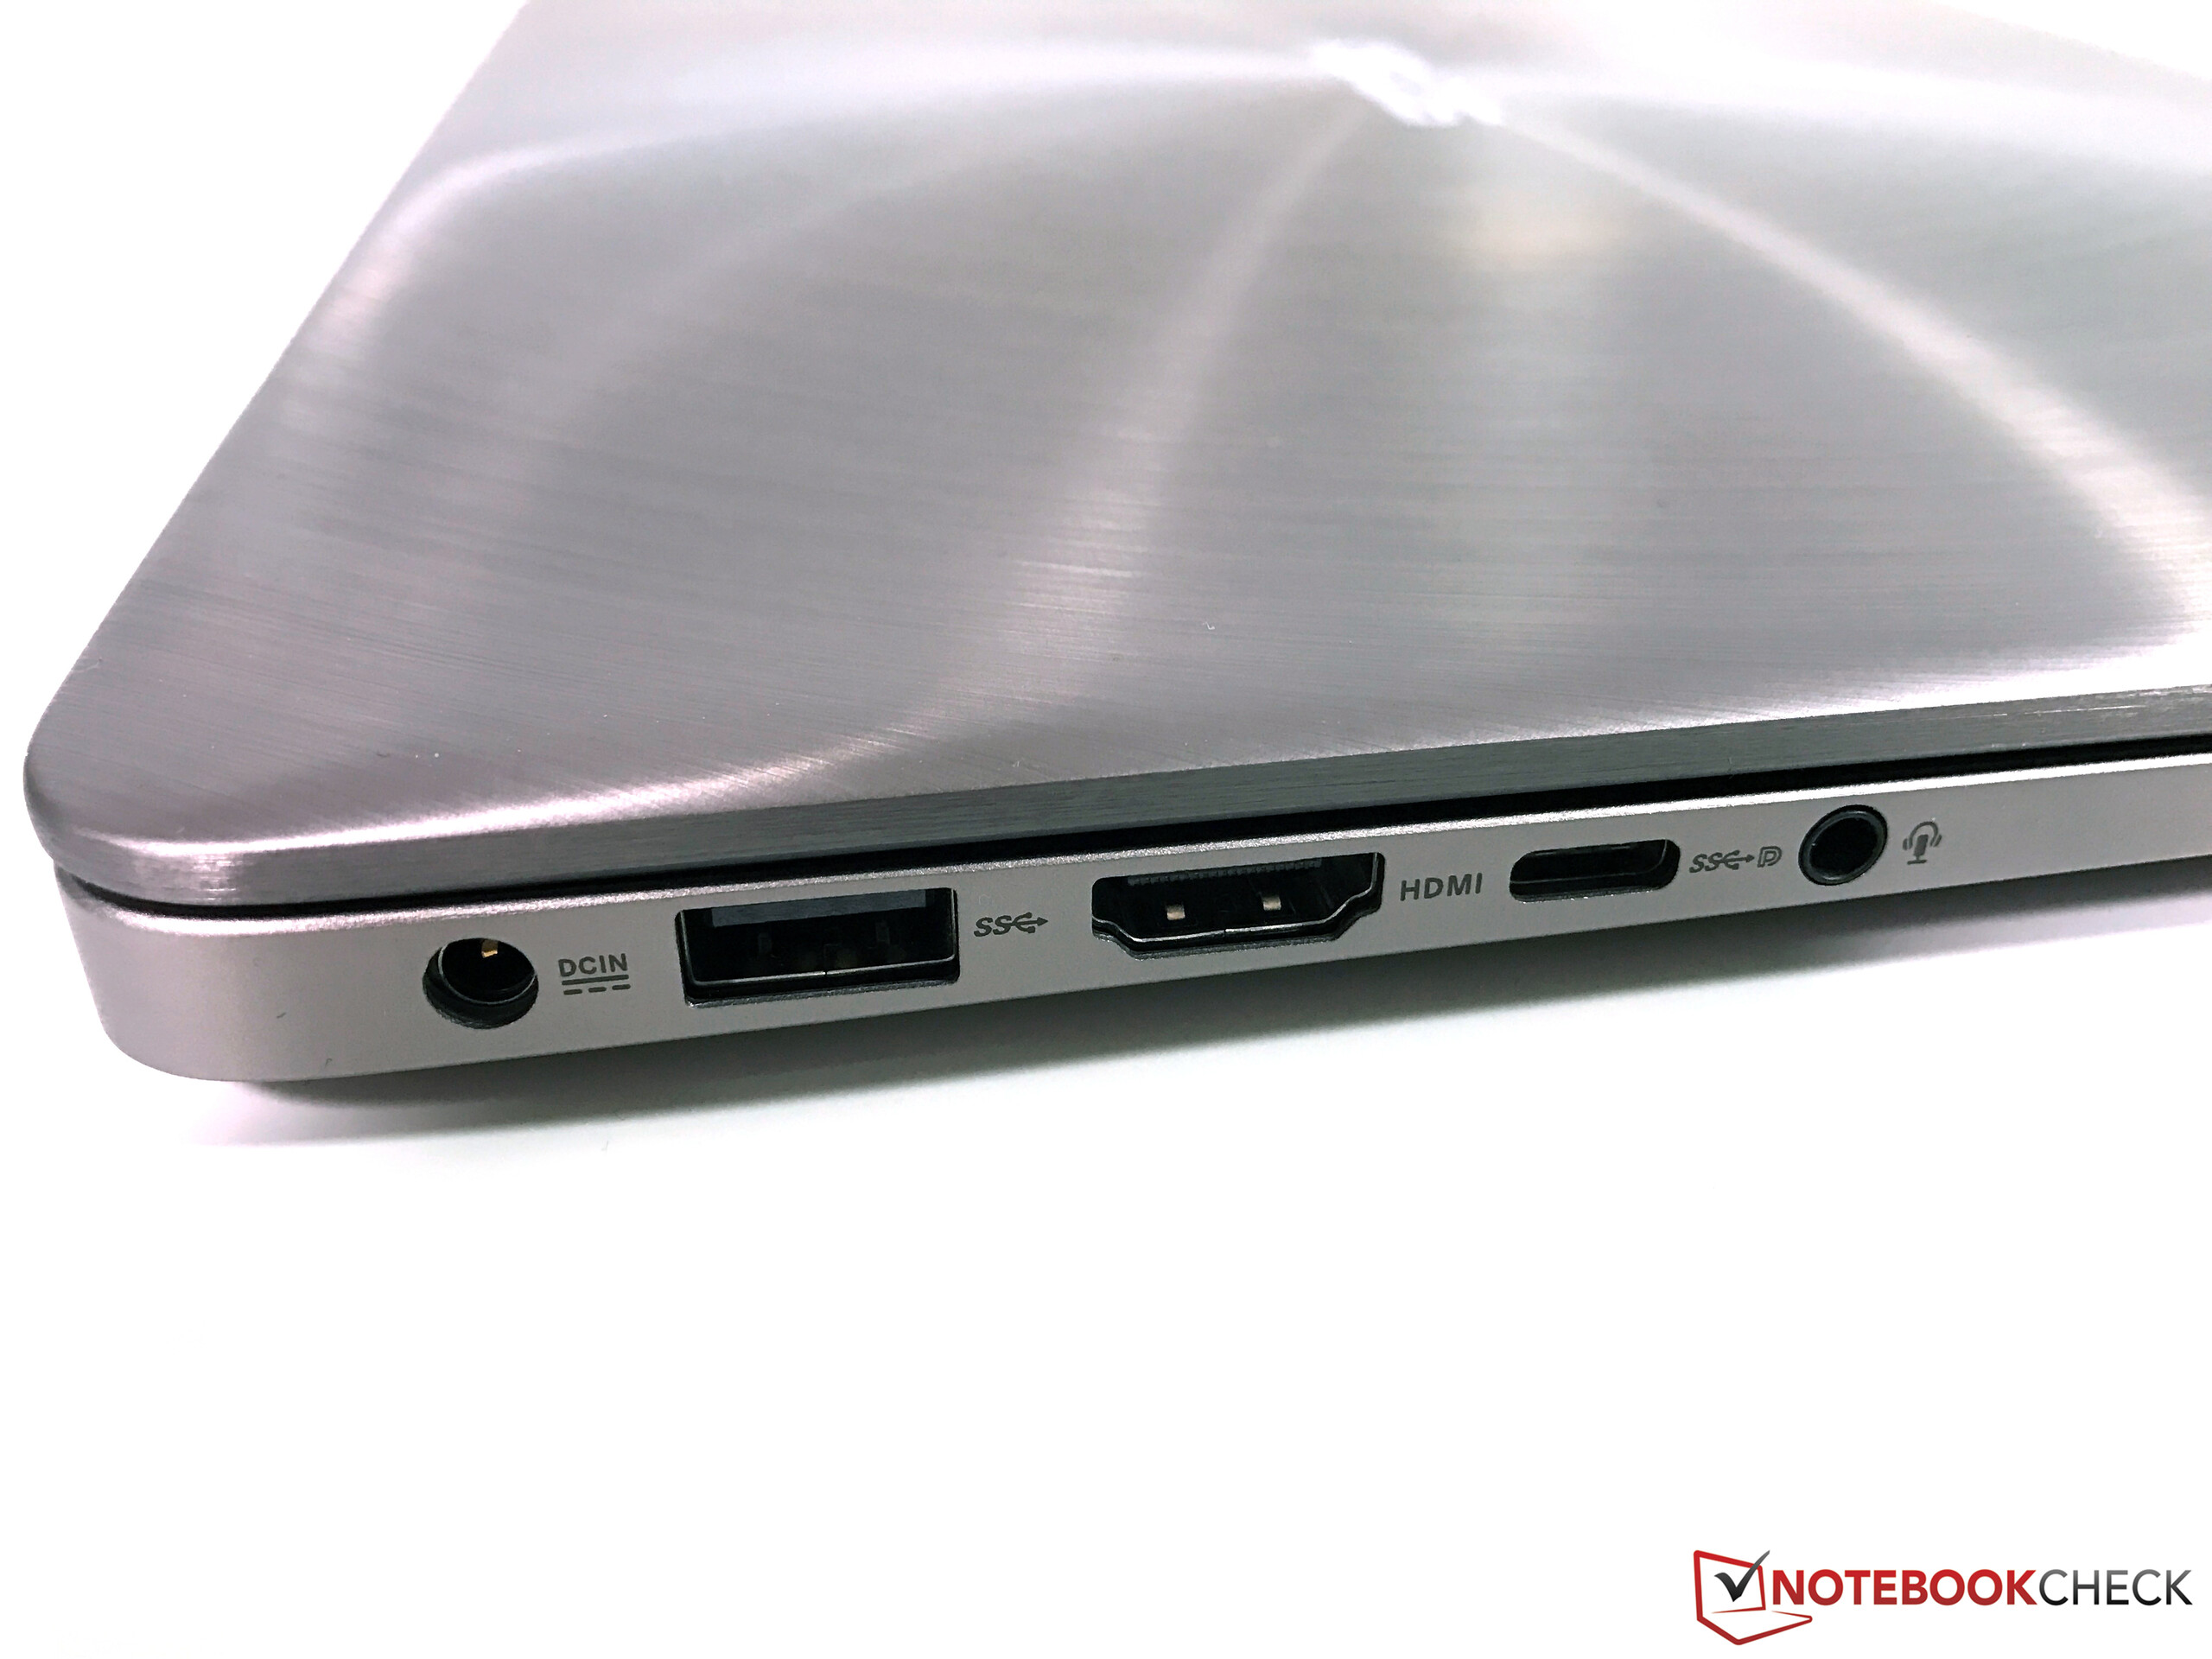
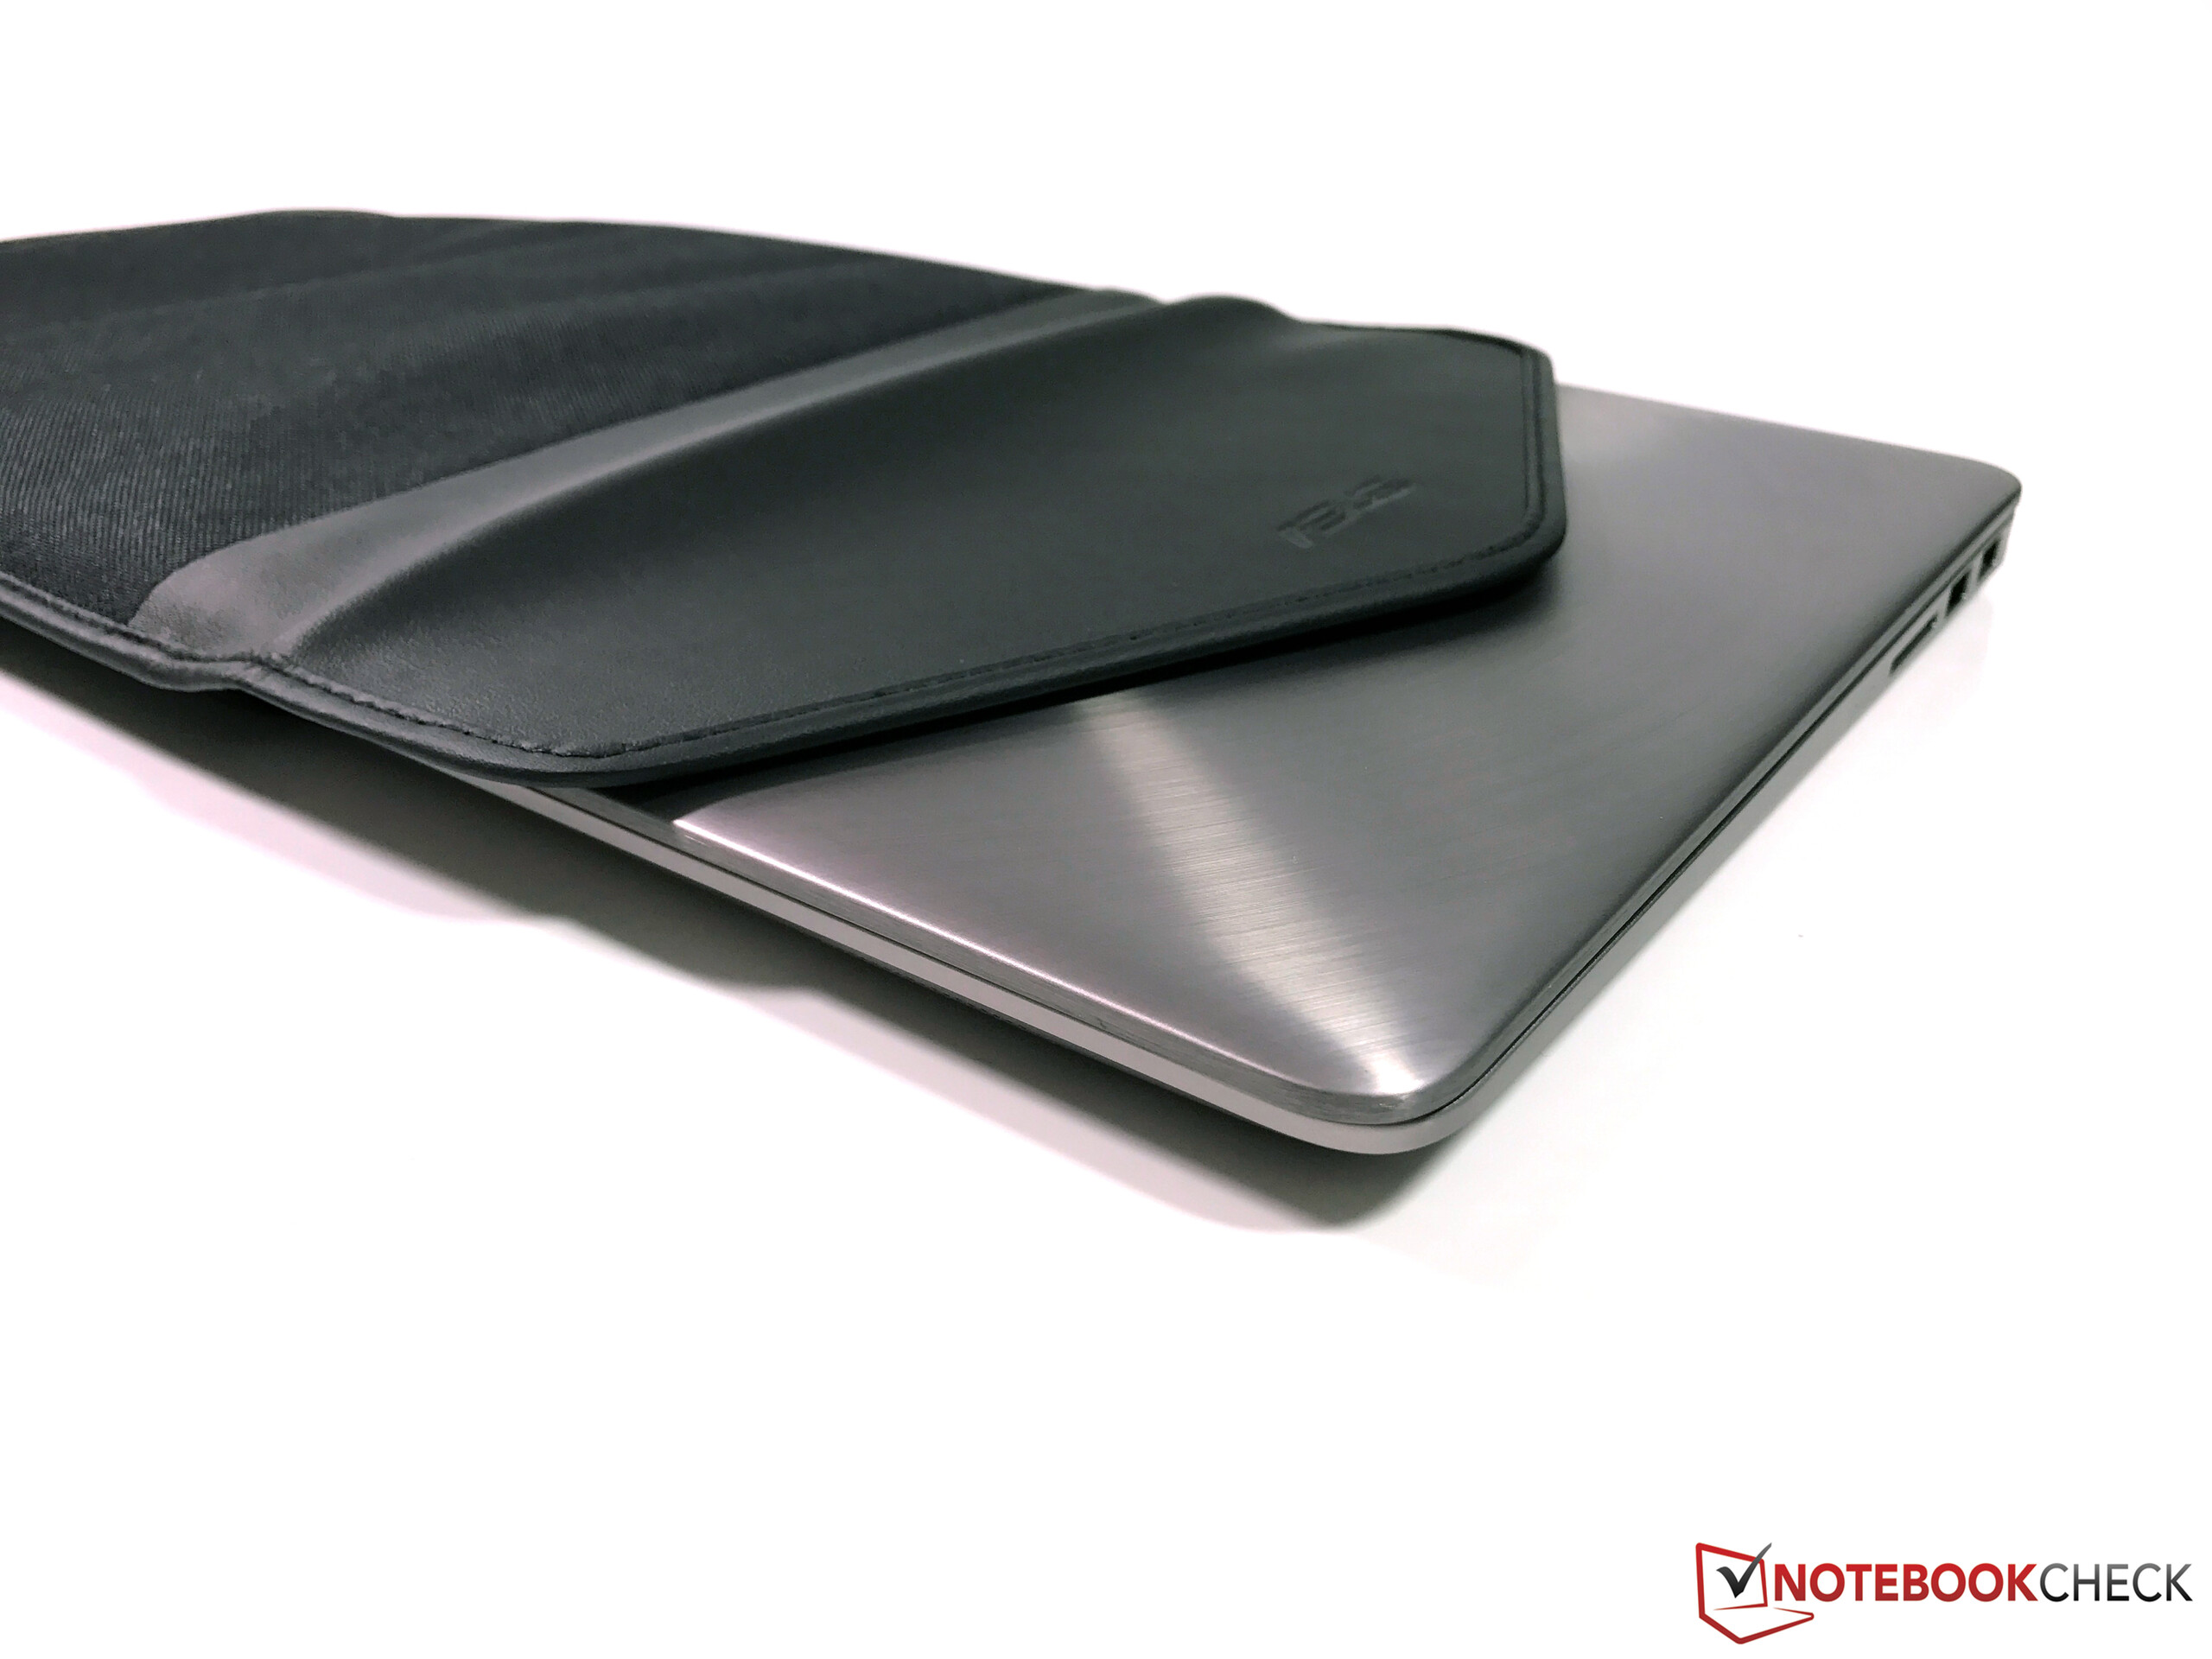
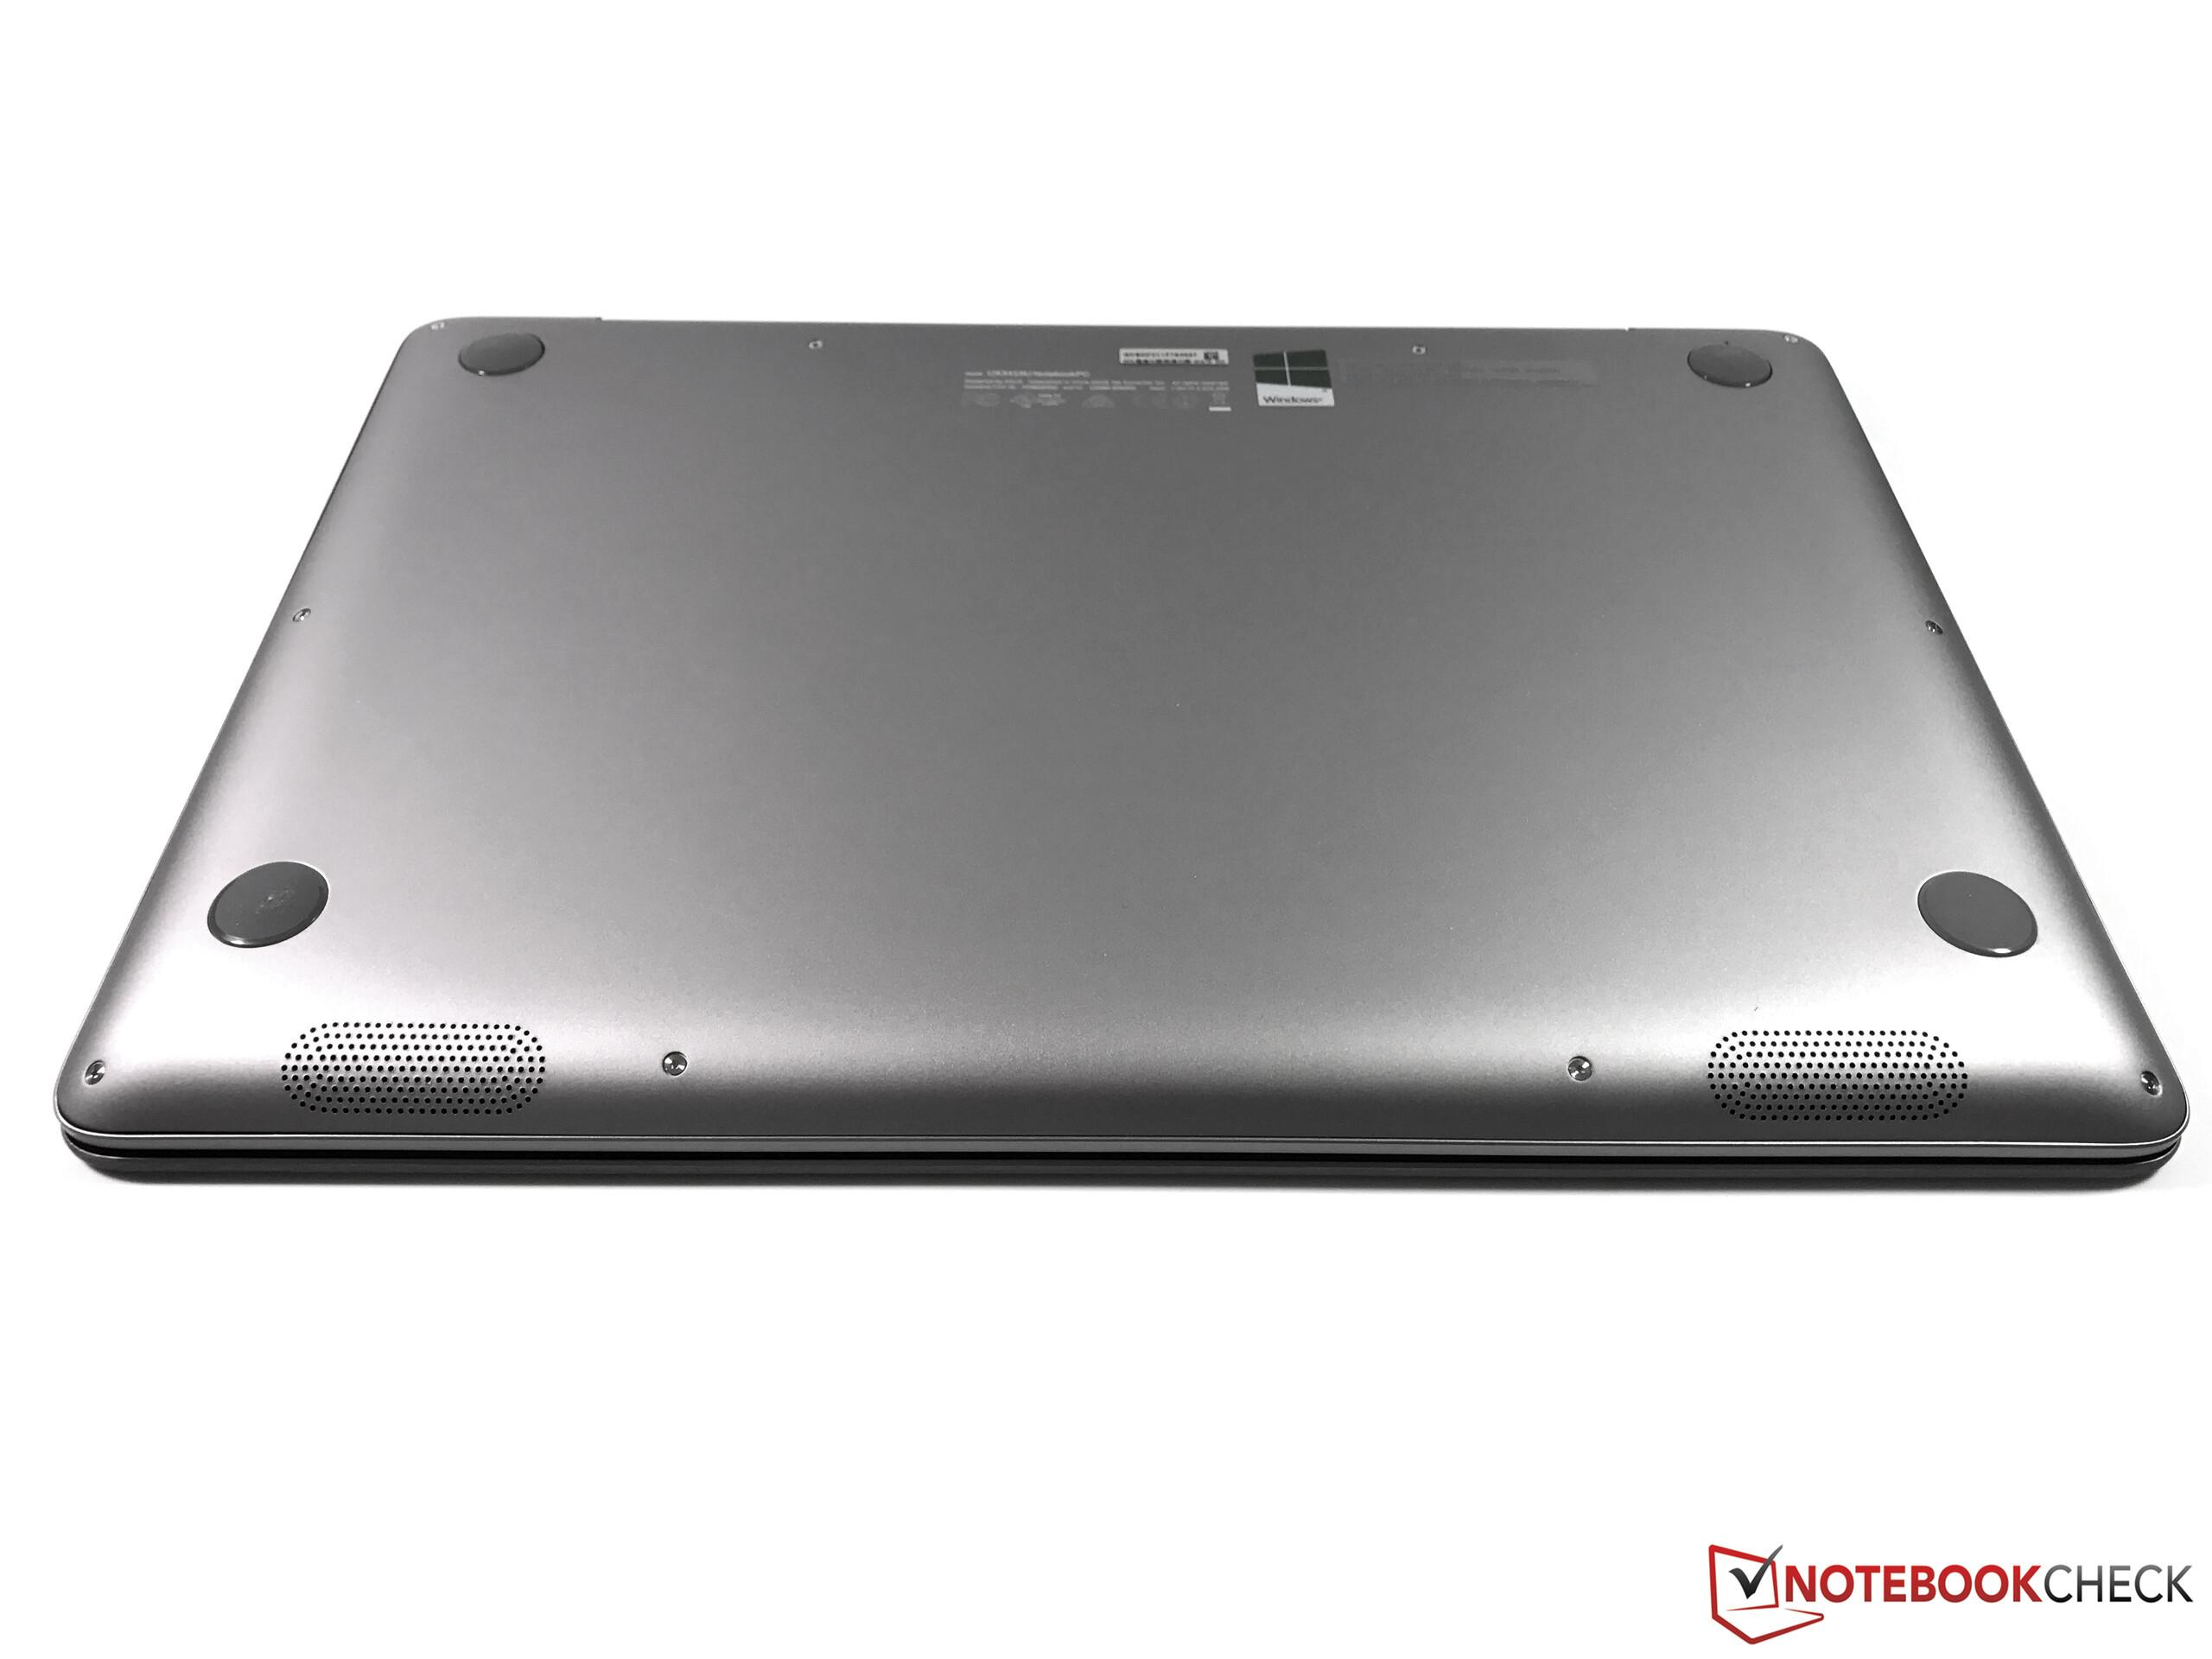
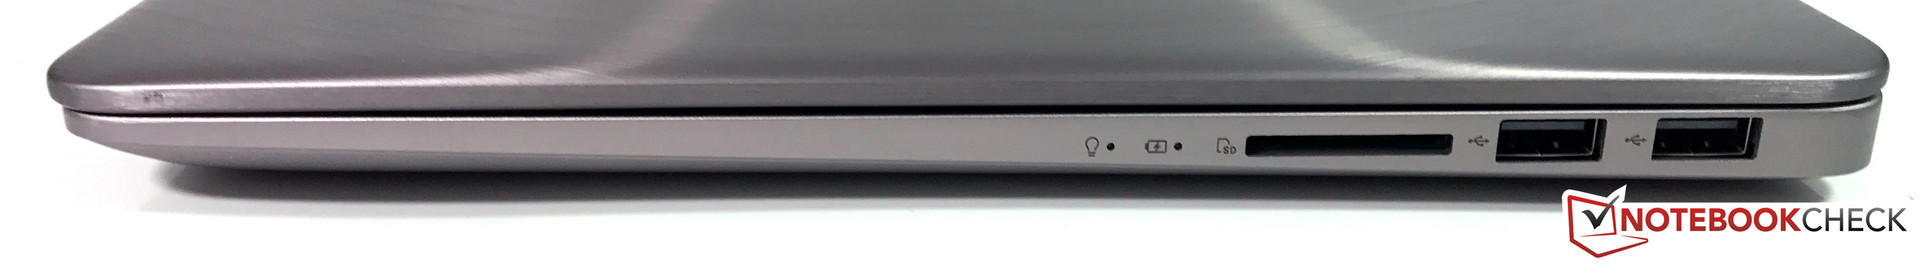
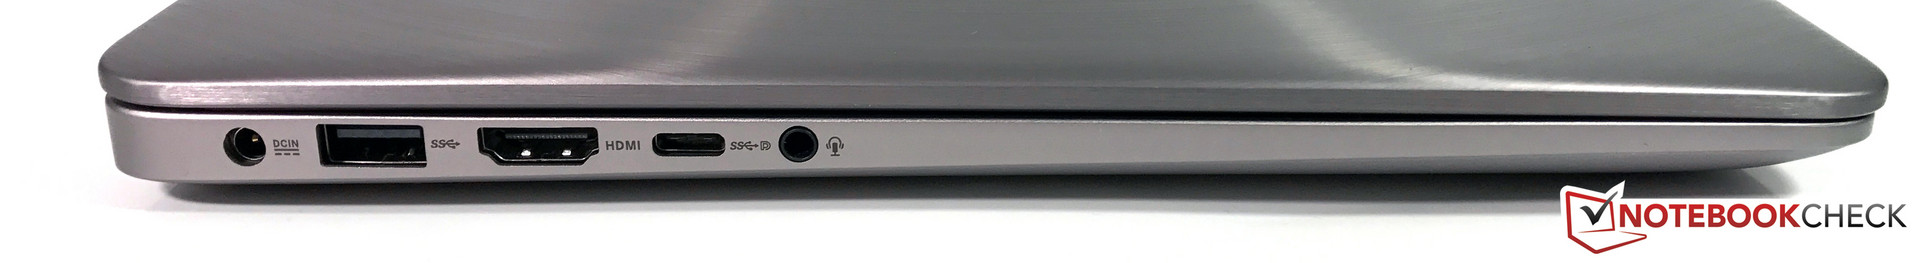
这台ZenBook在其他很多方面也都能够令人满意。它的铝合金机身精致坚固,处理器的性能潜力也得到了很好的发挥,输入设备也十分不错。多达四个的USB接口十分值得赞赏,不过这样一台价位超过1200欧元(约8830人民币)的设备仅支持USB 2.0标准让人有些难以接受。它的集成读卡器速度也不尽如人意。
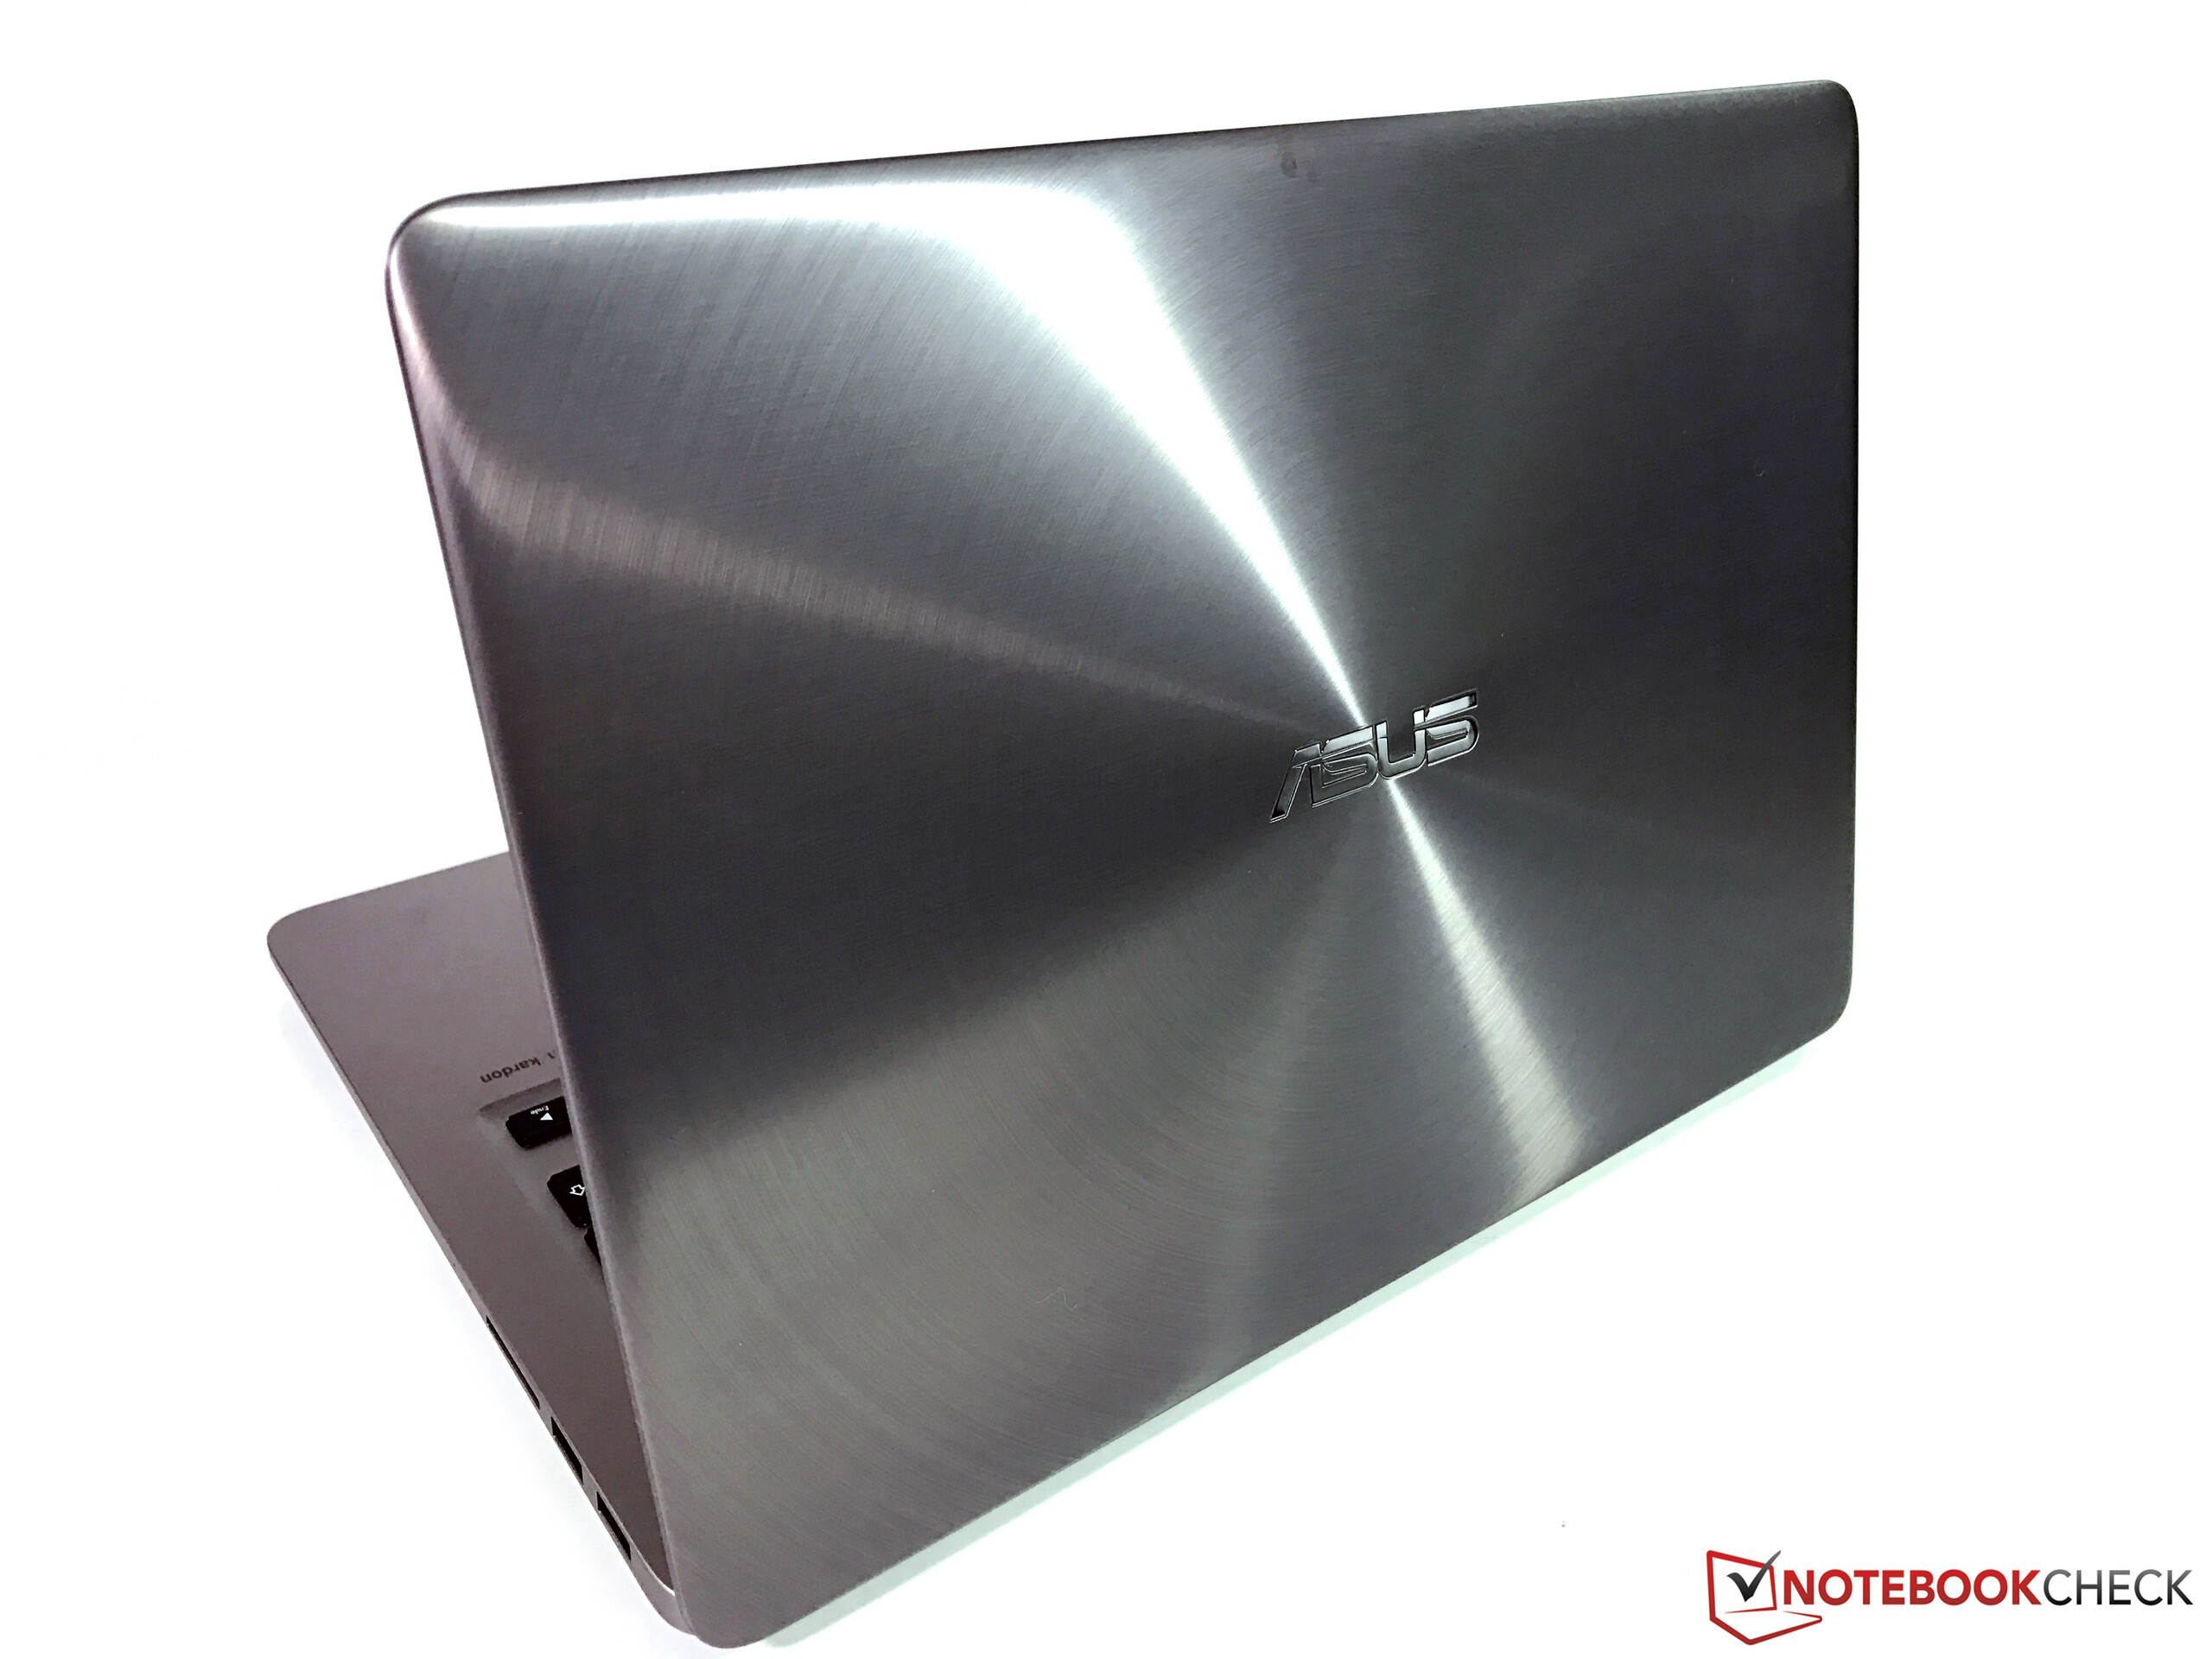
我们对它的散热风扇有些不太理解,它在较低负载下也会一直旋转发出不小的噪音。这可能是因为我们测试的是工程样机,我们希望这在后续软件更新中可以得到改善。标准版搭配独立显卡的ZenBook UX310UQ机型中的同样散热系统相比之下就安静许多。
注:本文是基于完整评测的缩减版本,阅读完整的英文评测,请点击这里。
Asus Zenbook UX3410UA
-
01/20/2017 v6(old)
Andreas Osthoff
Pricecompare
