 Deutsch
 English
 Español
 Français
 Italiano
 Nederlands
 Polski
 Português
 Русский
 Türkçe
 Svenska
 Chinese
 Magyar
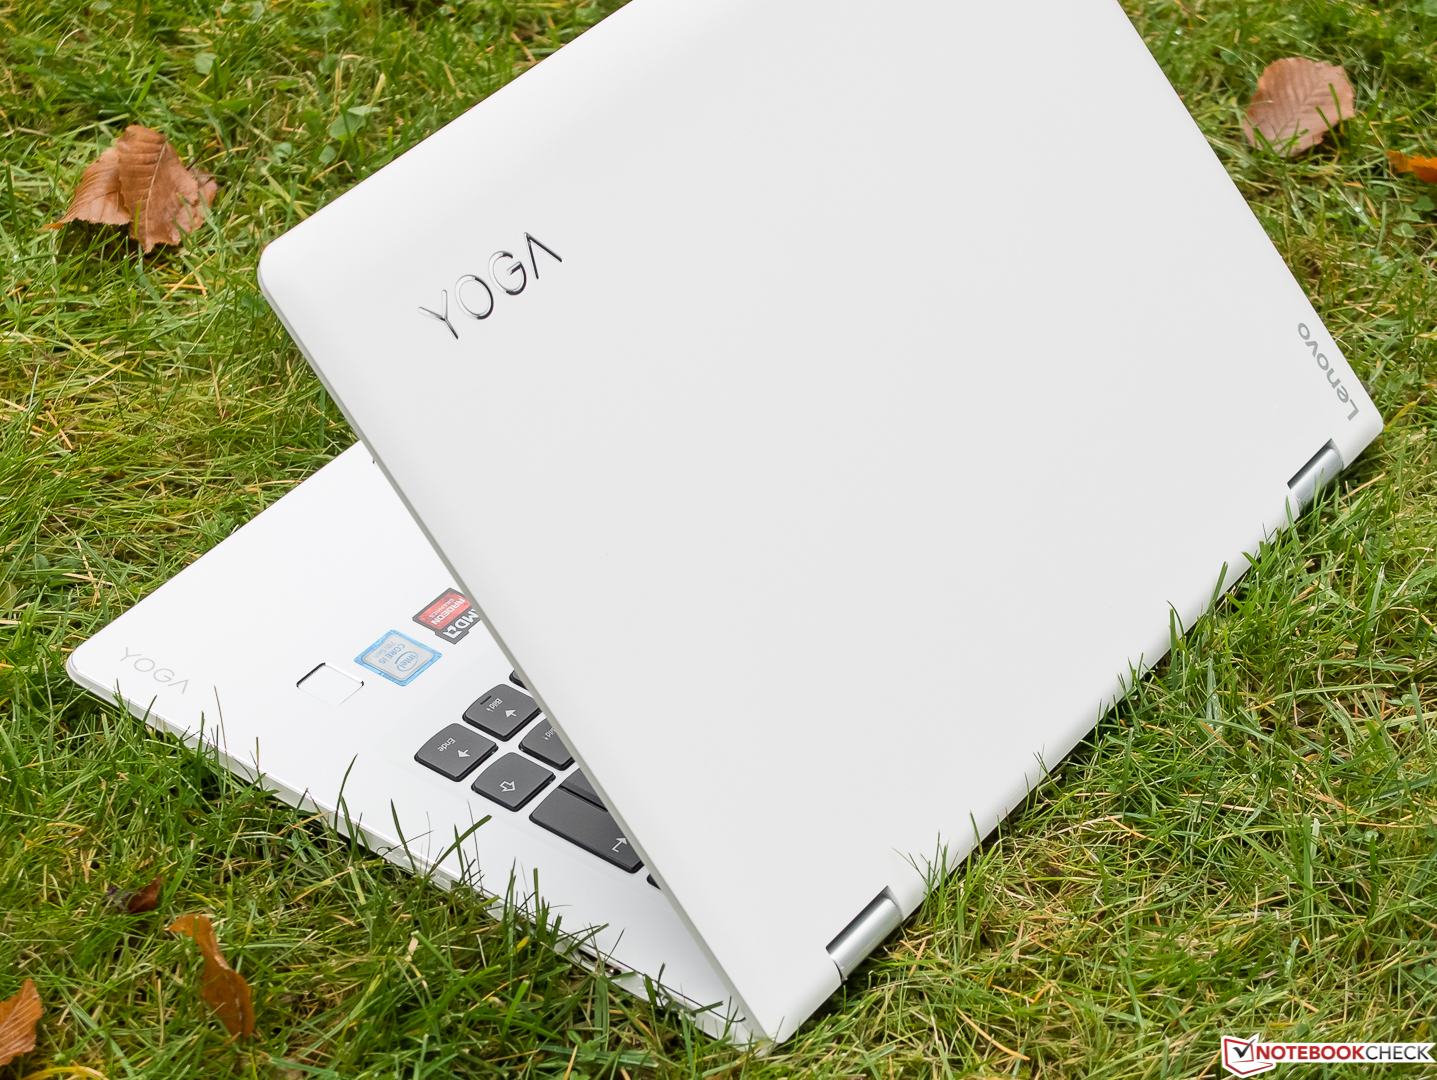
联想 Yoga 510-14IKB 变形本简短评测


| SD Card Reader | |
| average JPG Copy Test (av. of 3 runs) | |
| Lenovo Yoga 3 Pro 13 80HE004LGE | |
| Lenovo Yoga 510-14IKB | |
| Dell Inspiron 13 7359-4839 | |
| maximum AS SSD Seq Read Test (1GB) | |
| Lenovo Yoga 3 Pro 13 80HE004LGE | |
| Lenovo Yoga 510-14IKB | |
| Dell Inspiron 13 7359-4839 | |
| Networking | |
| iperf Server (receive) TCP 1 m | |
| Lenovo Yoga 510-14IKB | |
| iperf Client (transmit) TCP 1 m | |
| Lenovo Yoga 510-14IKB | |
| |||||||||||||||||||||||||
Brightness Distribution: 91 %
Center on Battery: 242 cd/m²
Contrast: 759:1 (Black: 0.32 cd/m²)
ΔE Color 5.44 | 0.5-29.43 Ø5
ΔE Greyscale 4.74 | 0.57-98 Ø5.3
62.5% sRGB (Argyll 1.6.3 3D)
39.6% AdobeRGB 1998 (Argyll 1.6.3 3D)
43.17% AdobeRGB 1998 (Argyll 2.2.0 3D)
62.9% sRGB (Argyll 2.2.0 3D)
41.78% Display P3 (Argyll 2.2.0 3D)
Gamma: 2.38
| Lenovo Yoga 510-14IKB BOE0637 / BOE DT NV140FHM-N41, , 1920x1080, 14.00 | HP Spectre x360 13-w023dx Chi Mei CMN1367, , 1920x1080, 13.30 | Lenovo Yoga 3 Pro 13 80HE004LGE Samsung L_LLTN133YL03L01, , 3200x1800, 13.30 | Dell Inspiron 13 7359-4839 Samsung SDC864D / 133HL [Dell P/N: PVFF5], , 1920x1080, 13.30 | |
|---|---|---|---|---|
| Display | 51% | 50% | -4% | |
| Display P3 Coverage | 41.78 | 65.4 57% | 64.6 55% | 40.31 -4% |
| sRGB Coverage | 62.9 | 90.4 44% | 89.5 42% | 60.5 -4% |
| AdobeRGB 1998 Coverage | 43.17 | 65.8 52% | 65.5 52% | 41.65 -4% |
| Response Times | 33% | 113% | 27% | |
| Response Time Grey 50% / Grey 80% * | 53 ? | 33.2 ? 37% | 36 ? 32% | 38 ? 28% |
| Response Time Black / White * | 39 ? | 28 ? 28% | 28 ? 28% | 29 ? 26% |
| PWM Frequency | 350 ? | 1330 ? 280% | ||
| Screen | 8% | 16% | -15% | |
| Brightness middle | 243 | 334.6 38% | 314 29% | 253 4% |
| Brightness | 248 | 319 29% | 294 19% | 232 -6% |
| Brightness Distribution | 91 | 90 -1% | 83 -9% | 83 -9% |
| Black Level * | 0.32 | 0.336 -5% | 0.57 -78% | 0.28 12% |
| Contrast | 759 | 996 31% | 551 -27% | 904 19% |
| Colorchecker dE 2000 * | 5.44 | 6.21 -14% | 2.18 60% | 6.36 -17% |
| Colorchecker dE 2000 max. * | 9.73 | 12 -23% | 6.48 33% | 12.72 -31% |
| Greyscale dE 2000 * | 4.74 | 7.71 -63% | 2.45 48% | 10.26 -116% |
| Gamma | 2.38 92% | 2.36 93% | 2.39 92% | 2.28 96% |
| CCT | 7799 83% | 6458 101% | 6745 96% | 6500 100% |
| Color Space (Percent of AdobeRGB 1998) | 39.6 | 58.6 48% | 58 46% | 38 -4% |
| Color Space (Percent of sRGB) | 62.5 | 90 44% | 89 42% | 60 -4% |
| Total Average (Program / Settings) | 31% /
20% | 60% /
41% | 3% /
-7% |
* ... smaller is better
Display Response Times
| ↔ Response Time Black to White | ||
|---|---|---|
| 39 ms ... rise ↗ and fall ↘ combined | ↗ 12 ms rise | 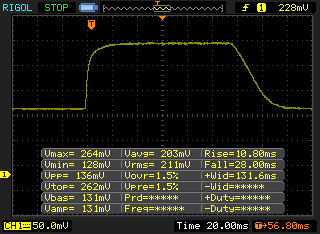 |
| ↘ 27 ms fall | ||
| The screen shows slow response rates in our tests and will be unsatisfactory for gamers. In comparison, all tested devices range from 0.1 (minimum) to 240 (maximum) ms. » 96 % of all devices are better. This means that the measured response time is worse than the average of all tested devices (21.5 ms). | ||
| ↔ Response Time 50% Grey to 80% Grey | ||
| 53 ms ... rise ↗ and fall ↘ combined | ↗ 20 ms rise | 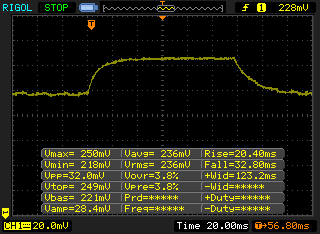 |
| ↘ 33 ms fall | ||
| The screen shows slow response rates in our tests and will be unsatisfactory for gamers. In comparison, all tested devices range from 0.2 (minimum) to 636 (maximum) ms. » 88 % of all devices are better. This means that the measured response time is worse than the average of all tested devices (33.7 ms). | ||
Screen Flickering / PWM (Pulse-Width Modulation)
| Screen flickering / PWM detected | 350 Hz | ≤ 60 % brightness setting | 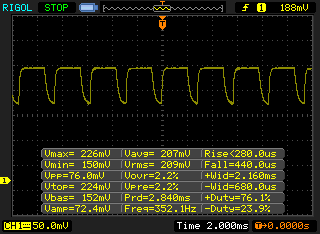 |
The display backlight flickers at 350 Hz (worst case, e.g., utilizing PWM) Flickering detected at a brightness setting of 60 % and below. There should be no flickering or PWM above this brightness setting. The frequency of 350 Hz is relatively high, so most users sensitive to PWM should not notice any flickering. However, there are reports that some users are still sensitive to PWM at 500 Hz and above, so be aware. In comparison: 53 % of all tested devices do not use PWM to dim the display. If PWM was detected, an average of 17900 (minimum: 5 - maximum: 3846000) Hz was measured. | |||


| Cinebench R15 | |
| CPU Single 64Bit | |
| Lenovo Yoga 510-14IKB | |
| HP Spectre x360 13-w023dx | |
| Dell Inspiron 13 7359-4839 | |
| Lenovo Yoga 3 Pro 13 80HE004LGE | |
| CPU Multi 64Bit | |
| Lenovo Yoga 510-14IKB | |
| HP Spectre x360 13-w023dx | |
| Dell Inspiron 13 7359-4839 | |
| Lenovo Yoga 3 Pro 13 80HE004LGE | |
| PCMark 8 - Home Score Accelerated v2 | |
| HP Spectre x360 13-w023dx | |
| Lenovo Yoga 510-14IKB | |
| Dell Inspiron 13 7359-4839 | |
| Lenovo Yoga 3 Pro 13 80HE004LGE | |
| PCMark 8 Home Score Accelerated v2 | 3550 points | |
| PCMark 8 Creative Score Accelerated v2 | 4529 points | |
Help | ||
| Lenovo Yoga 510-14IKB Samsung MZYTY256HDHP | HP Spectre x360 13-w023dx Samsung PM951 NVMe MZVLV512 | Lenovo Yoga 3 Pro 13 80HE004LGE Samsung SSD PM851 MZNTE512HMJH | Dell Inspiron 13 7359-4839 Liteonit LCH-256V2S | |
|---|---|---|---|---|
| CrystalDiskMark 3.0 | 63% | -9% | -15% | |
| Read Seq | 518 | 1376 166% | 521 1% | 486.3 -6% |
| Write Seq | 476.5 | 571 20% | 238.6 -50% | 283.7 -40% |
| Read 512 | 408 | 679 66% | 417.3 2% | 337.5 -17% |
| Write 512 | 274.5 | 571 108% | 237.7 -13% | 283.5 3% |
| Read 4k | 35.66 | 42.66 20% | 35.9 1% | 26.75 -25% |
| Write 4k | 106.7 | 137.9 29% | 99.9 -6% | 85.3 -20% |
| Read 4k QD32 | 368.7 | 535 45% | 366.6 -1% | 309.7 -16% |
| Write 4k QD32 | 246.3 | 361.2 47% | 236.7 -4% | 250.8 2% |

| 3DMark 11 - 1280x720 Performance GPU | |
| Lenovo Yoga 510-14IKB | |
| HP Spectre x360 13-w023dx | |
| Dell Inspiron 13 7359-4839 | |
| Lenovo Yoga 3 Pro 13 80HE004LGE | |
| 3DMark - 1280x720 Cloud Gate Standard Graphics | |
| HP Spectre x360 13-w023dx | |
| Dell Inspiron 13 7359-4839 | |
| Lenovo Yoga 510-14IKB | |
| Lenovo Yoga 3 Pro 13 80HE004LGE | |
| 3DMark 06 Standard Score | 6246 points | |
| 3DMark Vantage P Result | 4697 points | |
| 3DMark 11 Performance | 1772 points | |
| 3DMark Ice Storm Standard Score | 39823 points | |
| 3DMark Cloud Gate Standard Score | 4744 points | |
| 3DMark Fire Strike Score | 899 points | |
Help | ||
| low | med. | high | ultra | |
| Diablo III (2012) | 66.1 | 42.3 | 34.2 | 21.4 |
| StarCraft II: Heart of the Swarm (2013) | 43.9 | 25.9 | 10 | |
| BioShock Infinite (2013) | 42.3 | 26.5 | 22.5 | 8.2 |
| Metro: Last Light (2013) | 29.1 | 21.2 | 12.4 | |
| Battlefield 4 (2013) | 42.9 | 29.9 | 19.1 | |
| Dirt Rally (2015) | 117.3 | 32.5 | 15.9 | |
| The Witcher 3 (2015) | 18 | |||
| Dota 2 Reborn (2015) | 74 | 50.6 | 20.6 | 19.1 |
| Anno 2205 (2015) | 27.7 | 14.1 | ||
| Fallout 4 (2015) | 19.4 | 12.8 | ||
| Star Wars Battlefront (2015) | 36.3 | 22.2 | 10.1 | |
| Rainbow Six Siege (2015) | 47 | 29.3 | 14.2 | |
| Just Cause 3 (2015) | 25.1 | 19.5 | ||
| Far Cry Primal (2016) | 19 | 9 | ||
| The Division (2016) | 0 game wont start | |||
| Overwatch (2016) | 41.3 | 31.3 | 14.5 | |
| Mirror's Edge Catalyst (2016) | 27 | 16.3 | ||
| Deus Ex Mankind Divided (2016) | 13.5 | |||
| Farming Simulator 17 (2016) | 66.1 | 43 | 17.3 |
Noise Level
| Idle |
| 29 / 29 / 29 dB(A) |
| Load |
| 37.3 / 43.1 dB(A) |
 | ||
30 dB silent 40 dB(A) audible 50 dB(A) loud |
||
min: | ||
(±) The maximum temperature on the upper side is 40.1 °C / 104 F, compared to the average of 35.3 °C / 96 F, ranging from 19.6 to 55.7 °C for the class Convertible.
(-) The bottom heats up to a maximum of 46.1 °C / 115 F, compared to the average of 36.8 °C / 98 F
(+) In idle usage, the average temperature for the upper side is 25.1 °C / 77 F, compared to the device average of 30.2 °C / 86 F.
(+) The palmrests and touchpad are cooler than skin temperature with a maximum of 28.2 °C / 82.8 F and are therefore cool to the touch.
(±) The average temperature of the palmrest area of similar devices was 28.1 °C / 82.6 F (-0.1 °C / -0.2 F).
Lenovo Yoga 510-14IKB audio analysis
(±) | speaker loudness is average but good (78 dB)
Bass 100 - 315 Hz
(-) | nearly no bass - on average 16% lower than median
(±) | linearity of bass is average (14.5% delta to prev. frequency)
Mids 400 - 2000 Hz
(+) | balanced mids - only 4.1% away from median
(±) | linearity of mids is average (9.8% delta to prev. frequency)
Highs 2 - 16 kHz
(+) | balanced highs - only 3.4% away from median
(+) | highs are linear (6.5% delta to prev. frequency)
Overall 100 - 16.000 Hz
(±) | linearity of overall sound is average (22.7% difference to median)
Compared to same class
» 64% of all tested devices in this class were better, 6% similar, 30% worse
» The best had a delta of 6%, average was 21%, worst was 57%
Compared to all devices tested
» 62% of all tested devices were better, 6% similar, 32% worse
» The best had a delta of 4%, average was 25%, worst was 134%
HP Spectre x360 13-w023dx audio analysis
(±) | speaker loudness is average but good (76.2 dB)
Bass 100 - 315 Hz
(-) | nearly no bass - on average 17% lower than median
(±) | linearity of bass is average (12.7% delta to prev. frequency)
Mids 400 - 2000 Hz
(+) | balanced mids - only 3.7% away from median
(+) | mids are linear (6.3% delta to prev. frequency)
Highs 2 - 16 kHz
(+) | balanced highs - only 2.4% away from median
(±) | linearity of highs is average (7.2% delta to prev. frequency)
Overall 100 - 16.000 Hz
(±) | linearity of overall sound is average (21.9% difference to median)
Compared to same class
» 59% of all tested devices in this class were better, 8% similar, 34% worse
» The best had a delta of 6%, average was 21%, worst was 57%
Compared to all devices tested
» 58% of all tested devices were better, 7% similar, 35% worse
» The best had a delta of 4%, average was 25%, worst was 134%
Lenovo Yoga 3 Pro 13 80HE004LGE audio analysis
(-) | not very loud speakers (68 dB)
Analysis not possible as minimum curve is missing or too high
Dell Inspiron 13 7359-4839 audio analysis
(-) | not very loud speakers (68 dB)
Bass 100 - 315 Hz
(±) | reduced bass - on average 8.4% lower than median
(+) | bass is linear (6.8% delta to prev. frequency)
Mids 400 - 2000 Hz
(+) | balanced mids - only 4.7% away from median
(+) | mids are linear (6.8% delta to prev. frequency)
Highs 2 - 16 kHz
(+) | balanced highs - only 1.9% away from median
(±) | linearity of highs is average (7.9% delta to prev. frequency)
Overall 100 - 16.000 Hz
(+) | overall sound is linear (14.1% difference to median)
Compared to same class
» 16% of all tested devices in this class were better, 4% similar, 80% worse
» The best had a delta of 6%, average was 21%, worst was 57%
Compared to all devices tested
» 13% of all tested devices were better, 3% similar, 83% worse
» The best had a delta of 4%, average was 25%, worst was 134%
| Off / Standby | |
| Idle | |
| Load |
|
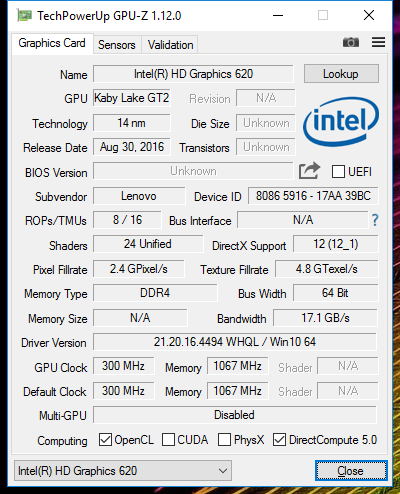
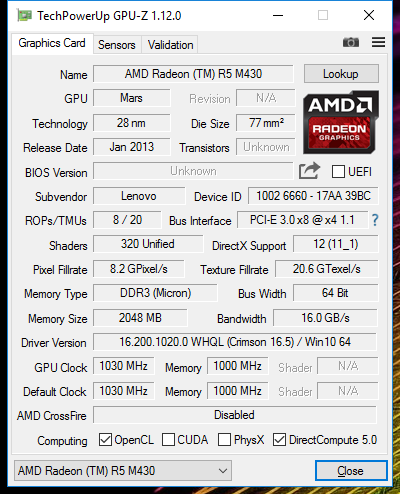
| Lenovo Yoga 510-14IKB i5-7200U, Radeon R5 M430, Samsung MZYTY256HDHP, IPS, 1920x1080, 14.00 | HP Spectre x360 13-w023dx i7-7500U, HD Graphics 620, Samsung PM951 NVMe MZVLV512, IPS, 1920x1080, 13.30 | Lenovo Yoga 3 Pro 13 80HE004LGE 5Y70, HD Graphics 5300, Samsung SSD PM851 MZNTE512HMJH, IPS, 3200x1800, 13.30 | Dell Inspiron 13 7359-4839 6500U, HD Graphics 520, Liteonit LCH-256V2S, IPS, 1920x1080, 13.30 | |
|---|---|---|---|---|
| Power Consumption | 2% | -3% | 18% | |
| Idle Minimum * | 3.9 | 5.5 -41% | 4.8 -23% | 4 -3% |
| Idle Average * | 7.1 | 6.7 6% | 10.7 -51% | 4.8 32% |
| Idle Maximum * | 7.7 | 7.1 8% | 11.8 -53% | 7.6 1% |
| Load Average * | 33.4 | 33.1 1% | 18.3 45% | 30 10% |
| Load Maximum * | 55.9 | 35.2 37% | 19.7 65% | 29.3 48% |
* ... smaller is better
| Lenovo Yoga 510-14IKB i5-7200U, Radeon R5 M430, 35 Wh | HP Spectre x360 13-w023dx i7-7500U, HD Graphics 620, 57.8 Wh | Lenovo Yoga 3 Pro 13 80HE004LGE 5Y70, HD Graphics 5300, 44 Wh | Dell Inspiron 13 7359-4839 6500U, HD Graphics 520, 44 Wh | |
|---|---|---|---|---|
| Battery Runtime | 47% | -29% | 21% | |
| Reader / Idle | 722 | 1233 71% | 886 23% | |
| WiFi v1.3 | 373 | 558 50% | 263 -29% | 486 30% |
| Load | 100 | 121 21% | 109 9% |
Pros
Cons
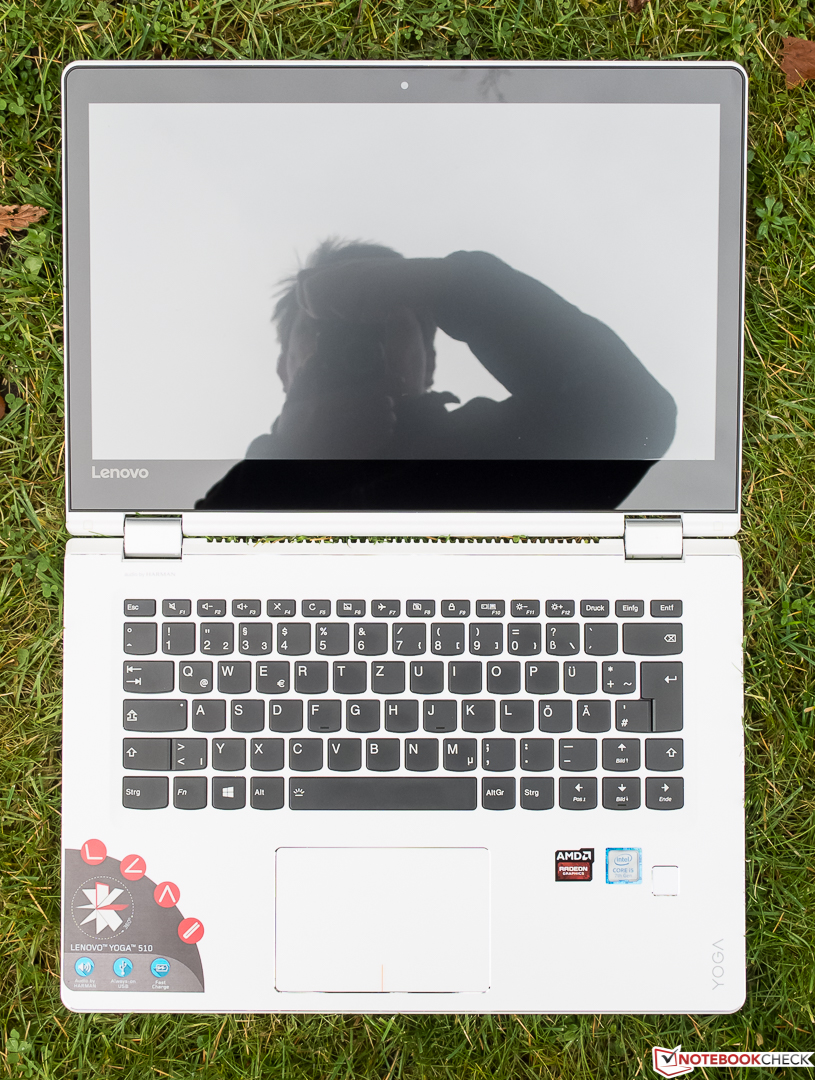
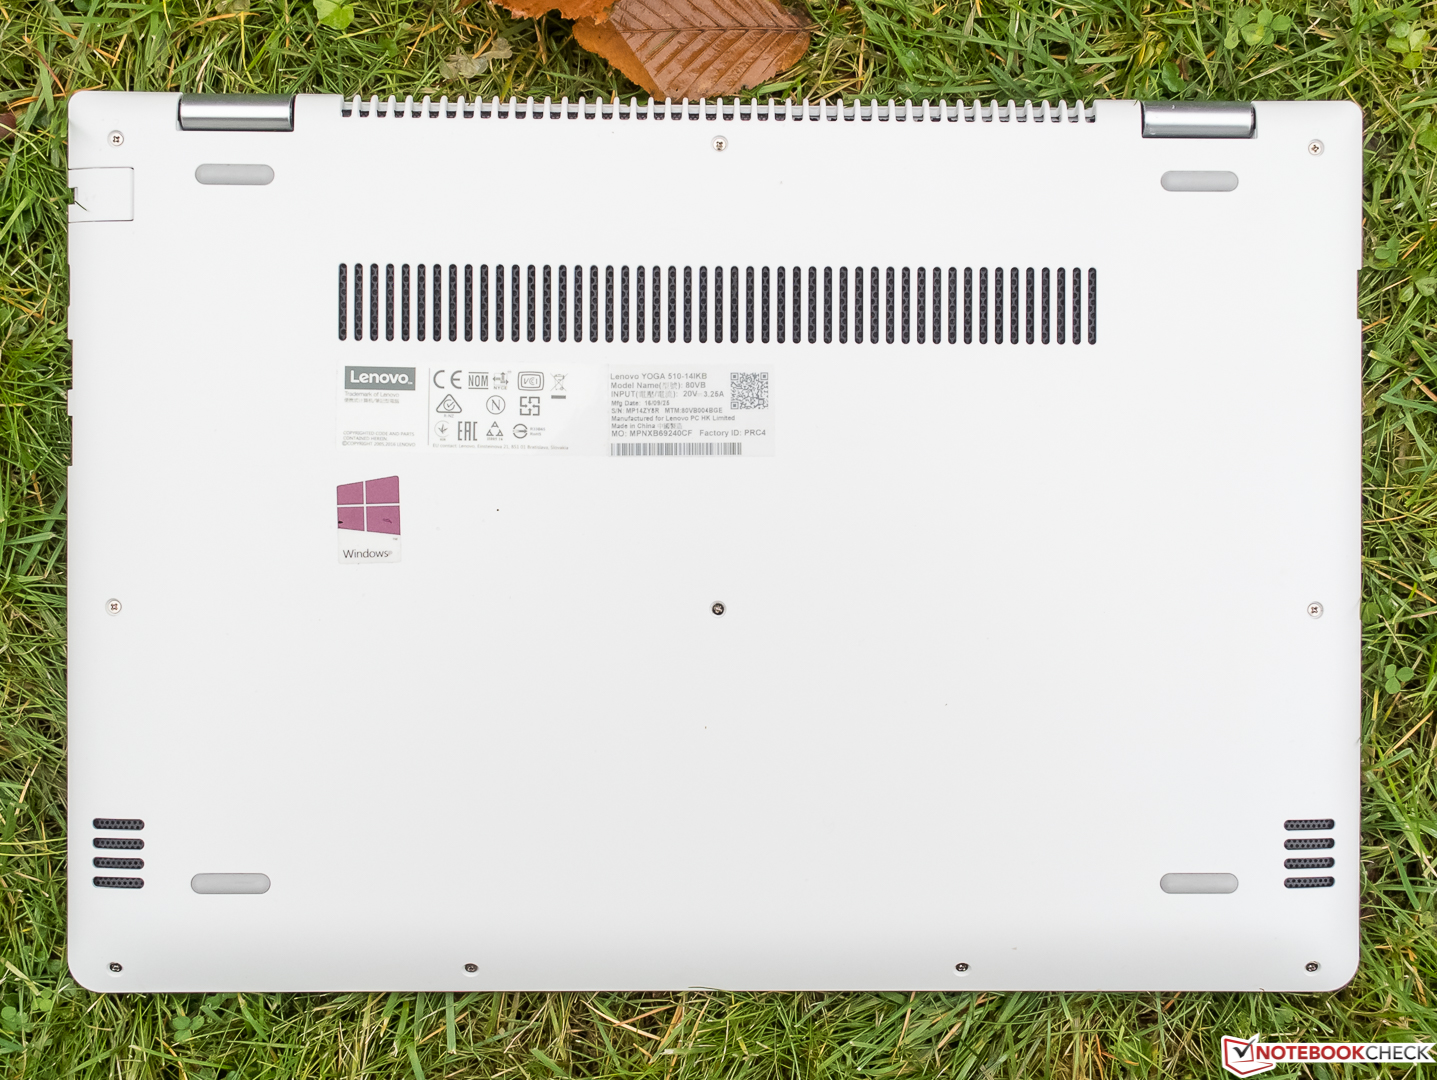
在我们开始细数它的缺点之前,需要注意的是它800欧元(约5859人民币)的价码。在这个价位上,我们认为联想Yoga 510-14IKB的屏幕不及平均水平,但除了“漏光”问题之外这块屏幕都表现中规中矩。不过,较弱的无线网络性能就很难找到借口推脱了。除此之外,尽管变形本大多没有维护底盖,但这并不影响联想为这个机型增加这个设计,它将会极大地方便维护升级。当然,生产商会说如果为升级维护提供便利的话将会妨碍轻薄机身的设计,不过用户将会由此节省大量的维修和更新费用,设计一个维护底盖应该是一个合情合理的选择。
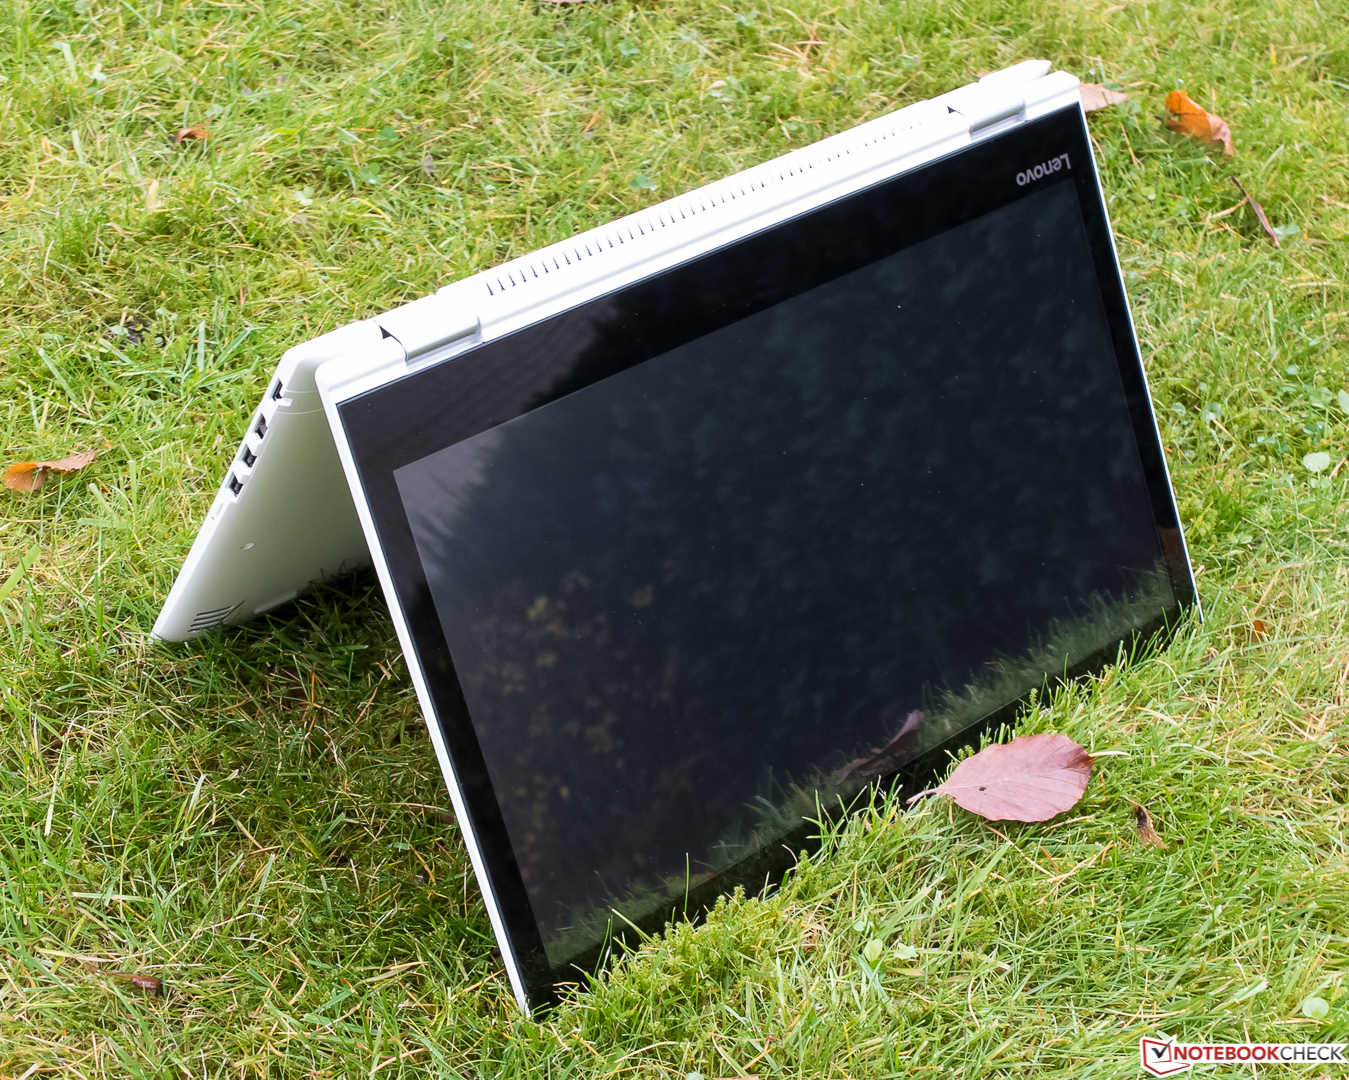
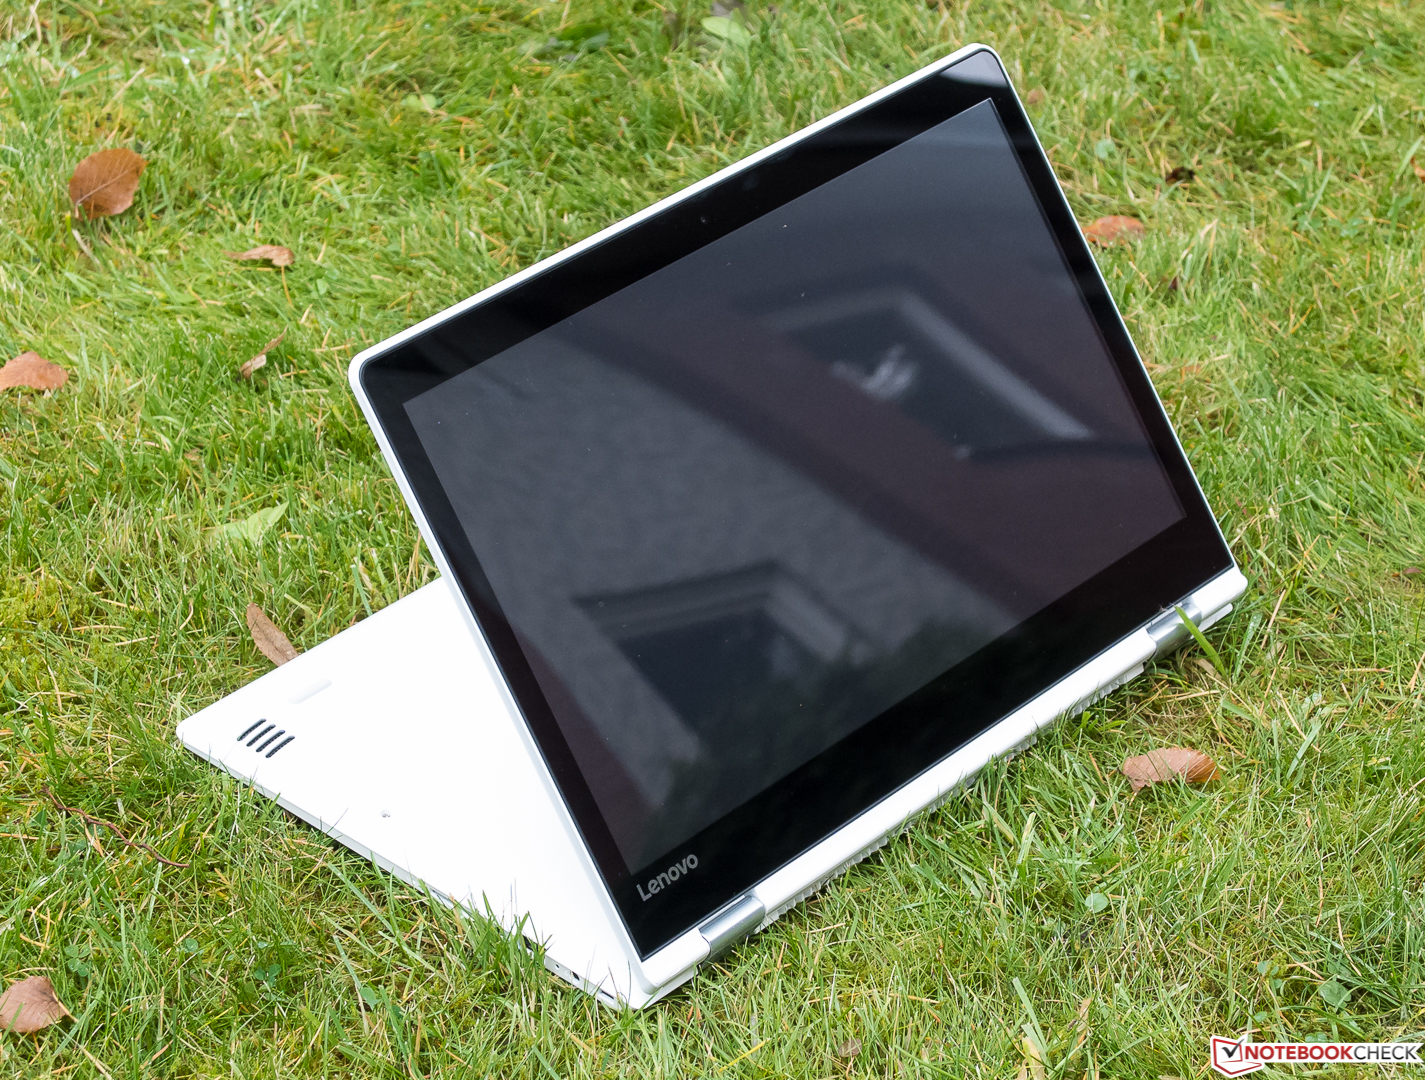
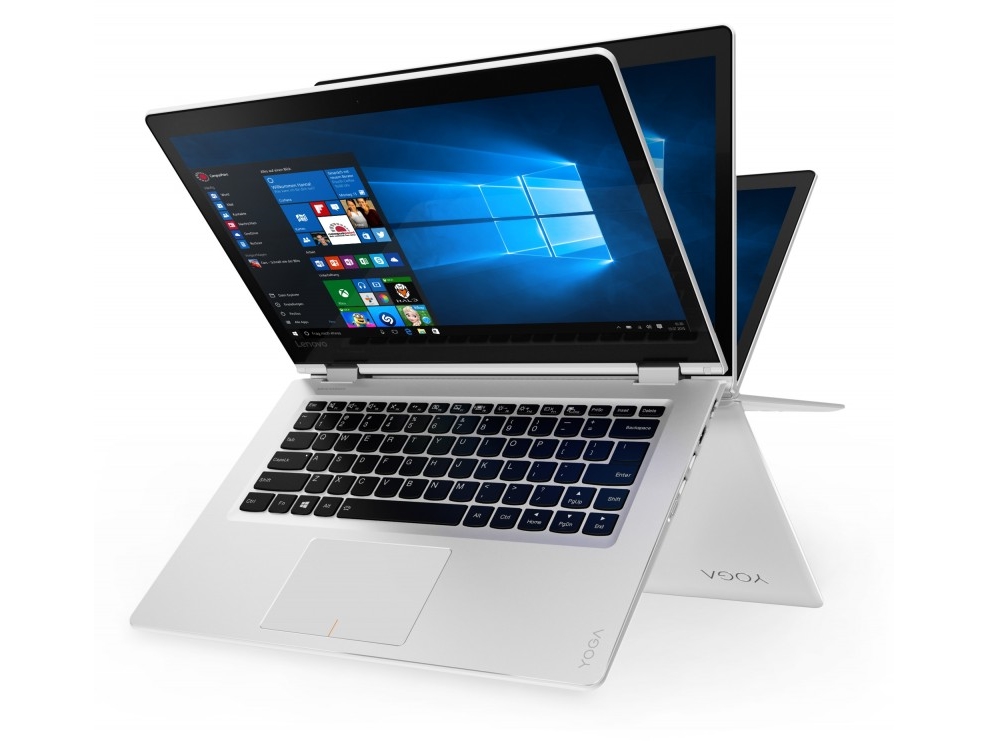
在另一方面,用户可以得到出色的工艺品质和时尚的机身(主观感受)。它的安全功能也是同价位产品中难得的。
这台Yoga变形本的价位应该大幅降低,联想也不需要为它搭配独立显卡。这再加上较短的电池续航,让我们十分难以理解。我们无法向用户衷心地推荐这台变形本。
注:本文是基于完整评测的缩减版本,阅读完整的英文评测,请点击这里。
Lenovo Yoga 510-14IKB
-
11/17/2016 v5.1(old)
Sven Kloevekorn