 Deutsch
 English
 Español
 Français
 Italiano
 Nederlands
 Polski
 Português
 Русский
 Türkçe
 Svenska
 Chinese
 Magyar
微星 WE72 7RJ (7700HQ, 全高清, M2200) 工作站简短评测

| SD Card Reader | |
| average JPG Copy Test (av. of 3 runs) | |
| Dell Precision 7710 | |
| HP ZBook 17 G3 TZV66eA | |
| Lenovo ThinkPad P70 | |
| MSI WE72 7RJ | |
| maximum AS SSD Seq Read Test (1GB) | |
| HP ZBook 17 G3 TZV66eA | |
| Lenovo ThinkPad P70 | |
| Dell Precision 7710 | |
| MSI WE72 7RJ | |
| Networking | |
| iperf3 transmit AX12 | |
| Lenovo ThinkPad T570-20HAS01E00 | |
| MSI GE72 7RE-046 | |
| MSI WE72 7RJ | |
| iperf3 receive AX12 | |
| Lenovo ThinkPad T570-20HAS01E00 | |
| MSI WE72 7RJ | |
| MSI GE72 7RE-046 | |
| |||||||||||||||||||||||||
Brightness Distribution: 93 %
Center on Battery: 301 cd/m²
Contrast: 974:1 (Black: 0.31 cd/m²)
ΔE Color 6.2 | 0.5-29.43 Ø5
ΔE Greyscale 7.3 | 0.57-98 Ø5.3
85.2% sRGB (Argyll 1.6.3 3D)
56% AdobeRGB 1998 (Argyll 1.6.3 3D)
62.4% AdobeRGB 1998 (Argyll 2.2.0 3D)
85.3% sRGB (Argyll 2.2.0 3D)
67.4% Display P3 (Argyll 2.2.0 3D)
Gamma: 2.08
| MSI WE72 7RJ LP173WF4-SPF1, , 1920x1080, 17.30 | Dell Precision 7710 SDC8151, VHN17_173HL, , 1920x1080, 17.30 | Lenovo ThinkPad P70 LEN4123, , 3840x2160, 17.30 | HP ZBook 17 G3 TZV66eA SDC3854, , 1920x1080, 17.30 | |
|---|---|---|---|---|
| Display | 8% | 30% | 8% | |
| Display P3 Coverage | 67.4 | 66.6 -1% | 90.8 35% | 67.3 0% |
| sRGB Coverage | 85.3 | 96.9 14% | 100 17% | 95.9 12% |
| AdobeRGB 1998 Coverage | 62.4 | 68.6 10% | 85.4 37% | 69 11% |
| Response Times | -24% | -1% | -10% | |
| Response Time Grey 50% / Grey 80% * | 45.2 ? | 50 ? -11% | 44 ? 3% | 50.4 ? -12% |
| Response Time Black / White * | 26.4 ? | 36 ? -36% | 27.6 ? -5% | 28.4 ? -8% |
| PWM Frequency | 198 ? | 228 ? | 200 ? | |
| Screen | 13% | 11% | 23% | |
| Brightness middle | 302 | 332 10% | 365 21% | 252 -17% |
| Brightness | 306 | 307 0% | 341 11% | 243 -21% |
| Brightness Distribution | 93 | 83 -11% | 85 -9% | 86 -8% |
| Black Level * | 0.31 | 0.33 -6% | 0.4 -29% | 0.21 32% |
| Contrast | 974 | 1006 3% | 913 -6% | 1200 23% |
| Colorchecker dE 2000 * | 6.2 | 3 52% | 3.8 39% | 2.2 65% |
| Colorchecker dE 2000 max. * | 10.6 | 3.8 64% | ||
| Greyscale dE 2000 * | 7.3 | 4 45% | 6.09 17% | 2.7 63% |
| Gamma | 2.08 106% | 2 110% | 2.3 96% | 2.28 96% |
| CCT | 7020 93% | 7089 92% | 6332 103% | 6686 97% |
| Color Space (Percent of AdobeRGB 1998) | 56 | 62 11% | 76.01 36% | 62 11% |
| Color Space (Percent of sRGB) | 85.2 | 97 14% | 99.97 17% | 96 13% |
| Total Average (Program / Settings) | -1% /
7% | 13% /
13% | 7% /
15% |
* ... smaller is better
Display Response Times
| ↔ Response Time Black to White | ||
|---|---|---|
| 26.4 ms ... rise ↗ and fall ↘ combined | ↗ 14.8 ms rise | 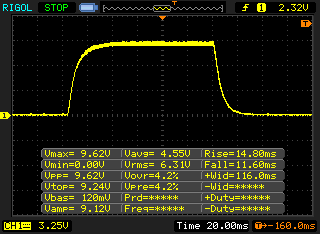 |
| ↘ 11.6 ms fall | ||
| The screen shows relatively slow response rates in our tests and may be too slow for gamers. In comparison, all tested devices range from 0.1 (minimum) to 240 (maximum) ms. » 61 % of all devices are better. This means that the measured response time is worse than the average of all tested devices (21.5 ms). | ||
| ↔ Response Time 50% Grey to 80% Grey | ||
| 45.2 ms ... rise ↗ and fall ↘ combined | ↗ 27.2 ms rise | 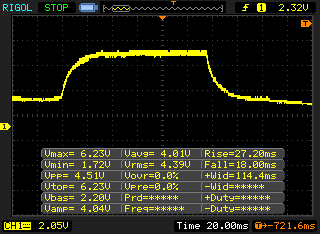 |
| ↘ 18 ms fall | ||
| The screen shows slow response rates in our tests and will be unsatisfactory for gamers. In comparison, all tested devices range from 0.2 (minimum) to 636 (maximum) ms. » 74 % of all devices are better. This means that the measured response time is worse than the average of all tested devices (33.7 ms). | ||
Screen Flickering / PWM (Pulse-Width Modulation)
| Screen flickering / PWM not detected | 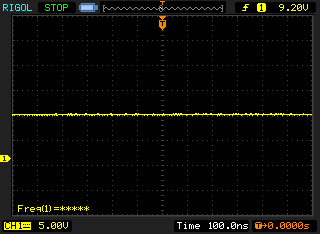 | ||
In comparison: 53 % of all tested devices do not use PWM to dim the display. If PWM was detected, an average of 17915 (minimum: 5 - maximum: 3846000) Hz was measured. | |||
| PCMark 8 | |
| Home Score Accelerated v2 | |
| Dell Precision 7710 | |
| MSI WE72 7RJ | |
| HP ZBook 17 G3 TZV66eA | |
| Lenovo ThinkPad P70 | |
| Work Score Accelerated v2 | |
| Dell Precision 7710 | |
| HP ZBook 17 G3 TZV66eA | |
| MSI WE72 7RJ | |
| Lenovo ThinkPad P70 | |
| PCMark 8 Home Score Accelerated v2 | 4295 points | |
| PCMark 8 Work Score Accelerated v2 | 5150 points | |
Help | ||
| MSI WE72 7RJ Samsung SM961 MZVPW256 m.2 PCI-e | Lenovo ThinkPad P70 Samsung SSD PM871 MZNLN512HCJH | HP ZBook 17 G3 TZV66eA Samsung SM951 MZVPV256HDGL m.2 PCI-e | MSI GE72 7RE-046 Toshiba HG6 THNSNJ256G8NY | Dell Precision 5520 UHD Samsung SM961 MZVKW512HMJP m.2 PCI-e | MSI GS63VR 7RF-228US Samsung SM961 MZVKW512HMJP m.2 PCI-e | |
|---|---|---|---|---|---|---|
| CrystalDiskMark 3.0 | -44% | 30% | -45% | 10% | 9% | |
| Read Seq | 1492 | 509 -66% | 1481 -1% | 540 -64% | 2253 51% | 2141 43% |
| Write Seq | 1512 | 457.8 -70% | 1243 -18% | 495.7 -67% | 1662 10% | 1621 7% |
| Read 512 | 312.6 | 420.3 34% | 1202 285% | 455.1 46% | 459.1 47% | 499.7 60% |
| Write 512 | 1483 | 420.5 -72% | 1163 -22% | 481.4 -68% | 1611 9% | 1531 3% |
| Read 4k | 59.9 | 29.88 -50% | 58.7 -2% | 22.7 -62% | 56.1 -6% | 54.2 -10% |
| Write 4k | 184.2 | 104.1 -43% | 207.4 13% | 112.9 -39% | 169.4 -8% | 158.2 -14% |
| Read 4k QD32 | 681 | 391.8 -42% | 832 22% | 372.5 -45% | 633 -7% | 632 -7% |
| Write 4k QD32 | 590 | 350.4 -41% | 377.9 -36% | 212.9 -64% | 506 -14% | 527 -11% |

| LuxMark v2.0 64Bit | |
| Room GPUs-only | |
| Gigabyte P57X v7 | |
| MSI GE72 7RE-046 | |
| HP ZBook 17 G3 TZV66eA | |
| MSI WE72 7RJ | |
| Dell Precision 5520 UHD | |
| Dell Precision 7710 | |
| Lenovo ThinkPad P50 | |
| Sala GPUs-only | |
| MSI GE72 7RE-046 | |
| Gigabyte P57X v7 | |
| HP ZBook 17 G3 TZV66eA | |
| MSI WE72 7RJ | |
| Dell Precision 5520 UHD | |
| Dell Precision 7710 | |
| Lenovo ThinkPad P50 | |
| 3DMark 11 - 1280x720 Performance GPU | |
| MSI GE72VR-6RF16H21 | |
| MSI GE72 7RE-046 | |
| Acer Predator 15 G9-592-7925 | |
| Dell Precision 7710 | |
| MSI GE72 965M Ti | |
| HP ZBook 17 G3 TZV66eA | |
| Lenovo ThinkPad P70 | |
| HP Omen 17-w010ng | |
| Asus FX553VD-DM249T | |
| MSI WE72 7RJ | |
| Lenovo ThinkPad P50 | |
| Dell Precision 5520 UHD | |
| 3DMark - 1920x1080 Fire Strike Graphics | |
| MSI GE72VR-6RF16H21 | |
| MSI GE72 7RE-046 | |
| Acer Predator 15 G9-592-7925 | |
| Dell Precision 7710 | |
| HP ZBook 17 G3 TZV66eA | |
| Lenovo ThinkPad P70 | |
| MSI GE72 965M Ti | |
| Asus FX553VD-DM249T | |
| MSI WE72 7RJ | |
| HP Omen 17-w010ng | |
| Dell Precision 5520 UHD | |
| Lenovo ThinkPad P50 | |
| Unigine Heaven 4.0 | |
| Extreme Preset DX11 | |
| MSI GE72VR-6RF16H21 | |
| MSI GE72 7RE-046 | |
| MSI WE72 7RJ | |
| MSI GE72 965M Ti | |
| HP Omen 17-w010ng | |
| Extreme Preset OpenGL | |
| MSI WE72 7RJ | |
| Unigine Valley 1.0 | |
| 1920x1080 Extreme HD DirectX AA:x8 | |
| MSI GE72VR-6RF16H21 | |
| HP ZBook 17 G3 TZV66eA | |
| Lenovo ThinkPad P70 | |
| Dell Precision 7710 | |
| MSI WE72 7RJ | |
| MSI GE72 965M Ti | |
| Lenovo ThinkPad P50 | |
| 1920x1080 Extreme HD Preset OpenGL AA:x8 | |
| HP ZBook 17 G3 TZV66eA | |
| Dell Precision 7710 | |
| MSI WE72 7RJ | |
| Lenovo ThinkPad P70 | |
| Lenovo ThinkPad P50 | |
| 3DMark 06 Standard Score | 26834 points | |
| 3DMark Vantage P Result | 24622 points | |
| 3DMark 11 Performance | 7453 points | |
| 3DMark Ice Storm Standard Score | 93770 points | |
| 3DMark Cloud Gate Standard Score | 20388 points | |
| 3DMark Fire Strike Score | 5252 points | |
| 3DMark Fire Strike Extreme Score | 2627 points | |
| 3DMark Time Spy Score | 1845 points | |
Help | ||
| Ghost Recon Wildlands - 1920x1080 High Preset AA:T AF:4x | |
| Gigabyte Aero 15 | |
| Acer Aspire VX5-591G-75C4 VX15 | |
| MSI WE72 7RJ | |
| MSI GL62M 7RD-077 | |
| Apple MacBook Pro 15 2016 (2.6 GHz, 450) | |
| For Honor - 1920x1080 High Preset AA:T AF:8x | |
| Gigabyte Aero 15 | |
| Razer Blade (2017) | |
| MSI WE72 7RJ | |
| MSI GE72 965M Ti | |
| Acer Aspire VX5-591G-75C4 VX15 | |
| Apple MacBook Pro 15 2016 (2.6 GHz, 450) | |
| Battlefield 1 - 1920x1080 High Preset AA:T | |
| SCHENKER XMG P407 | |
| Acer Aspire VN7-593G-73HP V15 Nitro BE | |
| MSI GE72 965M Ti | |
| Dell XPS 15 2017 9560 (7300HQ, Full-HD) | |
| MSI GL62M 7RD-077 | |
| MSI WE72 7RJ | |
| Apple MacBook Pro 15 2016 (2.9 GHz, 460) | |
| Apple MacBook Pro 15 2016 (2.6 GHz, 450) | |
| low | med. | high | ultra | |
| Tomb Raider (2013) | 381.4 | 238.8 | 149.3 | 70.2 |
| BioShock Infinite (2013) | 229.4 | 177.2 | 155.5 | 58.6 |
| Battlefield 4 (2013) | 171.5 | 148.3 | 115.9 | 47.8 |
| Thief (2014) | 108.8 | 88.6 | 74.8 | 39.6 |
| The Witcher 3 (2015) | 116.6 | 68.4 | 37.8 | 20.3 |
| Star Wars Battlefront (2015) | 148.8 | 119 | 56.4 | 48.2 |
| Rainbow Six Siege (2015) | 214.2 | 131.2 | 70.4 | 52.4 |
| Rise of the Tomb Raider (2016) | 128.7 | 72.8 | 40.7 | 34.4 |
| Battlefield 1 (2016) | 139.4 | 105.3 | 47.1 | 42 |
| For Honor (2017) | 78 | 52.3 | 50.5 | 36.2 |
| Ghost Recon Wildlands (2017) | 83.4 | 37.1 | 33.7 | 17.6 |
Noise Level
| Idle |
| 36.3 / 36.3 / 36.6 dB(A) |
| Load |
| 40.4 / 46.6 dB(A) |
 | ||
30 dB silent 40 dB(A) audible 50 dB(A) loud |
||
min: | ||
(-) The maximum temperature on the upper side is 45.7 °C / 114 F, compared to the average of 38.1 °C / 101 F, ranging from 22.2 to 69.8 °C for the class Workstation.
(-) The bottom heats up to a maximum of 48.4 °C / 119 F, compared to the average of 41.3 °C / 106 F
(+) In idle usage, the average temperature for the upper side is 26.7 °C / 80 F, compared to the device average of 32 °C / 90 F.
(-) The palmrests and touchpad can get very hot to the touch with a maximum of 40.4 °C / 104.7 F.
(-) The average temperature of the palmrest area of similar devices was 27.8 °C / 82 F (-12.6 °C / -22.7 F).
| Off / Standby | |
| Idle | |
| Load |
|
| MSI WE72 7RJ i7-7700HQ, Quadro M2200, Samsung SM961 MZVPW256 m.2 PCI-e, IPS, 1920x1080, 17.30 | Dell Precision 7710 E3-1535M v5, FirePro W7170M, Samsung SM951 MZVPV256HDGL m.2 PCI-e, IPS LED, 1920x1080, 17.30 | Lenovo ThinkPad P70 6820HQ, Quadro M3000M, Samsung SSD PM871 MZNLN512HCJH, IPS, 3840x2160, 17.30 | HP ZBook 17 G3 TZV66eA E3-1535M v5, Quadro M3000M, Samsung SM951 MZVPV256HDGL m.2 PCI-e, IPS, 1920x1080, 17.30 | MSI GE72 7RE-046 i7-7700HQ, GeForce GTX 1050 Ti Mobile, Toshiba HG6 THNSNJ256G8NY, TN LED, 1920x1080, 17.30 | |
|---|---|---|---|---|---|
| Power Consumption | -14% | 3% | 13% | 0% | |
| Idle Minimum * | 15 | 6.04 60% | 12.1 19% | 6.7 55% | 14 7% |
| Idle Average * | 20.1 | 15.2 24% | 19.7 2% | 12.5 38% | 20 -0% |
| Idle Maximum * | 23.8 | 42.3 -78% | 20.5 14% | 13.2 45% | 25 -5% |
| Load Average * | 85.6 | 112.8 -32% | 94.3 -10% | 128.2 -50% | 82 4% |
| Load Maximum * | 128 | 182.2 -42% | 139.6 -9% | 158.9 -24% | 135 -5% |
* ... smaller is better
| MSI WE72 7RJ i7-7700HQ, Quadro M2200, 51 Wh | Dell Precision 7710 E3-1535M v5, FirePro W7170M, 72 Wh | Lenovo ThinkPad P70 6820HQ, Quadro M3000M, 96 Wh | HP ZBook 17 G3 TZV66eA E3-1535M v5, Quadro M3000M, 96 Wh | MSI GE72 7RE-046 i7-7700HQ, GeForce GTX 1050 Ti Mobile, 51.4 Wh | |
|---|---|---|---|---|---|
| Battery Runtime | 113% | 95% | 137% | 6% | |
| Reader / Idle | 268 | 775 189% | 464 73% | 956 257% | |
| H.264 | 181 | 283 56% | 452 150% | 299 65% | 195 8% |
| WiFi v1.3 | 177 | 365 106% | 361 104% | 290 64% | 184 4% |
| Load | 42 | 85 102% | 64 52% | 110 162% |
Pros
Cons
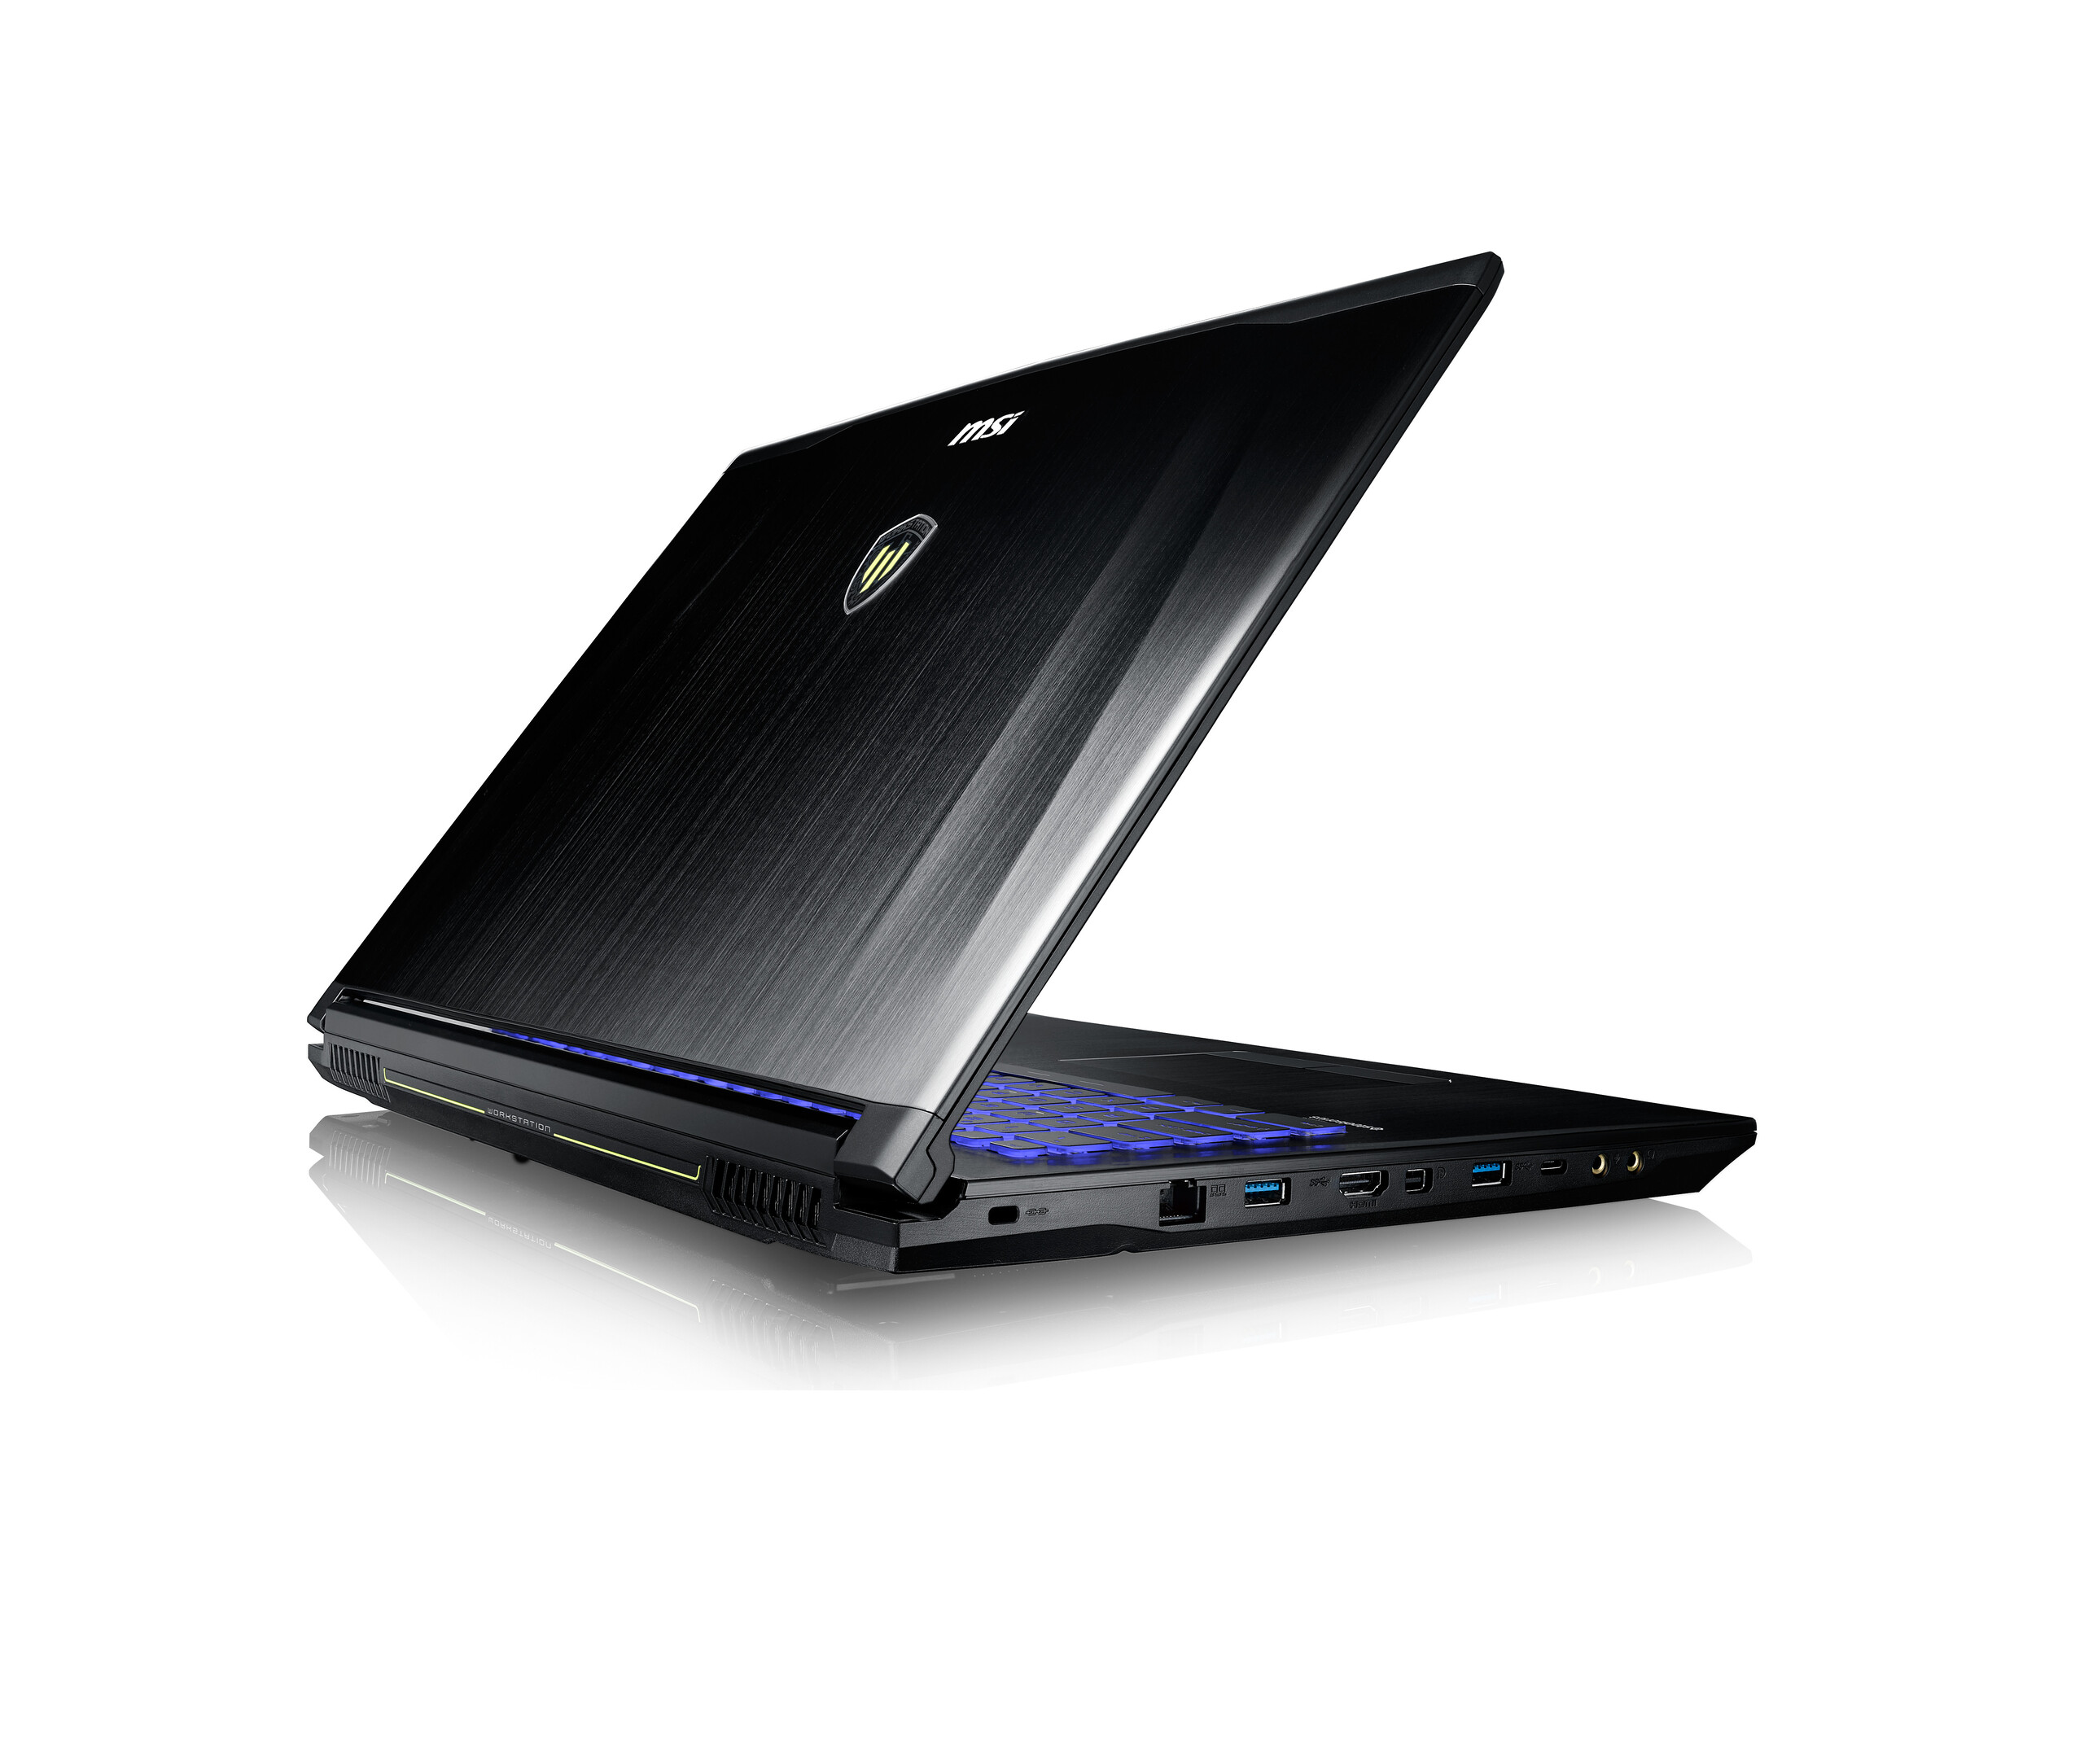
MSI GE72是一款不错的游戏本,是否配备了专业的显卡以创造出一个优秀的移动工作站? 我们在测试后不信服,而它的竞争对手让处境变得更难。你会经常被提醒它是一个游戏本。没有对接端口,也没有雷电3,所以你不能使用拓展坞。
这可能不是一个严重的问题,它取决于您的使用情况,但在性能和排放方面该机也有局限性。由于处理器的散热有问题,因为即使我们只用Cinebench来对处理器施压,核心频率也会(节流)下降。当您给所有组件施压时,120瓦的电源适配器是另一个不足之处。风扇也有空间进行优化,这可以通过预先安装的风扇控制软件来实现。然而,由于高温,没有太多的净空。
有限的商务能和薄弱的冷却能力:微星新移动工作站给人的印象并不是很有说服力。 在大工作量下WE72还是有意义的,尤其是当您考虑到富有吸引力的定价时。
MSI WE72的一个优势是价格有竞争力(1799美元),因为其竞争对手戴尔Precision系列或ThinkPad P型号的花费普遍在3000美元以上。 如果您主要使用MSI WE72来运行CAD应用程序,并且可以接受上述缺点,您应该将其放在您的候选名单上。
注:本文是基于完整评测的缩减版本,阅读完整的英文评测,请点击这里。
MSI WE72 7RJ
-
05/09/2017 v6(old)
Andreas Osthoff
Pricecompare
