 Deutsch
 English
 Español
 Français
 Italiano
 Nederlands
 Polski
 Português
 Русский
 Türkçe
 Svenska
 Chinese
 Magyar
华硕 VivoBook Flip TP301UA-DW006T 变形本简短评测


| SD Card Reader | |
| average JPG Copy Test (av. of 3 runs) | |
| Asus VivoBook Flip TP301UA-DW006T | |
| Asus Zenbook UX360CA-FC060T | |
| Dell Inspiron 13 5368 | |
| Acer Aspire R13 R7-372T-746N | |
| maximum AS SSD Seq Read Test (1GB) | |
| Asus VivoBook Flip TP301UA-DW006T | |
| Asus Zenbook UX360CA-FC060T | |
| Acer Aspire R13 R7-372T-746N | |
| Dell Inspiron 13 5368 | |
| Networking | |
| iperf Server (receive) TCP 1 m | |
| HP Spectre x2 12-a001ng | |
| Asus VivoBook Flip TP301UA-DW006T (Seb) | |
| Dell Inspiron 13 5368 (Seb) | |
| iperf Client (transmit) TCP 1 m | |
| Asus VivoBook Flip TP301UA-DW006T (Seb) | |
| HP Spectre x2 12-a001ng | |
| Dell Inspiron 13 5368 (Seb) | |
| |||||||||||||||||||||||||
Brightness Distribution: 90 %
Center on Battery: 166 cd/m²
Contrast: 377:1 (Black: 0.44 cd/m²)
ΔE Color 4.07 | 0.5-29.43 Ø5
ΔE Greyscale 3.99 | 0.57-98 Ø5.3
63% sRGB (Argyll 1.6.3 3D)
40% AdobeRGB 1998 (Argyll 1.6.3 3D)
43.02% AdobeRGB 1998 (Argyll 2.2.0 3D)
62.6% sRGB (Argyll 2.2.0 3D)
41.63% Display P3 (Argyll 2.2.0 3D)
Gamma: 2.49
| Asus VivoBook Flip TP301UA-DW006T BOE HB133WX1-402, , 1920x1080, 13.30 | Dell Inspiron 13 5368 AUO B133HAB, , 1920x1080, 13.30 | Acer Aspire R13 R7-372T-746N Sharp LQ133T1JW02, , 2560x1440, 13.30 | HP Spectre x360 13-4104ng LG Philips LGD0000, , 2560x1440, 13.30 | Asus Zenbook UX360CA-FC060T AUO B133HAN02.7, , 1920x1080, 13.30 | |
|---|---|---|---|---|---|
| Display | -7% | 63% | 55% | 53% | |
| Display P3 Coverage | 41.63 | 38.88 -7% | 69.6 67% | 66.8 60% | 65.1 56% |
| sRGB Coverage | 62.6 | 57.7 -8% | 98 57% | 92.8 48% | 93 49% |
| AdobeRGB 1998 Coverage | 43.02 | 40.17 -7% | 70.7 64% | 67.3 56% | 66.5 55% |
| Response Times | -130% | 557% | -37% | 55% | |
| Response Time Grey 50% / Grey 80% * | 38 ? | 44 ? -16% | 36 ? 5% | 24 ? 37% | 29 ? 24% |
| Response Time Black / White * | 9 ? | 31 ? -244% | 30 ? -233% | 19 ? -111% | 22 ? -144% |
| PWM Frequency | 50 ? | 1000 ? 1900% | 192 ? 284% | ||
| Screen | 21% | 72% | 49% | 35% | |
| Brightness middle | 166 | 240 45% | 320 93% | 324 95% | 302 82% |
| Brightness | 165 | 229 39% | 308 87% | 324 96% | 298 81% |
| Brightness Distribution | 90 | 92 2% | 91 1% | 90 0% | 90 0% |
| Black Level * | 0.44 | 0.24 45% | 0.17 61% | 0.34 23% | 0.21 52% |
| Contrast | 377 | 1000 165% | 1882 399% | 953 153% | 1438 281% |
| Colorchecker dE 2000 * | 4.07 | 4.75 -17% | 3.18 22% | 4.36 -7% | 6.33 -56% |
| Colorchecker dE 2000 max. * | 6.38 | 9.09 -42% | 9.91 -55% | 11.89 -86% | |
| Greyscale dE 2000 * | 3.99 | 4.3 -8% | 4.13 -4% | 4.62 -16% | 8.13 -104% |
| Gamma | 2.49 88% | 2.5 88% | 2.03 108% | 2.18 101% | 2.52 87% |
| CCT | 7491 87% | 5893 110% | 6752 96% | 6857 95% | 6811 95% |
| Color Space (Percent of AdobeRGB 1998) | 40 | 36.79 -8% | 65 63% | 60 50% | 60 50% |
| Color Space (Percent of sRGB) | 63 | 57.39 -9% | 98 56% | 93 48% | 93 48% |
| Total Average (Program / Settings) | -39% /
-5% | 231% /
161% | 22% /
38% | 48% /
42% |
* ... smaller is better
Display Response Times
| ↔ Response Time Black to White | ||
|---|---|---|
| 9 ms ... rise ↗ and fall ↘ combined | ↗ 4 ms rise | 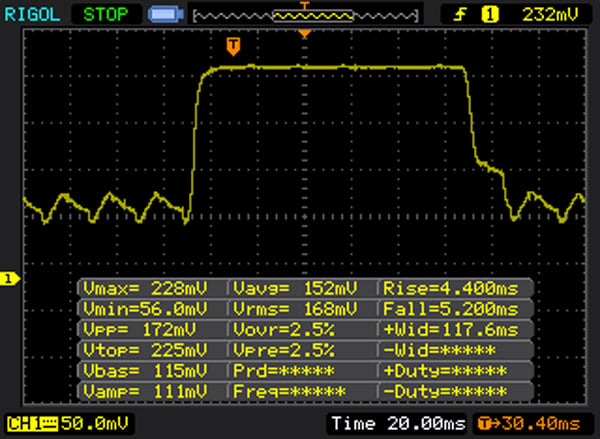 |
| ↘ 5 ms fall | ||
| The screen shows fast response rates in our tests and should be suited for gaming. In comparison, all tested devices range from 0.1 (minimum) to 240 (maximum) ms. » 20 % of all devices are better. This means that the measured response time is better than the average of all tested devices (21.5 ms). | ||
| ↔ Response Time 50% Grey to 80% Grey | ||
| 38 ms ... rise ↗ and fall ↘ combined | ↗ 19 ms rise | 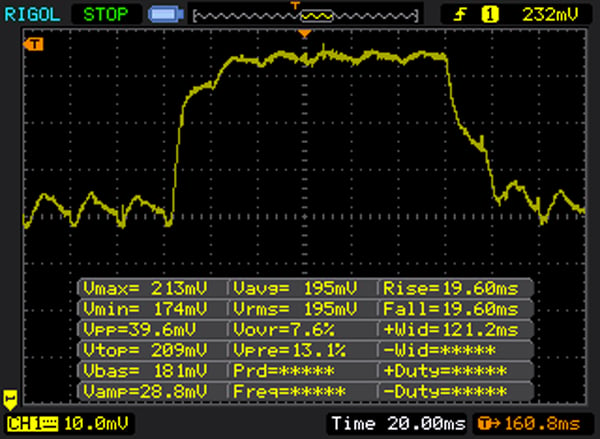 |
| ↘ 19 ms fall | ||
| The screen shows slow response rates in our tests and will be unsatisfactory for gamers. In comparison, all tested devices range from 0.2 (minimum) to 636 (maximum) ms. » 49 % of all devices are better. This means that the measured response time is worse than the average of all tested devices (33.7 ms). | ||
Screen Flickering / PWM (Pulse-Width Modulation)
| Screen flickering / PWM detected | 50 Hz | ≤ 90 % brightness setting | 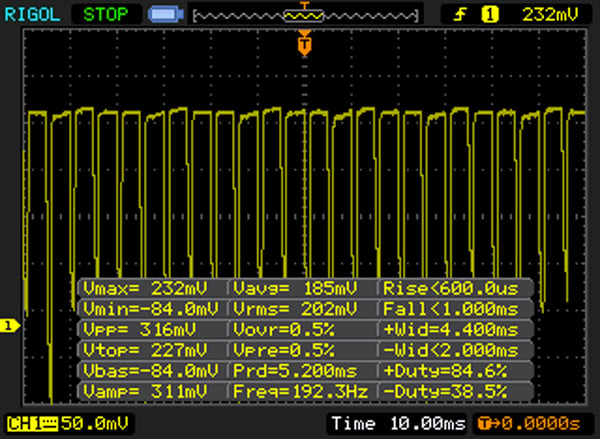 |
The display backlight flickers at 50 Hz (worst case, e.g., utilizing PWM) Flickering detected at a brightness setting of 90 % and below. There should be no flickering or PWM above this brightness setting. The frequency of 50 Hz is very low, so the flickering may cause eyestrain and headaches after extended use. In comparison: 53 % of all tested devices do not use PWM to dim the display. If PWM was detected, an average of 17900 (minimum: 5 - maximum: 3846000) Hz was measured. | |||

| Cinebench R15 | |
| CPU Single 64Bit | |
| Dell Inspiron 13 5368 | |
| HP Spectre x360 13-4104ng | |
| Acer Aspire R13 R7-372T-746N | |
| Asus VivoBook Flip TP301UA-DW006T | |
| Asus Zenbook UX360CA-FC060T | |
| CPU Multi 64Bit | |
| Acer Aspire R13 R7-372T-746N | |
| Dell Inspiron 13 5368 | |
| HP Spectre x360 13-4104ng | |
| Asus VivoBook Flip TP301UA-DW006T | |
| Asus Zenbook UX360CA-FC060T | |
| PCMark 8 | |
| Home Score Accelerated v2 | |
| Dell Inspiron 13 5368 | |
| Acer Aspire R13 R7-372T-746N | |
| Asus VivoBook Flip TP301UA-DW006T | |
| Asus Zenbook UX360CA-FC060T | |
| Work Score Accelerated v2 | |
| Dell Inspiron 13 5368 | |
| Asus VivoBook Flip TP301UA-DW006T | |
| Acer Aspire R13 R7-372T-746N | |
| Asus Zenbook UX360CA-FC060T | |
| PCMark 8 Home Score Accelerated v2 | 2960 points | |
| PCMark 8 Work Score Accelerated v2 | 4121 points | |
Help | ||
| Asus VivoBook Flip TP301UA-DW006T Samsung CM871 MZ7LF128HCHP | Dell Inspiron 13 5368 Toshiba THNSNK256GCS8 | Acer Aspire R13 R7-372T-746N Lite-On CV1-8B256 | HP Spectre x360 13-4104ng Samsung SSD PM851 256 GB MZNTE256HMHP | Asus Zenbook UX360CA-FC060T Lite-On CV1-8B128 | |
|---|---|---|---|---|---|
| CrystalDiskMark 3.0 | 610% | 761% | 389% | 406% | |
| Read Seq | 396 | 479 21% | 507 28% | 491.8 24% 491.8 24% | 497 26% |
| Write Seq | 133.5 | 270.1 102% | 354.4 165% | 264.5 98% 264.5 98% | 182.9 37% |
| Read 512 | 259.5 | 428.3 65% | 355.3 37% | 396.2 53% 396.2 53% | 353 36% |
| Write 512 | 23.86 | 267.9 1023% | 353.9 1383% | 264.5 1009% 264.5 1009% | 144.1 504% |
| Read 4k | 5.783 | 23.77 311% | 32.66 465% | 30.88 434% 30.88 434% | 31.89 451% |
| Write 4k | 8.507 | 81.4 857% | 81.6 859% | 75.6 789% 75.6 789% | 62 629% |
| Read 4k QD32 | 97.5 | 333.6 242% | 277.6 185% | 31.85 -67% 31.85 -67% | 207.7 113% |
| Write 4k QD32 | 8.515 | 200.9 2259% | 261.2 2968% | 73.9 768% 73.9 768% | 131.8 1448% |

| 3DMark 11 - 1280x720 Performance GPU | |
| Dell Inspiron 13 5368 | |
| Acer Aspire R13 R7-372T-746N | |
| HP Spectre x360 13-4104ng | |
| HP Spectre x360 13-4104ng | |
| Asus VivoBook Flip TP301UA-DW006T | |
| Asus Zenbook UX360CA-FC060T | |
| 3DMark | |
| 1280x720 Cloud Gate Standard Graphics | |
| Dell Inspiron 13 5368 | |
| Acer Aspire R13 R7-372T-746N | |
| HP Spectre x360 13-4104ng | |
| HP Spectre x360 13-4104ng | |
| Asus Zenbook UX360CA-FC060T | |
| Asus VivoBook Flip TP301UA-DW006T | |
| 1920x1080 Fire Strike Graphics | |
| Acer Aspire R13 R7-372T-746N | |
| HP Spectre x360 13-4104ng | |
| HP Spectre x360 13-4104ng | |
| 3DMark 11 Performance | 1141 points | |
| 3DMark Cloud Gate Standard Score | 3915 points | |
Help | ||
| Rise of the Tomb Raider - 1024x768 Lowest Preset | |
| Dell Inspiron 13 5368 | |
| Asus VivoBook Flip TP301UA-DW006T | |
| Asus Zenbook UX360CA-FC060T | |
| BioShock Infinite - 1366x768 Medium Preset | |
| Dell Inspiron 13 5368 | |
| Acer Aspire R13 R7-372T-746N | |
| HP Spectre x360 13-4104ng | |
| Asus VivoBook Flip TP301UA-DW006T | |
| Asus Zenbook UX360CA-FC060T | |
| Thief - 1024x768 Very Low Preset | |
| Dell Inspiron 13 5368 | |
| Asus VivoBook Flip TP301UA-DW006T | |
| low | med. | high | ultra | |
| BioShock Infinite (2013) | 43 | 24.3 | 18.4 | |
| Thief (2014) | 13.3 | 8.6 | ||
| Rise of the Tomb Raider (2016) | 14 | 9 |
Noise Level
| Idle |
| 31.3 / 31.3 / 32.9 dB(A) |
| Load |
| 35 / 34.9 dB(A) |
 | ||
30 dB silent 40 dB(A) audible 50 dB(A) loud |
||
min: | ||
(+) The maximum temperature on the upper side is 30.6 °C / 87 F, compared to the average of 35.3 °C / 96 F, ranging from 19.6 to 55.7 °C for the class Convertible.
(+) The bottom heats up to a maximum of 33.3 °C / 92 F, compared to the average of 36.8 °C / 98 F
(+) In idle usage, the average temperature for the upper side is 24.8 °C / 77 F, compared to the device average of 30.2 °C / 86 F.
(+) The palmrests and touchpad are cooler than skin temperature with a maximum of 27.2 °C / 81 F and are therefore cool to the touch.
(±) The average temperature of the palmrest area of similar devices was 28.1 °C / 82.6 F (+0.9 °C / 1.6 F).
Asus VivoBook Flip TP301UA-DW006T audio analysis
(±) | speaker loudness is average but good (73 dB)
Bass 100 - 315 Hz
(-) | nearly no bass - on average 15.8% lower than median
(±) | linearity of bass is average (11.8% delta to prev. frequency)
Mids 400 - 2000 Hz
(±) | higher mids - on average 6.9% higher than median
(±) | linearity of mids is average (8.5% delta to prev. frequency)
Highs 2 - 16 kHz
(±) | higher highs - on average 8.6% higher than median
(+) | highs are linear (5.3% delta to prev. frequency)
Overall 100 - 16.000 Hz
(±) | linearity of overall sound is average (24.7% difference to median)
Compared to same class
» 71% of all tested devices in this class were better, 8% similar, 21% worse
» The best had a delta of 6%, average was 21%, worst was 57%
Compared to all devices tested
» 71% of all tested devices were better, 6% similar, 23% worse
» The best had a delta of 4%, average was 25%, worst was 134%
Acer Aspire R13 R7-372T-746N audio analysis
(±) | speaker loudness is average but good (75 dB)
Analysis not possible as minimum curve is missing or too high
| Off / Standby | |
| Idle | |
| Load |
|
| Asus VivoBook Flip TP301UA-DW006T 6100U, HD Graphics 520, Samsung CM871 MZ7LF128HCHP, TN, 1920x1080, 13.30 | Dell Inspiron 13 5368 6500U, HD Graphics 520, Toshiba THNSNK256GCS8, IPS, 1920x1080, 13.30 | Acer Aspire R13 R7-372T-746N 6500U, HD Graphics 520, Lite-On CV1-8B256, IPS, 2560x1440, 13.30 | HP Spectre x360 13-4104ng 6200U, HD Graphics 520, Samsung SSD PM851 256 GB MZNTE256HMHP, IPS, 2560x1440, 13.30 | Asus Zenbook UX360CA-FC060T 6Y30, HD Graphics 515, Lite-On CV1-8B128, IPS with 72% NTSC, 1920x1080, 13.30 | |
|---|---|---|---|---|---|
| Power Consumption | -22% | -67% | -25% | -2% | |
| Idle Minimum * | 2.95 | 4.4 -49% | 6.2 -110% | 3.9 -32% | 3.4 -15% |
| Idle Average * | 5.6 | 6.1 -9% | 8 -43% | 7.4 -32% | 7 -25% |
| Idle Maximum * | 7.7 | 6.8 12% | 11.6 -51% | 9.2 -19% | 7.6 1% |
| Load Average * | 22.6 | 29 -28% | 40 -77% | 28.1 -24% | 19 16% |
| Load Maximum * | 23.5 | 31.9 -36% | 36.6 -56% | 27.6 -17% | 20.1 14% |
* ... smaller is better
| Asus VivoBook Flip TP301UA-DW006T 6100U, HD Graphics 520, 55 Wh | Dell Inspiron 13 5368 6500U, HD Graphics 520, 42 Wh | Acer Aspire R13 R7-372T-746N 6500U, HD Graphics 520, 49 Wh | HP Spectre x360 13-4104ng 6200U, HD Graphics 520, 56 Wh | Asus Zenbook UX360CA-FC060T 6Y30, HD Graphics 515, 54 Wh | |
|---|---|---|---|---|---|
| Battery Runtime | -40% | -24% | 72% | 13% | |
| Reader / Idle | 1260 | 674 -47% | 669 -47% | 1027 -18% | |
| WiFi v1.3 | 290 | 240 -17% | 382 32% | 500 72% | 386 33% |
| Load | 193 | 86 -55% | 85 -56% | 239 24% | |
| H.264 | 393 |
Pros
Cons
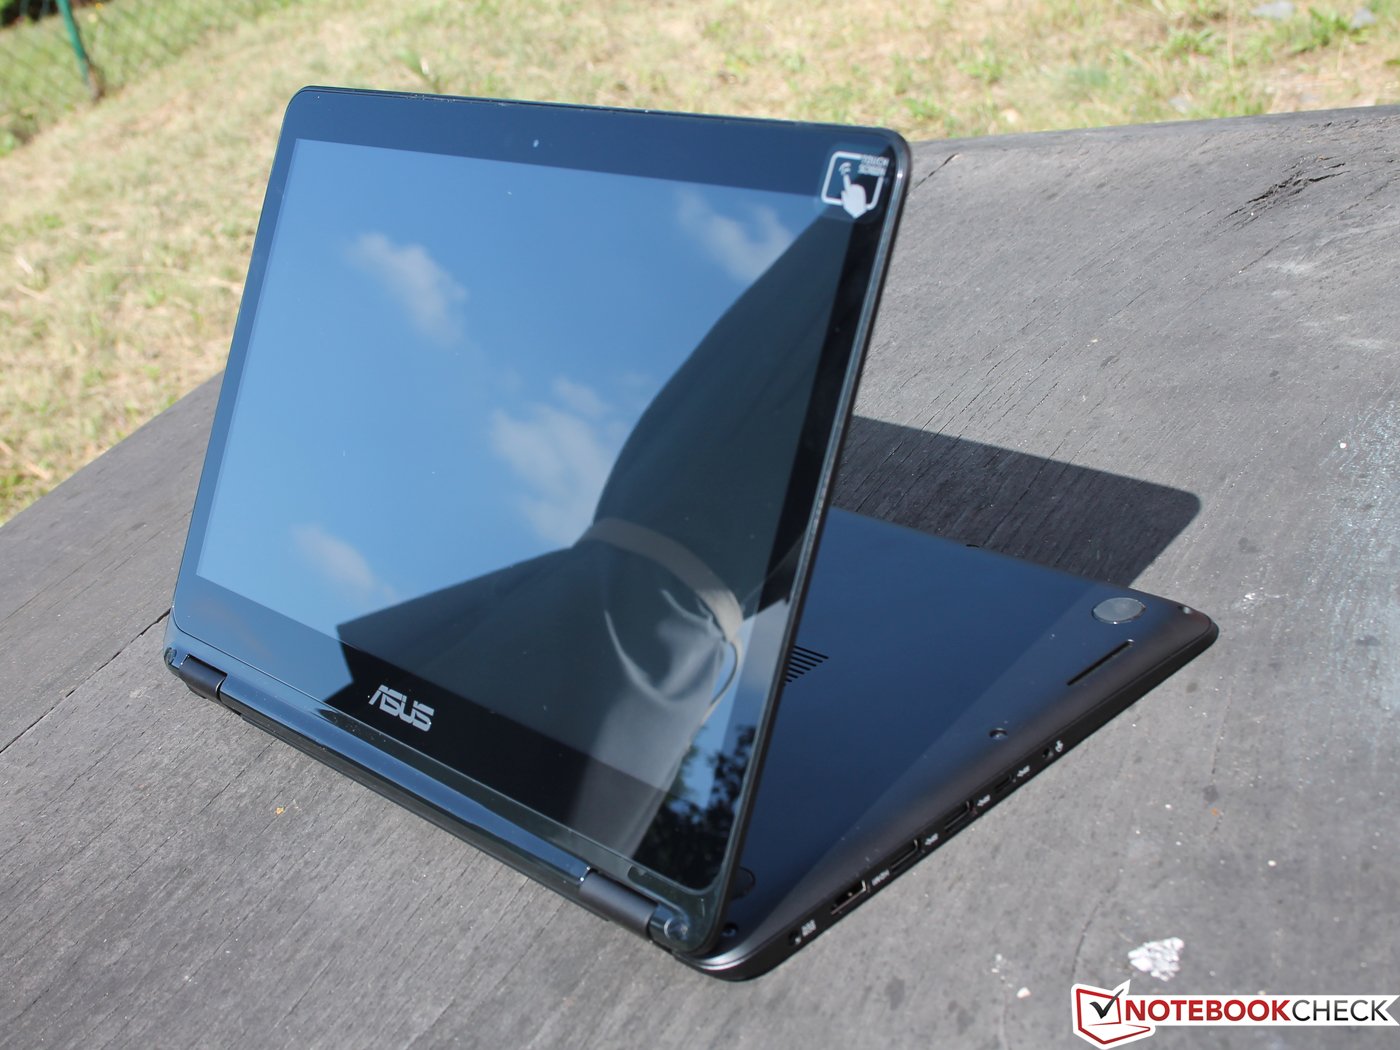
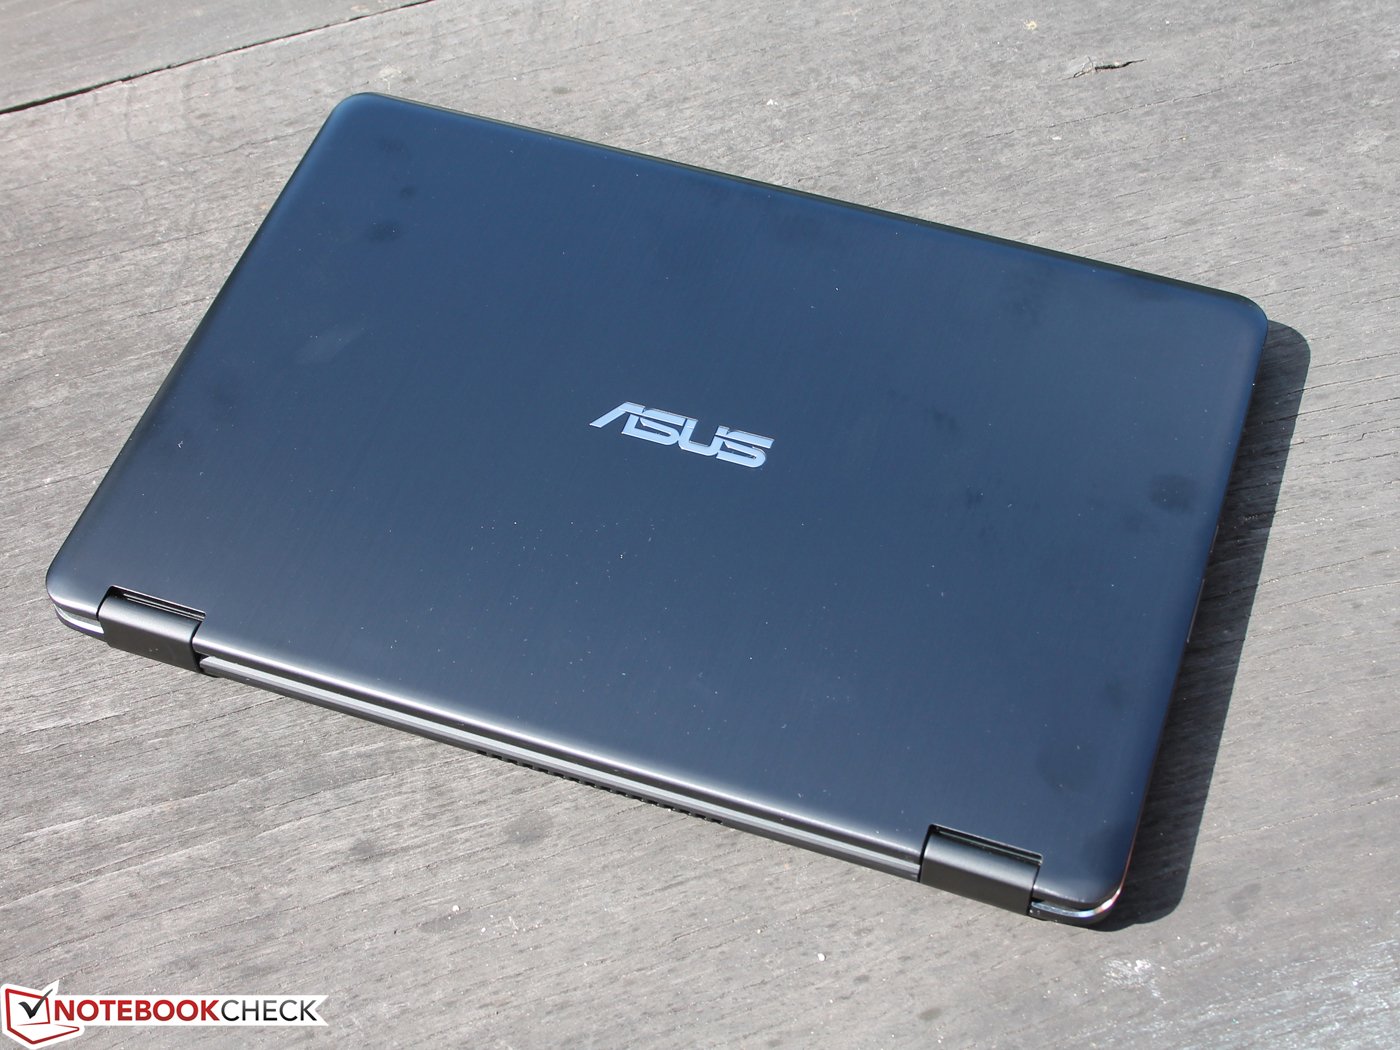
华硕再次为我们带来了一台优点众多的产品,但它同时也存在一些不小的问题。VivoBook Flip TP301UA-DW006T在较低的售价上,应该可以成为一款有潜力的变形本。在650欧元(约4864人民币)的价位上,它搭配了铝合金机身,全高清分辨率,丰富的接口,不错的可维护性,高速固态硬盘和实用的电池续航时间。
不过,这台华硕设备的入门机型也有一些缺点,TN屏幕的可视角度窄不太适合作为平板使用。而略为僵硬的键盘和不太稳定的屏幕转轴也同样会影响使用感受。因为这些缺点,我们不太推荐这台测试机,不过它的高配机型十分值得考虑。升级之后,它搭配同样分辨率的IPS屏幕,可视角度更宽,以及GeForce 920M显卡和256 GB固态硬盘,售价999欧元(约7476人民币)起。更贵的高配机型可能也是搭配的较慢的SATA固态硬盘,不过容量更大。
需要更丰富接口的用户可以考虑Acer Aspire R13 R7-372T,不过它也更笨重一些。Zenbook UX360CA,Aspire R13 R7-372T和Spectre x360相比都有两个优势:M.2固态硬盘速度更快以及效果更好的IPS屏幕。Spectre x360 13-4104ng还提供了品质更高的机身,和Aspire R13 R7一样,它们的屏幕分辨率也更高。
注:本文是基于完整评测的缩减版本,阅读完整的英文评测,请点击这里。
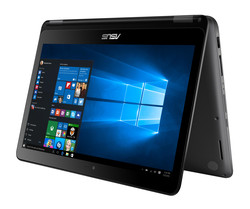
Asus VivoBook Flip TP301UA-DW006T
-
08/30/2016 v5.1(old)
Sebastian Jentsch