 Deutsch
 English
 Español
 Français
 Italiano
 Nederlands
 Polski
 Português
 Русский
 Türkçe
 Svenska
 Chinese
 Magyar
戴尔 Venue 10 Pro (5056) 平板电脑简短评测
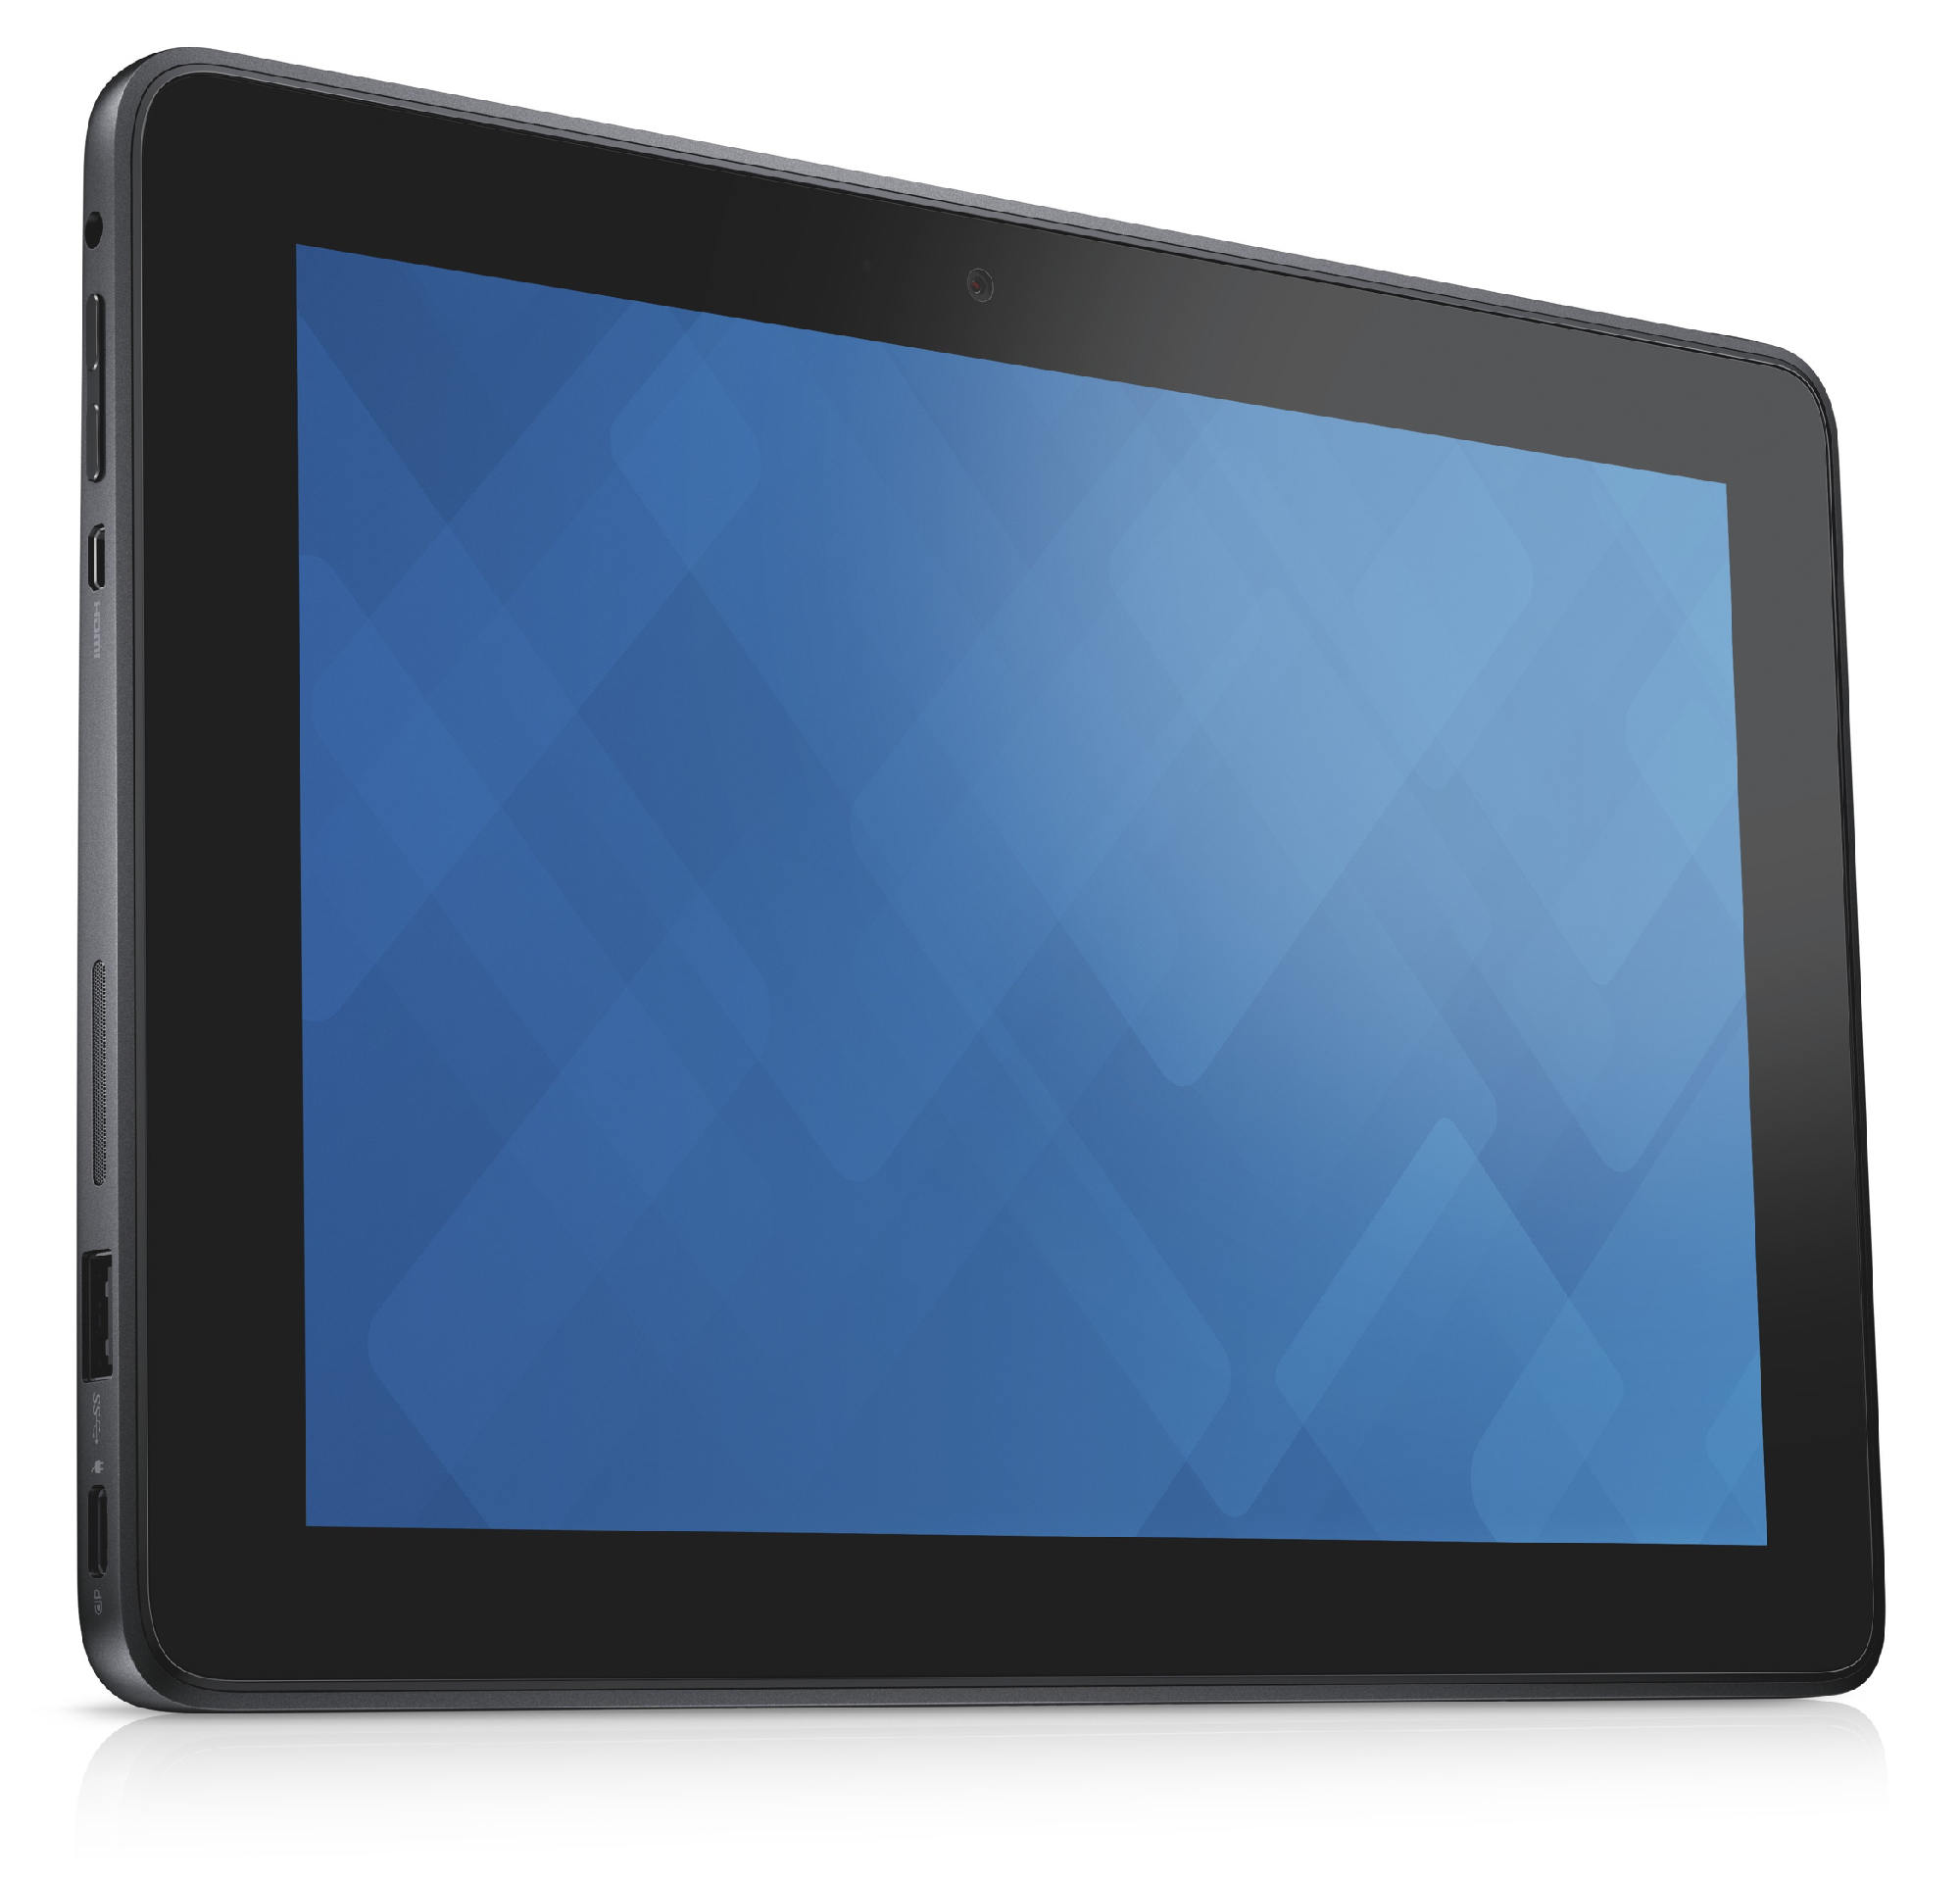
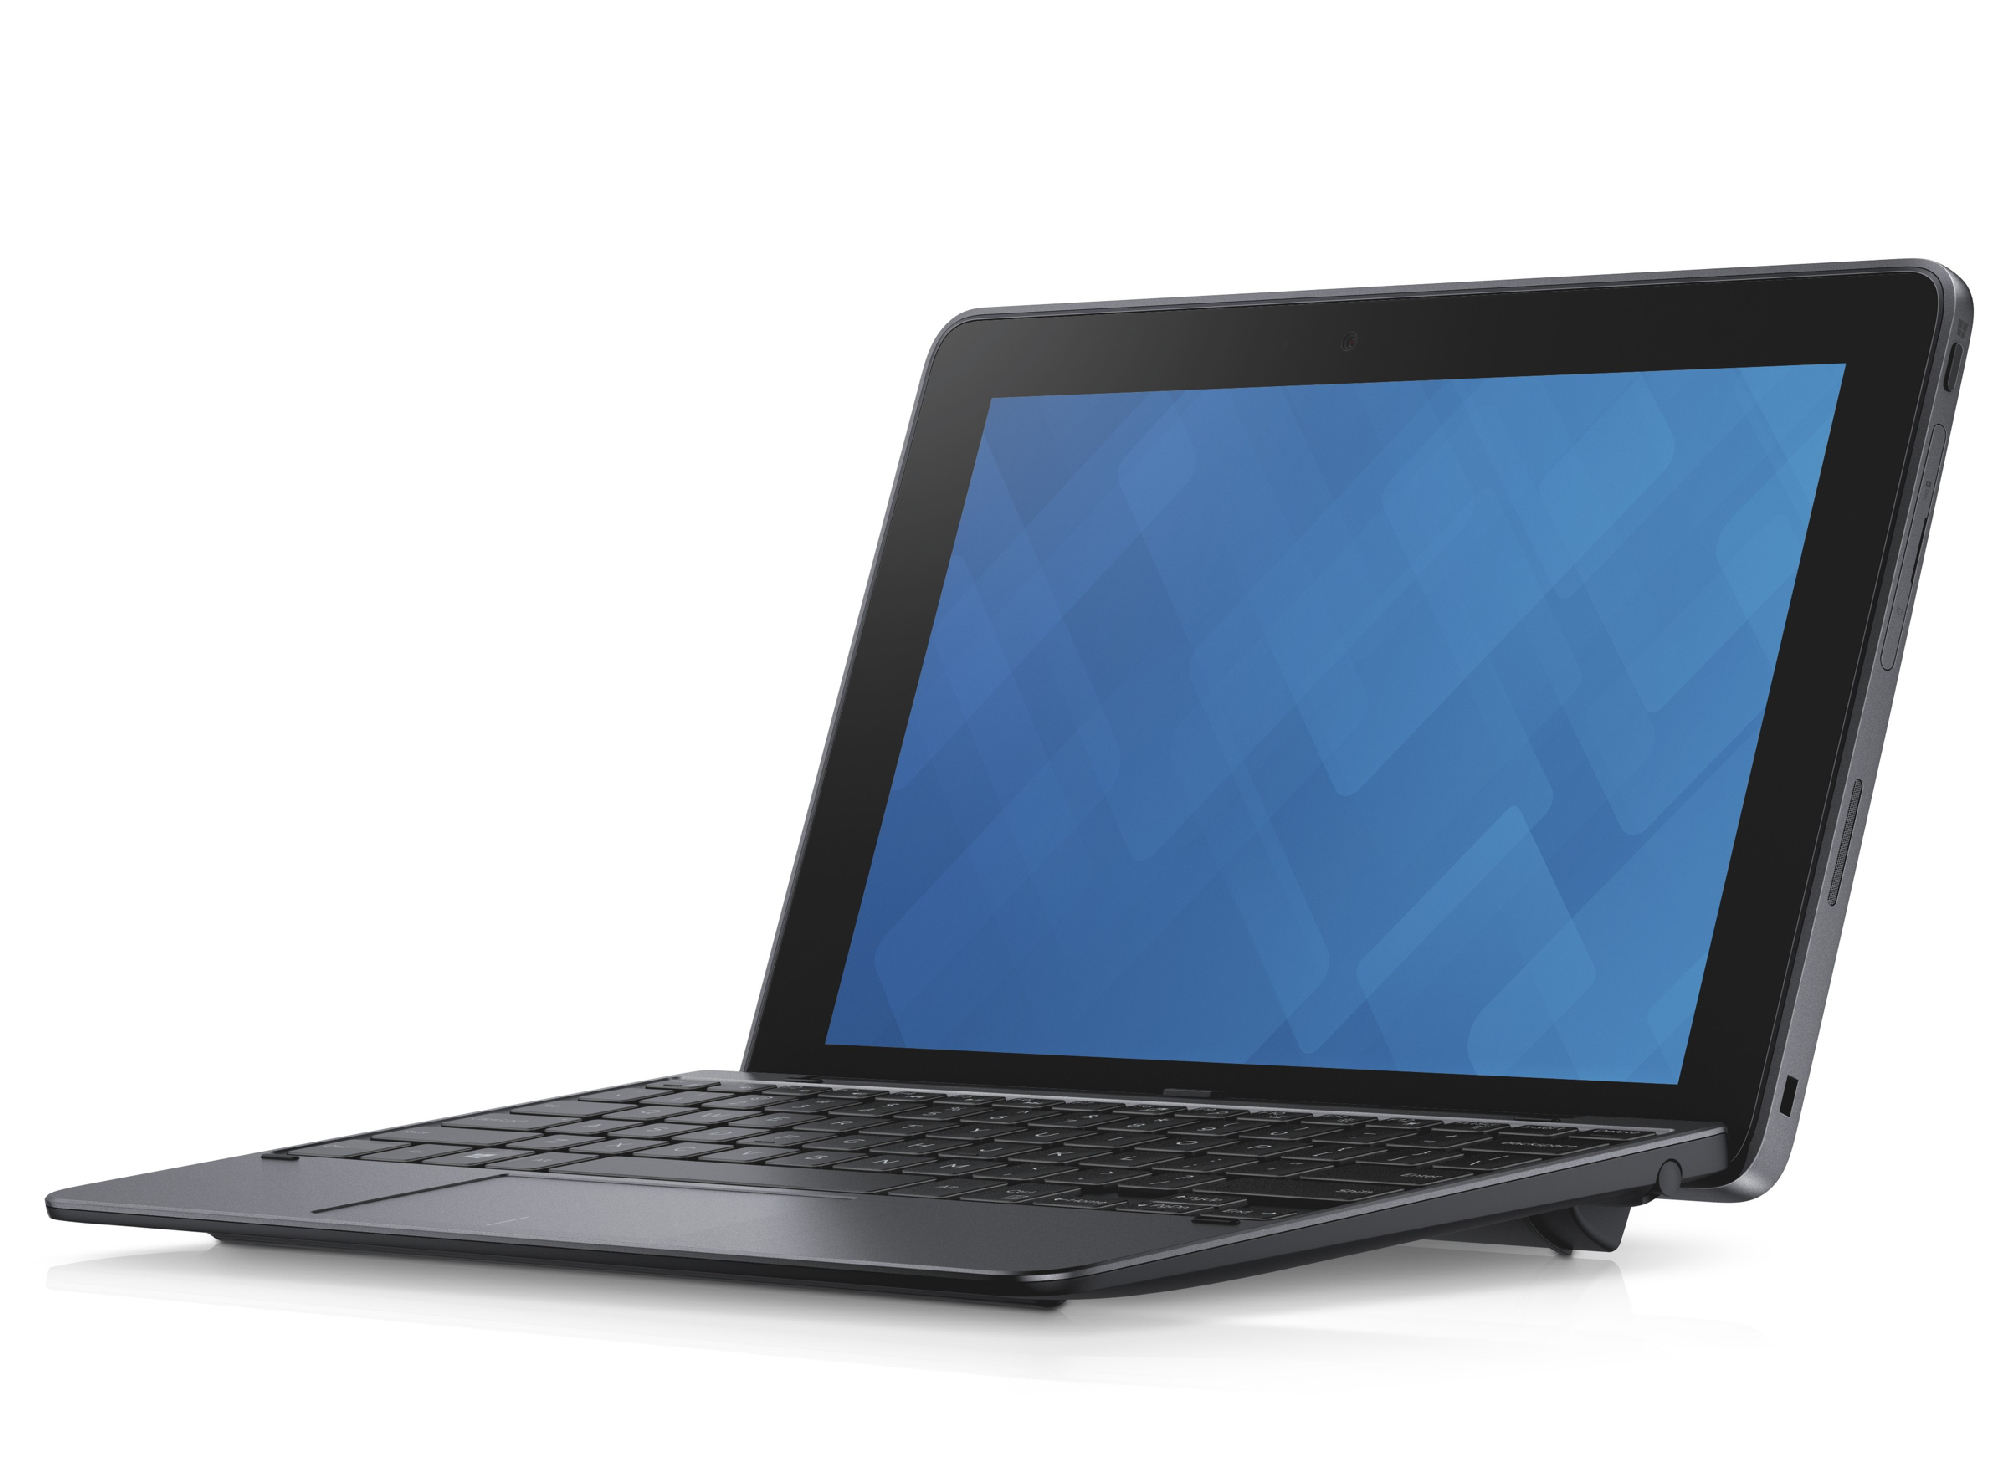
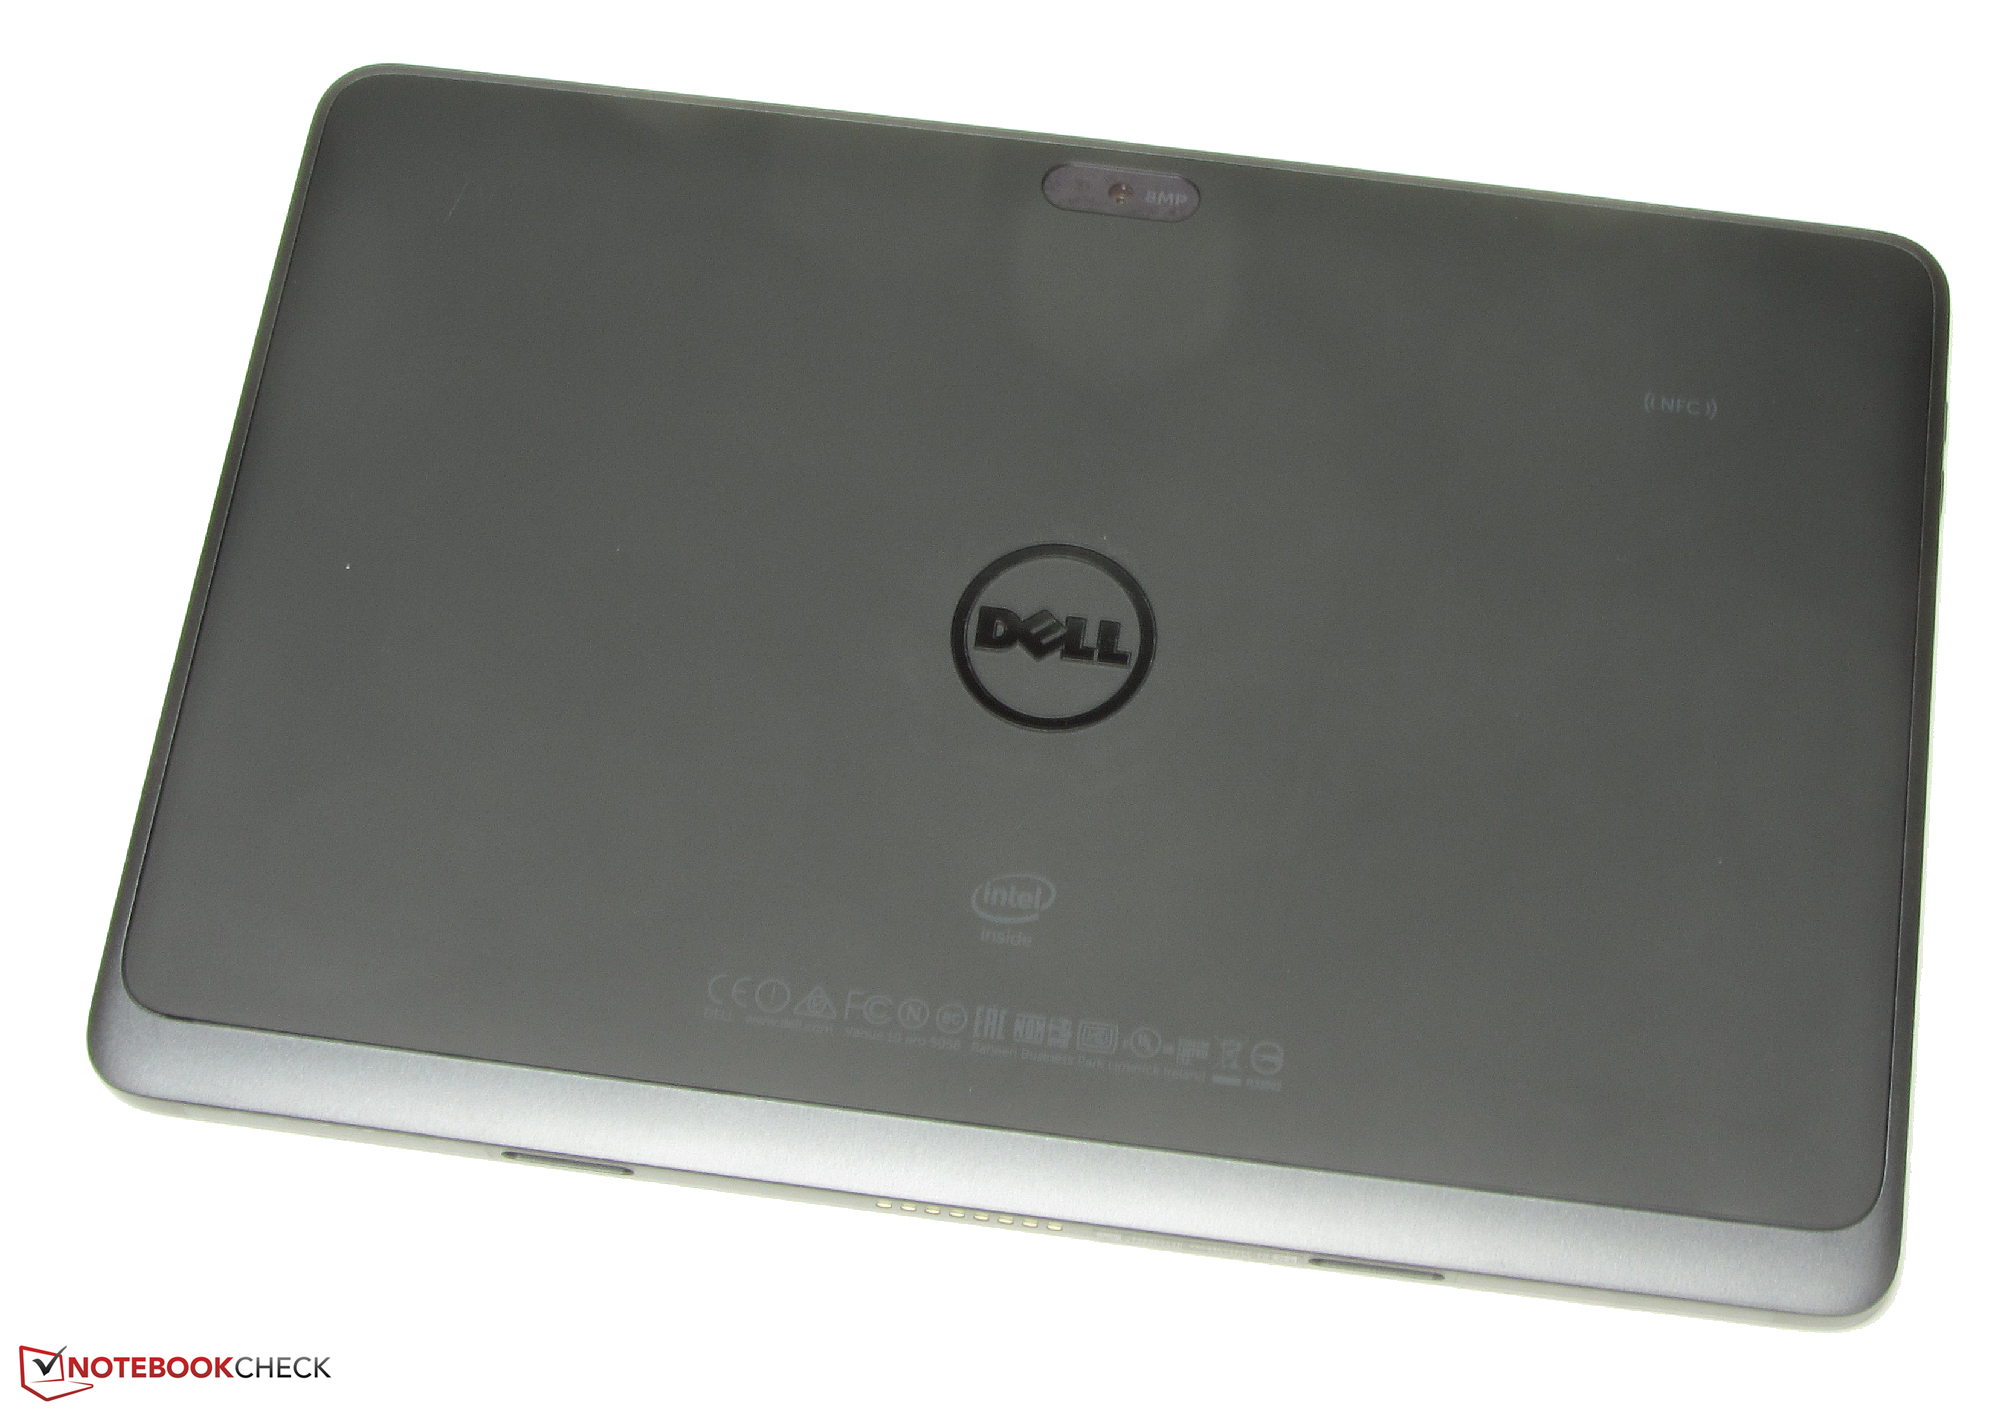
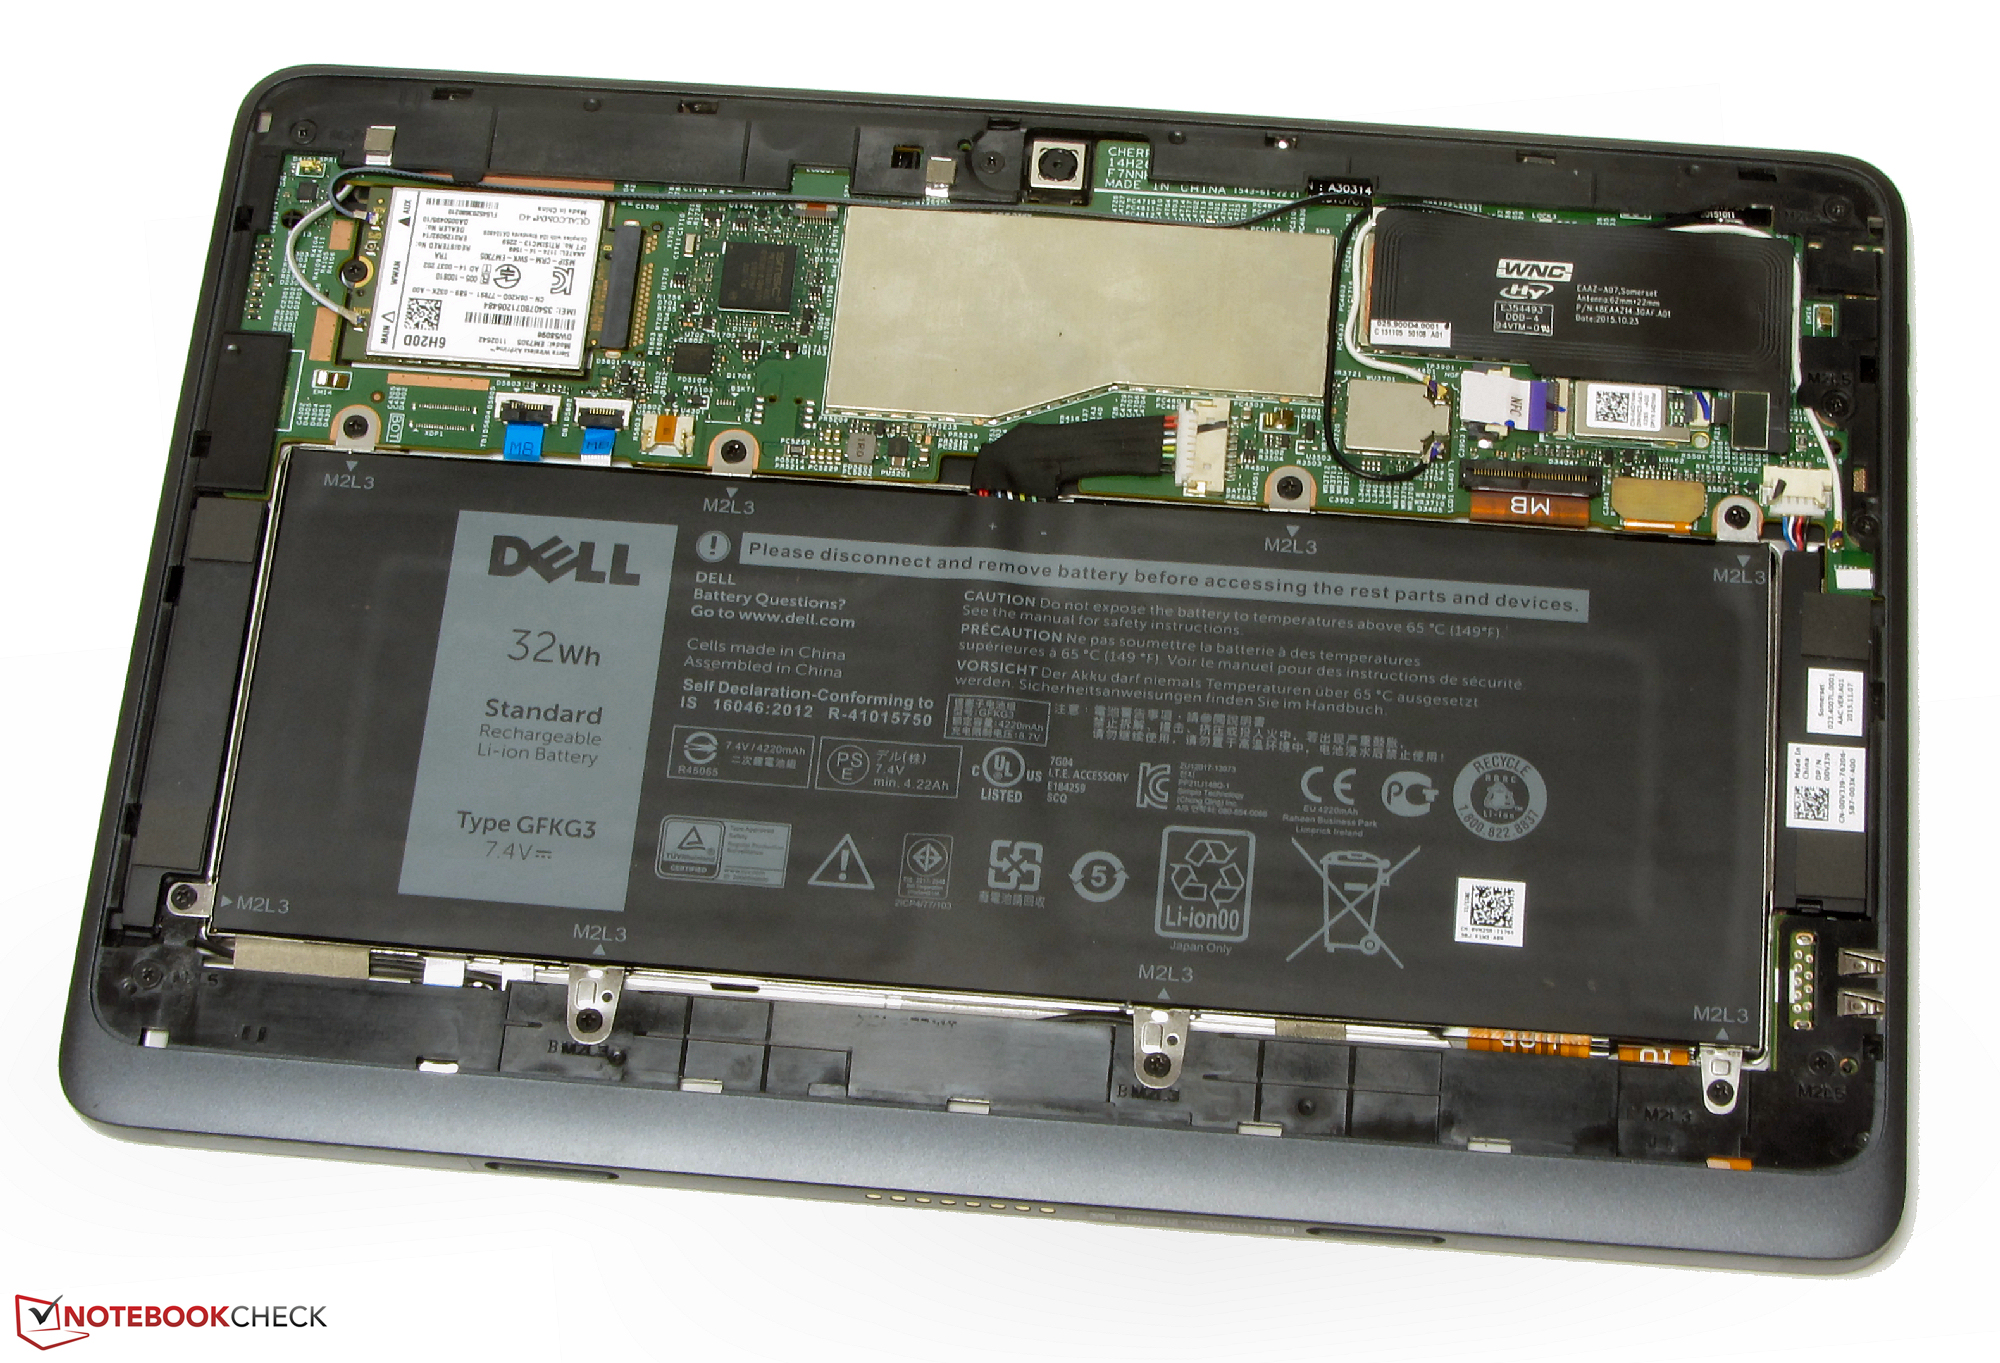
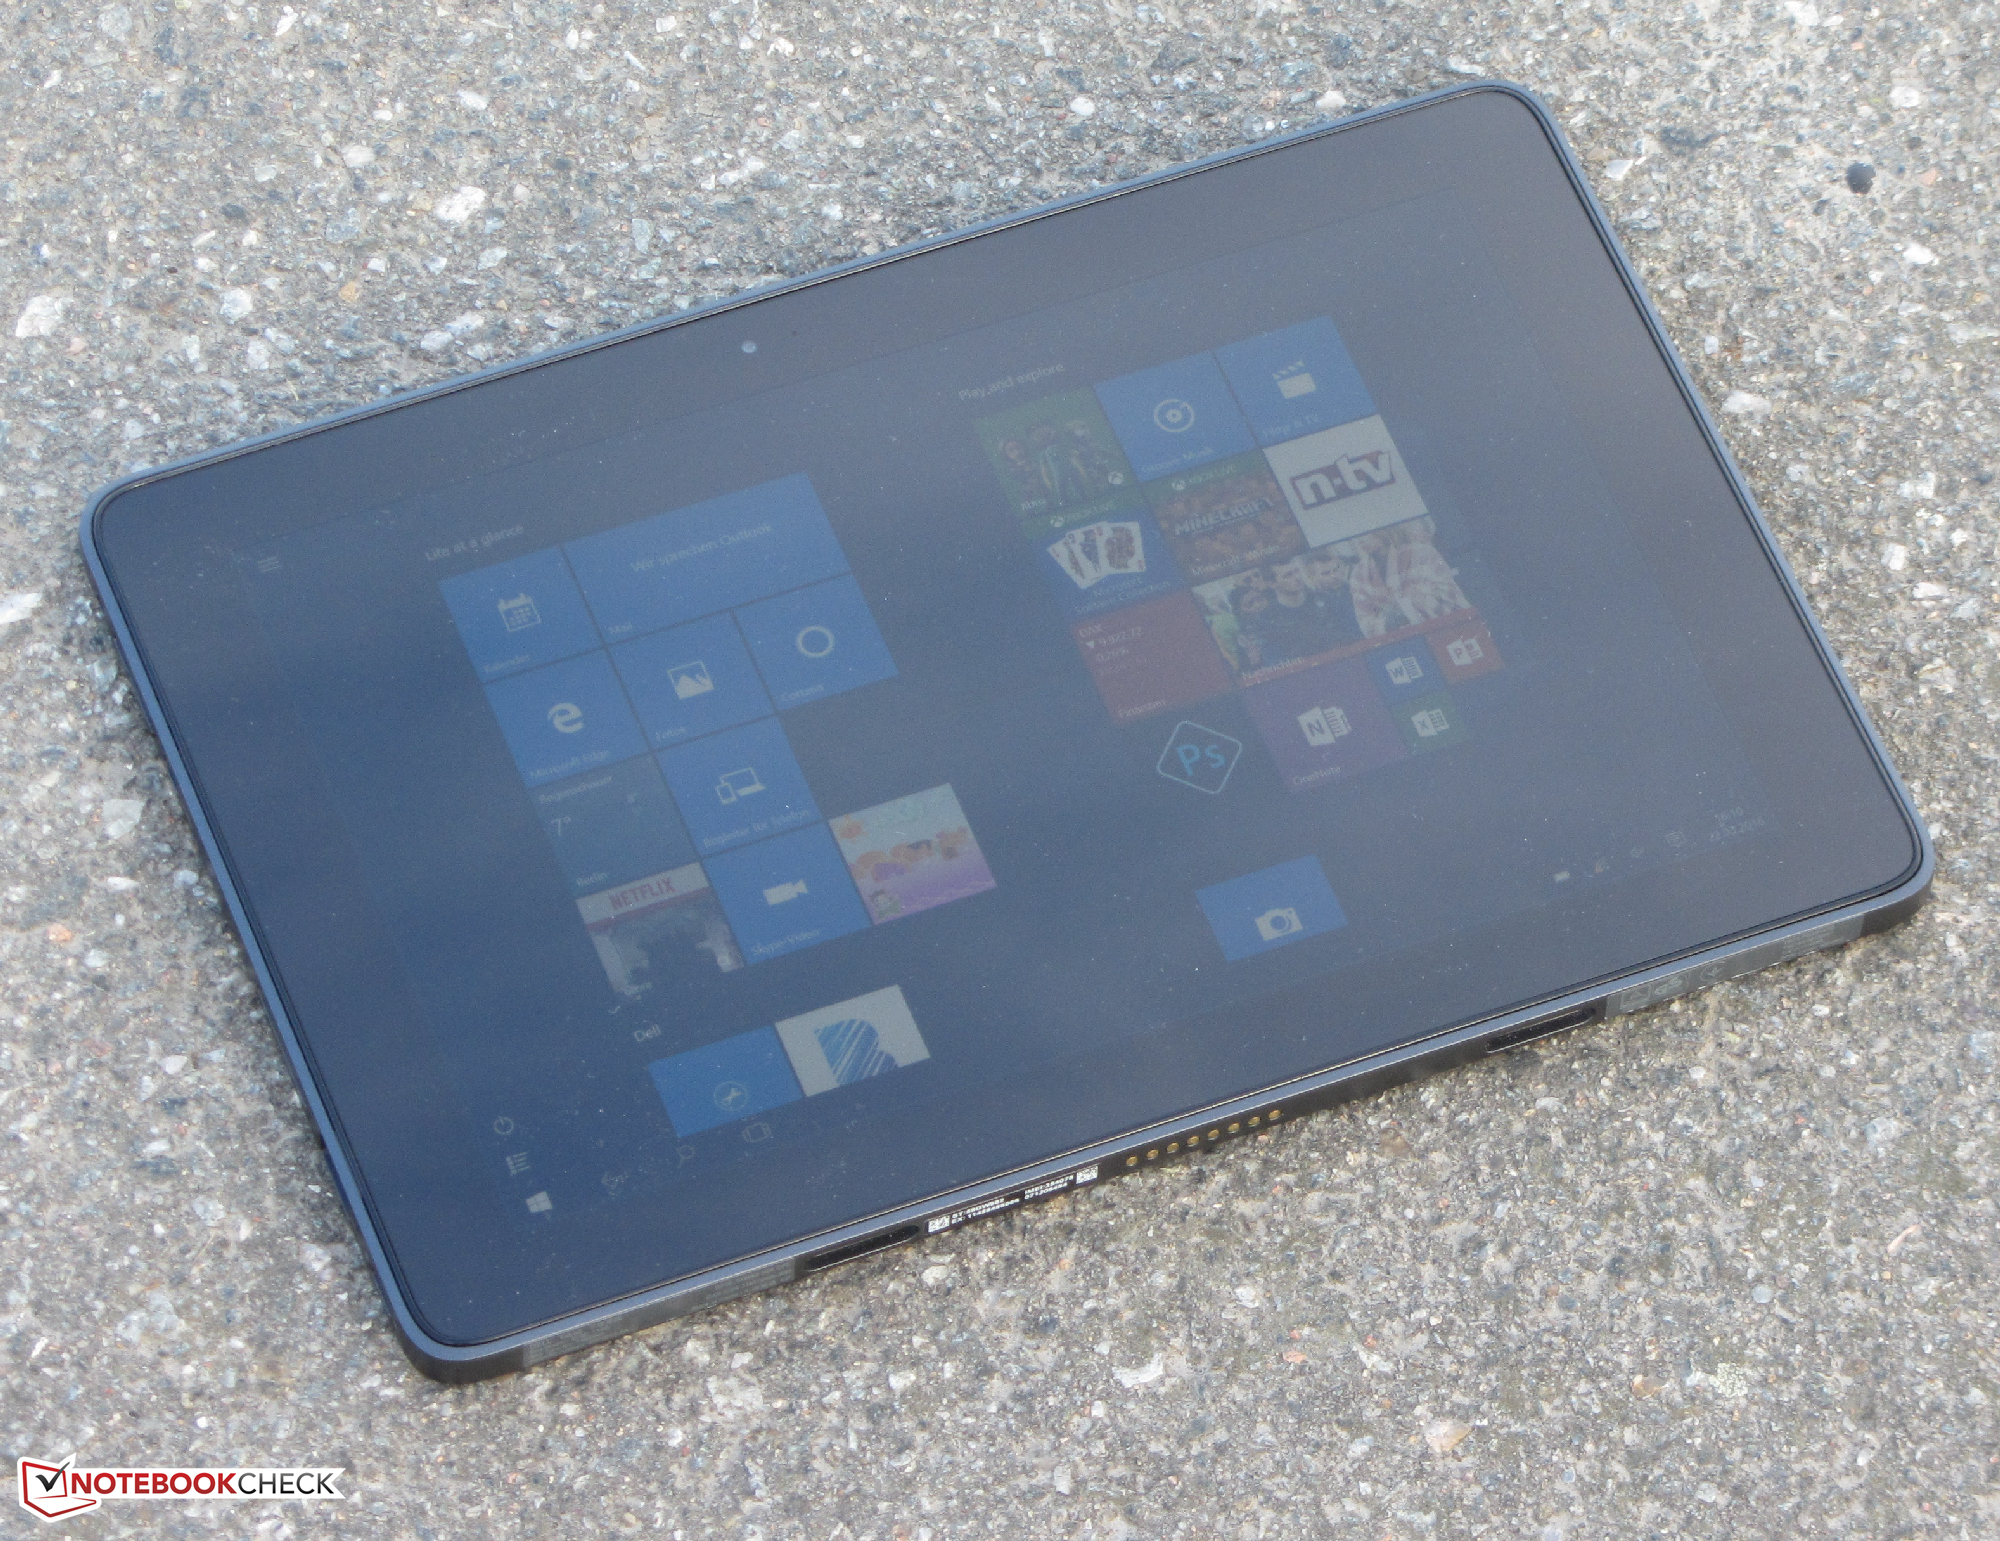
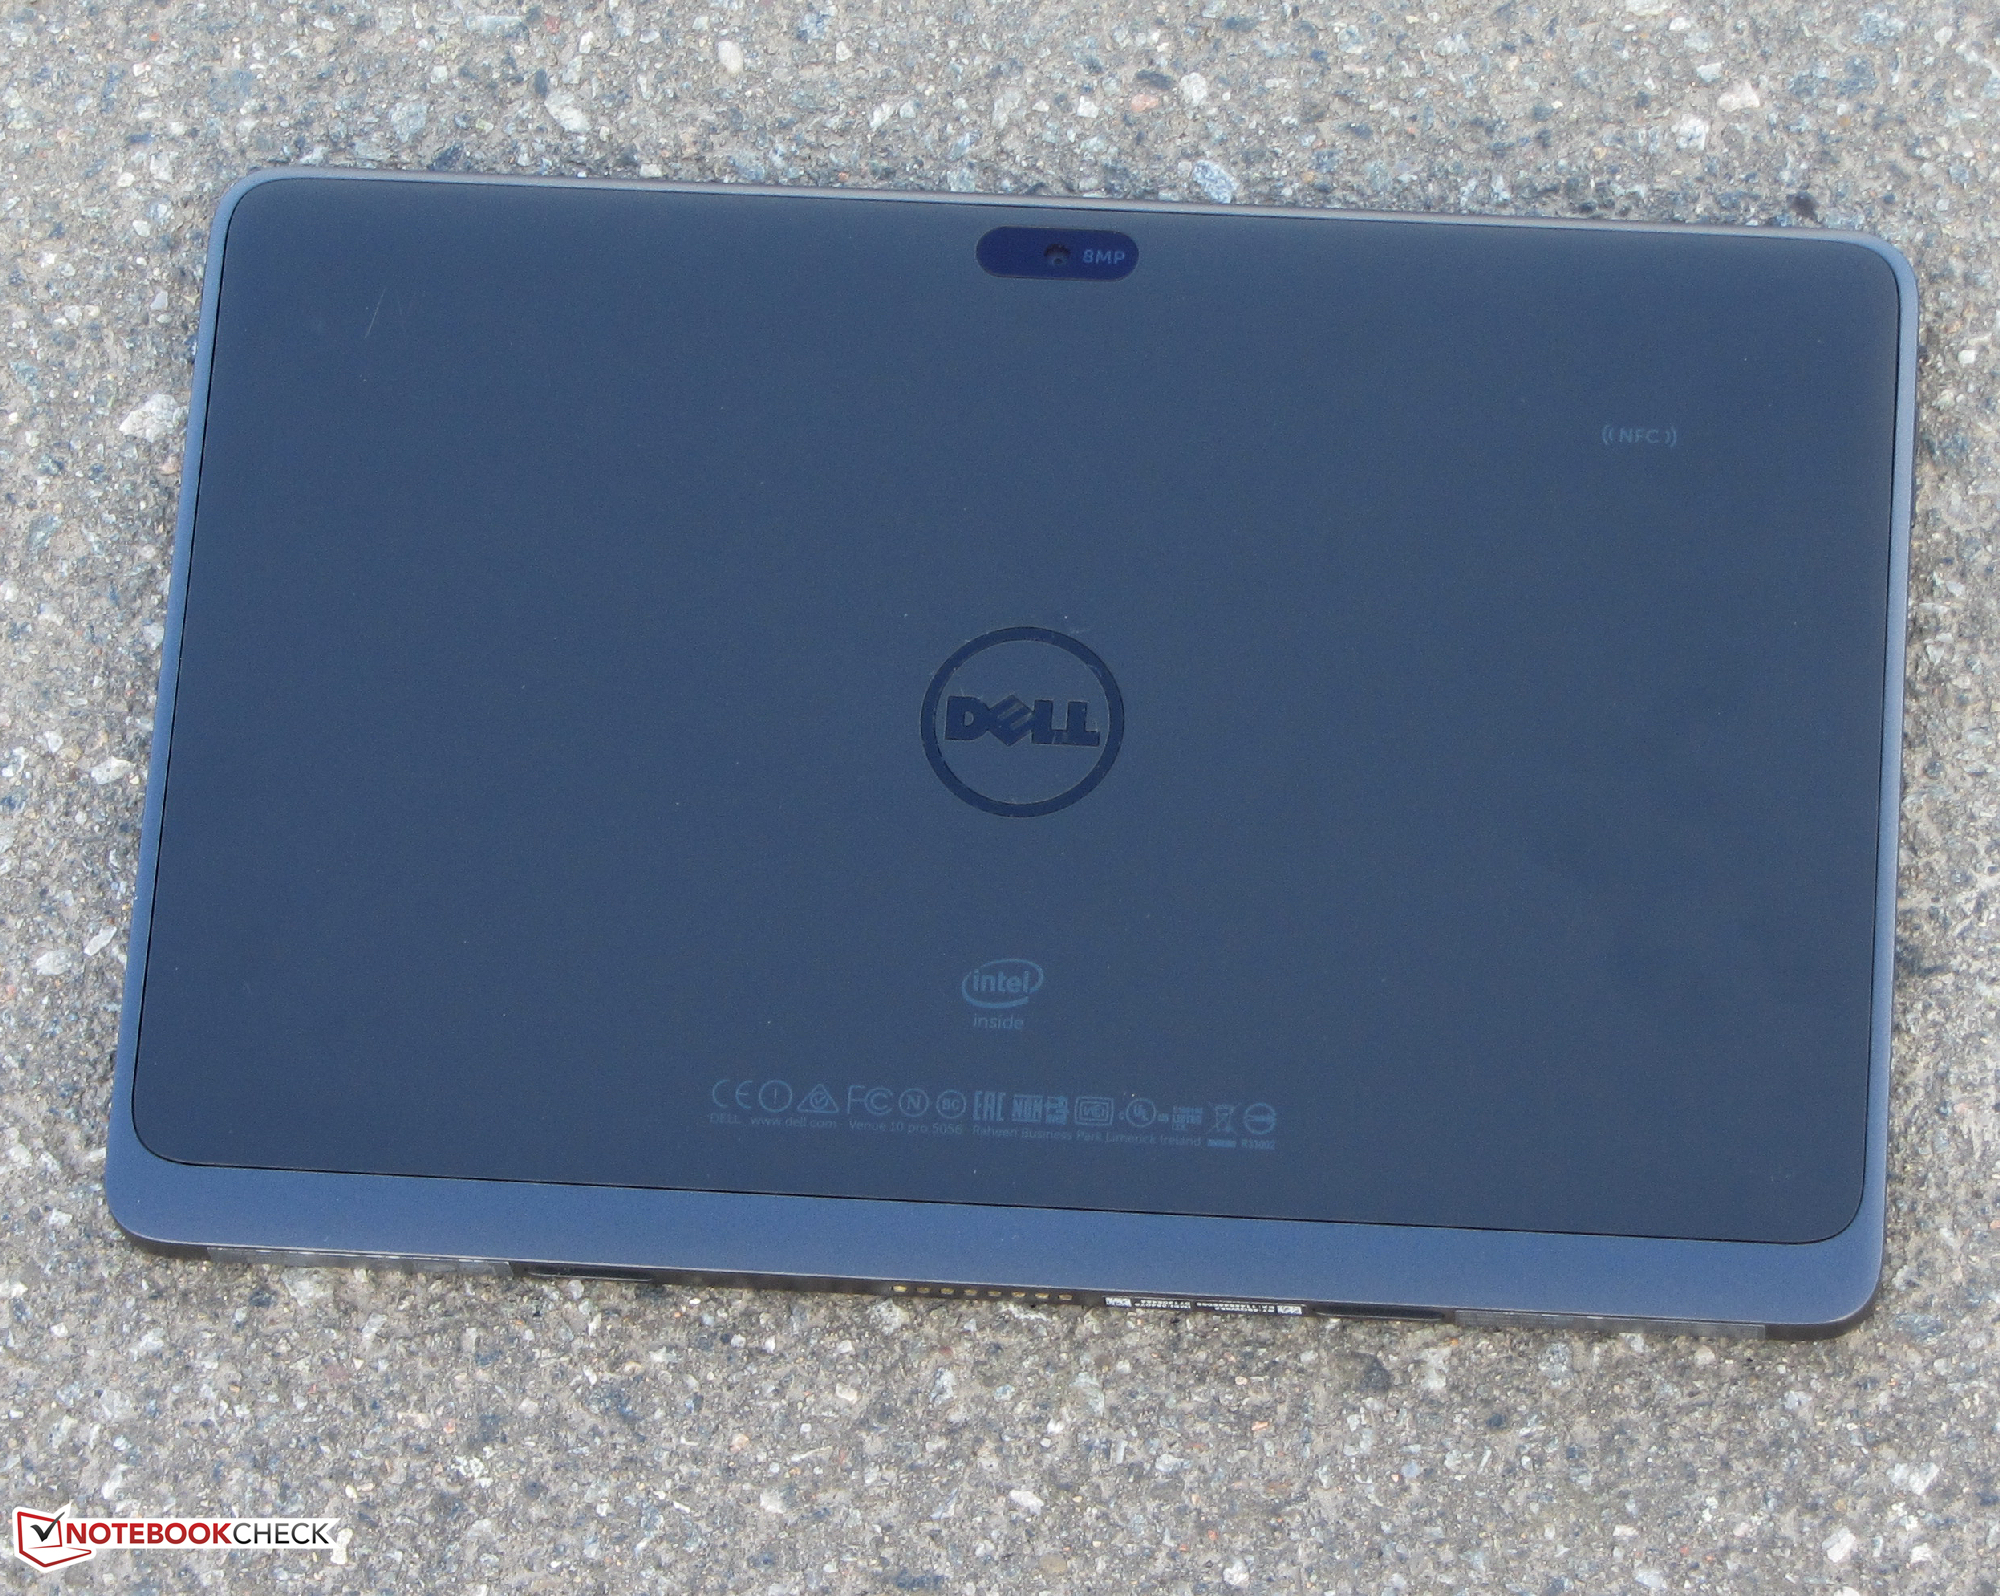
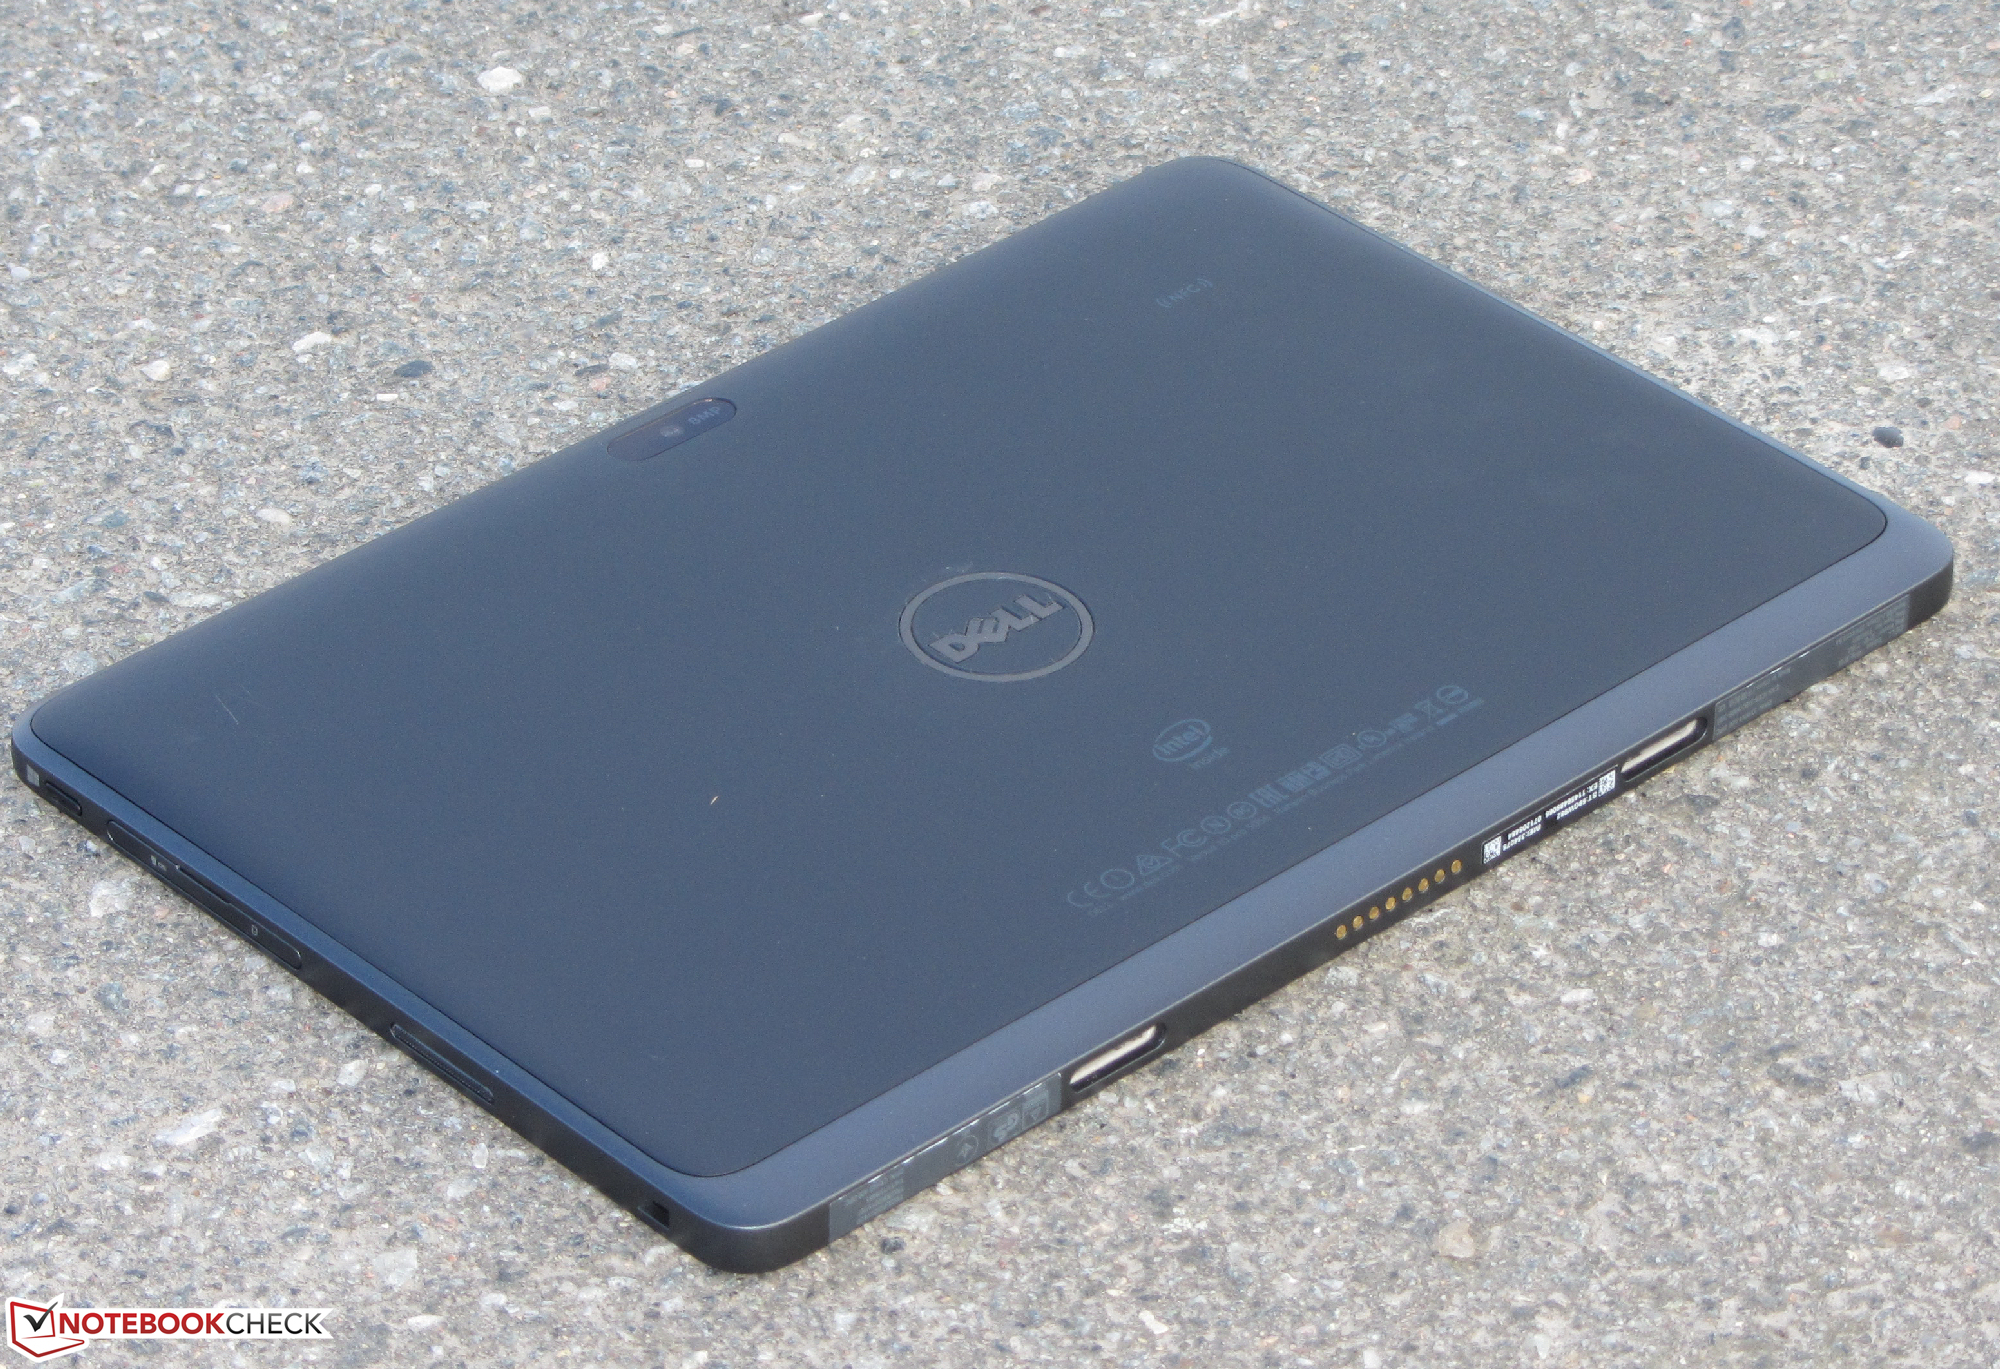
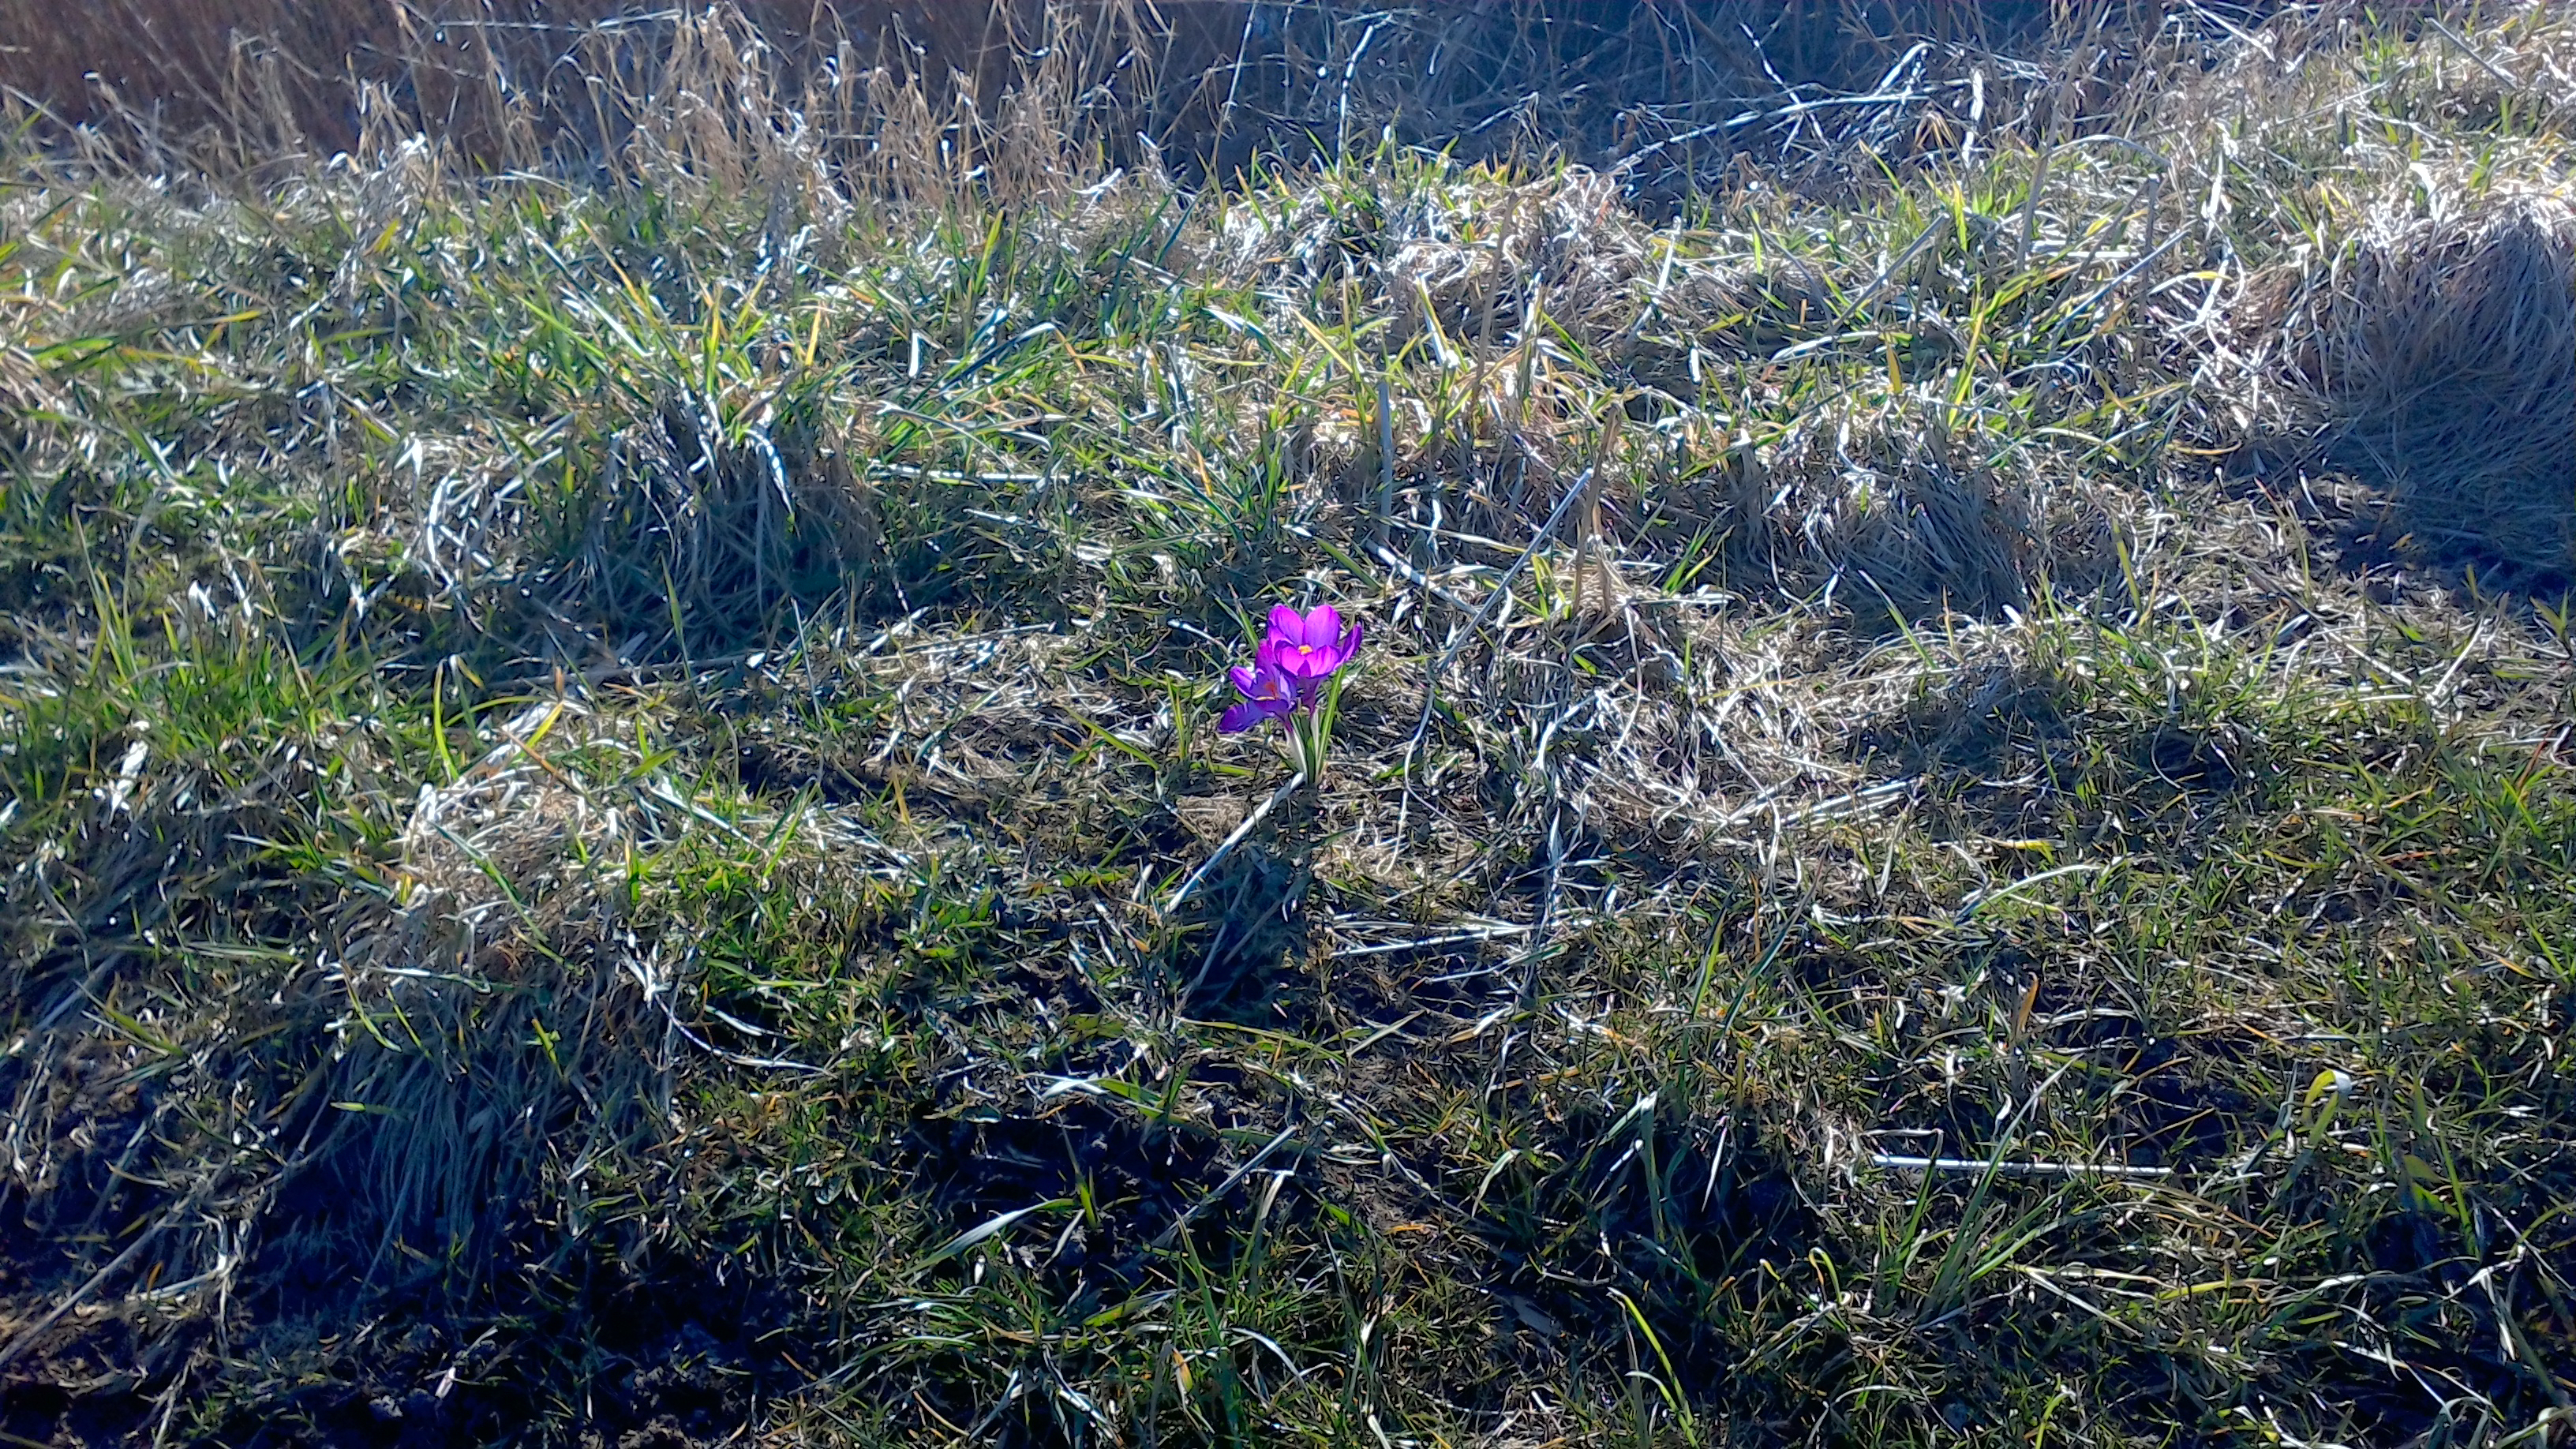
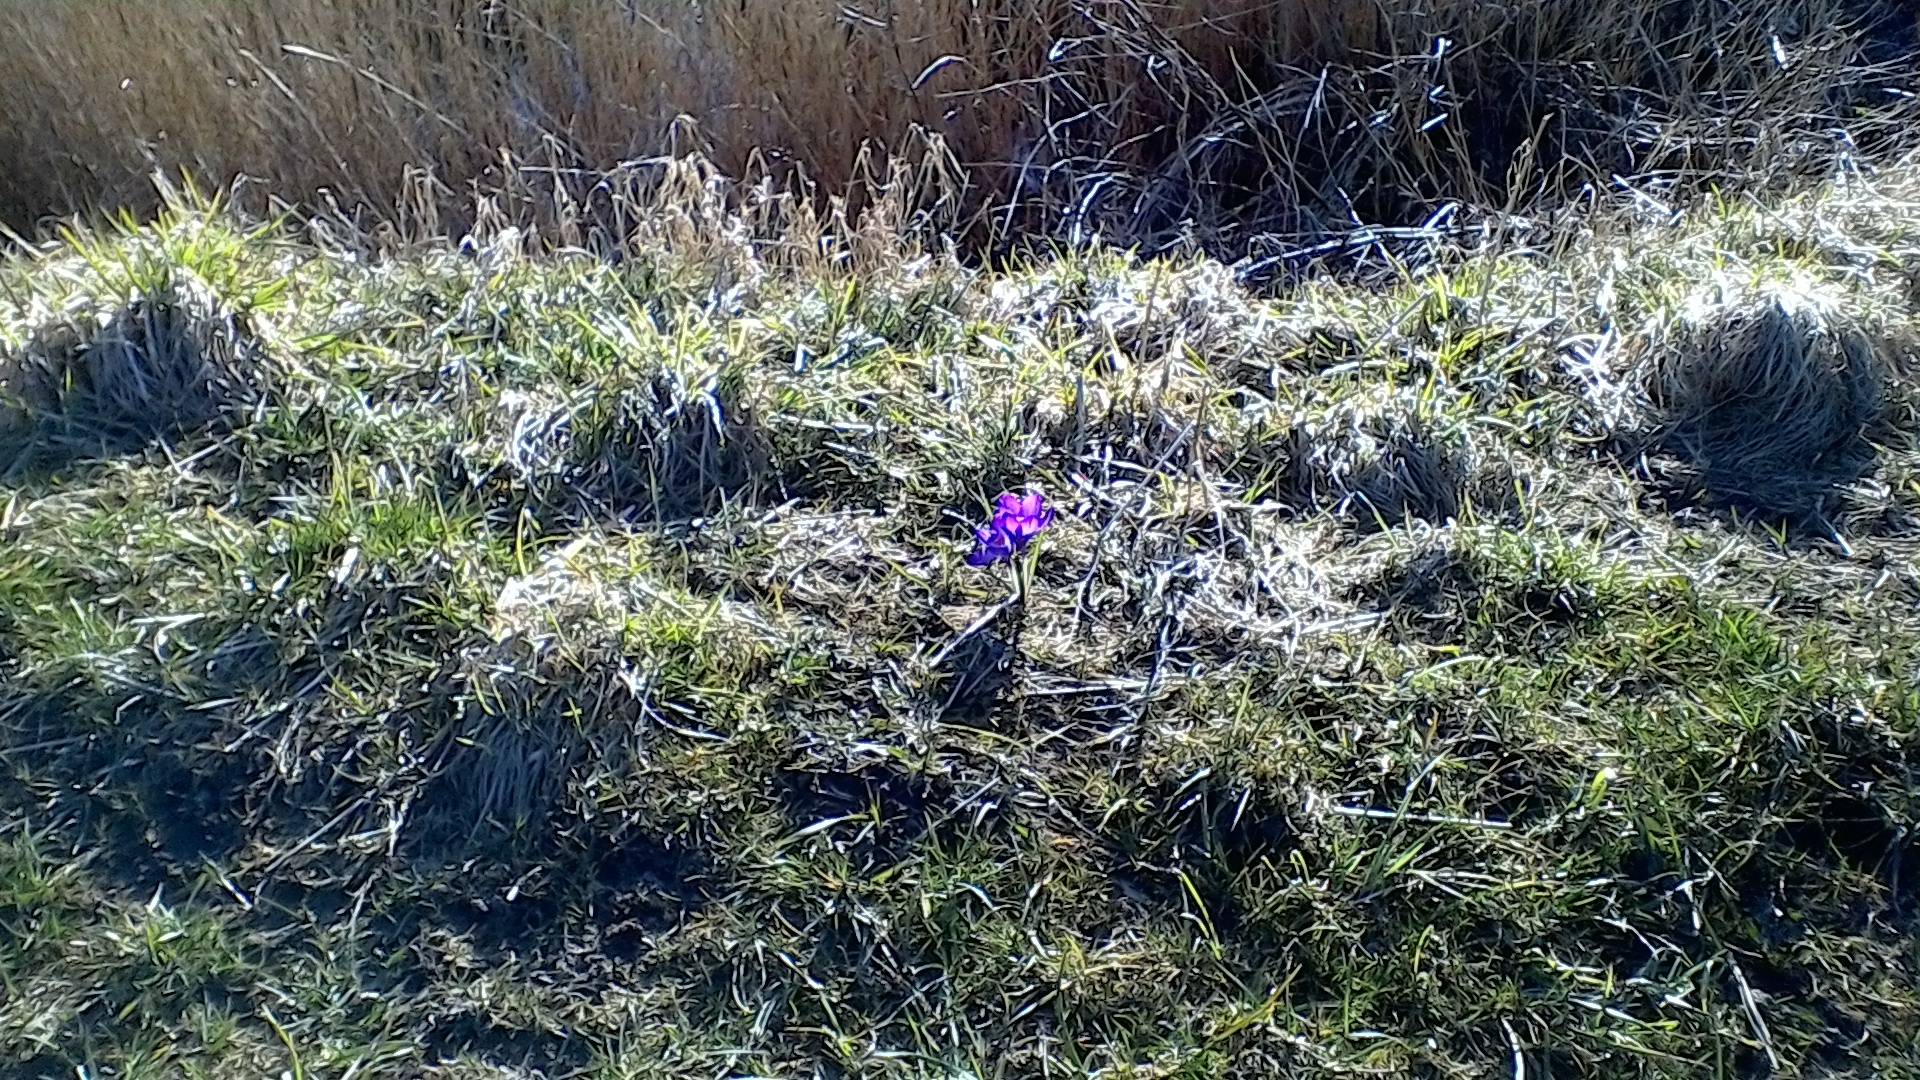
Image Comparison
Choose a scene and navigate within the first image. One click changes the position on touchscreens. One click on the zoomed-in image opens the original in a new window. The first image shows the scaled photograph of the test device.
| |||||||||||||||||||||||||
Brightness Distribution: 91 %
Center on Battery: 365 cd/m²
Contrast: 1521:1 (Black: 0.24 cd/m²)
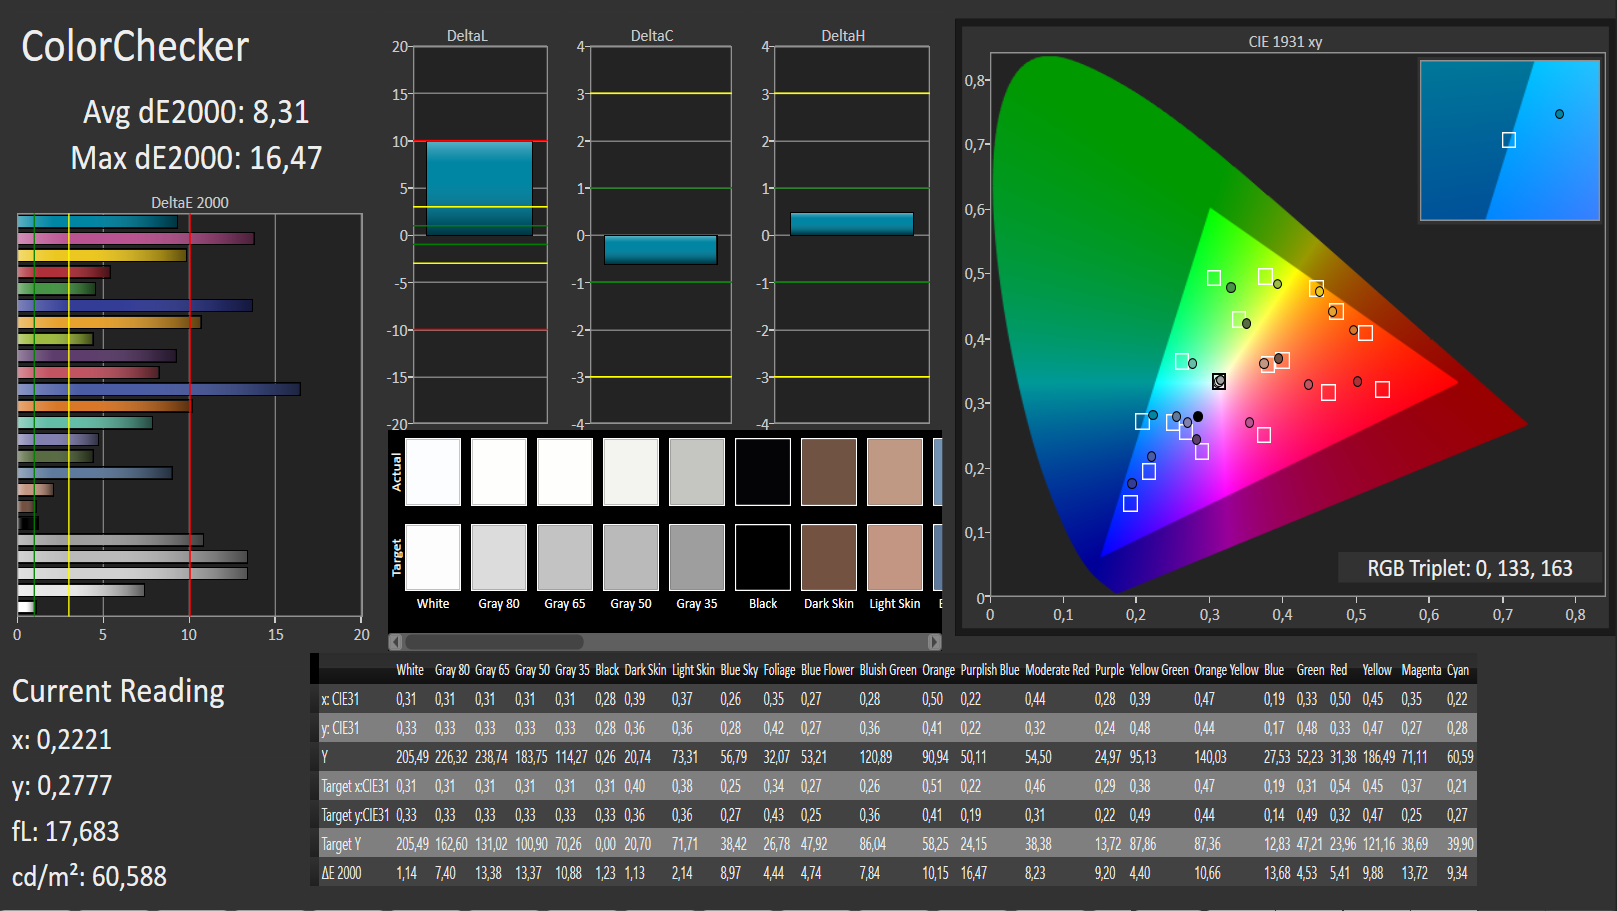
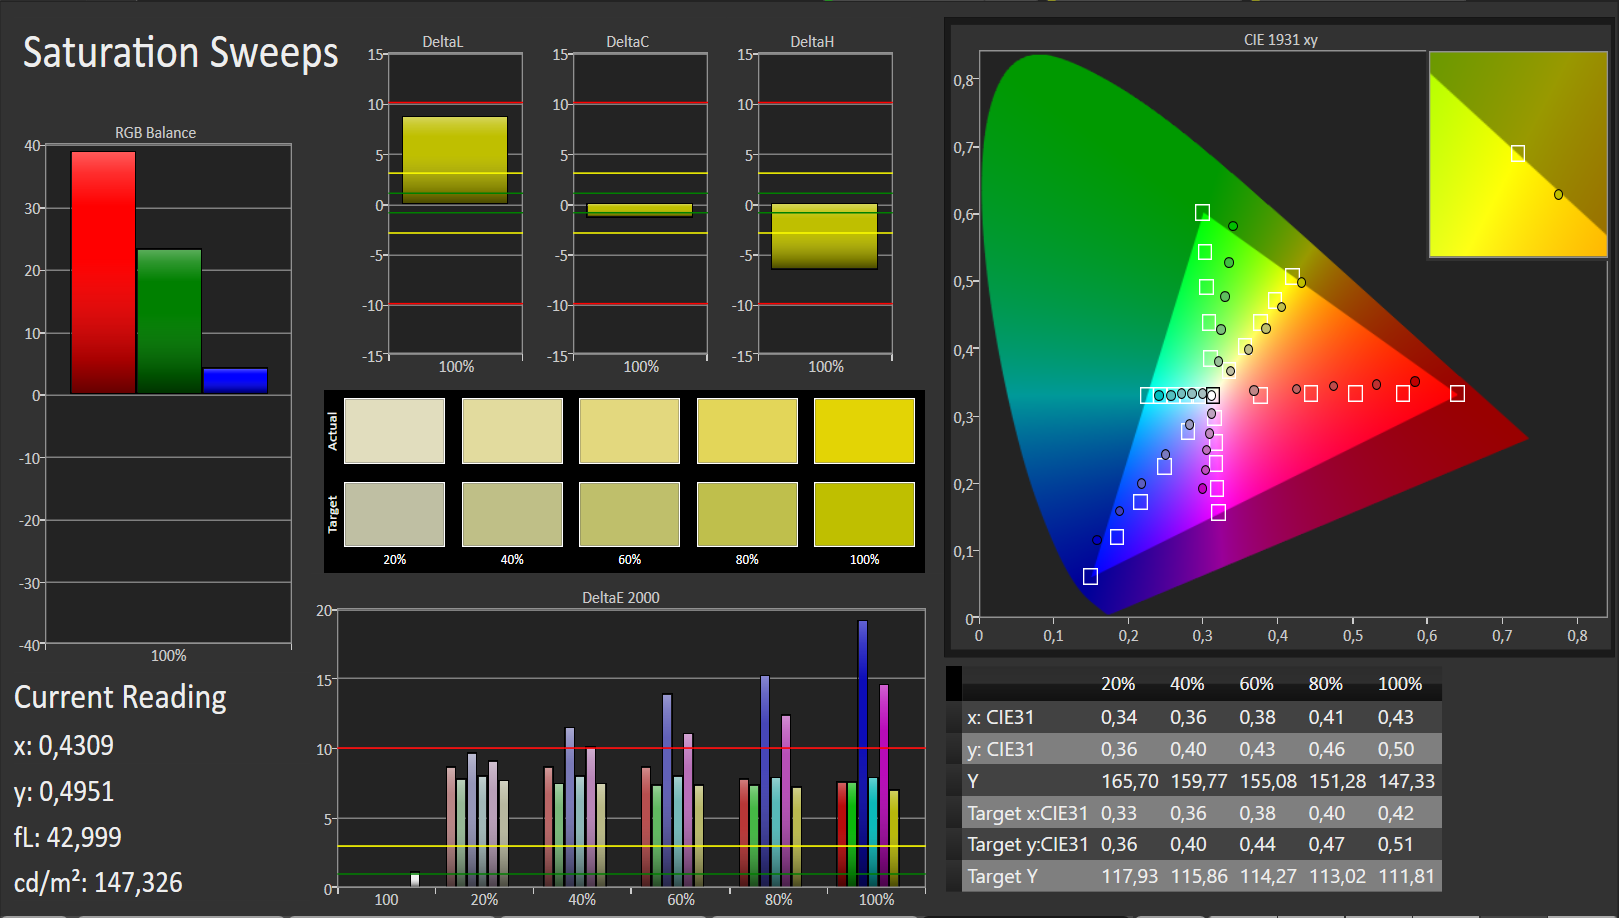
ΔE Color 8.31 | 0.5-29.43 Ø5
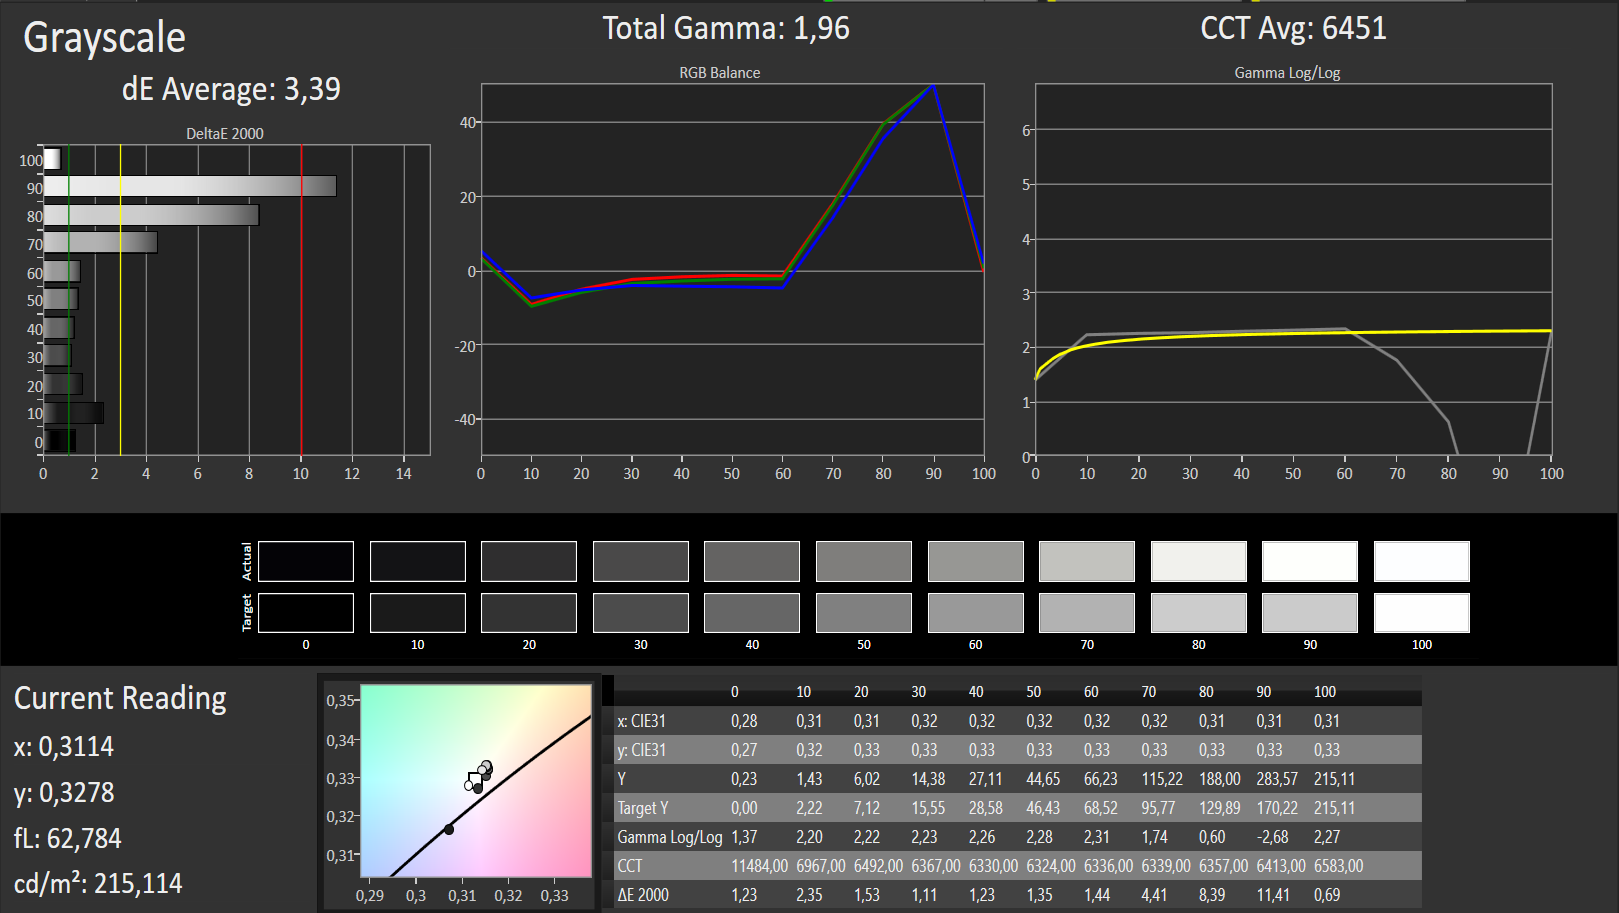
ΔE Greyscale 3.39 | 0.57-98 Ø5.3
60% sRGB (Argyll 1.6.3 3D)
38% AdobeRGB 1998 (Argyll 1.6.3 3D)
41.72% AdobeRGB 1998 (Argyll 2.2.0 3D)
60.7% sRGB (Argyll 2.2.0 3D)
40.38% Display P3 (Argyll 2.2.0 3D)
Gamma: 1.96
Screen Flickering / PWM (Pulse-Width Modulation)
| Screen flickering / PWM not detected | 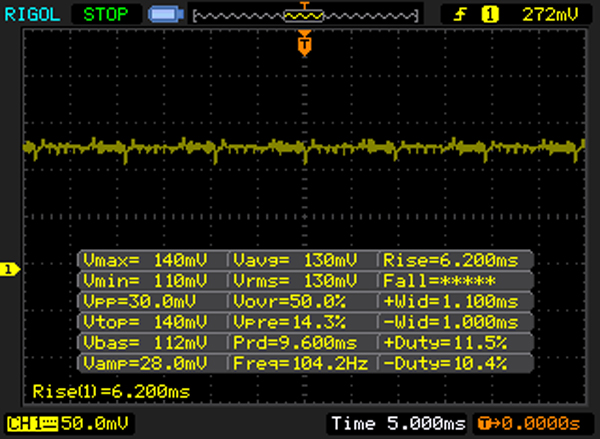 | ||
In comparison: 53 % of all tested devices do not use PWM to dim the display. If PWM was detected, an average of 17924 (minimum: 5 - maximum: 3846000) Hz was measured. | |||
Display Response Times
| ↔ Response Time Black to White | ||
|---|---|---|
| 26 ms ... rise ↗ and fall ↘ combined | ↗ 7 ms rise | 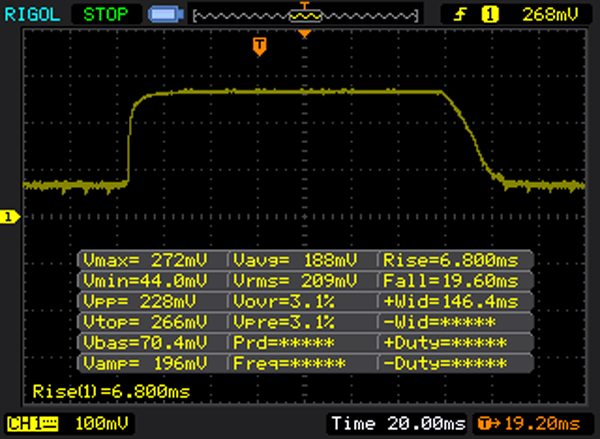 |
| ↘ 19 ms fall | ||
| The screen shows relatively slow response rates in our tests and may be too slow for gamers. In comparison, all tested devices range from 0.1 (minimum) to 240 (maximum) ms. » 57 % of all devices are better. This means that the measured response time is worse than the average of all tested devices (21.5 ms). | ||
| ↔ Response Time 50% Grey to 80% Grey | ||
| 30 ms ... rise ↗ and fall ↘ combined | ↗ 14 ms rise | 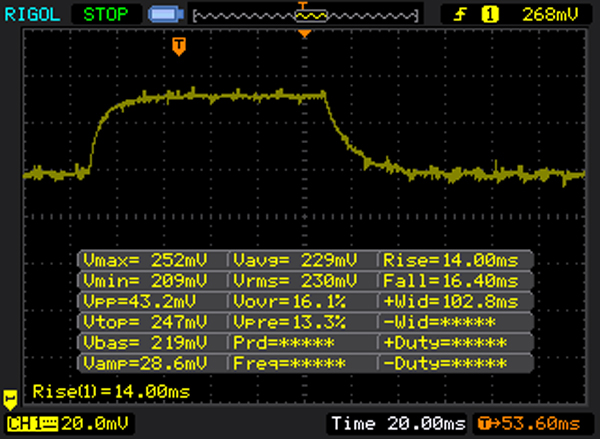 |
| ↘ 16 ms fall | ||
| The screen shows slow response rates in our tests and will be unsatisfactory for gamers. In comparison, all tested devices range from 0.2 (minimum) to 636 (maximum) ms. » 34 % of all devices are better. This means that the measured response time is better than the average of all tested devices (33.7 ms). | ||
| Dell Venue 10 Pro 5056 IPS, 1920x1200 | Dell Venue 10 Pro 5055 IPS, 1920x1200 | Apple iPad Air 2 2014 IPS, 2048x1536 | Google Pixel C LTPS, 2560x1800 | Lenovo Thinkpad Tablet 10 2nd Gen IPS, 1920x1200 | Amazon Fire HD 10 inch 2015 IPS, 1280x800 | Asus Transformer Book T100HA-C4-GR IPS, 1280x800 | Samsung Galaxy Tab S2 9.7 LTE Super AMOLED, 2048x1536 | Samsung Galaxy Tab A 9.7 SM-T555 TFT, 1024x768 | |
|---|---|---|---|---|---|---|---|---|---|
| Display | 18% | 26% | |||||||
| Display P3 Coverage | 40.38 | 48.01 19% | 52.8 31% | ||||||
| sRGB Coverage | 60.7 | 70.6 16% | 73 20% | ||||||
| AdobeRGB 1998 Coverage | 41.72 | 49.79 19% | 53.3 28% | ||||||
| Response Times | -39% | ||||||||
| Response Time Grey 50% / Grey 80% * | 30 ? | 42 ? -40% | |||||||
| Response Time Black / White * | 26 ? | 36 ? -38% | |||||||
| PWM Frequency | |||||||||
| Screen | -22% | 8% | -14% | -15% | -7% | 18% | 27% | -17% | |
| Brightness middle | 365 | 436 19% | 423 16% | 487 33% | 345 -5% | 458 25% | 480.2 32% | 358 -2% | 394 8% |
| Brightness | 348 | 418 20% | 427 23% | 510 47% | 337 -3% | 434 25% | 455 31% | 357 3% | 392 13% |
| Brightness Distribution | 91 | 92 1% | 92 1% | 91 0% | 94 3% | 86 -5% | 85 -7% | 86 -5% | 80 -12% |
| Black Level * | 0.24 | 0.58 -142% | 0.61 -154% | 0.39 -63% | 0.43 -79% | 0.43 -79% | 0.324 -35% | 0.51 -113% | |
| Contrast | 1521 | 752 -51% | 693 -54% | 1249 -18% | 802 -47% | 1065 -30% | 1482 -3% | 773 -49% | |
| Colorchecker dE 2000 * | 8.31 | 5.17 38% | 2.86 66% | 5.24 37% | 5.86 29% | 4.18 50% | 3.45 58% | 1.78 79% | 3.59 57% |
| Colorchecker dE 2000 max. * | 16.47 | ||||||||
| Greyscale dE 2000 * | 3.39 | 4.68 -38% | 2.37 30% | 7.95 -135% | 5.63 -66% | 4.54 -34% | 2.67 21% | 1.38 59% | 4.25 -25% |
| Gamma | 1.96 112% | 2.31 95% | 2.43 91% | 2.16 102% | 2.33 94% | 2.15 102% | 2.34 94% | 2.24 98% | 2.56 86% |
| CCT | 6451 101% | 6652 98% | 6941 94% | 6565 99% | 6533 99% | 7083 92% | 6164 105% | 6366 102% | 7148 91% |
| Color Space (Percent of AdobeRGB 1998) | 38 | 88 132% | 45.7 20% | 47.28 24% | |||||
| Color Space (Percent of sRGB) | 60 | 70.1 17% | 84.38 41% | ||||||
| Total Average (Program / Settings) | -22% /
-22% | 8% /
8% | -27% /
-20% | 2% /
-6% | -7% /
-7% | 22% /
20% | 27% /
27% | -17% /
-17% |
* ... smaller is better
| Cinebench R10 | |
| Rendering Multiple CPUs 32Bit (sort by value) | |
| Dell Venue 10 Pro 5056 | |
| Dell Venue 10 Pro 5055 | |
| HP Pro Tablet 10 EE G1 | |
| Lenovo Thinkpad Tablet 10 2nd Gen | |
| Asus Transformer Book T100HA-C4-GR | |
| Rendering Single 32Bit (sort by value) | |
| Dell Venue 10 Pro 5056 | |
| Dell Venue 10 Pro 5055 | |
| HP Pro Tablet 10 EE G1 | |
| Lenovo Thinkpad Tablet 10 2nd Gen | |
| Asus Transformer Book T100HA-C4-GR | |
| Geekbench 3 | |
| 32 Bit Single-Core Score (sort by value) | |
| Dell Venue 10 Pro 5056 | |
| HP Pro Tablet 10 EE G1 | |
| LG G Pad II 10.1 | |
| Amazon Fire HD 10 inch 2015 | |
| Samsung Galaxy Tab A 9.7 SM-T555 | |
| 32 Bit Multi-Core Score (sort by value) | |
| Dell Venue 10 Pro 5056 | |
| HP Pro Tablet 10 EE G1 | |
| LG G Pad II 10.1 | |
| Amazon Fire HD 10 inch 2015 | |
| Samsung Galaxy Tab A 9.7 SM-T555 | |
| JetStream 1.1 - Total Score (sort by value) | |
| Dell Venue 10 Pro 5056 | |
| HP Pro Tablet 10 EE G1 | |
| Google Pixel C | |
| Lenovo Yoga Tab 3 Pro 10 YT3-X90L | |
| Samsung Galaxy Tab S2 9.7 LTE | |
| Peacekeeper - --- (sort by value) | |
| Dell Venue 10 Pro 5056 | |
| Dell Venue 10 Pro 5055 | |
| HP Pro Tablet 10 EE G1 | |
| Apple iPad Air 2 2014 | |
| Browsermark - 2.1 (sort by value) | |
| Dell Venue 10 Pro 5056 | |
| Apple iPad Air 2 2014 | |
| Google Pixel C | |
* ... smaller is better
| 3DMark 11 - 1280x720 Performance (sort by value) | |
| Dell Venue 10 Pro 5056 | |
| Dell Venue 10 Pro 5055 | |
| HP Pro Tablet 10 EE G1 | |
| Lenovo Thinkpad Tablet 10 2nd Gen | |
| Asus Transformer Book T100HA-C4-GR | |
| 3DMark - 1280x720 Ice Storm Standard Score (sort by value) | |
| Dell Venue 10 Pro 5056 | |
| HP Pro Tablet 10 EE G1 | |
| Google Pixel C | |
| Lenovo Thinkpad Tablet 10 2nd Gen | |
| Asus Transformer Book T100HA-C4-GR | |
| 3DMark 06 - 1280x1024 Standard Score AA:0x AF:0x (sort by value) | |
| Dell Venue 10 Pro 5056 | |
| Asus Transformer Book T100HA-C4-GR | |
| GFXBench | |
| on screen Car Chase Onscreen (sort by value) | |
| Dell Venue 10 Pro 5056 | |
| Google Pixel C | |
| Lenovo Yoga Tab 3 Pro 10 YT3-X90L | |
| 1920x1080 Car Chase Offscreen (sort by value) | |
| Dell Venue 10 Pro 5056 | |
| Google Pixel C | |
| Lenovo Yoga Tab 3 Pro 10 YT3-X90L | |
| GFXBench 3.1 | |
| on screen Manhattan ES 3.1 Onscreen (sort by value) | |
| Dell Venue 10 Pro 5056 | |
| Apple iPad Air 2 2014 | |
| Google Pixel C | |
| Amazon Fire HD 10 inch 2015 | |
| Lenovo Yoga Tab 3 Pro 10 YT3-X90L | |
| 1920x1080 Manhattan ES 3.1 Offscreen (sort by value) | |
| Dell Venue 10 Pro 5056 | |
| Apple iPad Air 2 2014 | |
| Google Pixel C | |
| Amazon Fire HD 10 inch 2015 | |
| Lenovo Yoga Tab 3 Pro 10 YT3-X90L | |
| GFXBench 3.0 | |
| on screen Manhattan Onscreen OGL (sort by value) | |
| Dell Venue 10 Pro 5056 | |
| Apple iPad Air 2 2014 | |
| Google Pixel C | |
| LG G Pad II 10.1 | |
| Amazon Fire HD 10 inch 2015 | |
| Lenovo Yoga Tab 3 Pro 10 YT3-X90L | |
| 1920x1080 1080p Manhattan Offscreen (sort by value) | |
| Dell Venue 10 Pro 5056 | |
| Apple iPad Air 2 2014 | |
| Google Pixel C | |
| LG G Pad II 10.1 | |
| Amazon Fire HD 10 inch 2015 | |
| Lenovo Yoga Tab 3 Pro 10 YT3-X90L | |
| low | med. | high | ultra | |
| Trackmania Nations Forever (2008) | 128 | 29.2 | 16.8 | |
| Tomb Raider (2013) | 25.7 | 12 | 8.3 | 3.7 |
| BioShock Infinite (2013) | 20.1 | 9.3 | 7.6 | 2.4 |
| Dragon Age: Inquisition (2014) | 9.5 | 5.7 | ||
| Dirt Rally (2015) | 20.1 | 12.5 | ||
| Metal Gear Solid V (2015) | 15.1 | 9.8 | ||
| Anno 2205 (2015) | 8.1 | 3.9 | ||
| Star Wars Battlefront (2015) | 8.8 | 4.8 | ||
| Rainbow Six Siege (2015) | 11.5 | 7 |
(±) The maximum temperature on the upper side is 42.2 °C / 108 F, compared to the average of 33.8 °C / 93 F, ranging from 20.7 to 53.2 °C for the class Tablet.
(-) The bottom heats up to a maximum of 50.2 °C / 122 F, compared to the average of 33.3 °C / 92 F
(+) In idle usage, the average temperature for the upper side is 28.6 °C / 83 F, compared to the device average of 30 °C / 86 F.
| Dell Venue 10 Pro 5056 Z8500, HD Graphics (Cherry Trail) | Dell Venue 10 Pro 5055 Z3735F, HD Graphics (Bay Trail) | HP Pro Tablet 10 EE G1 Z3735F, HD Graphics (Bay Trail) | Apple iPad Air 2 2014 A8X, PowerVR GXA6850 | Google Pixel C X1, Tegra X1 Maxwell GPU | Lenovo Thinkpad Tablet 10 2nd Gen Z8700, HD Graphics (Cherry Trail) | Amazon Fire HD 10 inch 2015 MT8135, PowerVR G6200 | Asus Transformer Book T100HA-C4-GR Z8500, HD Graphics (Cherry Trail) | Samsung Galaxy Tab S2 9.7 LTE Exynos 5433, Mali-T760 MP6 | Samsung Galaxy Tab A 9.7 SM-T555 410 APQ8016, Adreno 306 | |
|---|---|---|---|---|---|---|---|---|---|---|
| Heat | -8% | 6% | 9% | 11% | -1% | 23% | 22% | 12% | 11% | |
| Maximum Upper Side * | 42.2 | 43.6 -3% | 39 8% | 36.2 14% | 42.3 -0% | 51 -21% | 30.4 28% | 35.2 17% | 40.8 3% | 37 12% |
| Maximum Bottom * | 50.2 | 47.6 5% | 44.9 11% | 42.8 15% | 36 28% | 55 -10% | 30.2 40% | 33.4 33% | 35.7 29% | 36.9 26% |
| Idle Upper Side * | 34.1 | 38 -11% | 31.1 9% | 31 9% | 31.8 7% | 27.1 21% | 29.8 13% | 27.6 19% | 31.2 9% | 33.7 1% |
| Idle Bottom * | 31.2 | 37.8 -21% | 33 -6% | 32 -3% | 28 10% | 29 7% | 28 10% | 25.8 17% | 29.1 7% | 29.8 4% |
* ... smaller is better
| Off / Standby | |
| Idle | |
| Load |
|
| Dell Venue 10 Pro 5056 Z8500, HD Graphics (Cherry Trail) | Dell Venue 10 Pro 5055 Z3735F, HD Graphics (Bay Trail) | HP Pro Tablet 10 EE G1 Z3735F, HD Graphics (Bay Trail) | Apple iPad Air 2 2014 A8X, PowerVR GXA6850 | Google Pixel C X1, Tegra X1 Maxwell GPU | Lenovo Thinkpad Tablet 10 2nd Gen Z8700, HD Graphics (Cherry Trail) | Amazon Fire HD 10 inch 2015 MT8135, PowerVR G6200 | Samsung Galaxy Tab S2 9.7 LTE Exynos 5433, Mali-T760 MP6 | Samsung Galaxy Tab A 9.7 SM-T555 410 APQ8016, Adreno 306 | |
|---|---|---|---|---|---|---|---|---|---|
| Power Consumption | 12% | 5% | 27% | 22% | 11% | 48% | 23% | 44% | |
| Idle Minimum * | 3.2 | 2.8 12% | 3.5 -9% | 1.2 62% | 1.82 43% | 2.4 25% | 1.24 61% | 2.3 28% | 1.1 66% |
| Idle Average * | 6 | 5.4 10% | 5.5 8% | 5.1 15% | 4.26 29% | 5.1 15% | 3.81 36% | 4.5 25% | 3.6 40% |
| Idle Maximum * | 6.2 | 5.5 11% | 5.7 8% | 5.4 13% | 4.33 30% | 6 3% | 3.92 37% | 5 19% | 3.9 37% |
| Load Average * | 14.5 | 10.9 25% | 10.7 26% | 7.9 46% | 9.82 32% | 14.7 -1% | 5.94 59% | 9.4 35% | 6.8 53% |
| Load Maximum * | 11.2 | 11.1 1% | 12.2 -9% | 11.1 1% | 13.99 -25% | 5.94 47% | 10.4 7% | 8.4 25% |
* ... smaller is better
| Dell Venue 10 Pro 5056 32 Wh | Dell Venue 10 Pro 5055 32 Wh | Apple iPad Air 2 2014 28 Wh | Google Pixel C 34 Wh | Lenovo Thinkpad Tablet 10 2nd Gen 32 Wh | Amazon Fire HD 10 inch 2015 Wh | Lenovo Yoga Tab 3 Pro 10 YT3-X90L 23 Wh | Asus Transformer Book T100HA-C4-GR 30 Wh | Samsung Galaxy Tab S2 9.7 LTE 22 Wh | Samsung Galaxy Tab A 9.7 SM-T555 Wh | |
|---|---|---|---|---|---|---|---|---|---|---|
| Battery Runtime | -25% | 29% | 73% | 17% | 16% | 43% | 36% | 20% | 125% | |
| Reader / Idle | 867 | 675 -22% | 1364 57% | 2090 141% | 866 0% | 1142 32% | 1261 45% | 1460 68% | 918 6% | 2950 240% |
| H.264 | 445 | 562 26% | 740 66% | 545 22% | 624 40% | 644 45% | 651 46% | |||
| WiFi v1.3 | 451 | 638 41% | 448 -1% | 450 0% | 558 24% | 541 20% | 393 -13% | 862 91% | ||
| Load | 205 | 150 -27% | 212 3% | 294 43% | 298 45% | 188 -8% | 323 58% | 246 20% | 291 42% | 297 45% |
| WiFi | 250 | 630 |
Pros
Cons
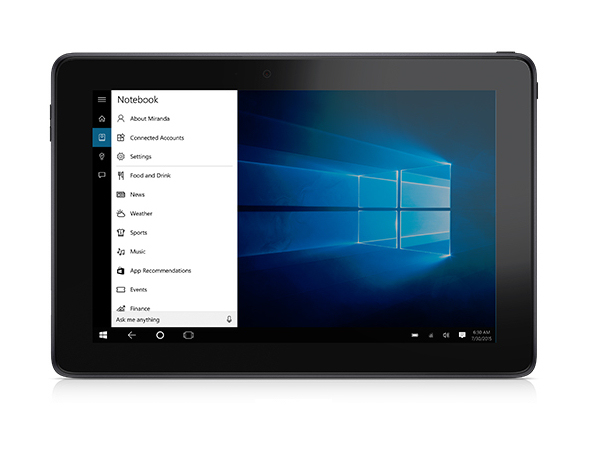
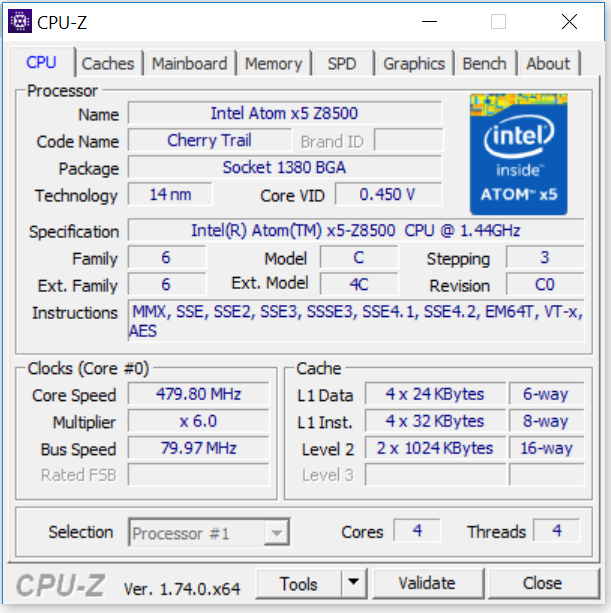
戴尔的Venue 10 Pro是一台优秀的10.1寸Windows平板电脑。和其它所有的Windows平板相似的是,Venue可以允许用户安装普通电脑程序。它的处理器可以满足简单任务如文字处理和上网浏览的需要。128GB的eMMC闪存提供了足够的存储空间。我们也很喜欢它明亮高对比度的IPS屏幕,不过Venue 10 Pro 5055相比还更亮一些。它的电池续航也十分不错。
平淡的设计毫无疑问说明它是台商务设备。662克的重量相对笨重。加上可选的键盘底座,Venue达到了近1300克的重量,几乎和一些同尺寸上网本或亚笔记本电脑相同了。
而800欧元(约5689人民币)的起售价让Venue 10 Pro也不能算是实惠。
对于普通家庭用户来说,Venue不能算是个诱人的选择。即使是入门型号的530欧元(约3906人民币)售价也不算便宜。上网本或者消费级平板应该是更实惠的选择。
注:本文是基于完整评测的缩减版本,阅读完整的英文评测,请点击这里。
Dell Venue 10 Pro 5056
-
04/18/2016 v5.1(old)
Sascha Mölck
Pricecompare
