 Deutsch
 English
 Español
 Français
 Italiano
 Nederlands
 Polski
 Português
 Русский
 Türkçe
 Svenska
 Chinese
 Magyar
Trekstor SurfTab duo W3 变形本简短评测

| |||||||||||||||||||||||||
Brightness Distribution: 80 %
Center on Battery: 212 cd/m²
Contrast: 1028:1 (Black: 0.25 cd/m²)
ΔE Color 7.98 | 0.5-29.43 Ø5
ΔE Greyscale 7.87 | 0.57-98 Ø5.3
84% sRGB (Argyll 1.6.3 3D)
55% AdobeRGB 1998 (Argyll 1.6.3 3D)
61.3% AdobeRGB 1998 (Argyll 2.2.0 3D)
83.9% sRGB (Argyll 2.2.0 3D)
63% Display P3 (Argyll 2.2.0 3D)
Gamma: 2.3
| Trekstor SurfTab duo W3 IPS, 1920x1080, 11.60 | Medion Akoya E2215T IPS, 1920x1080, 11.60 | HP x360 310 G1 TN, 1366x768, 11.60 | Acer Switch V 10 SW5-017-196Q IPS, 1280x800, 10.10 | HP x2 210 G1 IPS, 1280x800, 10.10 | Lenovo IdeaPad MIIX 310-10ICR IPS, 1280x800, 10.10 | |
|---|---|---|---|---|---|---|
| Display | -19% | -37% | -13% | -28% | -14% | |
| Display P3 Coverage | 63 | 48.12 -24% | 37.47 -41% | 52.5 -17% | 42.77 -32% | 51.1 -19% |
| sRGB Coverage | 83.9 | 71.7 -15% | 56.4 -33% | 76.3 -9% | 63.7 -24% | 75.2 -10% |
| AdobeRGB 1998 Coverage | 61.3 | 49.78 -19% | 38.71 -37% | 54.1 -12% | 44.22 -28% | 52.7 -14% |
| Response Times | -7% | -21% | -2% | -21% | -5% | |
| Response Time Grey 50% / Grey 80% * | 37 ? | 31 ? 16% | 43 ? -16% | 29 ? 22% | 43 ? -16% | 31.6 ? 15% |
| Response Time Black / White * | 20 ? | 26 ? -30% | 25 ? -25% | 25 ? -25% | 25 ? -25% | 24.8 ? -24% |
| PWM Frequency | 50 ? | 396 ? | 877 ? | 50 ? | 69.4 | |
| Screen | 9% | -59% | 16% | 8% | -4% | |
| Brightness middle | 257 | 338 32% | 199 -23% | 270 5% | 313 22% | 251.9 -2% |
| Brightness | 235 | 309 31% | 186 -21% | 239 2% | 295 26% | 233 -1% |
| Brightness Distribution | 80 | 76 -5% | 76 -5% | 82 3% | 84 5% | 83 4% |
| Black Level * | 0.25 | 0.39 -56% | 0.8 -220% | 0.21 16% | 0.21 16% | 0.348 -39% |
| Contrast | 1028 | 867 -16% | 249 -76% | 1286 25% | 1490 45% | 724 -30% |
| Colorchecker dE 2000 * | 7.98 | 3.94 51% | 11.92 -49% | 3.01 62% | 6.79 15% | 6.35 20% |
| Colorchecker dE 2000 max. * | 12.25 | 9.96 19% | 20.52 -68% | 4.63 62% | 14.11 -15% | 11.15 9% |
| Greyscale dE 2000 * | 7.87 | 2.54 68% | 12.92 -64% | 7.66 3% | 6.78 14% | 7.09 10% |
| Gamma | 2.3 96% | 2.38 92% | 2.04 108% | 1.45 152% | 2.26 97% | 2.02 109% |
| CCT | 8815 74% | 6902 94% | 13589 48% | 6665 98% | 6708 97% | 8590 76% |
| Color Space (Percent of AdobeRGB 1998) | 55 | 46 -16% | 36 -35% | 49 -11% | 41 -25% | 52.69 -4% |
| Color Space (Percent of sRGB) | 84 | 71 -15% | 56 -33% | 76 -10% | 63 -25% | |
| Total Average (Program / Settings) | -6% /
1% | -39% /
-50% | 0% /
8% | -14% /
-3% | -8% /
-6% |
* ... smaller is better
Screen Flickering / PWM (Pulse-Width Modulation)
| Screen flickering / PWM not detected | ||
In comparison: 53 % of all tested devices do not use PWM to dim the display. If PWM was detected, an average of 17900 (minimum: 5 - maximum: 3846000) Hz was measured. | ||
Display Response Times
| ↔ Response Time Black to White | ||
|---|---|---|
| 20 ms ... rise ↗ and fall ↘ combined | ↗ 6 ms rise |  |
| ↘ 14 ms fall | ||
| The screen shows good response rates in our tests, but may be too slow for competitive gamers. In comparison, all tested devices range from 0.1 (minimum) to 240 (maximum) ms. » 37 % of all devices are better. This means that the measured response time is similar to the average of all tested devices (21.5 ms). | ||
| ↔ Response Time 50% Grey to 80% Grey | ||
| 37 ms ... rise ↗ and fall ↘ combined | ↗ 16 ms rise | 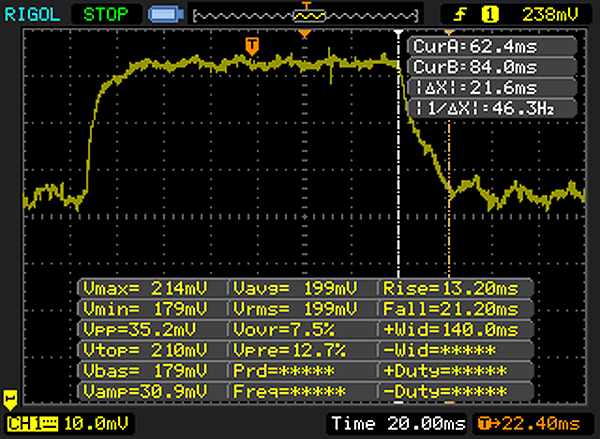 |
| ↘ 21 ms fall | ||
| The screen shows slow response rates in our tests and will be unsatisfactory for gamers. In comparison, all tested devices range from 0.2 (minimum) to 636 (maximum) ms. » 47 % of all devices are better. This means that the measured response time is similar to the average of all tested devices (33.7 ms). | ||
| Cinebench R10 | |
| Rendering Multiple CPUs 32Bit | |
| Acer Switch V 10 SW5-017-196Q | |
| Trekstor SurfTab duo W3 | |
| Medion Akoya E2215T | |
| Lenovo IdeaPad MIIX 310-10ICR | |
| HP x2 210 G1 | |
| Rendering Single 32Bit | |
| Acer Switch V 10 SW5-017-196Q | |
| Trekstor SurfTab duo W3 | |
| Medion Akoya E2215T | |
| Lenovo IdeaPad MIIX 310-10ICR | |
| HP x2 210 G1 | |
| Geekbench 3 | |
| 32 Bit Single-Core Score | |
| Acer Switch V 10 SW5-017-196Q | |
| Trekstor SurfTab duo W3 | |
| Medion Akoya E2215T | |
| 32 Bit Multi-Core Score | |
| Acer Switch V 10 SW5-017-196Q | |
| Trekstor SurfTab duo W3 | |
| Medion Akoya E2215T | |
| Sunspider - 1.0 Total Score | |
| HP x2 210 G1 | |
| Trekstor SurfTab duo W3 | |
| JetStream 1.1 - Total Score | |
| Acer Switch V 10 SW5-017-196Q | |
| HP x2 210 G1 | |
| Medion Akoya E2215T | |
| Trekstor SurfTab duo W3 | |
| Mozilla Kraken 1.1 - Total | |
| Lenovo IdeaPad MIIX 310-10ICR | |
| Trekstor SurfTab duo W3 | |
| Medion Akoya E2215T | |
| Octane V2 - Total Score | |
| Medion Akoya E2215T | |
| Trekstor SurfTab duo W3 | |
| Lenovo IdeaPad MIIX 310-10ICR | |
* ... smaller is better
| PCMark 8 Home Score Accelerated v2 | 1246 points | |
Help | ||
| PCMark 8 - Home Score Accelerated v2 | |
| Acer Switch V 10 SW5-017-196Q | |
| HP x360 310 G1 | |
| Lenovo IdeaPad MIIX 310-10ICR | |
| HP x2 210 G1 | |
| Medion Akoya E2215T | |
| Trekstor SurfTab duo W3 | |

| Trekstor SurfTab duo W3 32 GB eMMC Flash | Medion Akoya E2215T 64 GB eMMC Flash | HP x360 310 G1 Toshiba MQ01ABF050 | Acer Switch V 10 SW5-017-196Q 64 GB eMMC Flash | HP x2 210 G1 64 GB eMMC Flash | Lenovo IdeaPad MIIX 310-10ICR 64 GB eMMC Flash | |
|---|---|---|---|---|---|---|
| CrystalDiskMark 3.0 | 157% | -25% | 475% | 241% | 266% | |
| Read Seq | 142.8 | 169.6 19% | 99.5 -30% | 153.9 8% | 134.1 -6% | 151.9 6% |
| Write Seq | 44.24 | 39.77 -10% | 102.9 133% | 101.1 129% | 66.1 49% | 87.3 97% |
| Read 512 | 125.4 | 155.3 24% | 34.45 -73% | 136.2 9% | 112.9 -10% | 144.5 15% |
| Write 512 | 16.9 | 27.45 62% | 42.7 153% | 91.5 441% | 57.7 241% | 58 243% |
| Read 4k | 7.82 | 13.09 67% | 0.439 -94% | 12.58 61% | 15.79 102% | 9.35 20% |
| Write 4k | 1.423 | 7.915 456% | 0.013 -99% | 12.38 770% | 10.06 607% | 12.26 762% |
| Read 4k QD32 | 11.04 | 15.11 37% | 0.851 -92% | 23.81 116% | 35.31 220% | 29 163% |
| Write 4k QD32 | 1.435 | 10.05 600% | 0.033 -98% | 33.93 2264% | 11.84 725% | 13.18 818% |
| 3DMark 11 Performance | 322 points | |
Help | ||
| 3DMark 11 - 1280x720 Performance GPU | |
| Acer Switch V 10 SW5-017-196Q | |
| Lenovo IdeaPad MIIX 310-10ICR | |
| Medion Akoya E2215T | |
| Trekstor SurfTab duo W3 | |
| HP x2 210 G1 | |
| HP x360 310 G1 | |
| low | med. | high | ultra | |
| Trackmania Nations Forever (2008) | 92.6 | 21.3 | 9.6 |
(+) The maximum temperature on the upper side is 37.6 °C / 100 F, compared to the average of 35.3 °C / 96 F, ranging from 19.6 to 55.7 °C for the class Convertible.
(+) The bottom heats up to a maximum of 37.8 °C / 100 F, compared to the average of 36.8 °C / 98 F
(+) In idle usage, the average temperature for the upper side is 27.6 °C / 82 F, compared to the device average of 30.2 °C / 86 F.
(+) The palmrests and touchpad are cooler than skin temperature with a maximum of 31.6 °C / 88.9 F and are therefore cool to the touch.
(-) The average temperature of the palmrest area of similar devices was 28.1 °C / 82.6 F (-3.5 °C / -6.3 F).
Trekstor SurfTab duo W3 audio analysis
(±) | speaker loudness is average but good (78 dB)
Bass 100 - 315 Hz
(-) | nearly no bass - on average 31.3% lower than median
(+) | bass is linear (2.6% delta to prev. frequency)
Mids 400 - 2000 Hz
(±) | reduced mids - on average 7.8% lower than median
(±) | linearity of mids is average (14.1% delta to prev. frequency)
Highs 2 - 16 kHz
(±) | higher highs - on average 8% higher than median
(±) | linearity of highs is average (11.4% delta to prev. frequency)
Overall 100 - 16.000 Hz
(-) | overall sound is not linear (33.4% difference to median)
Compared to same class
» 92% of all tested devices in this class were better, 2% similar, 6% worse
» The best had a delta of 6%, average was 21%, worst was 57%
Compared to all devices tested
» 91% of all tested devices were better, 2% similar, 8% worse
» The best had a delta of 4%, average was 25%, worst was 134%
Apple MacBook 12 (Early 2016) 1.1 GHz audio analysis
(+) | speakers can play relatively loud (83.6 dB)
Bass 100 - 315 Hz
(±) | reduced bass - on average 11.3% lower than median
(±) | linearity of bass is average (14.2% delta to prev. frequency)
Mids 400 - 2000 Hz
(+) | balanced mids - only 2.4% away from median
(+) | mids are linear (5.5% delta to prev. frequency)
Highs 2 - 16 kHz
(+) | balanced highs - only 2% away from median
(+) | highs are linear (4.5% delta to prev. frequency)
Overall 100 - 16.000 Hz
(+) | overall sound is linear (10.2% difference to median)
Compared to same class
» 5% of all tested devices in this class were better, 2% similar, 93% worse
» The best had a delta of 5%, average was 19%, worst was 53%
Compared to all devices tested
» 3% of all tested devices were better, 1% similar, 96% worse
» The best had a delta of 4%, average was 25%, worst was 134%
| Off / Standby | |
| Idle | |
| Load |
|
| Battery Runtime - WiFi Websurfing | |
| HP x360 310 G1 | |
| Lenovo IdeaPad MIIX 310-10ICR | |
| HP x2 210 G1 | |
| Acer Switch V 10 SW5-017-196Q | |
| Medion Akoya E2215T | |
| Trekstor SurfTab duo W3 | |
Pros
Cons
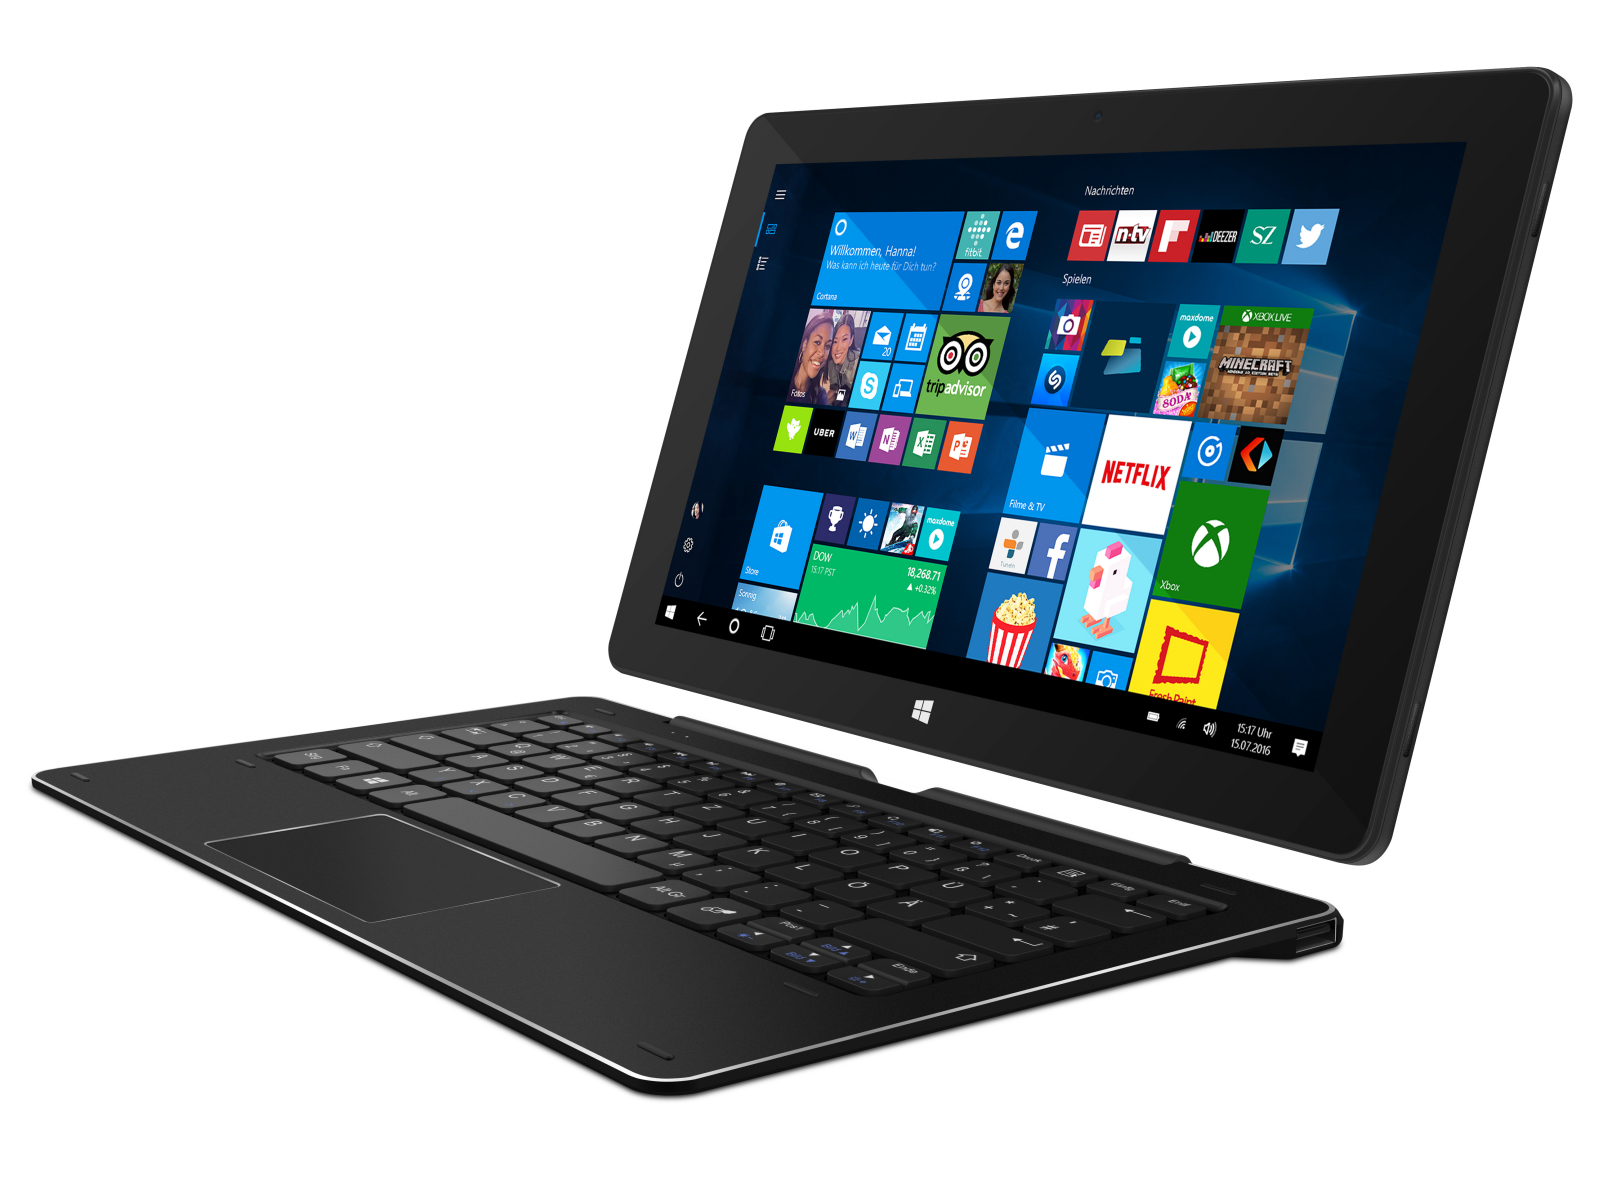
Trekstor的SurfTab Duo W3是一款11.6英寸的Windows变形本,为基础办公与了网络应用而设计。这款设备运行时几乎不会发热且安静。然而,有一种从内部发出的电流声时常可以听见。这款设备并没有超大的存储空间。在32GB的机身存储中,仅有17.6GB可用。由于Windows 10在大的系统更新时需要10GB的空闲内存,所以7GB是实际可用最大存储空间大小。
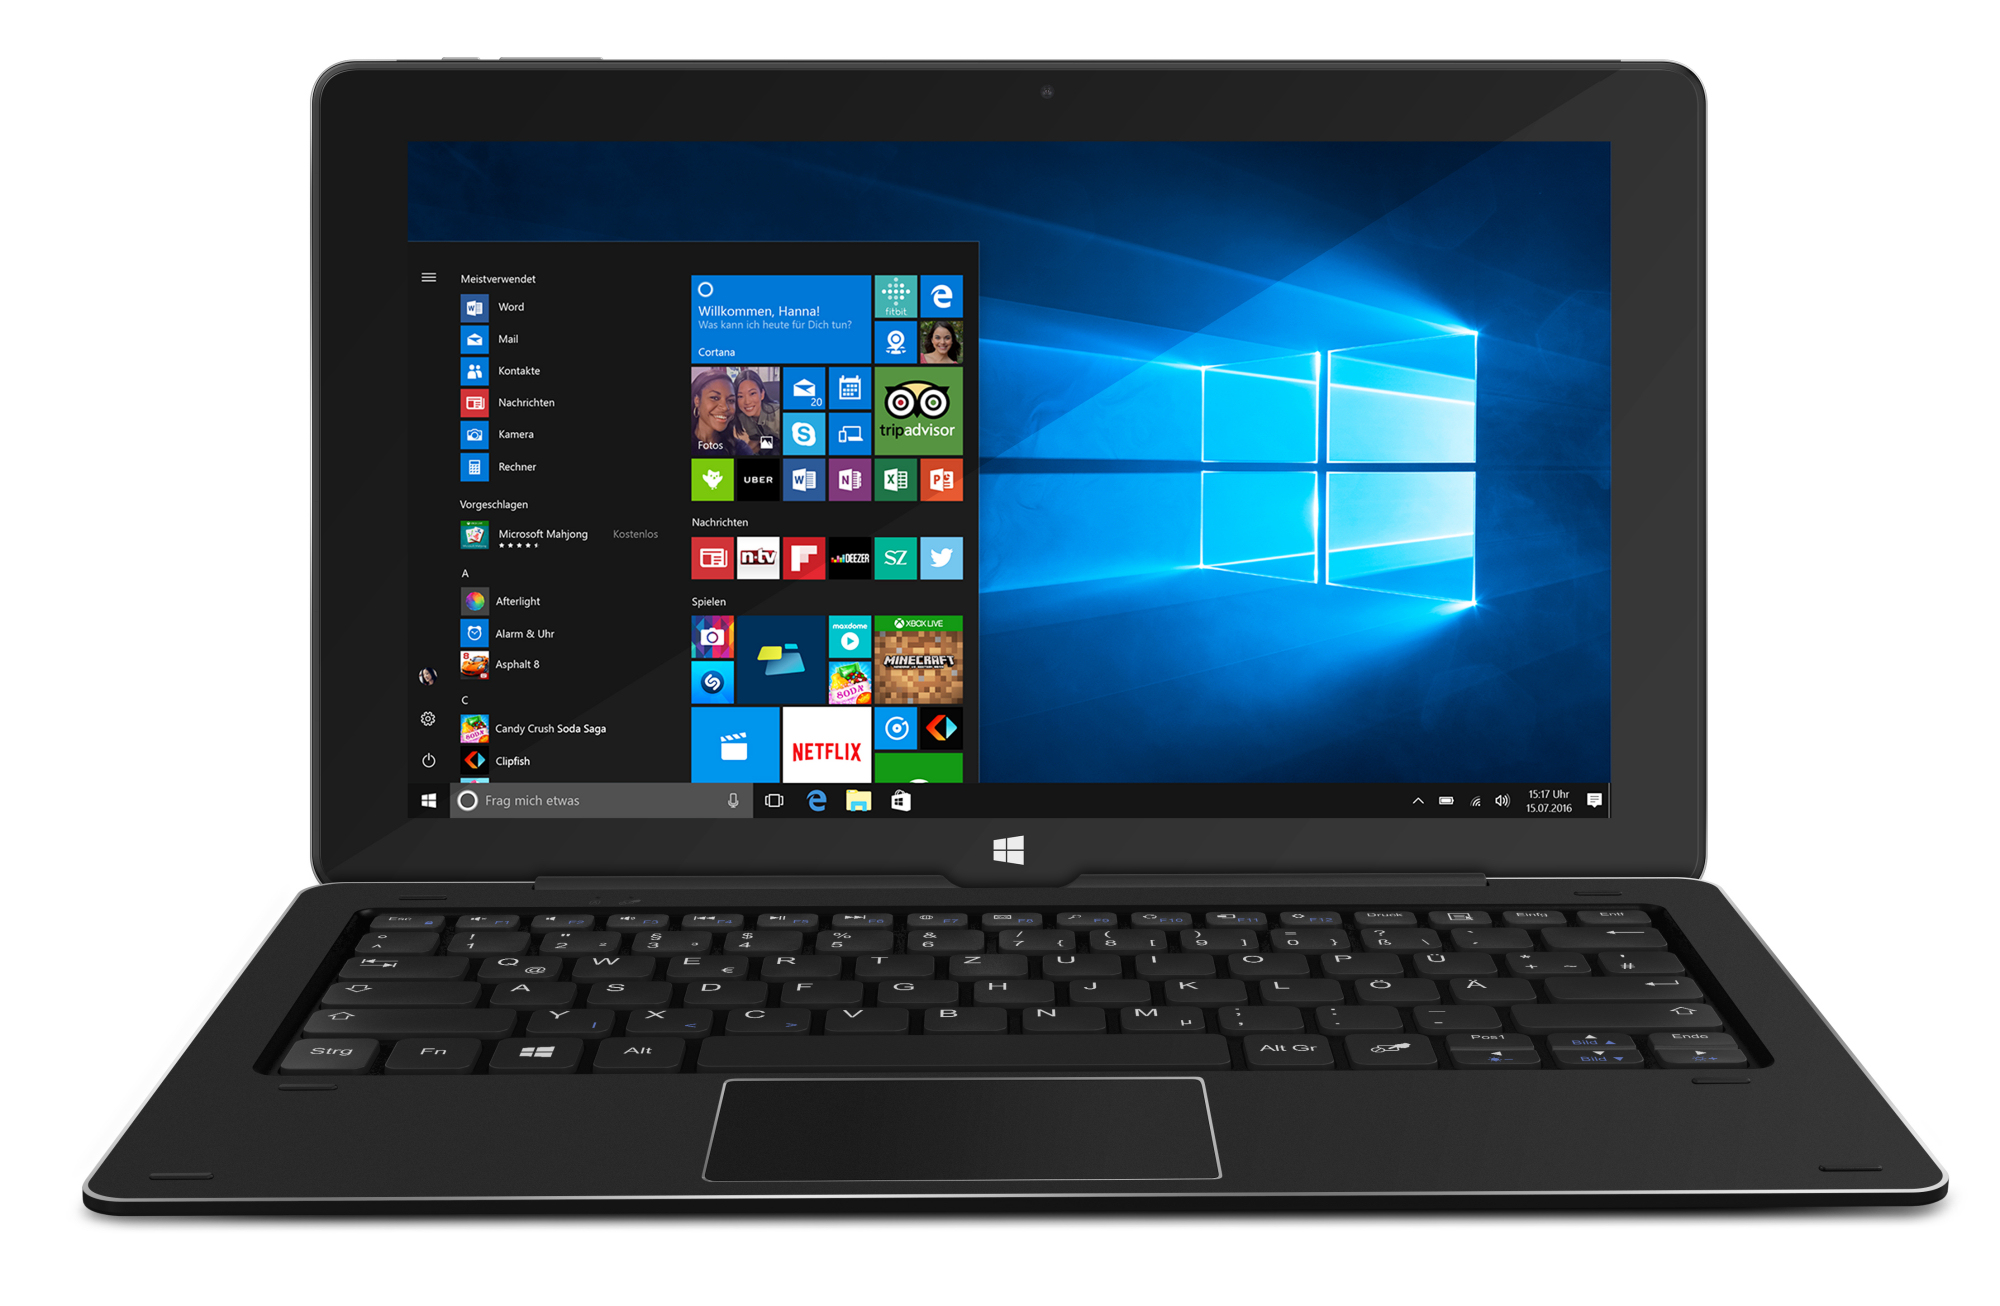
键盘扩展坞整体上给我们留下了很好的印象。键盘本身很合适频繁的打字操作。Trekstor可能在它的产品线上为小学生和其他学生提供了一台用于打字和浏览网页的设备。但很不幸的是它在很关键的一个项目上表现得并不好:电池续航能力。这台变形本在Wi-Fi测试中仅有不到5小时的续航时间,这对于一整天在学校或大学的使用来说太短了。但在另一方面,屏幕的广视角及高对比度令我们满意,虽然亮度过低。
Trekstor SurfTab Duo W3 是一台廉价的11.6英寸家用变形本。
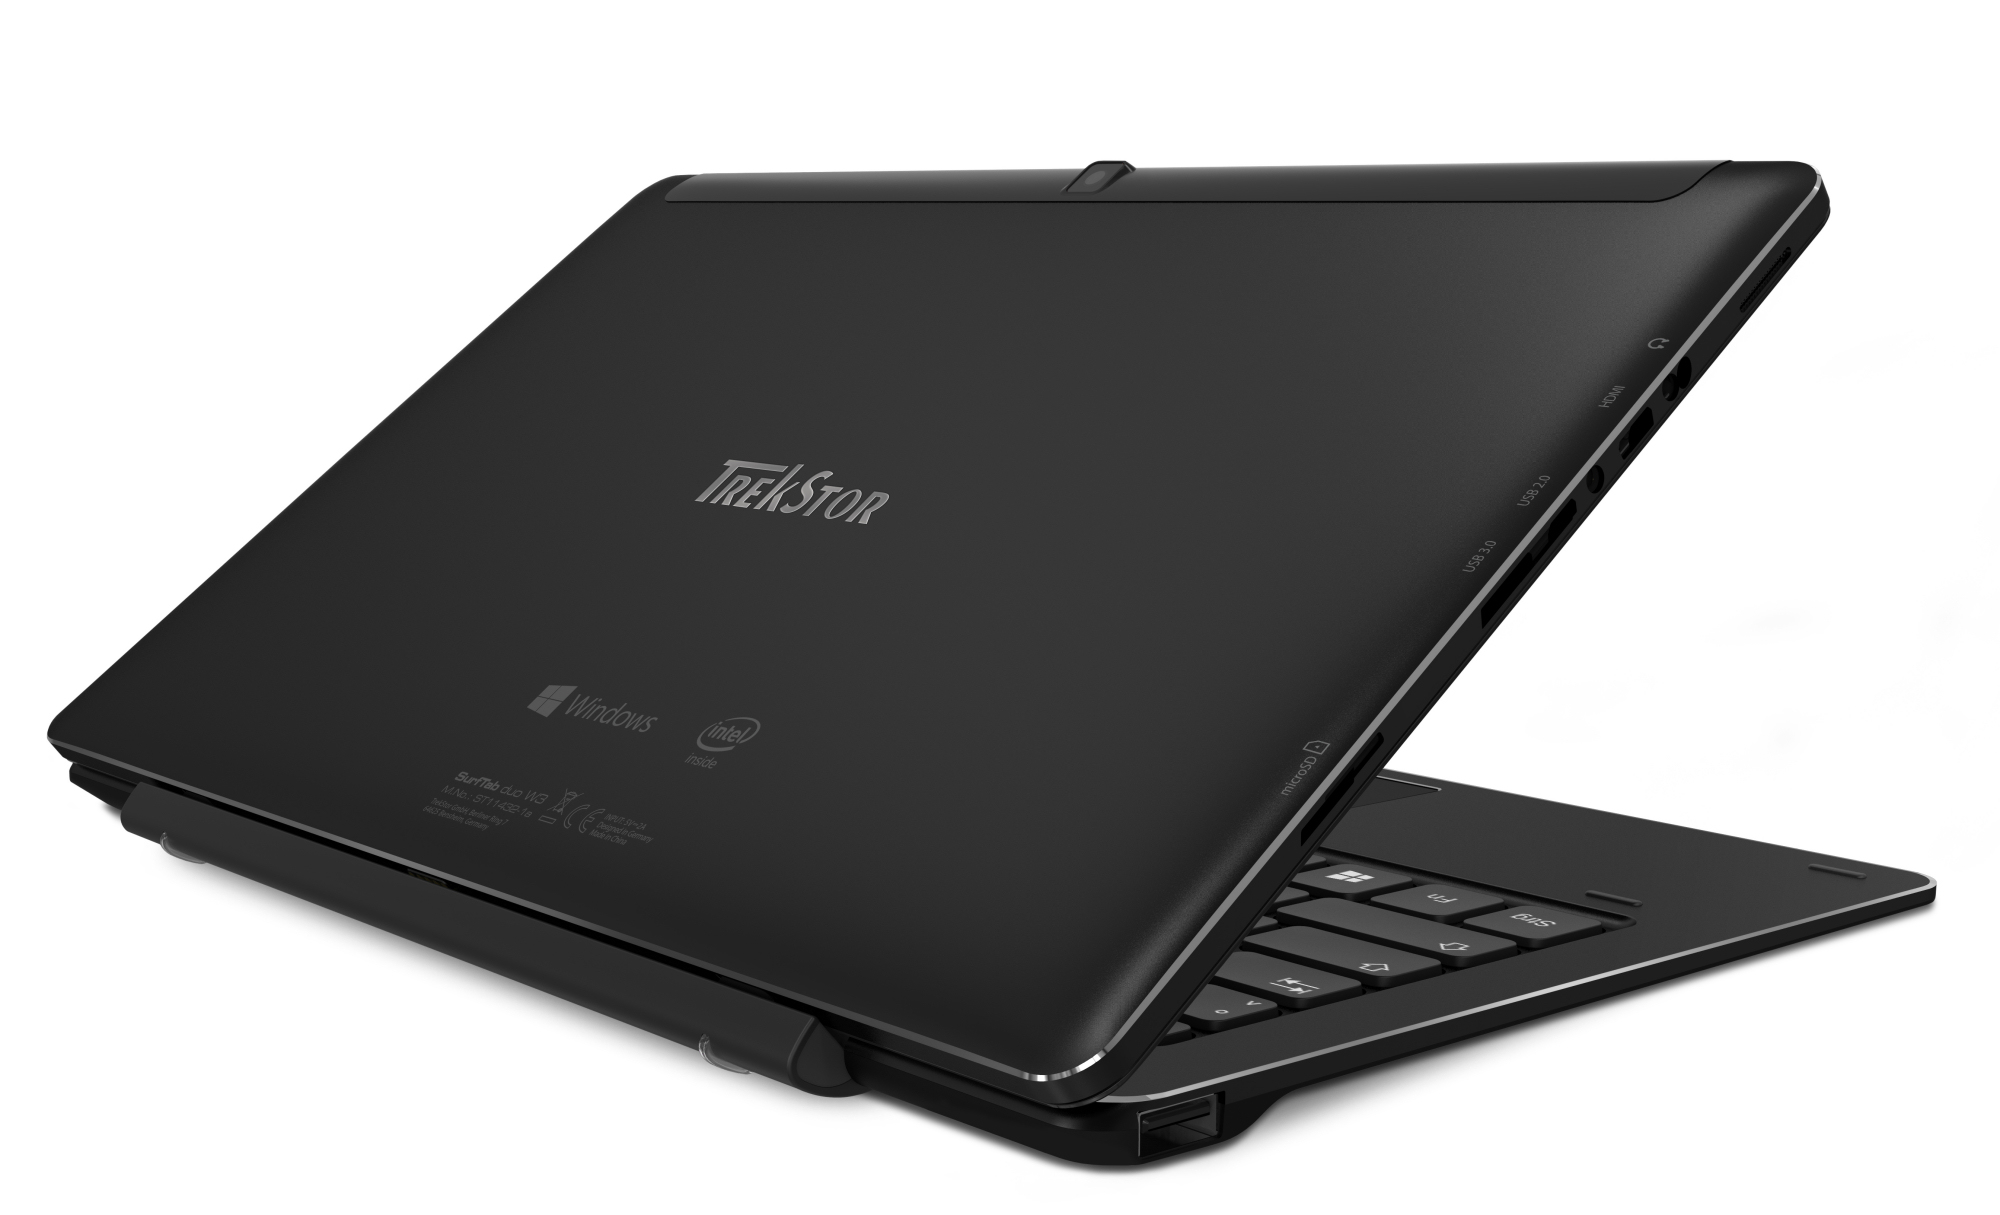
但是,Trestore也犯了一些即使在这个低廉价位也不应该出现的失误。首先是不可靠的micro-USB 3.0接口并不能确保稳定的连接。制造商应该一开始就使用Type-C型USB接口。但无论如何Trekstor都会需要附带一个转接头。再者,它的充电耗时过长。
注:本文是基于完整评测的缩减版本,阅读完整的英文评测,请点击这里。
Trekstor SurfTab duo W3
-
01/27/2017 v6(old)
Sascha Mölck