 Deutsch
 English
 Español
 Français
 Italiano
 Nederlands
 Polski
 Português
 Русский
 Türkçe
 Svenska
 Chinese
 Magyar
华硕 Transformer 3 Pro T303UA-GN050T 变形本简短评测


| |||||||||||||||||||||||||
Brightness Distribution: 91 %
Center on Battery: 316 cd/m²
Contrast: 1090:1 (Black: 0.29 cd/m²)
ΔE Color 3.91 | 0.5-29.43 Ø5
ΔE Greyscale 5.37 | 0.57-98 Ø5.3
98% sRGB (Argyll 1.6.3 3D)
72% AdobeRGB 1998 (Argyll 1.6.3 3D)
82.2% AdobeRGB 1998 (Argyll 2.2.0 3D)
98.3% sRGB (Argyll 2.2.0 3D)
81.8% Display P3 (Argyll 2.2.0 3D)
Gamma: 2.36
| Asus Transformer 3 Pro T303UA-GN050T BOE BOE06AC (NV126A1M-N51), , 2880x1920, 12.60 | Microsoft Surface Pro 4, Core m3 Samsung SDC3853, , 2736x1824, 12.30 | Lenovo ThinkPad X1 Yoga-20FRS1VS00 Samsung ATNA40JU01-0, , 2560x1440, 14.00 | HP Elite x2 1012 G1 LG Philips, , 1920x1280, 12.10 | Acer Aspire Switch Alpha 12 SA5-271-56HM Panasonic VVX12T041N00, , 2160x1440, 12.00 | |
|---|---|---|---|---|---|
| Display | -12% | -31% | -14% | ||
| Display P3 Coverage | 81.8 | 67.5 -17% | 53.8 -34% | 65.5 -20% | |
| sRGB Coverage | 98.3 | 96.6 -2% | 73.7 -25% | 96.1 -2% | |
| AdobeRGB 1998 Coverage | 82.2 | 69 -16% | 53.8 -35% | 66.9 -19% | |
| Response Times | -45% | 71% | 5% | 139% | |
| Response Time Grey 50% / Grey 80% * | 30 ? | 46 ? -53% | 1 ? 97% | 33.2 ? -11% | 20 ? 33% |
| Response Time Black / White * | 29 ? | 31 ? -7% | 1 ? 97% | 22.8 ? 21% | 34 ? -17% |
| PWM Frequency | 200 ? | 50 ? -75% | 240 ? 20% | 1000 ? 400% | |
| Screen | 13% | -3% | -22% | -21% | |
| Brightness middle | 316 | 389.2 23% | 279 -12% | 322 2% | 345 9% |
| Brightness | 307 | 392 28% | 277 -10% | 319 4% | 328 7% |
| Brightness Distribution | 91 | 92 1% | 91 0% | 97 7% | 91 0% |
| Black Level * | 0.29 | 0.27 7% | 0.42 -45% | 0.38 -31% | |
| Contrast | 1090 | 1441 32% | 767 -30% | 908 -17% | |
| Colorchecker dE 2000 * | 3.91 | 3.61 8% | 5.15 -32% | 6.02 -54% | 8.4 -115% |
| Colorchecker dE 2000 max. * | 7.9 | 8.28 -5% | 10.06 -27% | 11.9 -51% | |
| Greyscale dE 2000 * | 5.37 | 3.8 29% | 5.44 -1% | 6.29 -17% | 4.3 20% |
| Gamma | 2.36 93% | 2.16 102% | 2.28 96% | 2.4 92% | 2.63 84% |
| CCT | 7812 83% | 5969 109% | 5686 114% | 7712 84% | 7368 88% |
| Color Space (Percent of AdobeRGB 1998) | 72 | 63 -12% | 98 36% | 47.8 -34% | 62 -14% |
| Color Space (Percent of sRGB) | 98 | 97 -1% | 100 2% | 73.2 -25% | |
| Total Average (Program / Settings) | -15% /
-4% | 34% /
17% | -16% /
-20% | 35% /
12% |
* ... smaller is better
Display Response Times
| ↔ Response Time Black to White | ||
|---|---|---|
| 29 ms ... rise ↗ and fall ↘ combined | ↗ 8 ms rise | 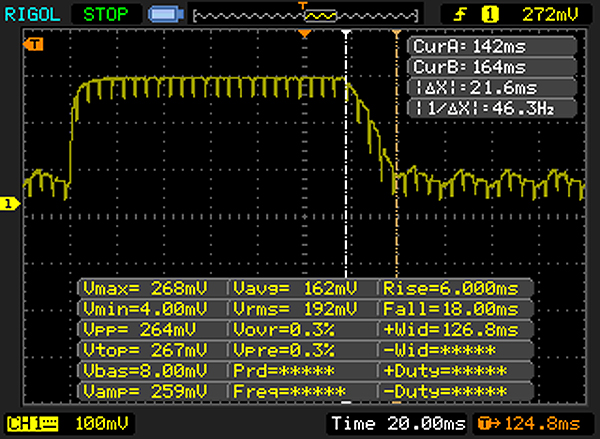 |
| ↘ 21 ms fall | ||
| The screen shows relatively slow response rates in our tests and may be too slow for gamers. In comparison, all tested devices range from 0.1 (minimum) to 240 (maximum) ms. » 73 % of all devices are better. This means that the measured response time is worse than the average of all tested devices (21.5 ms). | ||
| ↔ Response Time 50% Grey to 80% Grey | ||
| 30 ms ... rise ↗ and fall ↘ combined | ↗ 14 ms rise |  |
| ↘ 16 ms fall | ||
| The screen shows slow response rates in our tests and will be unsatisfactory for gamers. In comparison, all tested devices range from 0.2 (minimum) to 636 (maximum) ms. » 34 % of all devices are better. This means that the measured response time is better than the average of all tested devices (33.7 ms). | ||
Screen Flickering / PWM (Pulse-Width Modulation)
| Screen flickering / PWM detected | 200 Hz | ≤ 90 % brightness setting | 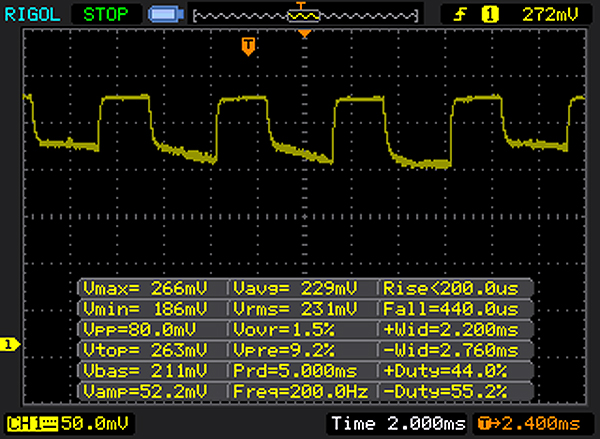 |
The display backlight flickers at 200 Hz (worst case, e.g., utilizing PWM) Flickering detected at a brightness setting of 90 % and below. There should be no flickering or PWM above this brightness setting. The frequency of 200 Hz is relatively low, so sensitive users will likely notice flickering and experience eyestrain at the stated brightness setting and below. In comparison: 53 % of all tested devices do not use PWM to dim the display. If PWM was detected, an average of 17900 (minimum: 5 - maximum: 3846000) Hz was measured. | |||
| Cinebench R15 | |
| CPU Single 64Bit | |
| Lenovo ThinkPad X1 Yoga-20FRS1VS00 | |
| Asus Transformer 3 Pro T303UA-GN050T | |
| Acer Aspire Switch Alpha 12 SA5-271-56HM | |
| HP Elite x2 1012 G1 | |
| Microsoft Surface Pro 4, Core m3 | |
| CPU Multi 64Bit | |
| Lenovo ThinkPad X1 Yoga-20FRS1VS00 | |
| Acer Aspire Switch Alpha 12 SA5-271-56HM | |
| HP Elite x2 1012 G1 | |
| Asus Transformer 3 Pro T303UA-GN050T | |
| Microsoft Surface Pro 4, Core m3 | |
| Cinebench R11.5 | |
| CPU Single 64Bit | |
| Lenovo ThinkPad X1 Yoga-20FRS1VS00 | |
| Asus Transformer 3 Pro T303UA-GN050T | |
| HP Elite x2 1012 G1 | |
| Microsoft Surface Pro 4, Core m3 | |
| CPU Multi 64Bit | |
| Lenovo ThinkPad X1 Yoga-20FRS1VS00 | |
| HP Elite x2 1012 G1 | |
| Asus Transformer 3 Pro T303UA-GN050T | |
| Microsoft Surface Pro 4, Core m3 | |
| Cinebench R10 | |
| Rendering Single CPUs 64Bit | |
| Asus Transformer 3 Pro T303UA-GN050T | |
| Microsoft Surface Pro 4, Core m3 | |
| Rendering Multiple CPUs 64Bit | |
| Asus Transformer 3 Pro T303UA-GN050T | |
| Microsoft Surface Pro 4, Core m3 | |
| JetStream 1.1 - Total Score | |
| Asus Transformer 3 Pro T303UA-GN050T | |
| Lenovo ThinkPad X1 Yoga-20FRS1VS00 | |
| HP Elite x2 1012 G1 | |
| Acer Aspire Switch Alpha 12 SA5-271-56HM | |
| Octane V2 - Total Score | |
| Lenovo ThinkPad X1 Yoga-20FRS1VS00 | |
| Asus Transformer 3 Pro T303UA-GN050T | |
| HP Elite x2 1012 G1 | |
| Acer Aspire Switch Alpha 12 SA5-271-56HM | |
| Mozilla Kraken 1.1 - Total | |
| Microsoft Surface Pro 4, Core m3 | |
| Acer Aspire Switch Alpha 12 SA5-271-56HM | |
| HP Elite x2 1012 G1 | |
| Asus Transformer 3 Pro T303UA-GN050T | |
| Lenovo ThinkPad X1 Yoga-20FRS1VS00 | |
* ... smaller is better
| PCMark 8 | |
| Home Score Accelerated v2 | |
| Lenovo ThinkPad X1 Yoga-20FRS1VS00 | |
| Acer Aspire Switch Alpha 12 SA5-271-56HM | |
| Asus Transformer 3 Pro T303UA-GN050T | |
| HP Elite x2 1012 G1 | |
| Microsoft Surface Pro 4, Core m3 | |
| Work Score Accelerated v2 | |
| Lenovo ThinkPad X1 Yoga-20FRS1VS00 | |
| Acer Aspire Switch Alpha 12 SA5-271-56HM | |
| HP Elite x2 1012 G1 | |
| Asus Transformer 3 Pro T303UA-GN050T | |
| Microsoft Surface Pro 4, Core m3 | |
| Creative Score Accelerated v2 | |
| Asus Transformer 3 Pro T303UA-GN050T | |
| HP Elite x2 1012 G1 | |
| Microsoft Surface Pro 4, Core m3 | |
| PCMark 7 | |
| Score | |
| Asus Transformer 3 Pro T303UA-GN050T | |
| HP Elite x2 1012 G1 | |
| Microsoft Surface Pro 4, Core m3 | |
| Productivity | |
| HP Elite x2 1012 G1 | |
| Asus Transformer 3 Pro T303UA-GN050T | |
| PCMark Vantage Result | 13886 points | |
| PCMark 7 Score | 5152 points | |
| PCMark 8 Home Score Accelerated v2 | 2985 points | |
| PCMark 8 Creative Score Accelerated v2 | 4043 points | |
| PCMark 8 Work Score Accelerated v2 | 3830 points | |
Help | ||
| Asus Transformer 3 Pro T303UA-GN050T SK Hynix Canvas SC300 512GB M.2 (HFS512G39MND) | Microsoft Surface Pro 4, Core m3 Samsung MZFLV128 NVMe | Lenovo ThinkPad X1 Yoga-20FRS1VS00 Samsung SSD PM961 1TB M.2 PCIe 3.0 x4 NVMe (MZSLW1T0) | HP Elite x2 1012 G1 Liteon L8H-256V2G | Acer Aspire Switch Alpha 12 SA5-271-56HM Kingston RBU-SNS8152S3256GG2 | |
|---|---|---|---|---|---|
| CrystalDiskMark 3.0 | -7% | 121% | 12% | 0% | |
| Read Seq | 398.9 | 663 66% | 1510 279% | 501 26% | 518 30% |
| Write Seq | 402 | 158.2 -61% | 1193 197% | 297.2 -26% | 199.9 -50% |
| Read 512 | 303.1 | 313.1 3% | 351.7 16% | 374.9 24% | |
| Write 512 | 320.3 | 158.2 -51% | 295.7 -8% | 201 -37% | |
| Read 4k | 26.11 | 30.14 15% | 37 42% | 28.31 8% | 29.3 12% |
| Write 4k | 57.7 | 68 18% | 126 118% | 90.3 56% | 76.8 33% |
| Read 4k QD32 | 245.8 | 243.7 -1% | 404 64% | 285 16% | 272 11% |
| Write 4k QD32 | 253.8 | 149.2 -41% | 319 26% | 268.4 6% | 197.1 -22% |

| 3DMark | |
| 1280x720 Cloud Gate Standard Graphics | |
| Lenovo ThinkPad X1 Yoga-20FRS1VS00 | |
| Acer Aspire Switch Alpha 12 SA5-271-56HM | |
| Microsoft Surface Pro 4, Core m3 | |
| HP Elite x2 1012 G1 | |
| Asus Transformer 3 Pro T303UA-GN050T | |
| 1920x1080 Fire Strike Graphics | |
| Lenovo ThinkPad X1 Yoga-20FRS1VS00 | |
| Microsoft Surface Pro 4, Core m3 | |
| HP Elite x2 1012 G1 | |
| Asus Transformer 3 Pro T303UA-GN050T | |
| 1280x720 Ice Storm Standard Score | |
| HP Elite x2 1012 G1 | |
| Microsoft Surface Pro 4, Core m3 | |
| Asus Transformer 3 Pro T303UA-GN050T | |
| 3DMark 11 | |
| 1280x720 Performance GPU | |
| Lenovo ThinkPad X1 Yoga-20FRS1VS00 | |
| Acer Aspire Switch Alpha 12 SA5-271-56HM | |
| Asus Transformer 3 Pro T303UA-GN050T | |
| Microsoft Surface Pro 4, Core m3 | |
| HP Elite x2 1012 G1 | |
| 1280x720 Performance | |
| Lenovo ThinkPad X1 Yoga-20FRS1VS00 | |
| Acer Aspire Switch Alpha 12 SA5-271-56HM | |
| Asus Transformer 3 Pro T303UA-GN050T | |
| Microsoft Surface Pro 4, Core m3 | |
| HP Elite x2 1012 G1 | |
| 3DMark 06 - 1280x1024 Standard Score AA:0x AF:0x | |
| HP Elite x2 1012 G1 | |
| Microsoft Surface Pro 4, Core m3 | |
| Asus Transformer 3 Pro T303UA-GN050T | |
| 3DMark 03 Standard | 20325 points | |
| 3DMark 05 Standard | 9082 points | |
| 3DMark 06 Standard Score | 7464 points | |
| 3DMark Vantage P Result | 4650 points | |
| 3DMark 11 Performance | 1381 points | |
| 3DMark Ice Storm Standard Score | 35293 points | |
| 3DMark Cloud Gate Standard Score | 4401 points | |
| 3DMark Fire Strike Score | 676 points | |
| 3DMark Fire Strike Extreme Score | 309 points | |
| 3DMark Time Spy Score | 297 points | |
Help | ||
| low | med. | high | ultra | |
| BioShock Infinite (2013) | 45.2 | 26.9 | 22.5 | 6.6 |
| Battlefield 4 (2013) | 31.3 | 23.2 | 15.9 | |
| Rise of the Tomb Raider (2016) | 20 | 11 | 9 |
| Asus Transformer 3 Pro T303UA-GN050T HD Graphics 520, 6500U, SK Hynix Canvas SC300 512GB M.2 (HFS512G39MND) | Microsoft Surface Pro 4 Core i7 Iris Graphics 540, 6650U, Samsung MZFLV256 NVMe | Lenovo ThinkPad X1 Yoga-20FRS1VS00 HD Graphics 520, 6600U, Samsung SSD PM961 1TB M.2 PCIe 3.0 x4 NVMe (MZSLW1T0) | Apple MacBook Pro 13 2016 (2.9 GHz) Iris Graphics 550, 6267U, Apple SSD AP0256 | Dell XPS 13 9360 QHD+ i5 HD Graphics 620, i5-7200U, Toshiba NVMe THNSN5256GPUK | |
|---|---|---|---|---|---|
| Noise | -0% | 4% | 4% | 1% | |
| off / environment * | 30.7 | 28.9 6% | 30.2 2% | 30.3 1% | |
| Idle Minimum * | 30.7 | 28.4 7% | 28.9 6% | 30.2 2% | 30.6 -0% |
| Idle Average * | 30.7 | 28.6 7% | 28.9 6% | 30.2 2% | 30.6 -0% |
| Idle Maximum * | 30.7 | 28.7 7% | 28.9 6% | 30.2 2% | 32.2 -5% |
| Load Average * | 37 | 40.8 -10% | 35.3 5% | 33 11% | 32.2 13% |
| Load Maximum * | 37.1 | 41.4 -12% | 38.9 -5% | 36.2 2% | 38.5 -4% |
* ... smaller is better
Noise Level
| Idle |
| 30.7 / 30.7 / 30.7 dB(A) |
| Load |
| 37 / 37.1 dB(A) |
 | ||
30 dB silent 40 dB(A) audible 50 dB(A) loud |
||
min: | ||
| Asus Transformer 3 Pro T303UA-GN050T HD Graphics 520, 6500U, SK Hynix Canvas SC300 512GB M.2 (HFS512G39MND) | Microsoft Surface Pro 4, Core m3 HD Graphics 515, 6Y30, Samsung MZFLV128 NVMe | Lenovo ThinkPad X1 Yoga-20FRS1VS00 HD Graphics 520, 6600U, Samsung SSD PM961 1TB M.2 PCIe 3.0 x4 NVMe (MZSLW1T0) | HP Elite x2 1012 G1 HD Graphics 515, 6Y54, Liteon L8H-256V2G | Acer Aspire Switch Alpha 12 SA5-271-56HM HD Graphics 520, 6200U, Kingston RBU-SNS8152S3256GG2 | |
|---|---|---|---|---|---|
| Heat | -8% | -12% | 1% | -11% | |
| Maximum Upper Side * | 34.9 | 43.6 -25% | 45.5 -30% | 39 -12% | 46.7 -34% |
| Maximum Bottom * | 36.7 | 45.2 -23% | 47.1 -28% | 41.2 -12% | 51 -39% |
| Idle Upper Side * | 35.8 | 32.4 9% | 31.1 13% | 29.5 18% | 29.5 18% |
| Idle Bottom * | 32.4 | 29.6 9% | 33.1 -2% | 29.8 8% | 28.6 12% |
* ... smaller is better
(+) The maximum temperature on the upper side is 34.9 °C / 95 F, compared to the average of 35.3 °C / 96 F, ranging from 19.6 to 55.7 °C for the class Convertible.
(+) The bottom heats up to a maximum of 36.7 °C / 98 F, compared to the average of 36.8 °C / 98 F
(±) In idle usage, the average temperature for the upper side is 32 °C / 90 F, compared to the device average of 30.2 °C / 86 F.
(+) The palmrests and touchpad are reaching skin temperature as a maximum (35.8 °C / 96.4 F) and are therefore not hot.
(-) The average temperature of the palmrest area of similar devices was 28.1 °C / 82.6 F (-7.7 °C / -13.8 F).
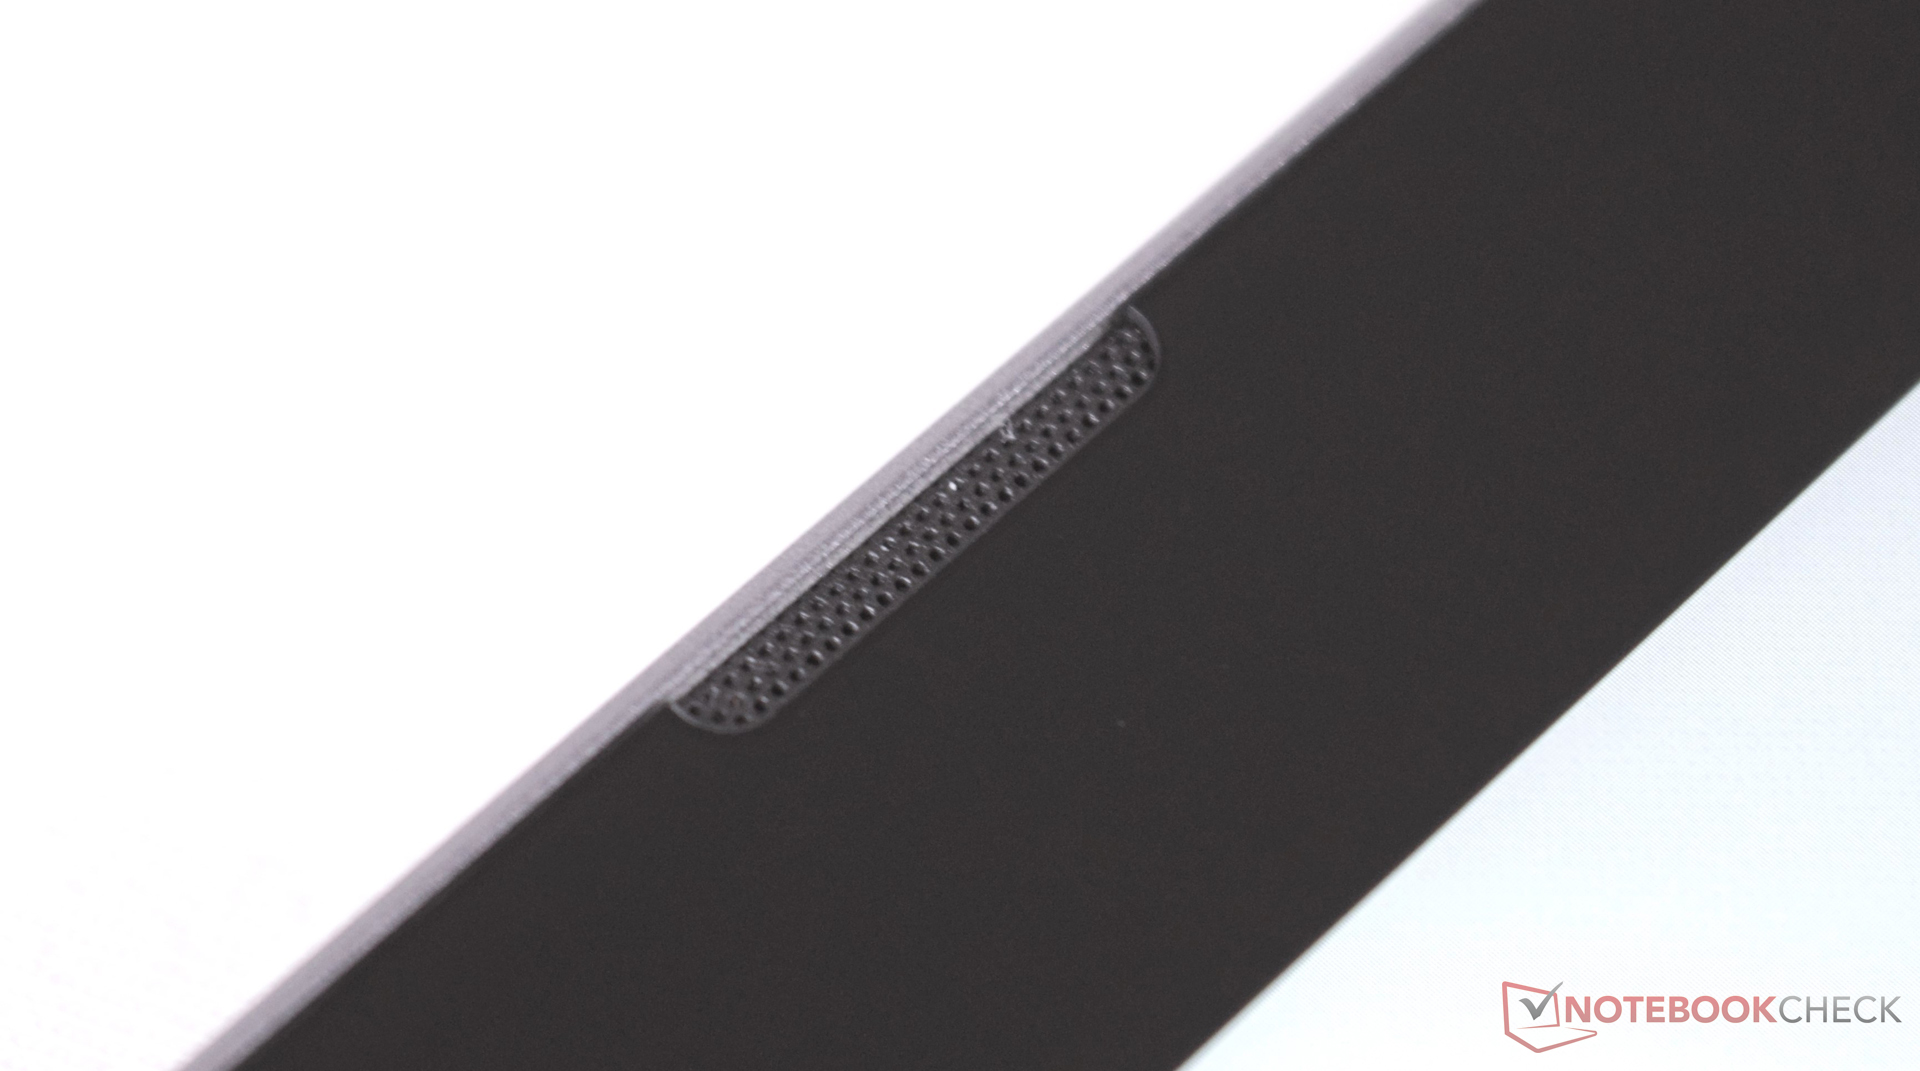
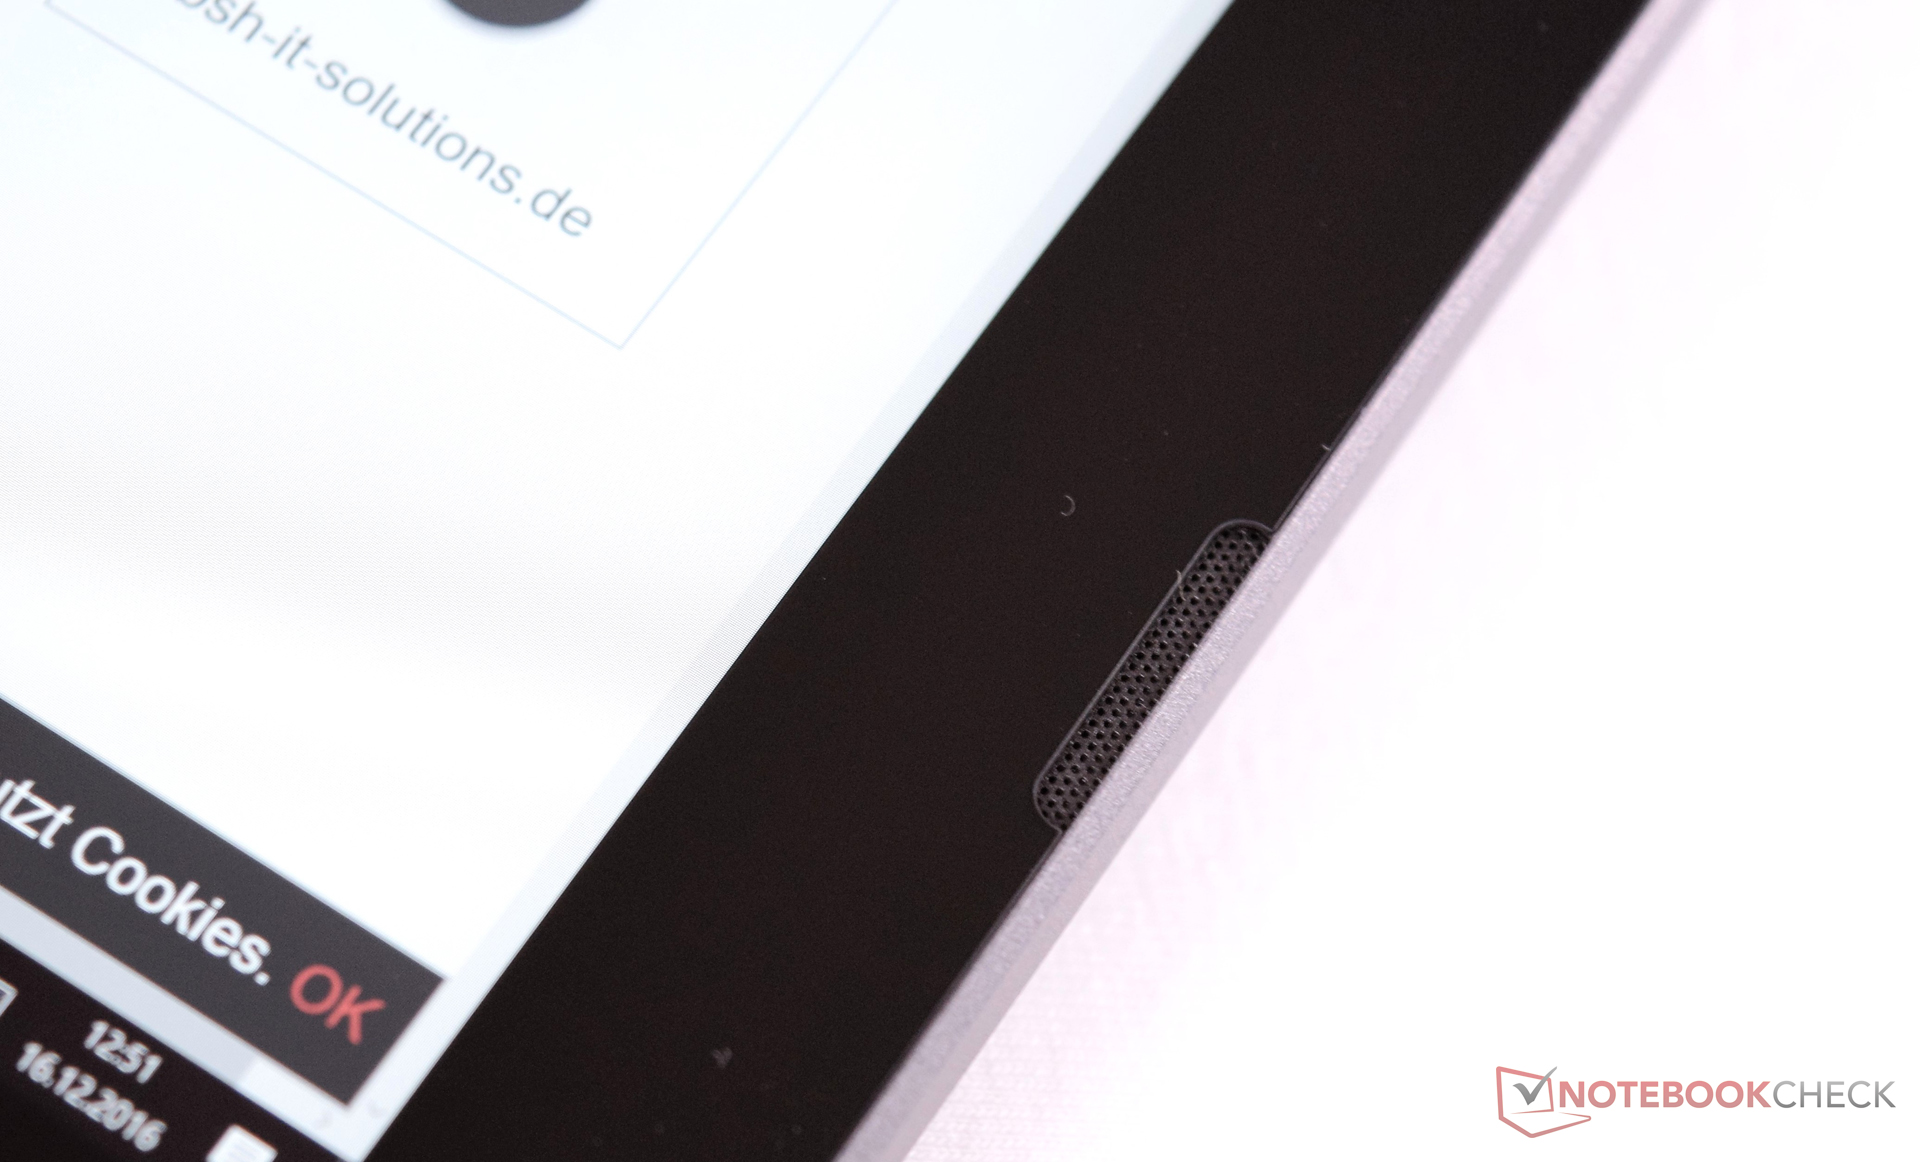
Asus Transformer 3 Pro T303UA-GN050T audio analysis
(±) | speaker loudness is average but good (73 dB)
Bass 100 - 315 Hz
(±) | reduced bass - on average 11.2% lower than median
(±) | linearity of bass is average (8.2% delta to prev. frequency)
Mids 400 - 2000 Hz
(+) | balanced mids - only 1.8% away from median
(+) | mids are linear (6.7% delta to prev. frequency)
Highs 2 - 16 kHz
(±) | higher highs - on average 9% higher than median
(+) | highs are linear (5.7% delta to prev. frequency)
Overall 100 - 16.000 Hz
(±) | linearity of overall sound is average (19% difference to median)
Compared to same class
» 39% of all tested devices in this class were better, 8% similar, 53% worse
» The best had a delta of 6%, average was 21%, worst was 57%
Compared to all devices tested
» 39% of all tested devices were better, 8% similar, 53% worse
» The best had a delta of 4%, average was 25%, worst was 134%
Apple MacBook 12 (Early 2016) 1.1 GHz audio analysis
(+) | speakers can play relatively loud (83.6 dB)
Bass 100 - 315 Hz
(±) | reduced bass - on average 11.3% lower than median
(±) | linearity of bass is average (14.2% delta to prev. frequency)
Mids 400 - 2000 Hz
(+) | balanced mids - only 2.4% away from median
(+) | mids are linear (5.5% delta to prev. frequency)
Highs 2 - 16 kHz
(+) | balanced highs - only 2% away from median
(+) | highs are linear (4.5% delta to prev. frequency)
Overall 100 - 16.000 Hz
(+) | overall sound is linear (10.2% difference to median)
Compared to same class
» 5% of all tested devices in this class were better, 2% similar, 93% worse
» The best had a delta of 5%, average was 19%, worst was 53%
Compared to all devices tested
» 3% of all tested devices were better, 1% similar, 96% worse
» The best had a delta of 4%, average was 25%, worst was 134%
| Off / Standby | |
| Idle | |
| Load |
|
| Asus Transformer 3 Pro T303UA-GN050T 6500U, HD Graphics 520, SK Hynix Canvas SC300 512GB M.2 (HFS512G39MND), IPS, 2880x1920, 12.60 | Lenovo ThinkPad X1 Yoga-20FRS1VS00 6600U, HD Graphics 520, Samsung SSD PM961 1TB M.2 PCIe 3.0 x4 NVMe (MZSLW1T0), OLED, 2560x1440, 14.00 | HP Elite x2 1012 G1 6Y54, HD Graphics 515, Liteon L8H-256V2G, IPS, 1920x1280, 12.10 | Acer Aspire Switch Alpha 12 SA5-271-56HM 6200U, HD Graphics 520, Kingston RBU-SNS8152S3256GG2, IPS, 2160x1440, 12.00 | Apple MacBook Pro 13 2016 (2.9 GHz) 6267U, Iris Graphics 550, Apple SSD AP0256, , 2560x1600, 13.30 | Dell XPS 13 9360 QHD+ i5 i5-7200U, HD Graphics 620, Toshiba NVMe THNSN5256GPUK, , 3200x1800, 13.30 | |
|---|---|---|---|---|---|---|
| Power Consumption | -6% | 23% | 4% | -18% | 22% | |
| Idle Minimum * | 6.7 | 4.7 30% | 3.7 45% | 7.3 -9% | 2.1 69% | 3.7 45% |
| Idle Average * | 10.3 | 8.6 17% | 6.8 34% | 10 3% | 7.6 26% | 6.1 41% |
| Idle Maximum * | 13.5 | 12.2 10% | 7.6 44% | 10.15 25% | 8.2 39% | 6.5 52% |
| Load Average * | 26 | 29.7 -14% | 22.5 13% | 25.2 3% | 56.4 -117% | 29.5 -13% |
| Load Maximum * | 28.8 | 50.5 -75% | 34.5 -20% | 29.3 -2% | 59.8 -108% | 33 -15% |
* ... smaller is better
| Asus Transformer 3 Pro T303UA-GN050T 6500U, HD Graphics 520, 39 Wh | Microsoft Surface Pro 4, Core m3 6Y30, HD Graphics 515, 38 Wh | Lenovo ThinkPad X1 Yoga-20FRS1VS00 6600U, HD Graphics 520, 56 Wh | HP Elite x2 1012 G1 6Y54, HD Graphics 515, 37 Wh | Acer Aspire Switch Alpha 12 SA5-271-56HM 6200U, HD Graphics 520, 37 Wh | |
|---|---|---|---|---|---|
| Battery Runtime | 80% | 79% | 77% | 58% | |
| Reader / Idle | 426 | 791 86% | 824 93% | 732 72% | 640 50% |
| H.264 | 206 | 520 152% | 432 110% | 468 127% | |
| WiFi v1.3 | 223 | 488 119% | 315 41% | 443 99% | 321 44% |
| Load | 102 | 138 35% | 132 29% | 130 27% | 112 10% |
Pros
Cons
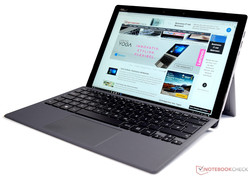
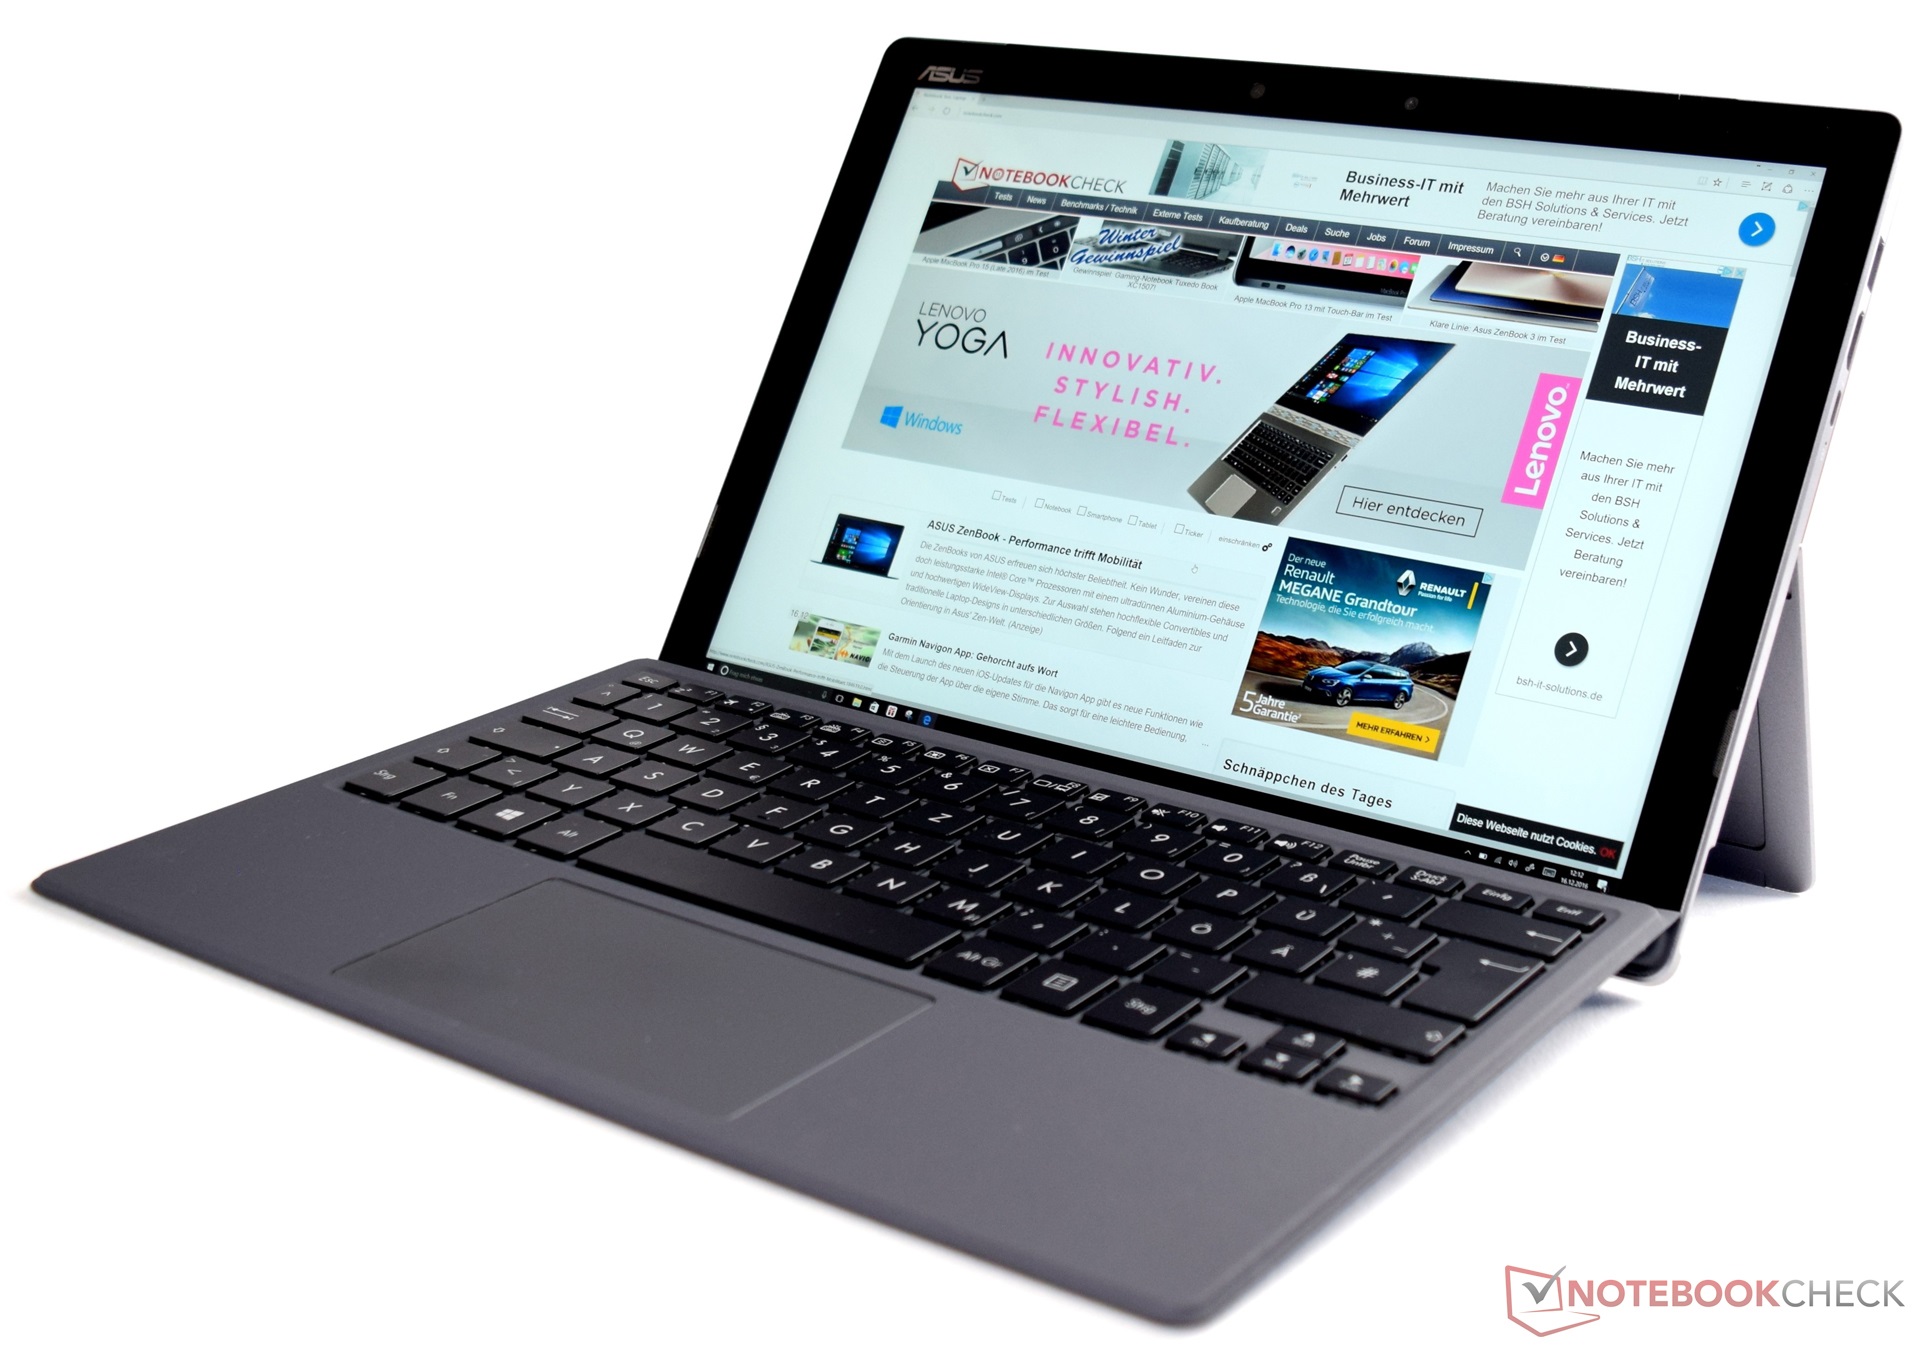
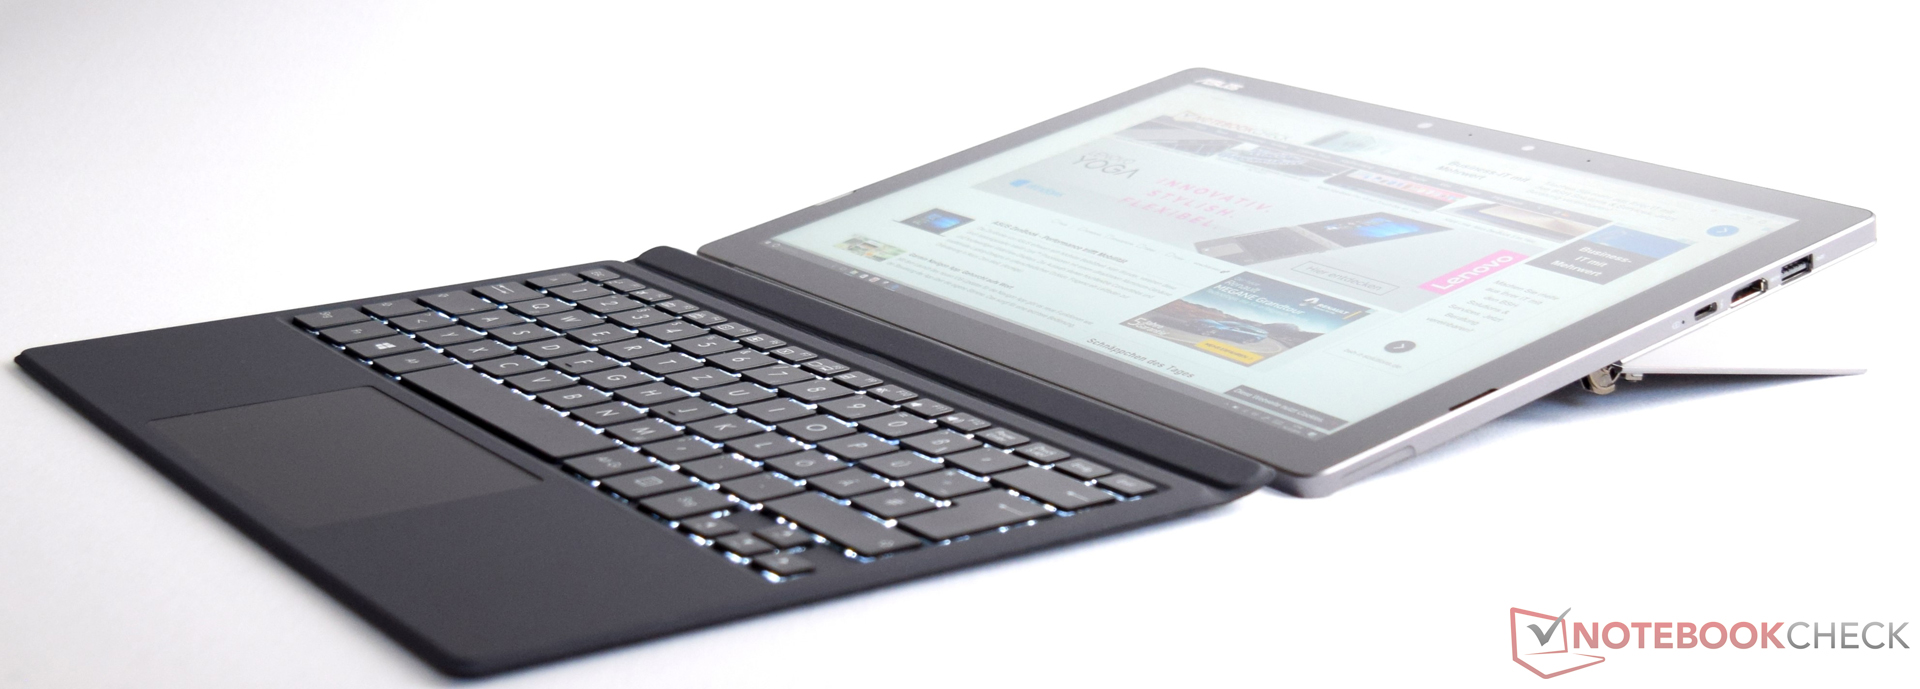
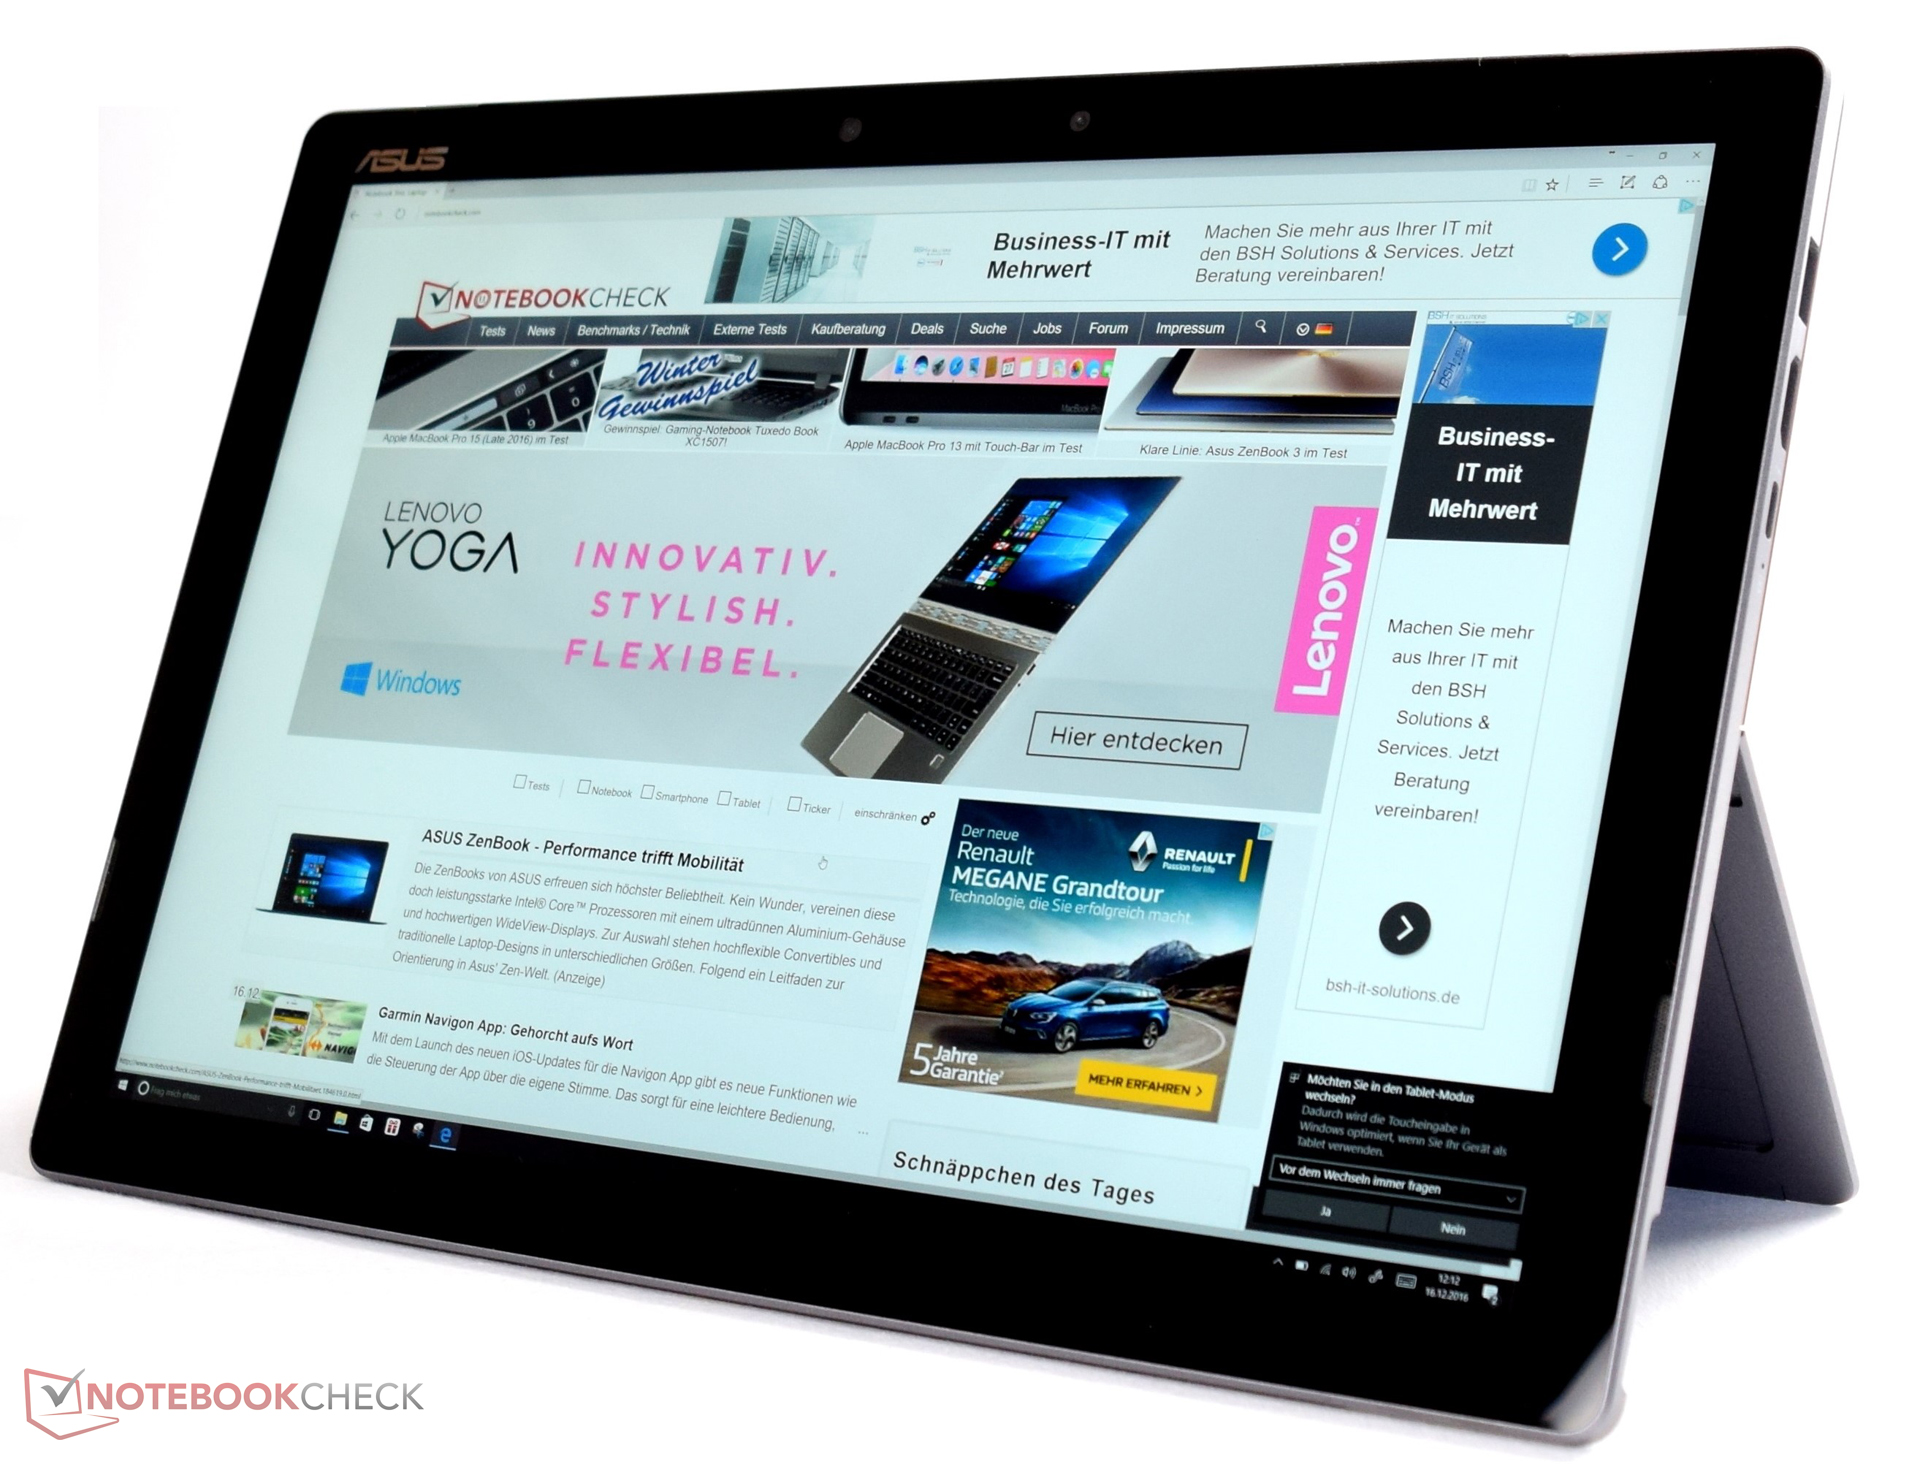
华硕需要付出更大的努力才可能追上Surface的步伐。这台华硕Transformer 3 Pro实现了一些进步:作为变形本的它搭配了高速处理器,大容量内存和大容量固态硬盘。搭配的键盘底座可以帮助平板主机变身为完整的笔记本电脑。在我们评测截稿时它的售价为1599欧元(约11661人民币)。消费者可以得到一台性能充足的可靠设备。遗憾的是,它无法发挥处理器最大的潜能。这也是我们认为它无法挑战微软 Surface Pro 4的原因之一。
它的实际性能和潜在性能之间的差距可能会让一些用户望而却步。不过,华硕Transformer 3 Pro仍然是一台工艺精湛的时髦变形本。出色的屏幕提供了广阔的色域覆盖,适合专业用途。
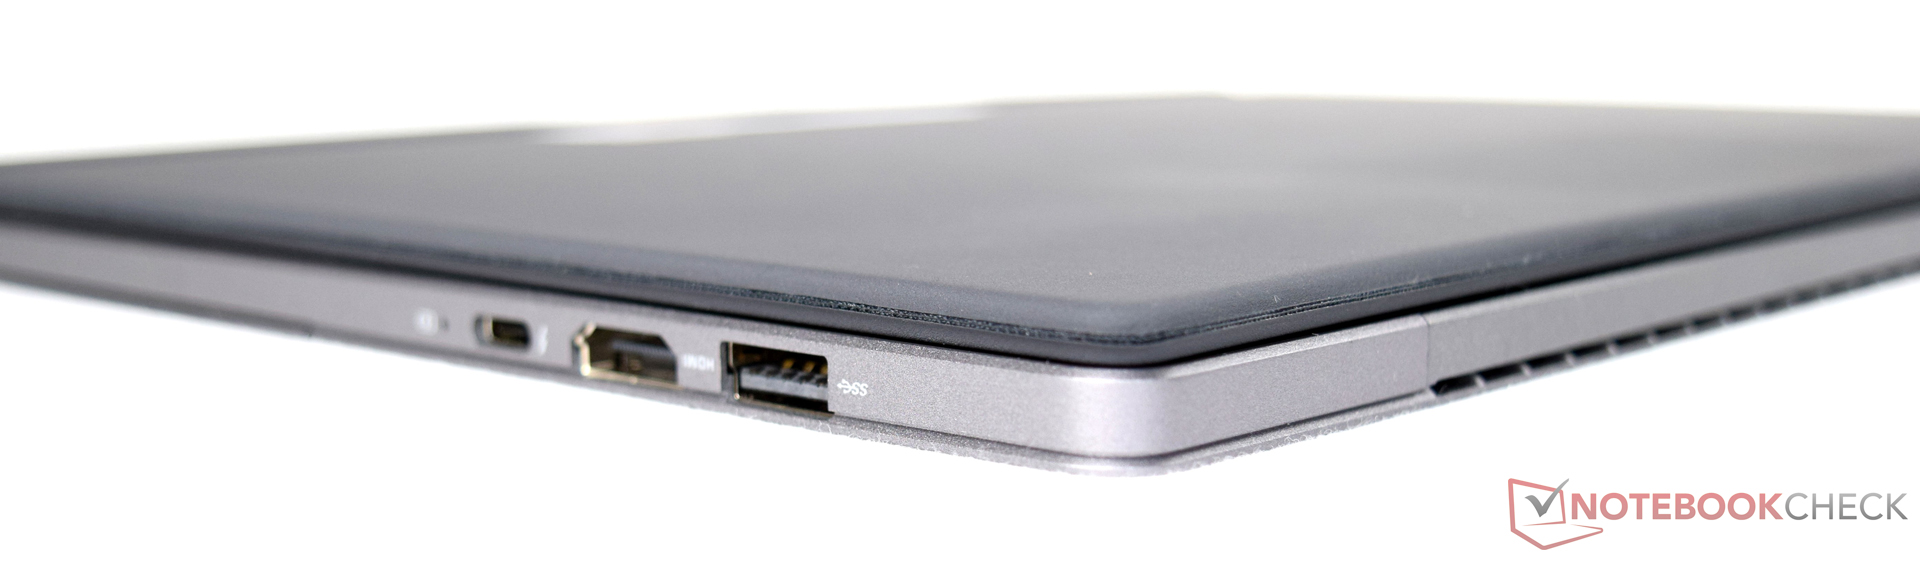
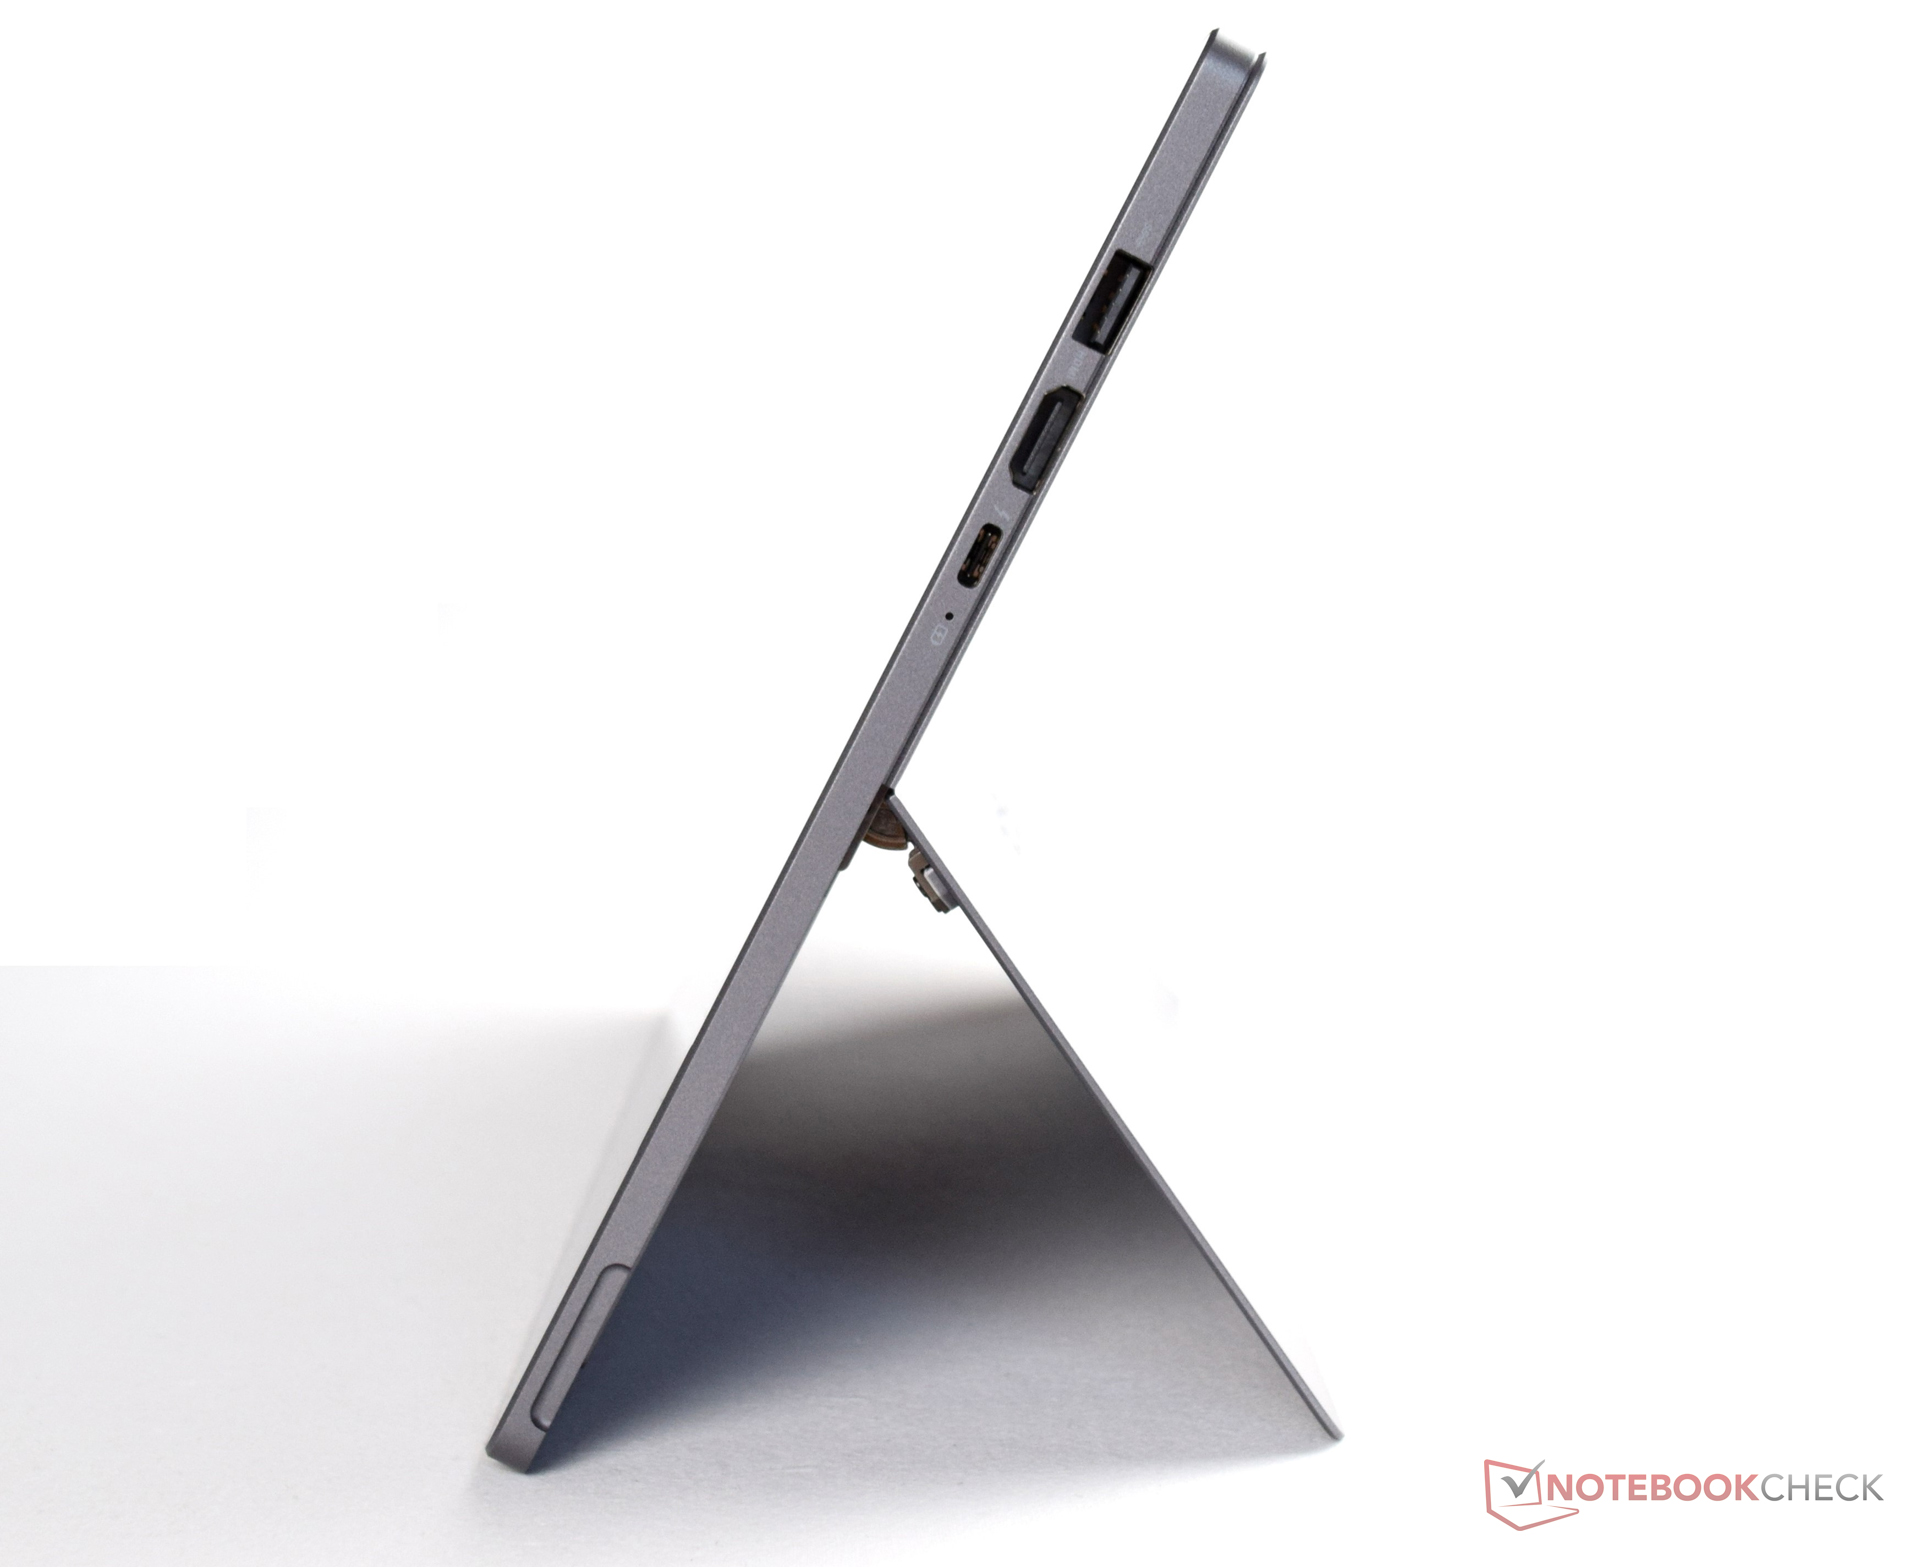
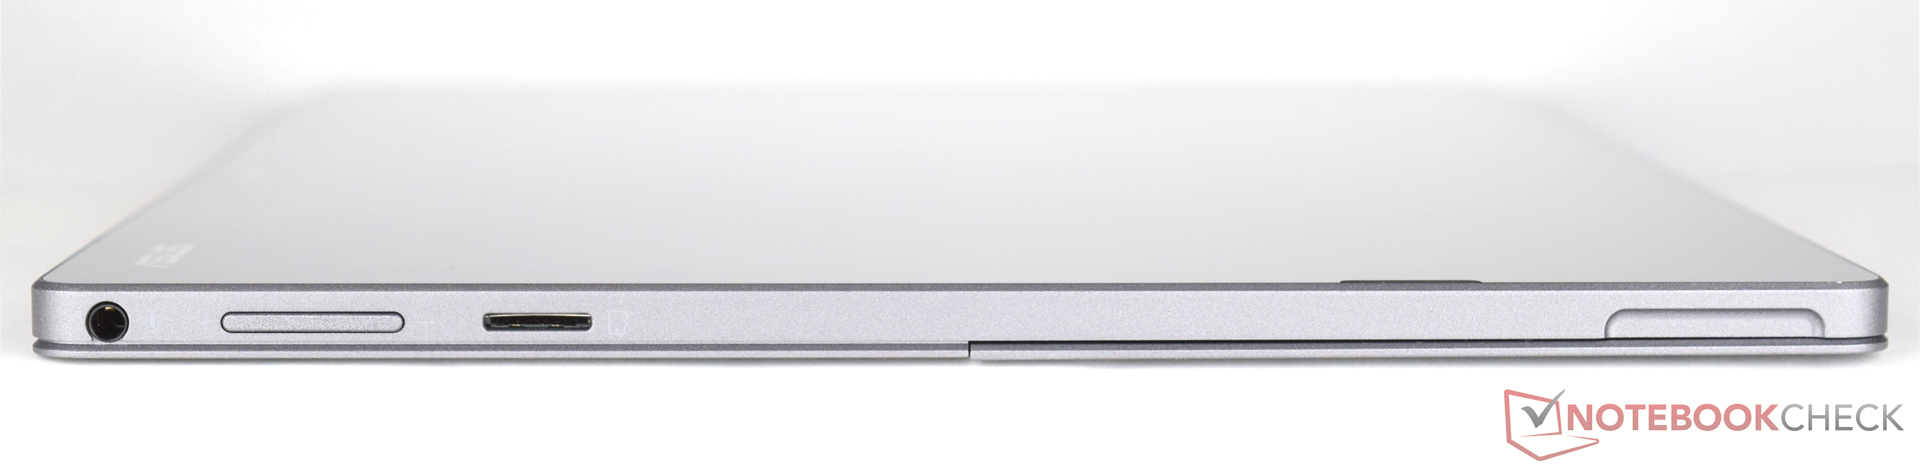
更快的处理器总会是个优势。不过如果它会一直过热降频的话还有什么意义呢?一颗可以被动散热的英特尔酷睿 i5 7Y54也可以提供我们测试机中英特尔酷睿 i7-6500U的性能水平。这台华硕机型的连接性中规中矩,不过我们更希望在未来机型中看到两个USB 3.1接口(支持Thunderbolt 3),用户将可以使用一个接口充电,另一个接口连接外设。
注:本文是基于完整评测的缩减版本,阅读完整的英文评测,请点击这里。
Asus Transformer 3 Pro T303UA-GN050T
-
12/21/2016 v6(old)
Sebastian Bade