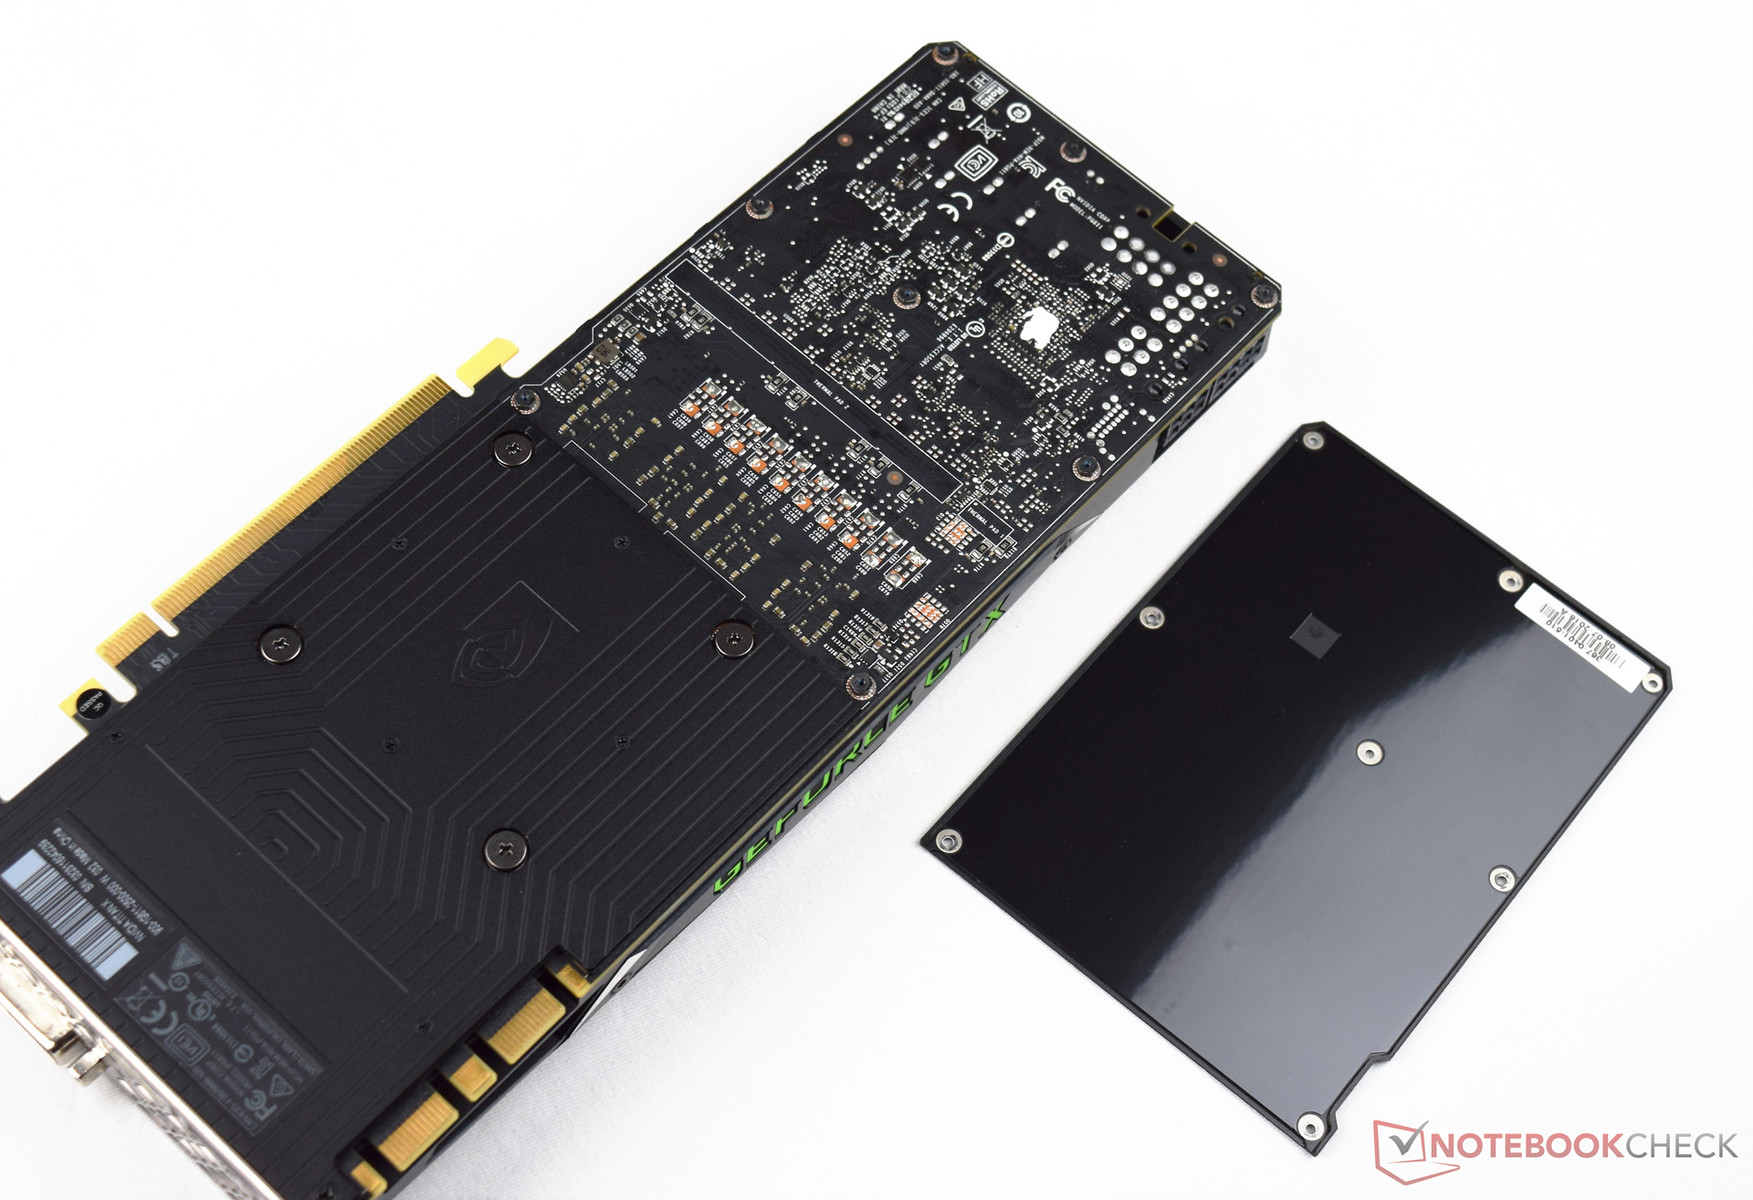
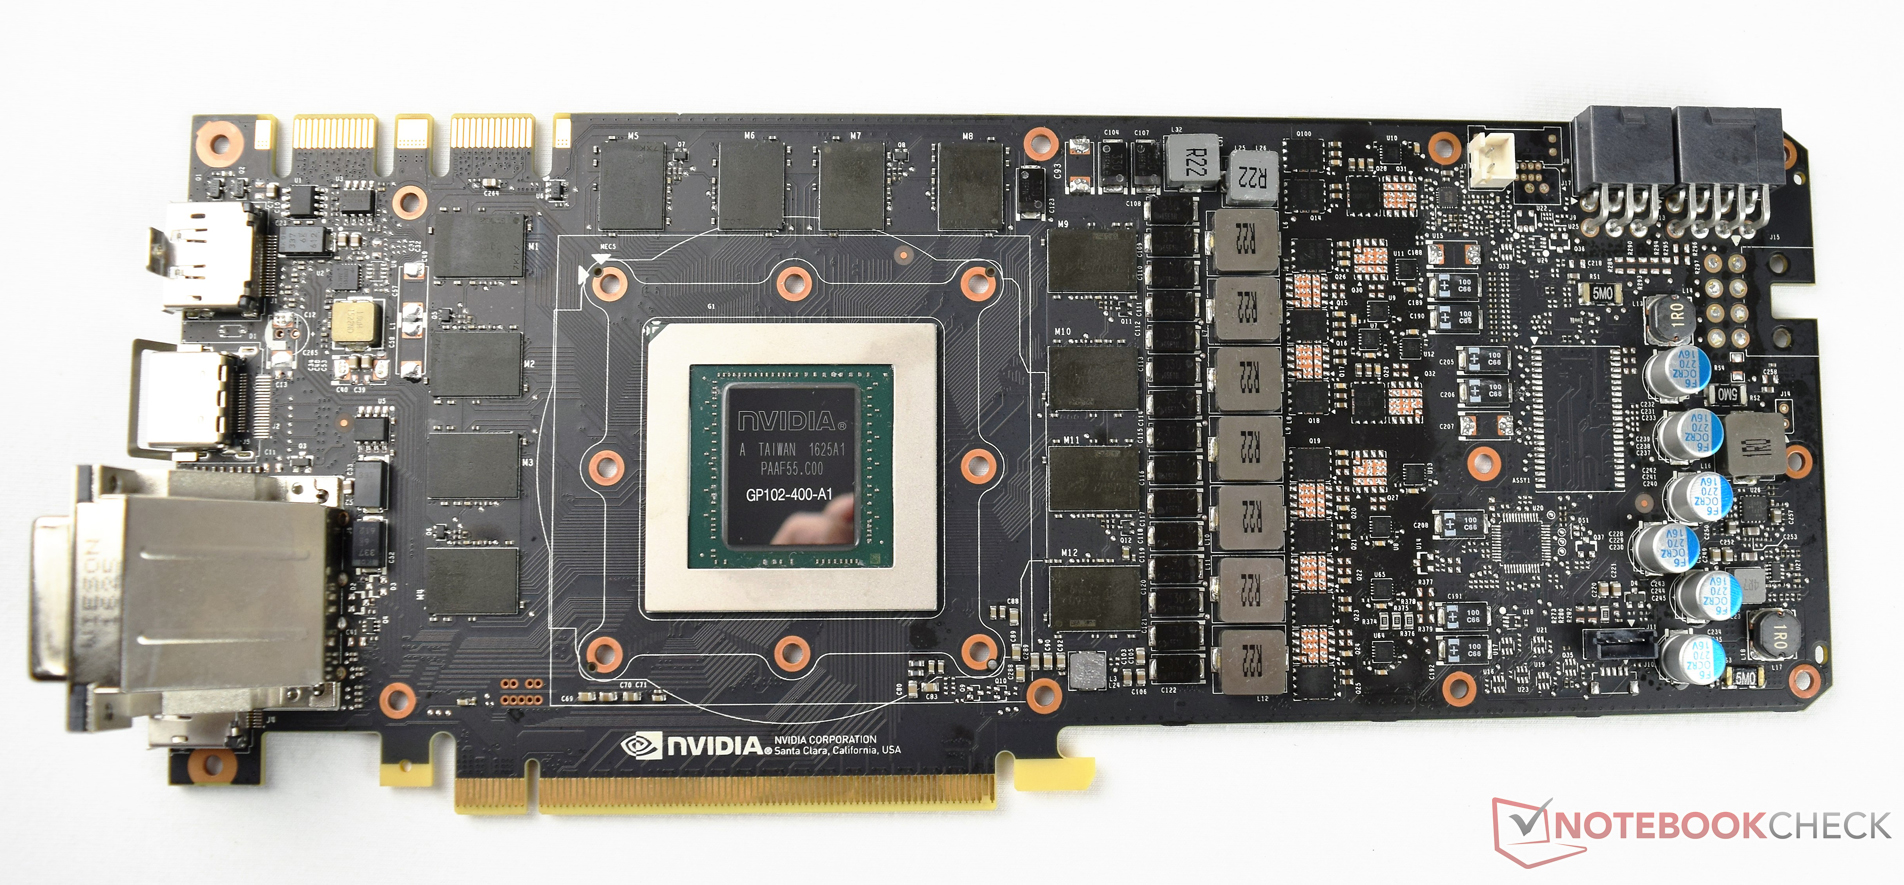
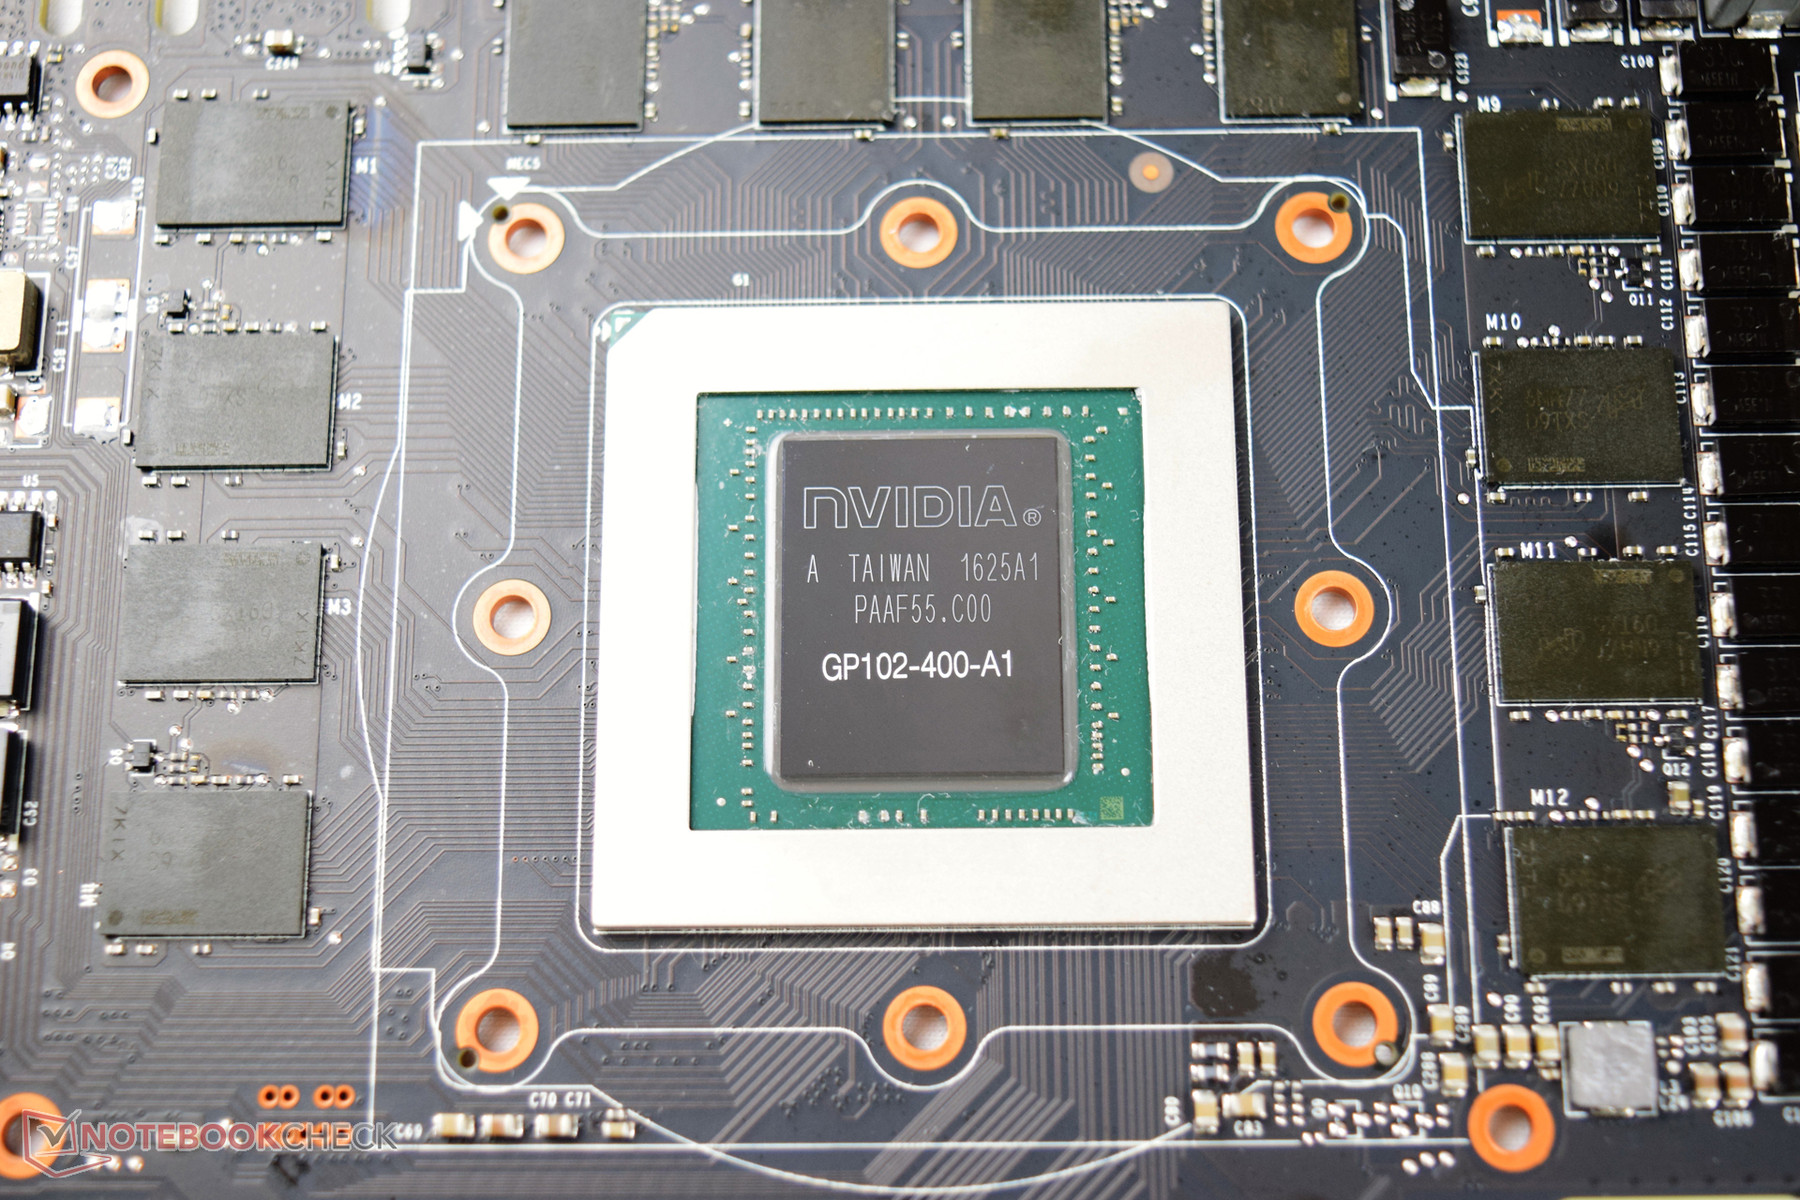
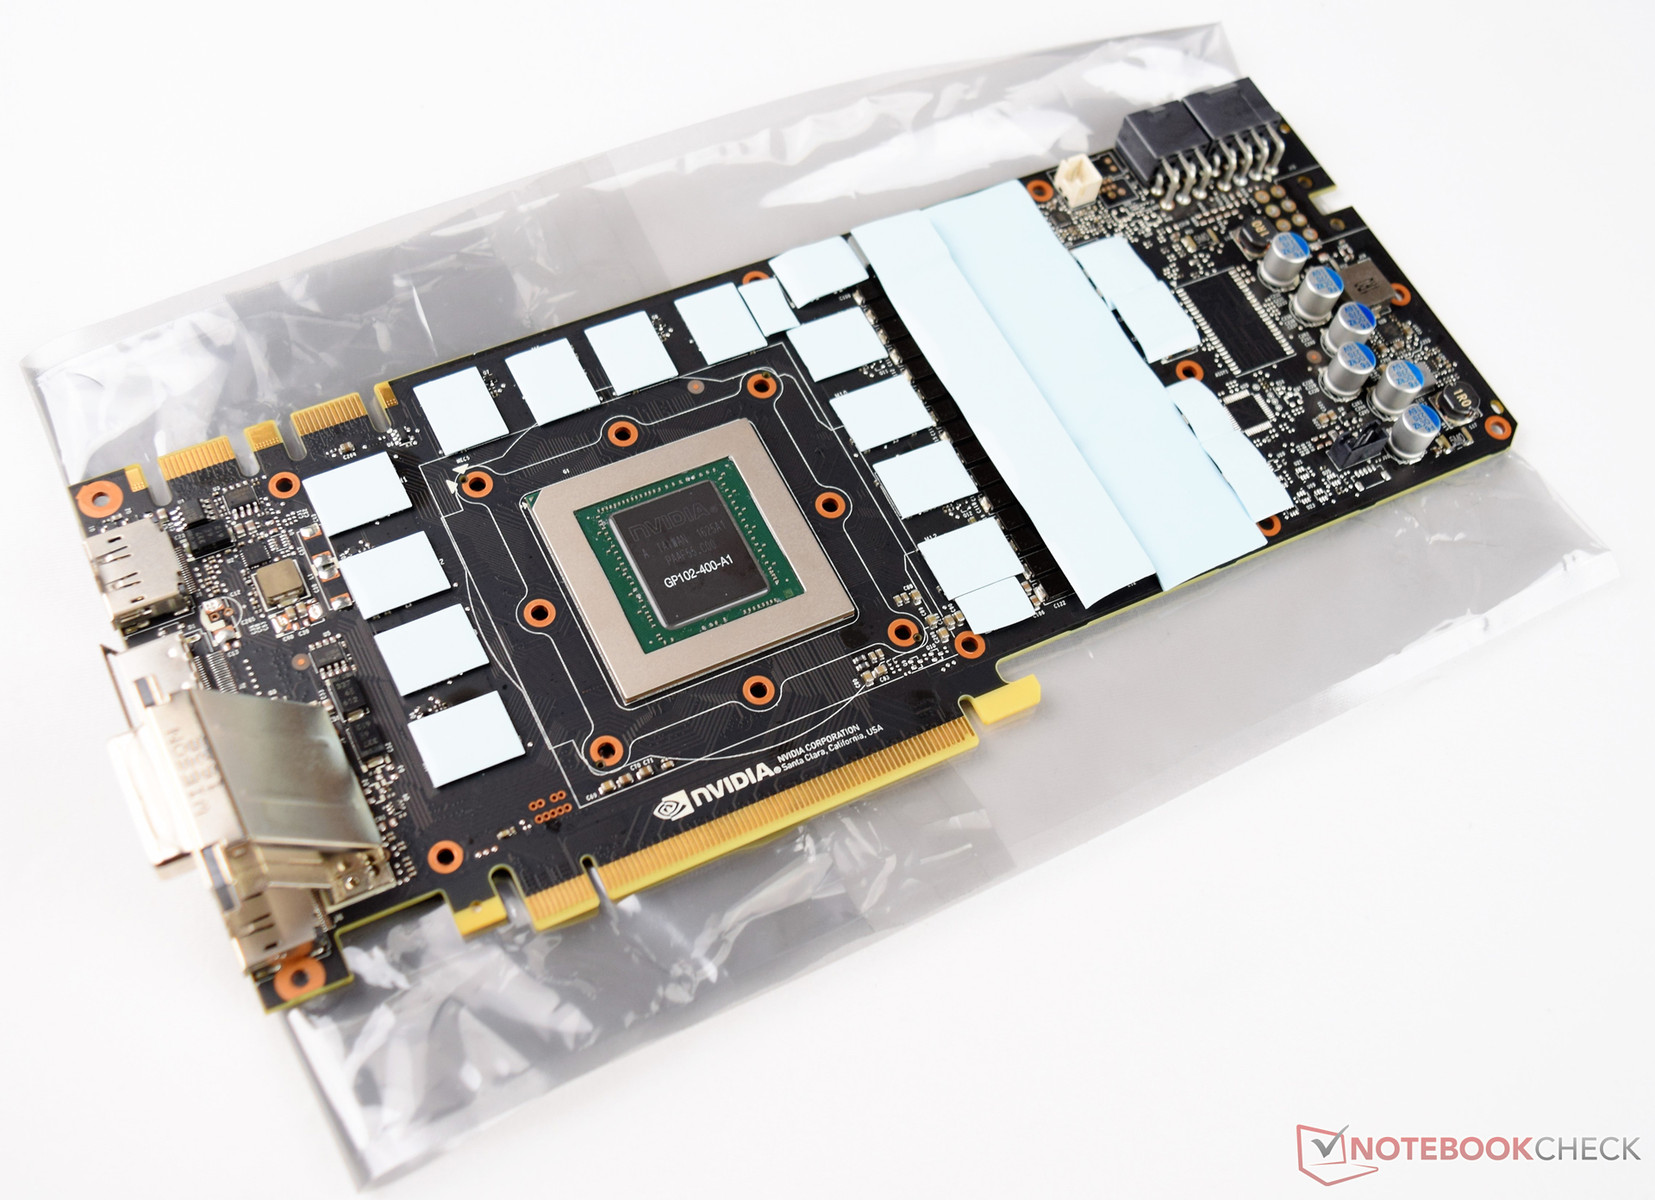
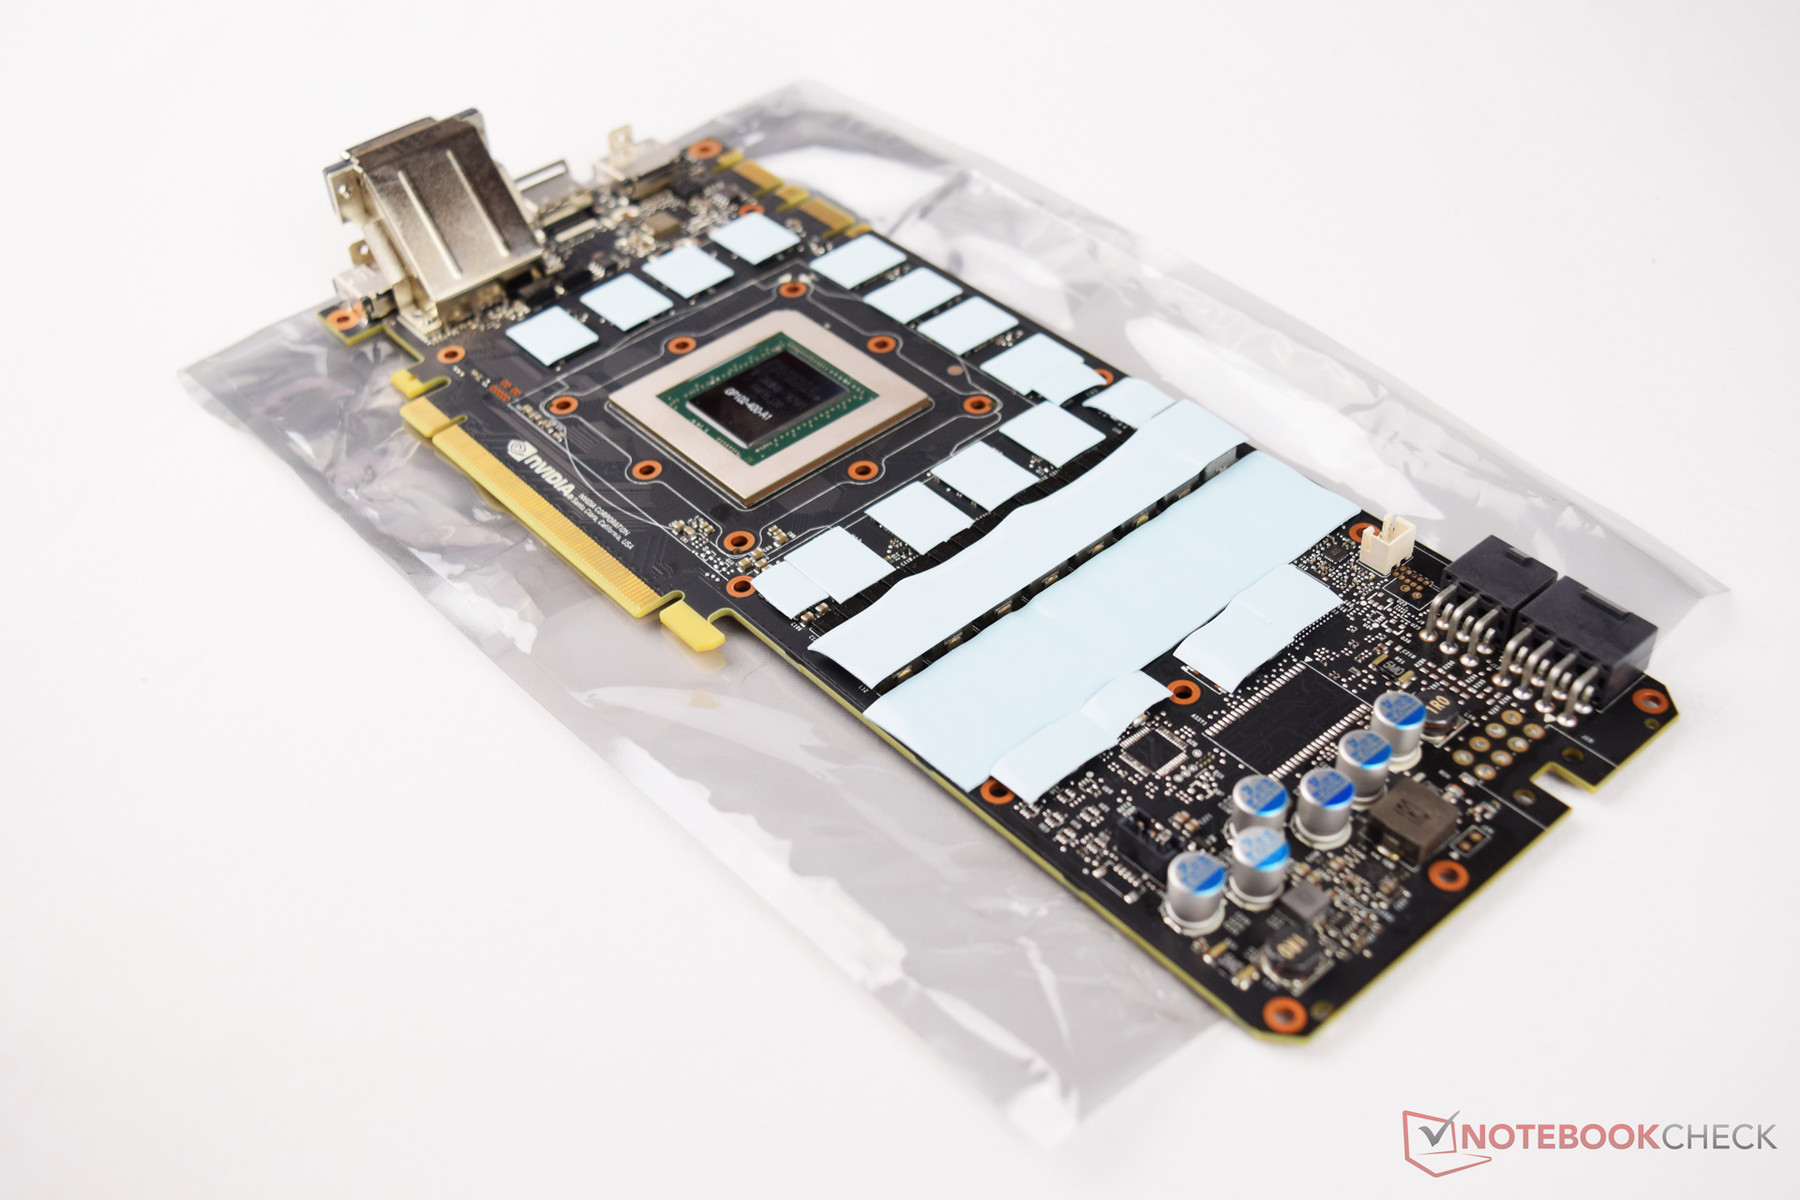
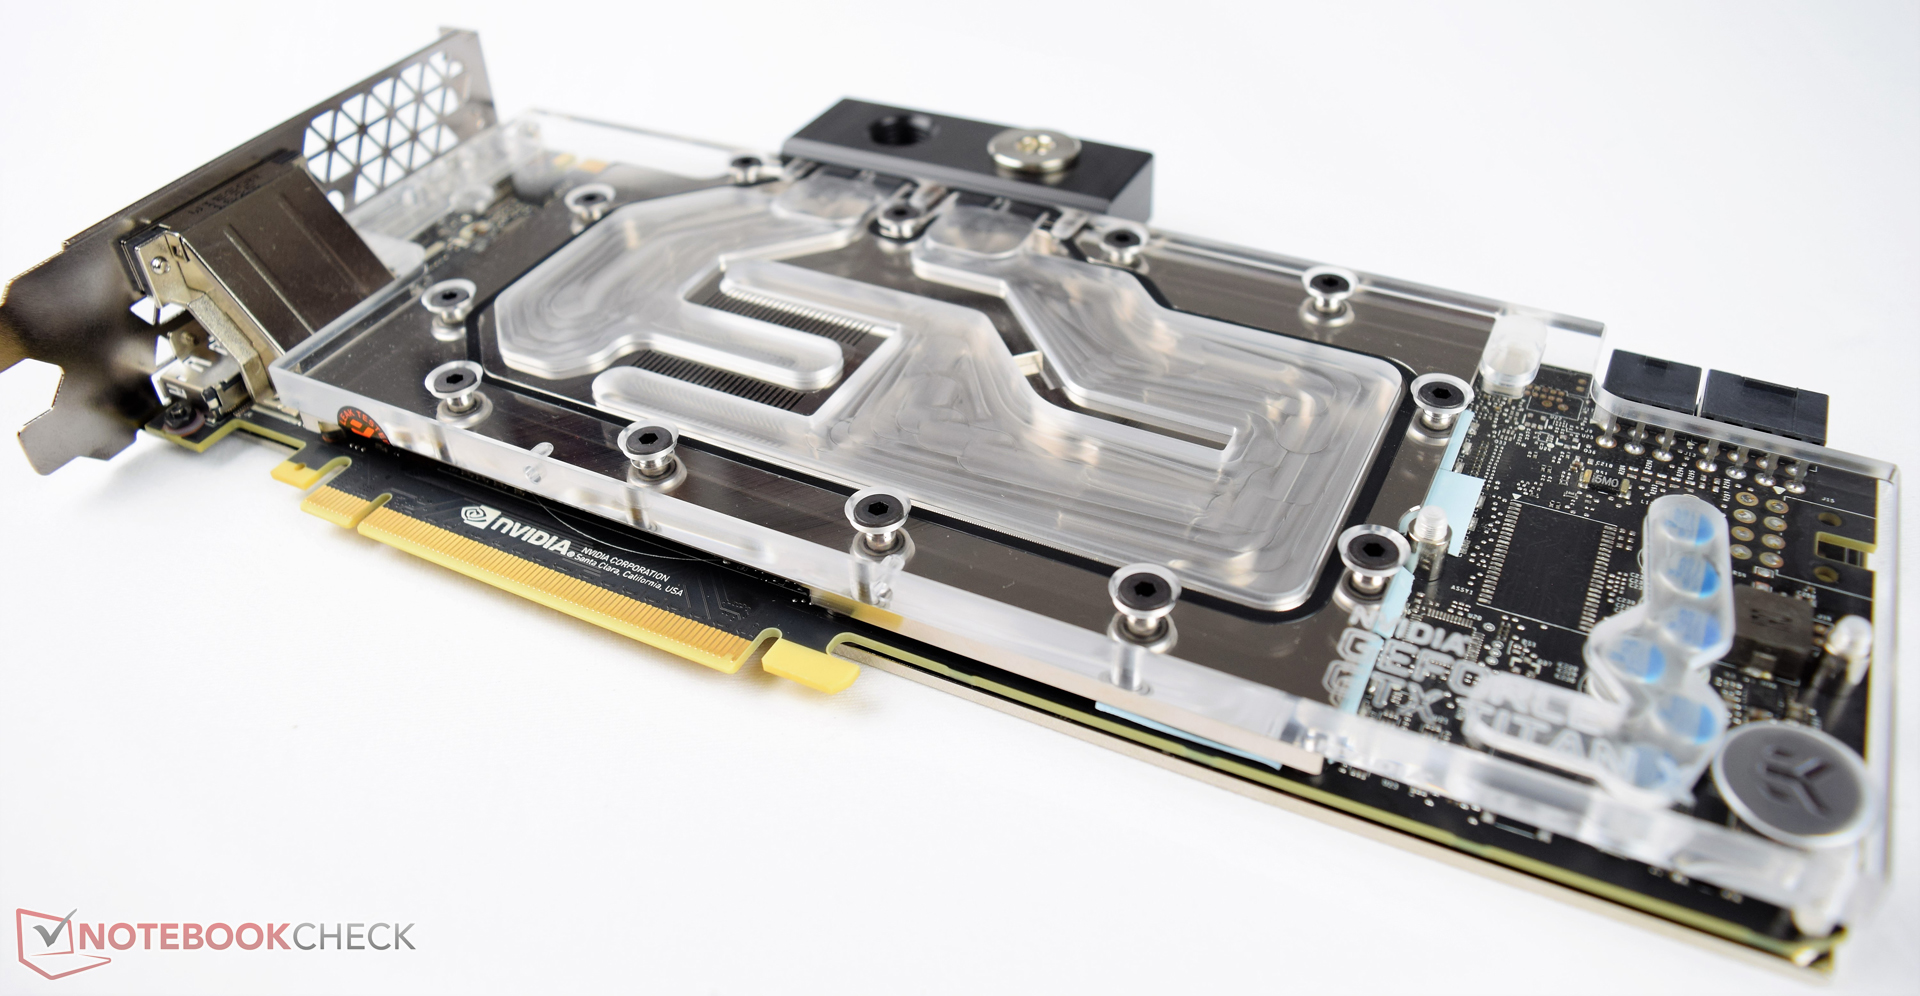
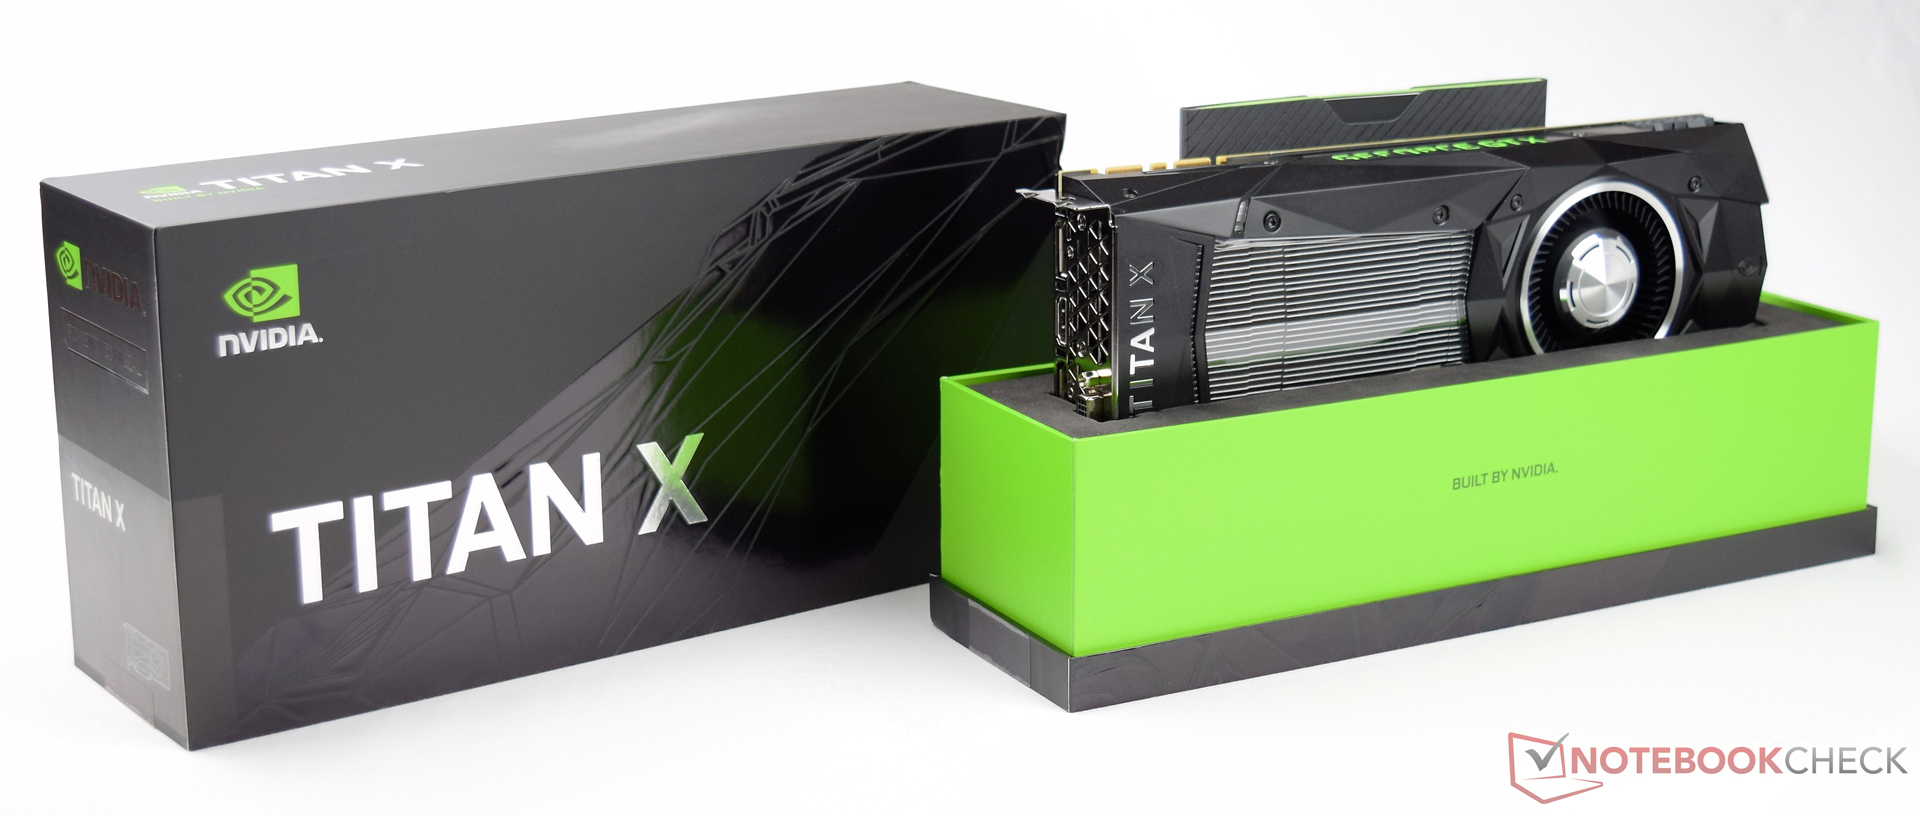
英伟达 Titan X Pascal 显卡简短评测 - 目前最快的消费级显卡 快,更快,最快。 在英伟达GeForce GTX 1080 Founder's Edition发布的两个月后,英伟达Titan X也在2016年8月8日走入了大众的视线。新一代的Titan X基于最新的帕斯卡架构,相比前代产品这为它带来了明显的提升。它比GeForce GTX 1080多出了1024个着色器,搭配12GB GDDR5X显存和更宽的显存带宽,这些参数一步步提高了我们对它性能表现的期待。在接下来的评测中,你将会了解到它的潜能究竟有多大,而与此同时会不会也存在不足。
Geforce Desktop Gaming Virtual Reality (VR) / Augmented Reality (AR)
Codename GP102 Architecture Pascal Pipelines 3584 - unified Core Speed 1418 - 1531 (Boost) MHz Memory Speed 10000 MHz Memory Bus Width 384 Bit Memory Type GDDR5X Max. Amount of Memory 12 GB Shared Memory no API DirectX 12_1, OpenGL 4.5 / Vulkan Power Consumption 250 Watt Transistor Count 12 Billion technology 16 nm Features DP 1.4, HDMI 2.0b, HDCP 2.2, CUDA, PCIe 3.0, GPU Boost 3.0, G-SYNC Date of Announcement 25.07.2016
v1.26
log 24. 19:36:18
#0 no ids found in url (should be separated by "_") +0s ... 0s
#1 not redirecting to Ajax server +0s ... 0s
#2 did not recreate cache, as it is less than 5 days old! Created at Mon, 22 Apr 2024 05:40:21 +0200 +0.001s ... 0.001s
#3 start showIntegratedCPUs +0.035s ... 0.036s
#4 return log +0.012s ... 0.047s
Legend
Core i7-3960x, Radeon HD 6450 Intel Core i7-3960X, AMD Radeon HD 6450 GDDR5,
Eurocom Panther 5D Intel Xeon E5-2697 v2, NVIDIA Quadro K5100M, Crucial M500 120 GB CT120M500SSD3
Asus G752VS-XB78K Intel Core i7-6820HK, NVIDIA GeForce GTX 1070 Mobile, Toshiba NVMe THNSN5512GPU7
NVIDIA Titan X Pascal Nvidia Titan X (Pascal), Intel Xeon E5-2680 v4 NVIDIA GeForce GTX 980 SLI (Laptop) MSI GT80S 6QF, Intel Core i7-6820HK NVIDIA GeForce GTX 1080 (Desktop)Nvidia GeForce GTX 1080 Founders Edition, Intel Core i7-4790K NVIDIA GeForce GTX 980 TiAsus Strix GTX 980 Ti Desktop PC, Intel Core i7-4790K NVIDIA GeForce GTX 1070 (Desktop) Nvidia GeForce GTX 1070 Founders Edition, Intel Core i7-4790K AMD Radeon R9 FuryXFX Radeon R9 Fury Pro, Intel Core i7-4790K NVIDIA GeForce GTX 980 (Laptop) SCHENKER XMG U716, Intel Core i7-6700 NVIDIA GeForce GTX 980M DogHouse Systems Mobius SS, Intel Core i7-6700K NVIDIA GeForce GTX 980 SLI (Laptop) MSI GT80S 6QF, Intel Core i7-6820HK NVIDIA GeForce GTX 1080 (Desktop)Nvidia GeForce GTX 1080 Founders Edition, Intel Core i7-4790K NVIDIA Titan X Pascal Nvidia Titan X (Pascal), Intel Xeon E5-2680 v4 NVIDIA GeForce GTX 1070 (Desktop) Nvidia GeForce GTX 1070 Founders Edition, Intel Core i7-4790K NVIDIA GeForce GTX 980 TiAsus Strix GTX 980 Ti Desktop PC, Intel Core i7-4790K AMD Radeon R9 FuryXFX Radeon R9 Fury Pro, Intel Core i7-4790K NVIDIA GeForce GTX 980 (Laptop) SCHENKER XMG U716, Intel Core i7-6700 NVIDIA GeForce GTX 980M DogHouse Systems Mobius SS, Intel Core i7-6700K NVIDIA Titan X Pascal Nvidia Titan X (Pascal), Intel Xeon E5-2680 v4 NVIDIA GeForce GTX 980 SLI (Laptop) MSI GT80S 6QF, Intel Core i7-6820HK NVIDIA GeForce GTX 1080 (Desktop)Nvidia GeForce GTX 1080 Founders Edition, Intel Core i7-4790K NVIDIA GeForce GTX 1070 (Desktop) Nvidia GeForce GTX 1070 Founders Edition, Intel Core i7-4790K NVIDIA GeForce GTX 980 TiAsus Strix GTX 980 Ti Desktop PC, Intel Core i7-4790K AMD Radeon R9 FuryXFX Radeon R9 Fury Pro, Intel Core i7-4790K NVIDIA GeForce GTX 980 (Laptop) SCHENKER XMG U716, Intel Core i7-6700 NVIDIA GeForce GTX 980M DogHouse Systems Mobius SS, Intel Core i7-6700K NVIDIA Titan X Pascal Nvidia Titan X (Pascal), Intel Xeon E5-2680 v4 NVIDIA GeForce GTX 1080 (Desktop)Nvidia GeForce GTX 1080 Founders Edition, Intel Core i7-4790K NVIDIA GeForce GTX 980 TiAsus Strix GTX 980 Ti Desktop PC, Intel Core i7-4790K AMD Radeon R9 FuryXFX Radeon R9 Fury Pro, Intel Core i7-4790K NVIDIA GeForce GTX 980M DogHouse Systems Mobius SS, Intel Core i7-6700K
NVIDIA Titan X Pascal Nvidia Titan X (Pascal), Intel Xeon E5-2680 v4 NVIDIA GeForce GTX 1080 (Desktop)Nvidia GeForce GTX 1080 Founders Edition, Intel Core i7-4790K
42 (34min - 53max ) fps-33%
AMD Radeon R9 FuryXFX Radeon R9 Fury Pro, Intel Core i7-4790K
38.9 (26min - 46max ) fps-38%
AMD Radeon R9 FuryXFX Radeon R9 Fury Pro, Intel Core i7-4790K
37.7 (26min - 46max ) fps-40%
NVIDIA GeForce GTX 1070 (Desktop) Nvidia GeForce GTX 1070 Founders Edition, Intel Core i7-4790K
35.6 (30min - 43max ) fps-43%
NVIDIA GeForce GTX 980 TiAsus Strix GTX 980 Ti Desktop PC, Intel Core i7-4790K
32.6 (24min - 42max ) fps-48%
NVIDIA GeForce GTX 980Desktop PC, Intel Core i7-6700K NVIDIA GeForce GTX 980MSchenker W504, Intel Core i7-4700MQ
NVIDIA Titan X Pascal Nvidia Titan X (Pascal), Intel Xeon E5-2680 v4 NVIDIA GeForce GTX 1080 (Desktop)Nvidia GeForce GTX 1080 Founders Edition, Intel Core i7-4790K
48.5 (19min - 65max ) fps-7%
NVIDIA GeForce GTX 980 TiAsus Strix GTX 980 Ti Desktop PC, Intel Core i7-4790K
39.8 (14min - 51max ) fps-24%
NVIDIA GeForce GTX 1070 (Desktop) Nvidia GeForce GTX 1070 Founders Edition, Intel Core i7-4790K
39.7 (17min - 52max ) fps-24%
AMD Radeon R9 FuryXFX Radeon R9 Fury Pro, Intel Core i7-4790K
34.5 (19min - 51max ) fps-34%
NVIDIA GeForce GTX 980Desktop PC, Intel Core i7-6700K
NVIDIA Titan X Pascal Nvidia Titan X (Pascal), Intel Xeon E5-2680 v4 NVIDIA GeForce GTX 1080 (Desktop)Nvidia GeForce GTX 1080 Founders Edition, Intel Core i7-4790K
49 (46min - 53max ) fps-21%
NVIDIA GeForce GTX 980 TiAsus Strix GTX 980 Ti Desktop PC, Intel Core i7-4790K
40 (37min - 44max ) fps-35%
NVIDIA GeForce GTX 1070 (Desktop) Nvidia GeForce GTX 1070 Founders Edition, Intel Core i7-4790K
38 (36min - 42max ) fps-39%
AMD Radeon R9 FuryXFX Radeon R9 Fury Pro, Intel Core i7-4790K
37 (33min - 42max ) fps-40%
NVIDIA GeForce GTX 980Desktop PC, Intel Core i7-6700K NVIDIA GeForce GTX 980MSchenker W504, Intel Core i7-4700MQ
NVIDIA Titan X Pascal Nvidia Titan X (Pascal), Intel Xeon E5-2680 v4 NVIDIA GeForce GTX 1080 (Desktop)Nvidia GeForce GTX 1080 Founders Edition, Intel Core i7-4790K
30.4 (27min - 34max ) fps-29%
NVIDIA GeForce GTX 1070 (Desktop) Nvidia GeForce GTX 1070 Founders Edition, Intel Core i7-4790K
25.6 (39min - 47max ) fps-40%
NVIDIA GeForce GTX 980 TiAsus Strix GTX 980 Ti Desktop PC, Intel Core i7-4790K
25 (24min - 28max ) fps-42%
AMD Radeon R9 FuryXFX Radeon R9 Fury Pro, Intel Core i7-4790K
22 (19min - 24max ) fps-49%
NVIDIA GeForce GTX 980Desktop PC, Intel Core i7-6700K
NVIDIA Titan X Pascal Nvidia Titan X (Pascal), Intel Xeon E5-2680 v4 NVIDIA GeForce GTX 1080 (Desktop)Nvidia GeForce GTX 1080 Founders Edition, Intel Core i7-4790K NVIDIA GeForce GTX 1080 (Desktop)Nvidia GeForce GTX 1080 Founders Edition, Intel Core i7-4790K
47.8 (43min - 54max ) fps-30%
NVIDIA GeForce GTX 980 TiAsus Strix GTX 980 Ti Desktop PC, Intel Core i7-4790K
40.6 (36min - 46max ) fps-41%
NVIDIA GeForce GTX 1070 (Desktop) Nvidia GeForce GTX 1070 Founders Edition, Intel Core i7-4790K
38.9 (35min - 44max ) fps-43%
AMD Radeon R9 FuryXFX Radeon R9 Fury Pro, Intel Core i7-4790K
32.4 (29min - 37max ) fps-53%
NVIDIA GeForce GTX 980Desktop PC, Intel Core i7-6700K NVIDIA GeForce GTX 980MSchenker W504, Intel Core i7-4700MQ
NVIDIA Titan X Pascal Nvidia Titan X (Pascal), Intel Xeon E5-2680 v4
81.6 (71min - 123max ) fps
NVIDIA GeForce GTX 1080 (Desktop)Nvidia GeForce GTX 1080 Founders Edition, Intel Core i7-4790K
62 (56min - 67max ) fps-24%
NVIDIA GeForce GTX 1070 (Desktop) Nvidia GeForce GTX 1070 Founders Edition, Intel Core i7-4790K
49.6 (44min - 53max ) fps-39%
NVIDIA GeForce GTX 980 TiAsus Strix GTX 980 Ti Desktop PC, Intel Core i7-4790K
48 (42min - 52max ) fps-41%
NVIDIA GeForce GTX 980Desktop PC, Intel Core i7-6700K AMD Radeon R9 FuryXFX Radeon R9 Fury Pro, Intel Core i7-4790K
36.3 (33min - 41max ) fps-56%
NVIDIA GeForce GTX 980MSchenker W504, Intel Core i7-4700MQ
NVIDIA Titan X Pascal Nvidia Titan X (Pascal), Intel Xeon E5-2680 v4
88.6 (79min - 103max ) fps
NVIDIA GeForce GTX 1080 (Desktop)Nvidia GeForce GTX 1080 Founders Edition, Intel Core i7-4790K
67 (58min - 79max ) fps-24%
NVIDIA GeForce GTX 980 SLI (Laptop) MSI GT80S 6QF, Intel Core i7-6820HK NVIDIA GeForce GTX 980 TiAsus Strix GTX 980 Ti Desktop PC, Intel Core i7-4790K
53 (46min - 64max ) fps-40%
NVIDIA GeForce GTX 1070 (Desktop) Nvidia GeForce GTX 1070 Founders Edition, Intel Core i7-4790K
52.7 (45min - 63max ) fps-41%
AMD Radeon R9 FuryXFX Radeon R9 Fury Pro, Intel Core i7-4790K
50 (43min - 60max ) fps-44%
NVIDIA GeForce GTX 980Desktop PC, Intel Core i7-6700K NVIDIA GeForce GTX 980MSchenker W504, Intel Core i7-4700MQ
NVIDIA Titan X Pascal Nvidia Titan X (Pascal), Intel Xeon E5-2680 v4 NVIDIA GeForce GTX 1080 (Desktop)Nvidia GeForce GTX 1080 Founders Edition, Intel Core i7-4790K
47.3 (44min - 51max ) fps-27%
NVIDIA GeForce GTX 1070 (Desktop) Nvidia GeForce GTX 1070 Founders Edition, Intel Core i7-4790K
38 (35min - 42max ) fps-42%
NVIDIA GeForce GTX 980 SLI (Laptop) MSI GT80S 6QF, Intel Core i7-6820HK NVIDIA GeForce GTX 980 TiAsus Strix GTX 980 Ti Desktop PC, Intel Core i7-4790K
37.4 (35min - 41max ) fps-43%
AMD Radeon R9 FuryXFX Radeon R9 Fury Pro, Intel Core i7-4790K
31.5 (29min - 37max ) fps-52%
NVIDIA GeForce GTX 980Desktop PC, Intel Core i7-6700K NVIDIA GeForce GTX 980MSchenker W504, Intel Core i7-4700MQ
NVIDIA Titan X Pascal Nvidia Titan X (Pascal), Intel Xeon E5-2680 v4 NVIDIA GeForce GTX 980 SLI (Laptop) MSI GT80S 6QF, Intel Core i7-6820HK NVIDIA GeForce GTX 1080 (Desktop)Nvidia GeForce GTX 1080 Founders Edition, Intel Core i7-4790K
54 (42min - 66max ) fps-27%
NVIDIA GeForce GTX 980 TiAsus Strix GTX 980 Ti Desktop PC, Intel Core i7-4790K
46 (37min - 56max ) fps-38%
NVIDIA GeForce GTX 1070 (Desktop) Nvidia GeForce GTX 1070 Founders Edition, Intel Core i7-4790K
45.2 (35min - 55max ) fps-39%
AMD Radeon R9 FuryXFX Radeon R9 Fury Pro, Intel Core i7-4790K
38.7 (30min - 49max ) fps-48%
NVIDIA GeForce GTX 980MSchenker W504, Intel Core i7-4700MQ
NVIDIA Titan X Pascal Nvidia Titan X (Pascal), Intel Xeon E5-2680 v4 NVIDIA GeForce GTX 1080 (Desktop)Nvidia GeForce GTX 1080 Founders Edition, Intel Core i7-4790K
67 (64min - 70max ) fps-24%
NVIDIA GeForce GTX 1070 (Desktop) Nvidia GeForce GTX 1070 Founders Edition, Intel Core i7-4790K NVIDIA GeForce GTX 980 TiAsus Strix GTX 980 Ti Desktop PC, Intel Core i7-4790K
52.2 (49min - 55max ) fps-41%
NVIDIA GeForce GTX 980 SLI (Laptop) MSI GT80S 6QF, Intel Core i7-6820HK AMD Radeon R9 FuryXFX Radeon R9 Fury Pro, Intel Core i7-4790K
34.3 (32min - 36max ) fps-61%
NVIDIA GeForce GTX 980MSchenker W504, Intel Core i7-4700MQ
NVIDIA GeForce GTX 1080 (Desktop)Nvidia GeForce GTX 1080 Founders Edition, Intel Core i7-4790K
109 (81min - 150max ) fps+5%
NVIDIA Titan X Pascal Nvidia Titan X (Pascal), Intel Xeon E5-2680 v4
104.1 (54min - 156max ) fps
NVIDIA GeForce GTX 1070 (Desktop) Nvidia GeForce GTX 1070 Founders Edition, Intel Core i7-4790K
100 (53min - 133max ) fps-4%
NVIDIA GeForce GTX 980 TiAsus Strix GTX 980 Ti Desktop PC, Intel Core i7-4790K
87 (64min - 132max ) fps-16%
AMD Radeon R9 FuryXFX Radeon R9 Fury Pro, Intel Core i7-4790K
64 (50min - 82max ) fps-39%
NVIDIA GeForce GTX 1070 (Desktop) Nvidia GeForce GTX 1070 Founders Edition, Intel Core i7-4790K
137 (110min - 143max ) fps+41%
NVIDIA GeForce GTX 1080 (Desktop)Nvidia GeForce GTX 1080 Founders Edition, Intel Core i7-4790K
126 (99min - 154max ) fps+30%
NVIDIA GeForce GTX 980 TiAsus Strix GTX 980 Ti Desktop PC, Intel Core i7-4790K
109 (88min - 139max ) fps+12%
NVIDIA Titan X Pascal Nvidia Titan X (Pascal), Intel Xeon E5-2680 v4
97 (66.8min - 160.3max ) fps
NVIDIA GeForce GTX 980 SLI (Laptop) MSI GT80S 6QF, Intel Core i7-6820HK AMD Radeon R9 FuryXFX Radeon R9 Fury Pro, Intel Core i7-4790K
81 (53min - 104max ) fps-16%
NVIDIA GeForce GTX 980MSchenker W504, Intel Core i7-4700MQ
NVIDIA Titan X Pascal Nvidia Titan X (Pascal), Intel Xeon E5-2680 v4
95.5 (37.9min - 174.5max ) fps
NVIDIA GeForce GTX 980 TiAsus Strix GTX 980 Ti Desktop PC, Intel Core i7-4790K NVIDIA GeForce GTX 1080 (Desktop)Nvidia GeForce GTX 1080 Founders Edition, Intel Core i7-4790K
71.2 (11.6min - 170max ) fps-25%
NVIDIA GeForce GTX 1070 (Desktop) Nvidia GeForce GTX 1070 Founders Edition, Intel Core i7-4790K AMD Radeon R9 FuryXFX Radeon R9 Fury Pro, Intel Core i7-4790K NVIDIA GeForce GTX 980MSchenker W504, Intel Core i7-4700MQ
NVIDIA Titan X Pascal Nvidia Titan X (Pascal), Intel Xeon E5-2680 v4
126.2 (107min - 152max ) fps
NVIDIA GeForce GTX 980 SLI (Laptop) MSI GT80S 6QF, Intel Core i7-6820HK NVIDIA GeForce GTX 1080 (Desktop)Nvidia GeForce GTX 1080 Founders Edition, Intel Core i7-4790K NVIDIA GeForce GTX 980 TiAsus Strix GTX 980 Ti Desktop PC, Intel Core i7-4790K
70 (63min - 84max ) fps-45%
NVIDIA GeForce GTX 1070 (Desktop) Nvidia GeForce GTX 1070 Founders Edition, Intel Core i7-4790K
69.8 (61min - 83max ) fps-45%
AMD Radeon R9 FuryXFX Radeon R9 Fury Pro, Intel Core i7-4790K
56 (49min - 65max ) fps-56%
NVIDIA GeForce GTX 980MSchenker W504, Intel Core i7-4700MQ
NVIDIA Titan X Pascal Nvidia Titan X (Pascal), Intel Xeon E5-2680 v4 NVIDIA GeForce GTX 1080 (Desktop)Nvidia GeForce GTX 1080 Founders Edition, Intel Core i7-4790K NVIDIA GeForce GTX 980 SLI (Laptop) MSI GT80S 6QF, Intel Core i7-6820HK NVIDIA GeForce GTX 980 TiAsus Strix GTX 980 Ti Desktop PC, Intel Core i7-4790K
44 (39min - 49max ) fps-35%
NVIDIA GeForce GTX 1070 (Desktop) Nvidia GeForce GTX 1070 Founders Edition, Intel Core i7-4790K AMD Radeon R9 FuryXFX Radeon R9 Fury Pro, Intel Core i7-4790K
35.9 (32min - 39max ) fps-47%
NVIDIA GeForce GTX 980MSchenker W504, Intel Core i7-4700MQ
NVIDIA Titan X Pascal Nvidia Titan X (Pascal), Intel Xeon E5-2680 v4
165.8 (158min - 234max ) fps
NVIDIA GeForce GTX 1080 (Desktop)Nvidia GeForce GTX 1080 Founders Edition, Intel Core i7-4790K
104 (88min - 121max ) fps-37%
NVIDIA GeForce GTX 980 TiAsus Strix GTX 980 Ti Desktop PC, Intel Core i7-4790K
87 (75min - 101max ) fps-48%
NVIDIA GeForce GTX 1070 (Desktop) Nvidia GeForce GTX 1070 Founders Edition, Intel Core i7-4790K
85.5 (74min - 98max ) fps-48%
AMD Radeon R9 FuryXFX Radeon R9 Fury Pro, Intel Core i7-4790K
77 (64min - 91max ) fps-54%
NVIDIA GeForce GTX 980Desktop PC, Intel Core i7-6700K NVIDIA GeForce GTX 980MSchenker W504, Intel Core i7-4700MQ
NVIDIA Titan X Pascal Nvidia Titan X (Pascal), Intel Xeon E5-2680 v4
41.1 (35.6min - 47.6max ) fps
NVIDIA GeForce GTX 1080 (Desktop)Nvidia GeForce GTX 1080 Founders Edition, Intel Core i7-4790K
30.8 (26min - 36max ) fps-25%
NVIDIA GeForce GTX 1070 (Desktop) Nvidia GeForce GTX 1070 Founders Edition, Intel Core i7-4790K
28.3 (24min - 34max ) fps-31%
AMD Radeon R9 FuryXFX Radeon R9 Fury Pro, Intel Core i7-4790K
25.1 (11min - 34max ) fps-39%
NVIDIA GeForce GTX 980 TiAsus Strix GTX 980 Ti Desktop PC, Intel Core i7-4790K
24.8 (21.3min - 28.4max ) fps-40%
NVIDIA GeForce GTX 980Desktop PC, Intel Core i7-6700K NVIDIA GeForce GTX 980MSchenker W504, Intel Core i7-4700MQ
NVIDIA Titan X Pascal Nvidia Titan X (Pascal), Intel Xeon E5-2680 v4 NVIDIA GeForce GTX 1080 (Desktop)Nvidia GeForce GTX 1080 Founders Edition, Intel Core i7-4790K
58.5 (21min - 68max ) fps-27%
NVIDIA GeForce GTX 980 TiAsus Strix GTX 980 Ti Desktop PC, Intel Core i7-4790K
46.7 (38min - 53max ) fps-42%
AMD Radeon R9 FuryXFX Radeon R9 Fury Pro, Intel Core i7-4790K
35.7 (26min - 41max ) fps-55%
NVIDIA GeForce GTX 980Desktop PC, Intel Core i7-6700K NVIDIA GeForce GTX 980MSchenker W504, Intel Core i7-4700MQ
NVIDIA Titan X Pascal Nvidia Titan X (Pascal), Intel Xeon E5-2680 v4 NVIDIA GeForce GTX 1080 (Desktop)Nvidia GeForce GTX 1080 Founders Edition, Intel Core i7-4790K
208 (194min - 218max ) fps-23%
NVIDIA GeForce GTX 980 TiAsus Strix GTX 980 Ti Desktop PC, Intel Core i7-4790K AMD Radeon R9 FuryXFX Radeon R9 Fury Pro, Intel Core i7-4790K
157 (143min - 167max ) fps-42%
NVIDIA GeForce GTX 980 SLI (Laptop) MSI GT80S 6QF, Intel Core i7-6820HK NVIDIA GeForce GTX 980MSchenker W504, Intel Core i7-4700MQ
NVIDIA Titan X Pascal Nvidia Titan X (Pascal), Intel Xeon E5-2680 v4
106.9 (45.6min - 206.2max ) fps
NVIDIA GeForce GTX 1080 (Desktop)Nvidia GeForce GTX 1080 Founders Edition, Intel Core i7-4790K NVIDIA GeForce GTX 1070 (Desktop) Nvidia GeForce GTX 1070 Founders Edition, Intel Core i7-4790K
67.4 (52min - 88max ) fps-37%
NVIDIA GeForce GTX 980 TiAsus Strix GTX 980 Ti Desktop PC, Intel Core i7-4790K
67 (50min - 95max ) fps-37%
AMD Radeon R9 FuryXFX Radeon R9 Fury Pro, Intel Core i7-4790K
62 (47min - 76max ) fps-42%
NVIDIA GeForce GTX 980 SLI (Laptop) MSI GT80S 6QF, Intel Core i7-6820HK NVIDIA GeForce GTX 980Desktop PC, Intel Core i7-6700K NVIDIA GeForce GTX 980MSchenker W504, Intel Core i7-4700MQ
NVIDIA Titan X Pascal Nvidia Titan X (Pascal), Intel Xeon E5-2680 v4
86.4 (71min - 112max ) fps
NVIDIA GeForce GTX 1080 (Desktop)Nvidia GeForce GTX 1080 Founders Edition, Intel Core i7-4790K NVIDIA GeForce GTX 1070 (Desktop) Nvidia GeForce GTX 1070 Founders Edition, Intel Core i7-4790K
48.6 (42min - 60max ) fps-44%
NVIDIA GeForce GTX 980 TiAsus Strix GTX 980 Ti Desktop PC, Intel Core i7-4790K
46 (41min - 60max ) fps-47%
AMD Radeon R9 FuryXFX Radeon R9 Fury Pro, Intel Core i7-4790K
38.2 (33min - 51max ) fps-56%
NVIDIA GeForce GTX 980Desktop PC, Intel Core i7-6700K NVIDIA GeForce GTX 980MSchenker W504, Intel Core i7-4700MQ
NVIDIA Titan X Pascal Nvidia Titan X (Pascal), Intel Xeon E5-2680 v4 NVIDIA GeForce GTX 1080 (Desktop)Nvidia GeForce GTX 1080 Founders Edition, Intel Core i7-4790K
47 (44min - 50max ) fps-23%
NVIDIA GeForce GTX 980 TiAsus Strix GTX 980 Ti Desktop PC, Intel Core i7-4790K
38.3 (35min - 42max ) fps-37%
NVIDIA GeForce GTX 1070 (Desktop) Nvidia GeForce GTX 1070 Founders Edition, Intel Core i7-4790K
38.2 (35min - 41max ) fps-37%
AMD Radeon R9 FuryXFX Radeon R9 Fury Pro, Intel Core i7-4790K
31.5 (23min - 35max ) fps-48%
NVIDIA GeForce GTX 980Desktop PC, Intel Core i7-6700K NVIDIA GeForce GTX 980MSchenker W504, Intel Core i7-4700MQ
NVIDIA Titan X Pascal Nvidia Titan X (Pascal), Intel Xeon E5-2680 v4 NVIDIA GeForce GTX 1080 (Desktop)Nvidia GeForce GTX 1080 Founders Edition, Intel Core i7-4790K NVIDIA GeForce GTX 980 SLI (Laptop) MSI GT80S 6QF, Intel Core i7-6820HK NVIDIA GeForce GTX 980 (Laptop) SCHENKER XMG U716, Intel Core i7-6700 NVIDIA GeForce GTX 980 (Laptop) MSI GT72S 6QF, Intel Core i7-6820HK NVIDIA Quadro M5000M MSI WT72-6QM, Intel Xeon E3-1505M v5 NVIDIA Quadro M3000MSCHENKER W706, Intel Core i7-6700 1900x1060 Solidworks (sw-03) 48.75
1900x1060 Siemens NX (snx-02) 8.58
1900x1060 Showcase (showcase-01) 126.4
1900x1060 Medical (medical-01) 59.9
1900x1060 Maya (maya-04) 114.5
1900x1060 Energy (energy-01) 13.16
1900x1060 Creo (creo-01) 43.74
1900x1060 Catia (catia-04) 83.5
NVIDIA GeForce GTX 980 SLI (Laptop) MSI GT80S 6QF, Intel Core i7-6820HK NVIDIA Titan X Pascal Nvidia Titan X (Pascal), Intel Xeon E5-2680 v4 NVIDIA GeForce GTX 980 TiAsus Strix GTX 980 Ti Desktop PC, Intel Core i7-4790K NVIDIA GeForce GTX 1070 (Desktop) Nvidia GeForce GTX 1070 Founders Edition, Intel Core i7-4790K NVIDIA GeForce GTX 1080 (Desktop)Nvidia GeForce GTX 1080 Founders Edition, Intel Core i7-4790K NVIDIA GeForce GTX 980 (Laptop)Eurocom Sky DLX7, Intel Core i7-6700K AMD Radeon R9 FuryXFX Radeon R9 Fury Pro, Intel Core i7-4790K NVIDIA GeForce GTX 980M DogHouse Systems Mobius SS, Intel Core i7-6700K NVIDIA Titan X Pascal Nvidia Titan X (Pascal), Intel Xeon E5-2680 v4 NVIDIA GeForce GTX 980 SLI (Laptop) MSI GT80S 6QF, Intel Core i7-6820HK NVIDIA GeForce GTX 1070 (Desktop) Nvidia GeForce GTX 1070 Founders Edition, Intel Core i7-4790K NVIDIA GeForce GTX 1080 (Desktop)Nvidia GeForce GTX 1080 Founders Edition, Intel Core i7-4790K NVIDIA GeForce GTX 980 TiAsus Strix GTX 980 Ti Desktop PC, Intel Core i7-4790K AMD Radeon R9 FuryXFX Radeon R9 Fury Pro, Intel Core i7-4790K NVIDIA GeForce GTX 980 (Laptop)Eurocom Sky DLX7, Intel Core i7-6700K NVIDIA GeForce GTX 980M DogHouse Systems Mobius SS, Intel Core i7-6700K
NVIDIA Titan X Pascal Nvidia Titan X (Pascal), Intel Xeon E5-2680 v4 NVIDIA GeForce GTX 1080 (Desktop)Nvidia GeForce GTX 1080 Founders Edition, Intel Core i7-4790K NVIDIA GeForce GTX 1070 (Desktop) Nvidia GeForce GTX 1070 Founders Edition, Intel Core i7-4790K NVIDIA GeForce GTX 980 TiAsus Strix GTX 980 Ti Desktop PC, Intel Core i7-4790K NVIDIA GeForce GTX 980 (Laptop)Eurocom Sky DLX7, Intel Core i7-6700K NVIDIA GeForce GTX 980 SLI (Laptop) MSI GT80S 6QF, Intel Core i7-6820HK AMD Radeon R9 FuryXFX Radeon R9 Fury Pro, Intel Core i7-4790K NVIDIA GeForce GTX 980M DogHouse Systems Mobius SS, Intel Core i7-6700K NVIDIA Titan X Pascal Nvidia Titan X (Pascal), Intel Xeon E5-2680 v4 NVIDIA GeForce GTX 1080 (Desktop)Nvidia GeForce GTX 1080 Founders Edition, Intel Core i7-4790K AMD Radeon R9 FuryXFX Radeon R9 Fury Pro, Intel Core i7-4790K NVIDIA GeForce GTX 1070 (Desktop) Nvidia GeForce GTX 1070 Founders Edition, Intel Core i7-4790K NVIDIA GeForce GTX 980 TiAsus Strix GTX 980 Ti Desktop PC, Intel Core i7-4790K NVIDIA GeForce GTX 980 (Laptop)Eurocom Sky DLX7, Intel Core i7-6700K NVIDIA GeForce GTX 980 SLI (Laptop) MSI GT80S 6QF, Intel Core i7-6820HK NVIDIA GeForce GTX 980M DogHouse Systems Mobius SS, Intel Core i7-6700K NVIDIA Titan X Pascal Nvidia Titan X (Pascal), Intel Xeon E5-2680 v4 NVIDIA GeForce GTX 1080 (Desktop)Nvidia GeForce GTX 1080 Founders Edition, Intel Core i7-4790K NVIDIA GeForce GTX 1070 (Desktop) Nvidia GeForce GTX 1070 Founders Edition, Intel Core i7-4790K AMD Radeon R9 FuryXFX Radeon R9 Fury Pro, Intel Core i7-4790K NVIDIA GeForce GTX 980 TiAsus Strix GTX 980 Ti Desktop PC, Intel Core i7-4790K NVIDIA GeForce GTX 980 (Laptop)Eurocom Sky DLX7, Intel Core i7-6700K NVIDIA GeForce GTX 980 SLI (Laptop) MSI GT80S 6QF, Intel Core i7-6820HK NVIDIA GeForce GTX 980M DogHouse Systems Mobius SS, Intel Core i7-6700K NVIDIA Titan X Pascal Nvidia Titan X (Pascal), Intel Xeon E5-2680 v4 NVIDIA GeForce GTX 1080 (Desktop)Nvidia GeForce GTX 1080 Founders Edition, Intel Core i7-4790K NVIDIA GeForce GTX 1070 (Desktop) Nvidia GeForce GTX 1070 Founders Edition, Intel Core i7-4790K NVIDIA GeForce GTX 980 TiAsus Strix GTX 980 Ti Desktop PC, Intel Core i7-4790K AMD Radeon R9 FuryXFX Radeon R9 Fury Pro, Intel Core i7-4790K NVIDIA GeForce GTX 980 (Laptop)Eurocom Sky DLX7, Intel Core i7-6700K NVIDIA GeForce GTX 980 SLI (Laptop) MSI GT80S 6QF, Intel Core i7-6820HK NVIDIA GeForce GTX 980M DogHouse Systems Mobius SS, Intel Core i7-6700K NVIDIA Titan X Pascal Nvidia Titan X (Pascal), Intel Xeon E5-2680 v4 AMD Radeon R9 FuryXFX Radeon R9 Fury Pro, Intel Core i7-4790K NVIDIA GeForce GTX 1080 (Desktop)Nvidia GeForce GTX 1080 Founders Edition, Intel Core i7-4790K NVIDIA GeForce GTX 980 TiAsus Strix GTX 980 Ti Desktop PC, Intel Core i7-4790K NVIDIA GeForce GTX 1070 (Desktop) Nvidia GeForce GTX 1070 Founders Edition, Intel Core i7-4790K NVIDIA GeForce GTX 980 SLI (Laptop) MSI GT80S 6QF, Intel Core i7-6820HK NVIDIA GeForce GTX 980 (Laptop)Eurocom Sky DLX7, Intel Core i7-6700K NVIDIA GeForce GTX 980M DogHouse Systems Mobius SS, Intel Core i7-6700K NVIDIA Titan X Pascal Nvidia Titan X (Pascal), Intel Xeon E5-2680 v4 NVIDIA GeForce GTX 1080 (Desktop)Nvidia GeForce GTX 1080 Founders Edition, Intel Core i7-4790K NVIDIA GeForce GTX 1070 (Desktop) Nvidia GeForce GTX 1070 Founders Edition, Intel Core i7-4790K NVIDIA GeForce GTX 980 TiAsus Strix GTX 980 Ti Desktop PC, Intel Core i7-4790K AMD Radeon R9 FuryXFX Radeon R9 Fury Pro, Intel Core i7-4790K NVIDIA GeForce GTX 980 (Laptop)Eurocom Sky DLX7, Intel Core i7-6700K NVIDIA GeForce GTX 980 SLI (Laptop) MSI GT80S 6QF, Intel Core i7-6820HK NVIDIA GeForce GTX 980M DogHouse Systems Mobius SS, Intel Core i7-6700K
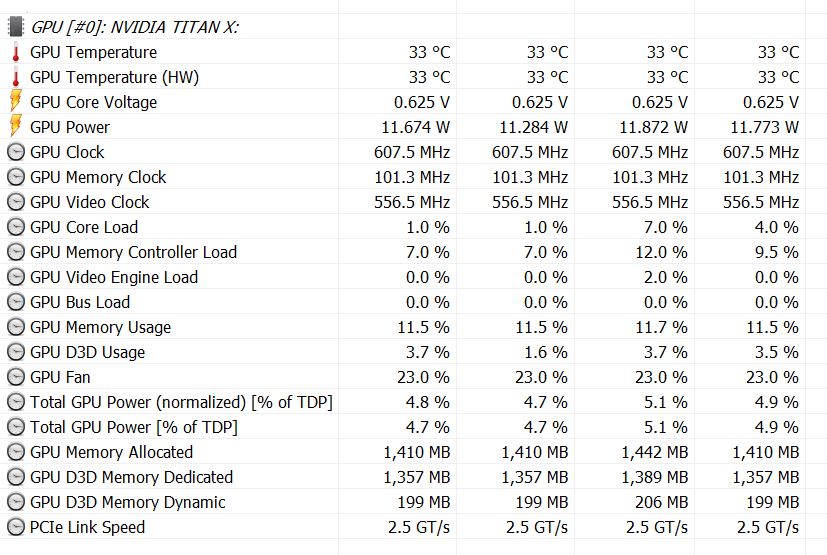
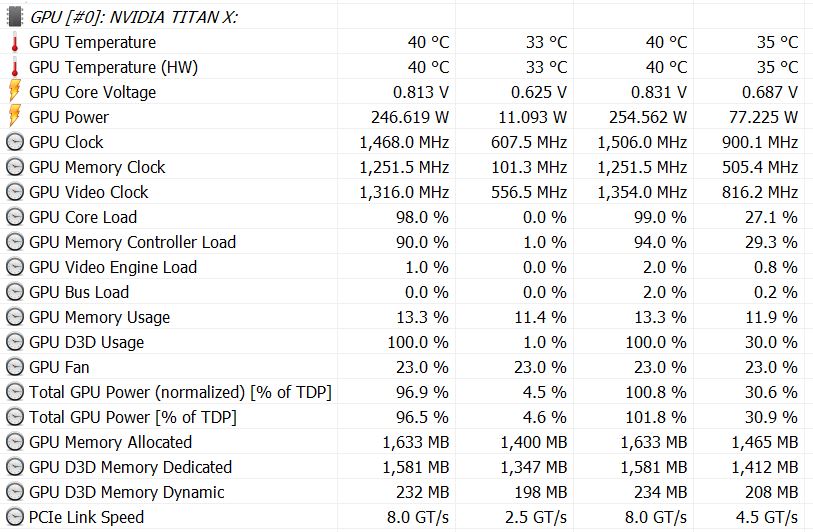
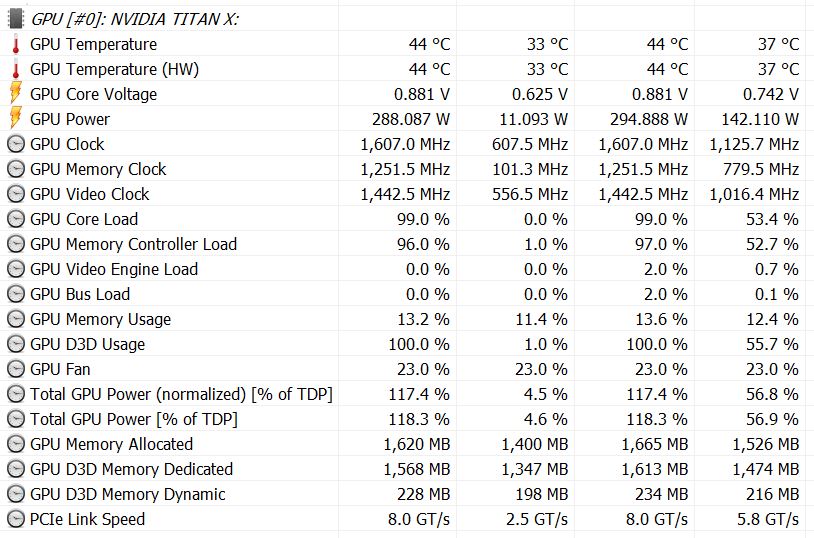
Power consumption when idling Power consumption under load (Power Target: 100%) Power consumption under load (Power Target: 120%) the Nvidia Titan X - the fastest consumer desktop GPU so far 考虑到1299欧元(约9623人民币)的售价,我们基本上放弃了对它性价比的考虑,英伟达为这块旗舰显卡标上的价码显然不能算是合理。不过,有特别需要的用户可能仍然会选择购买。不过,它相比英伟达 GeForce GTX 1080 Founder's Edition 高出500欧元的价位相比仅仅略高的性能有些让人难以理解。同时,GTX 1080显卡也有不少第三方版本,其中一些超频后的型号甚至提供了更高的性能。
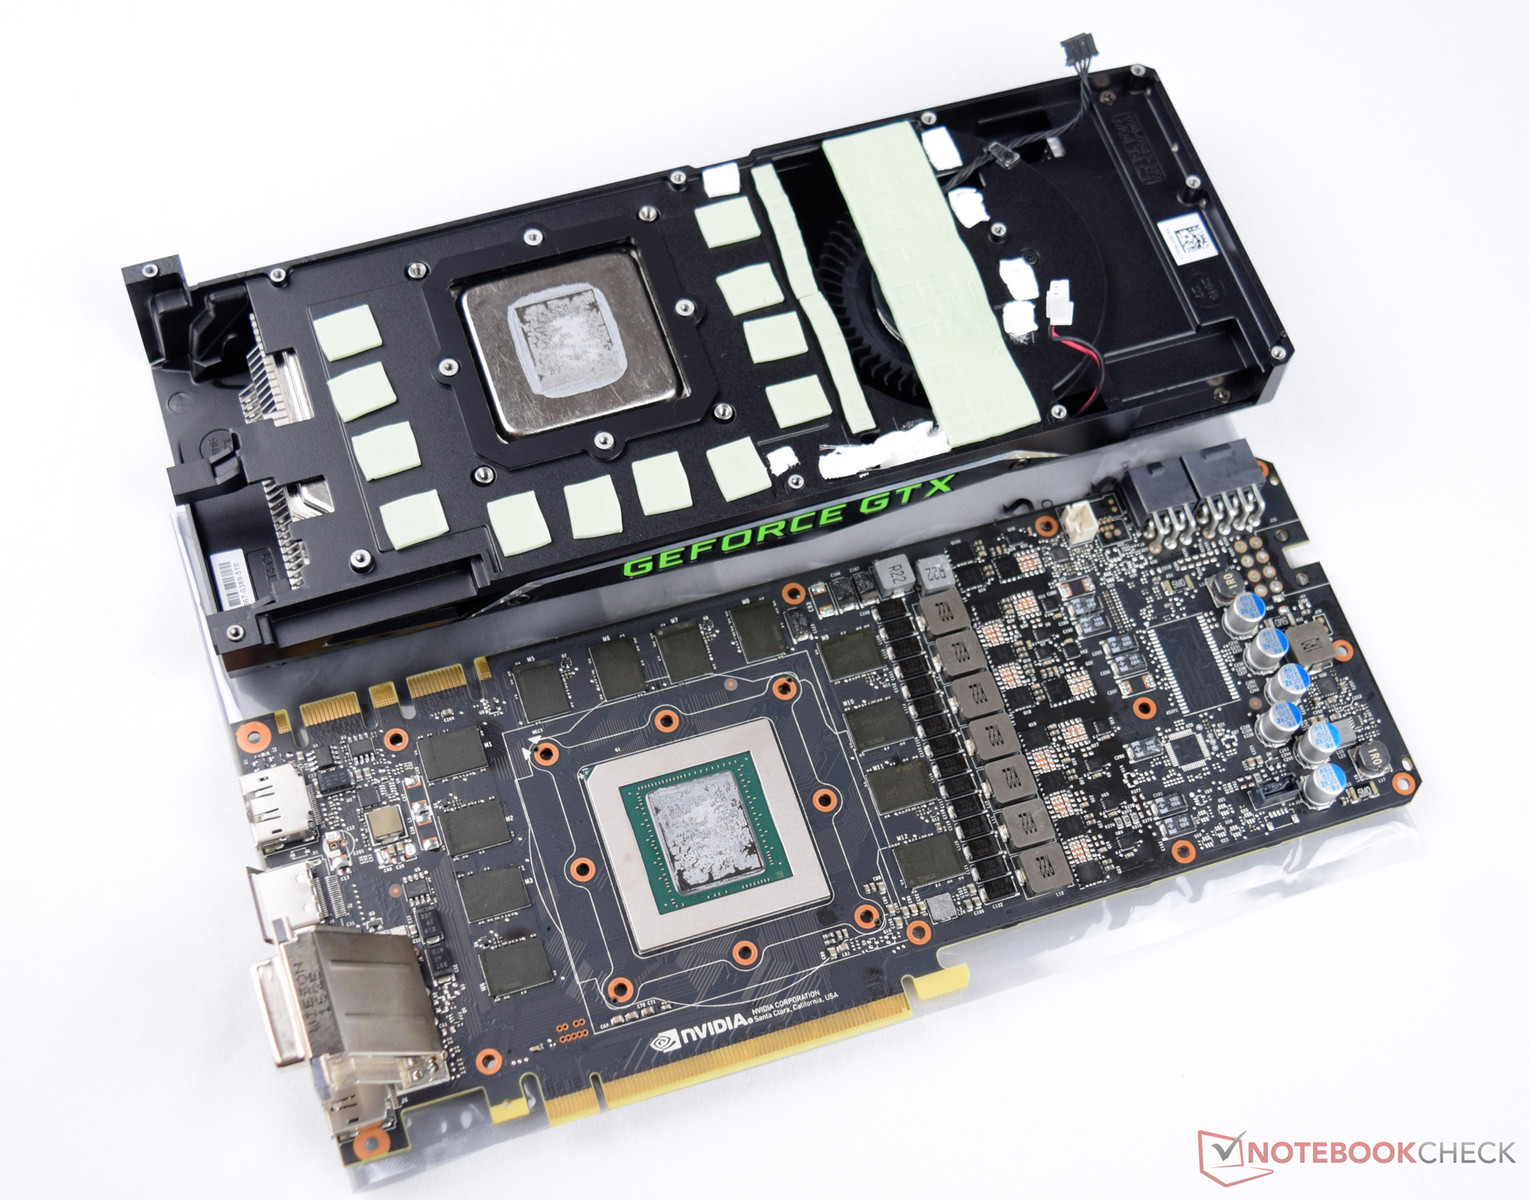
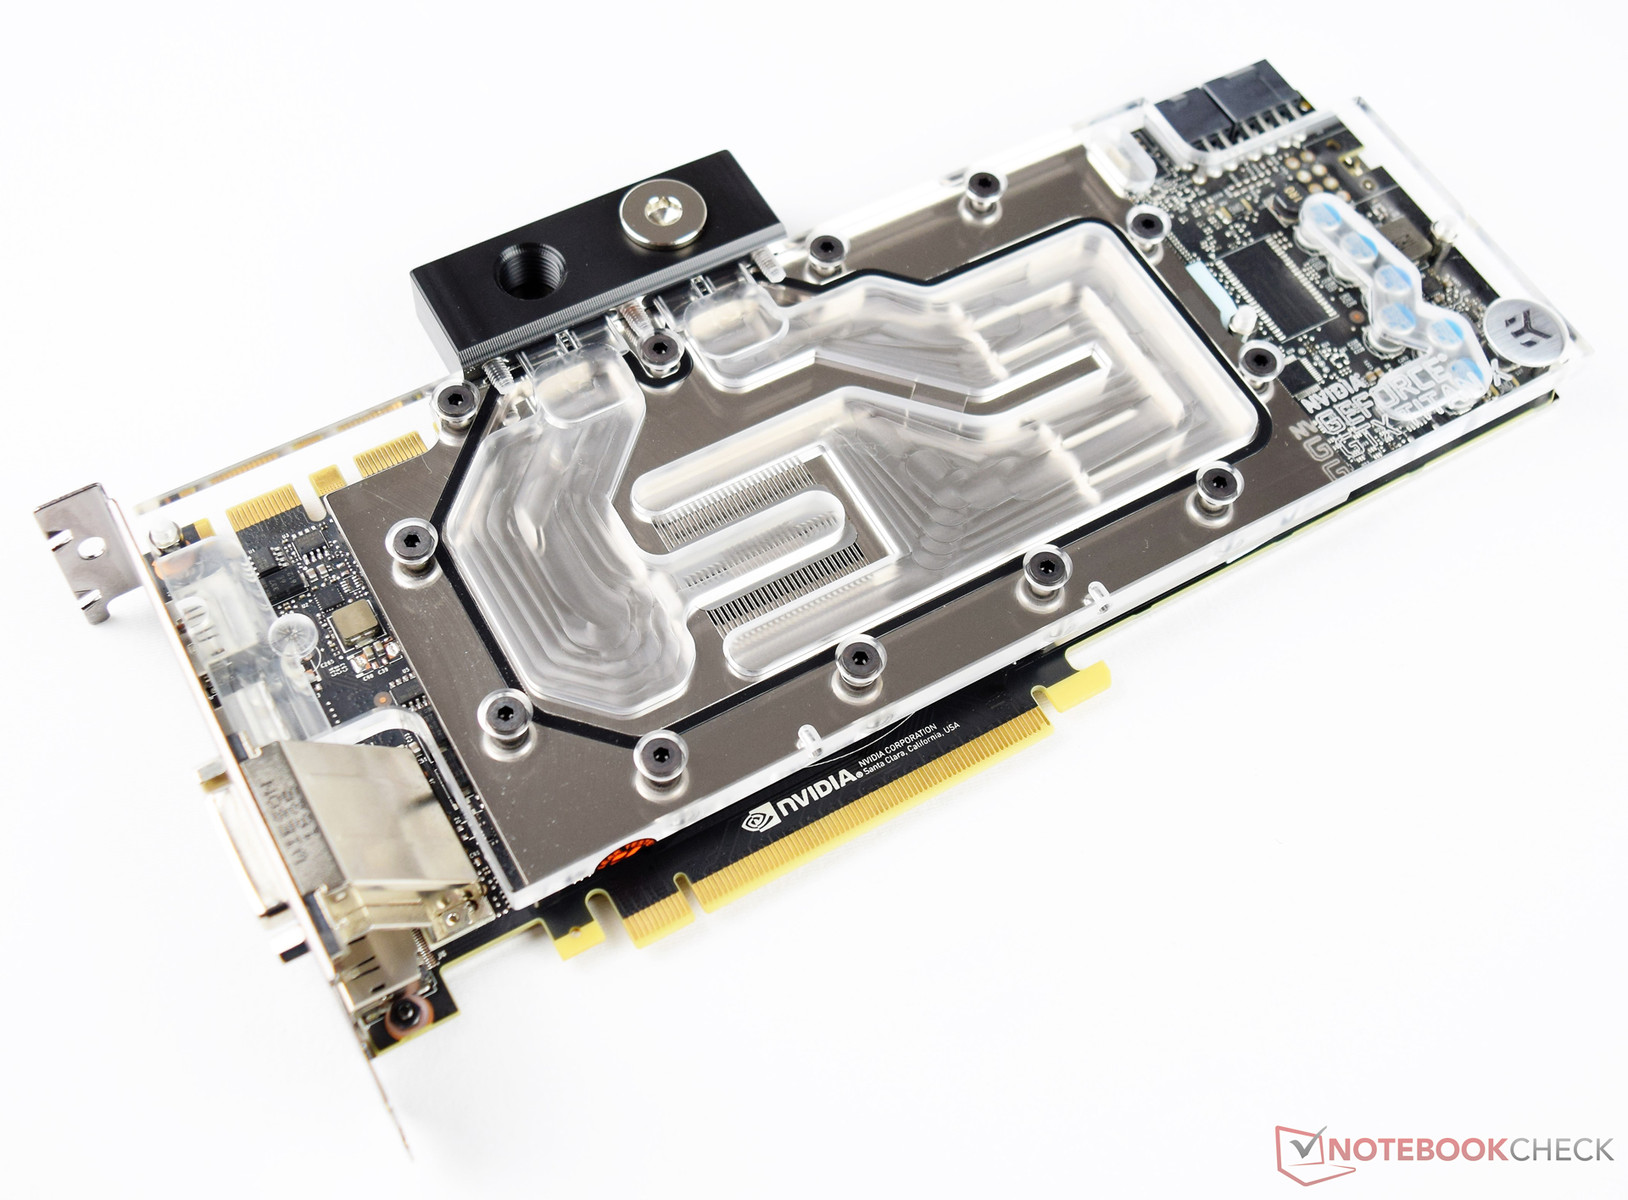
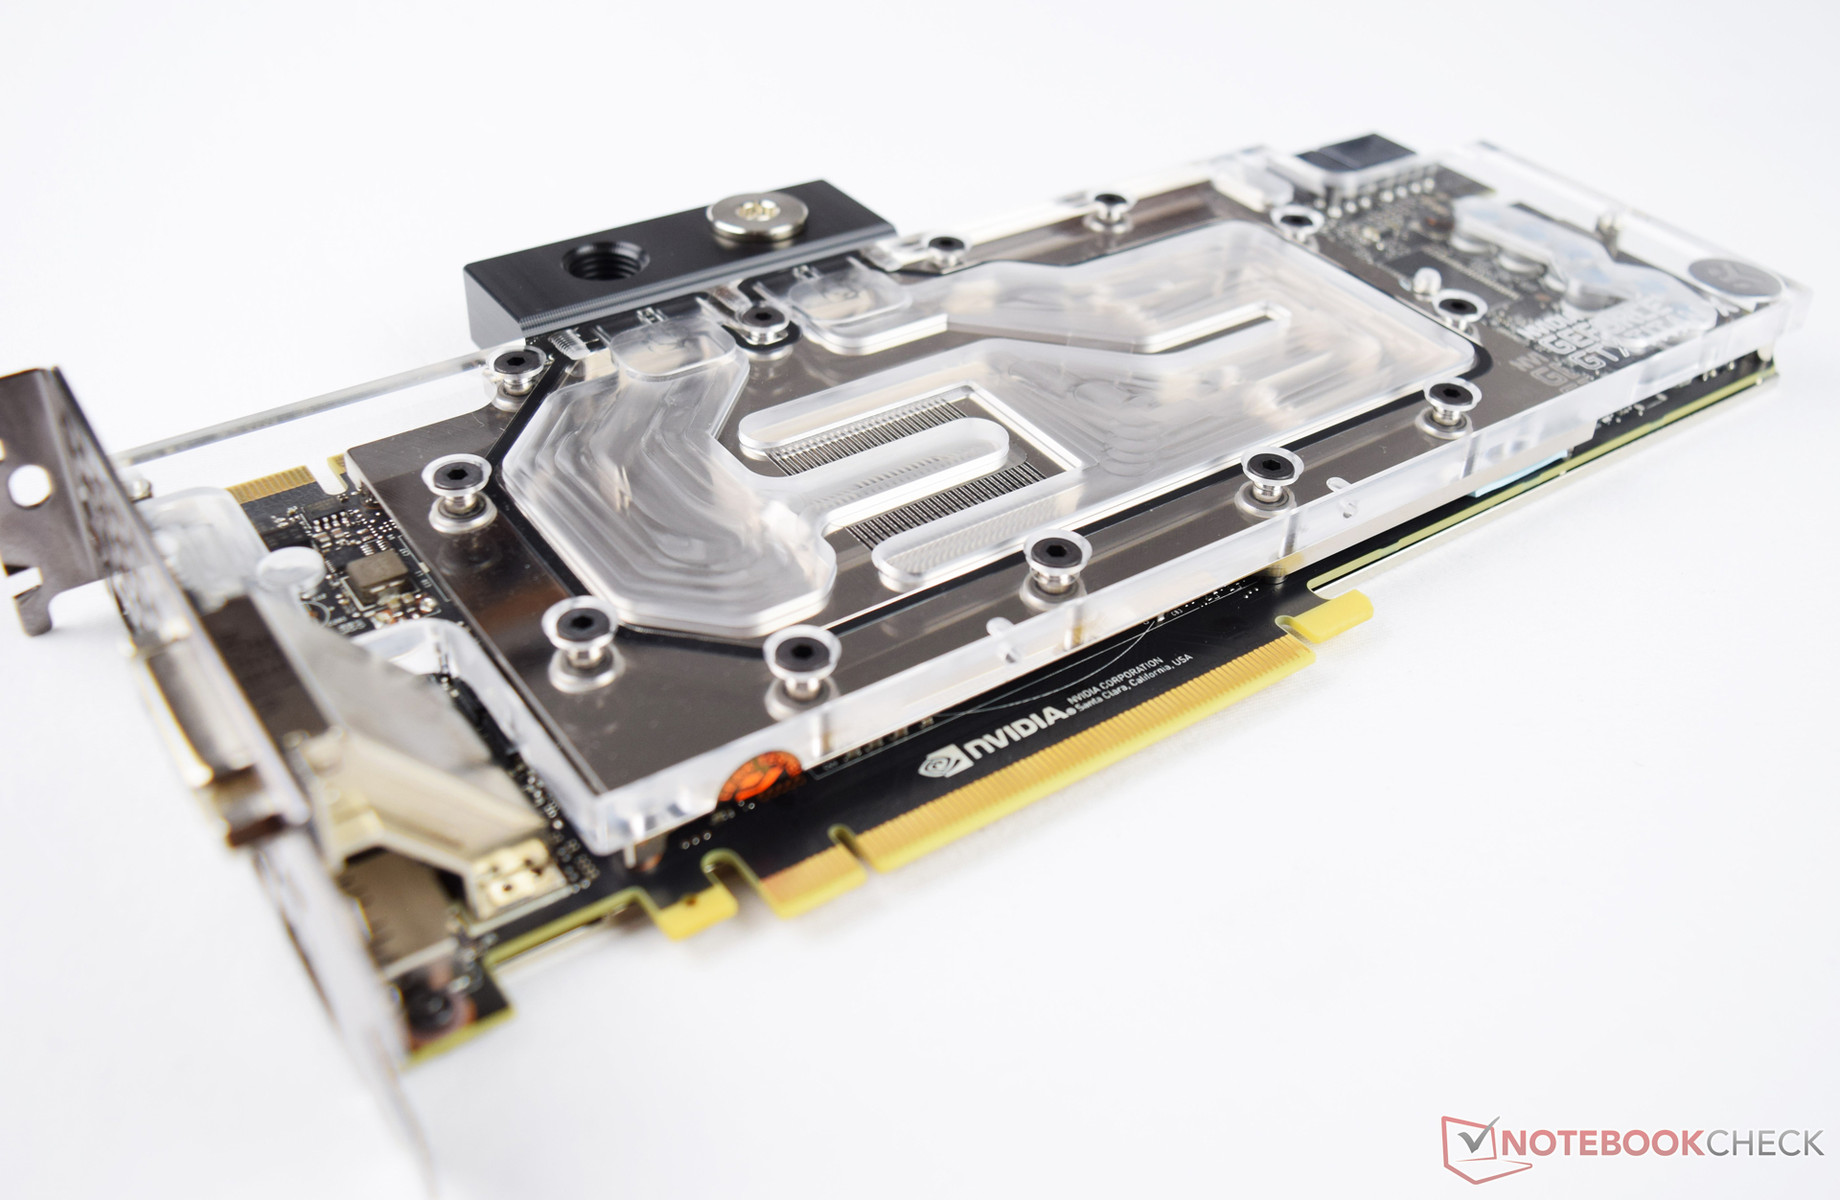
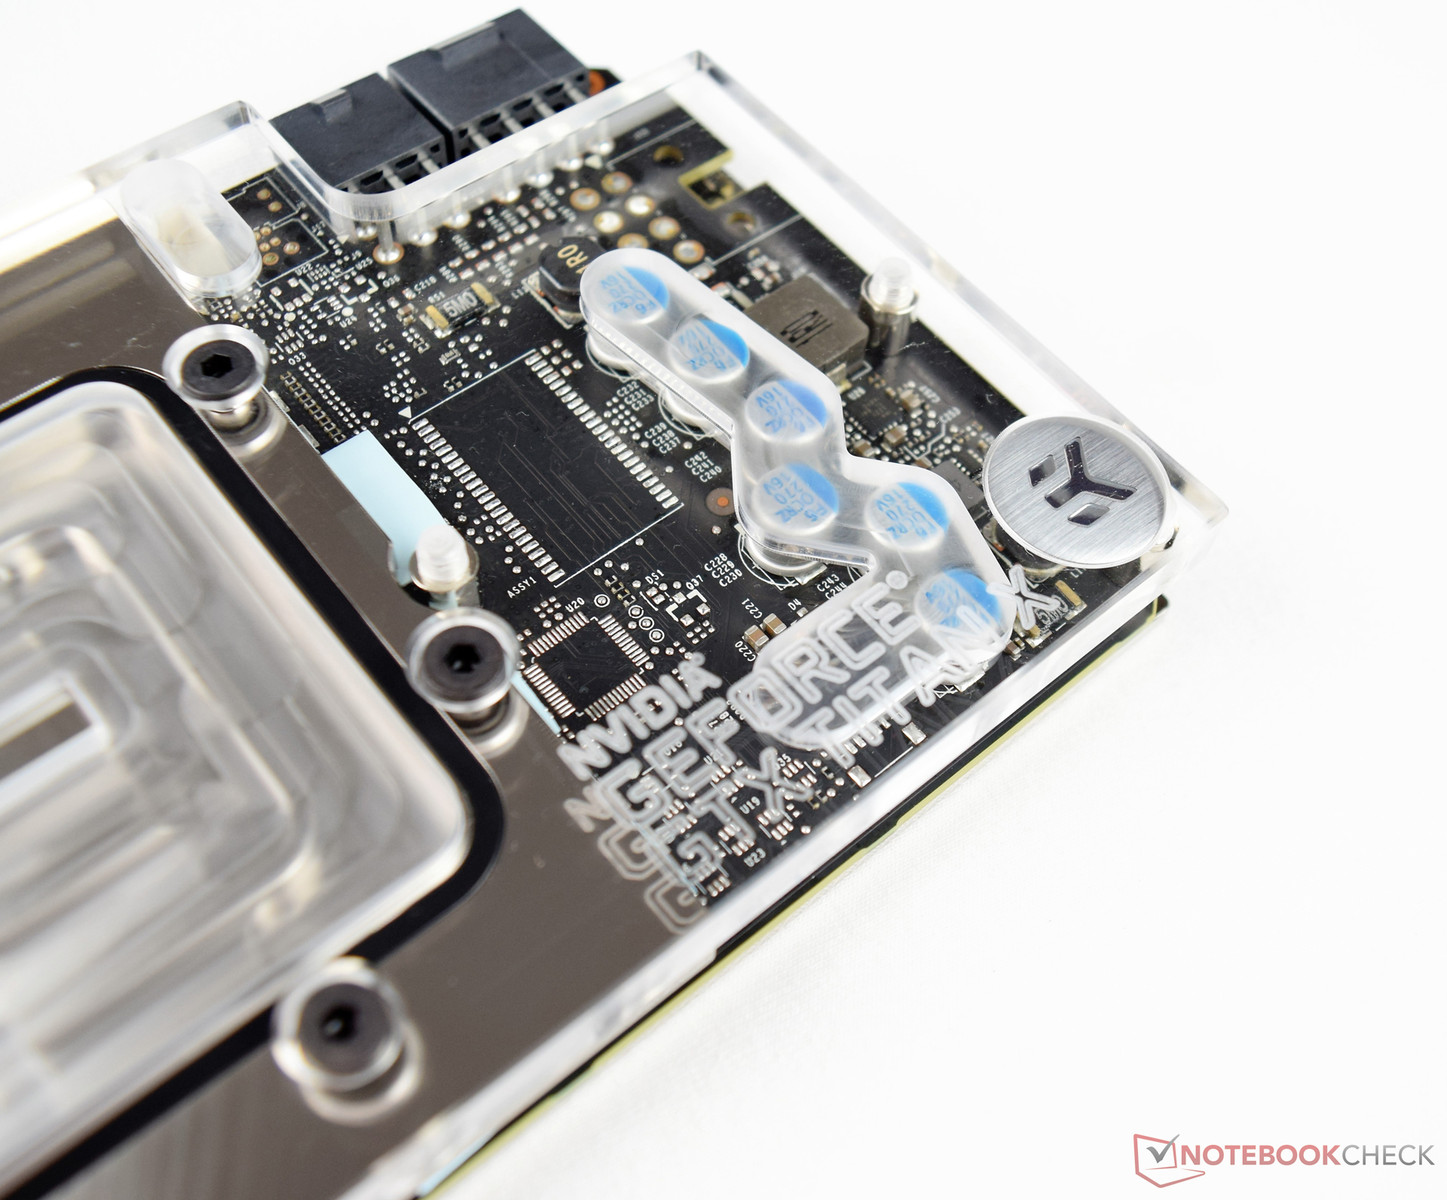
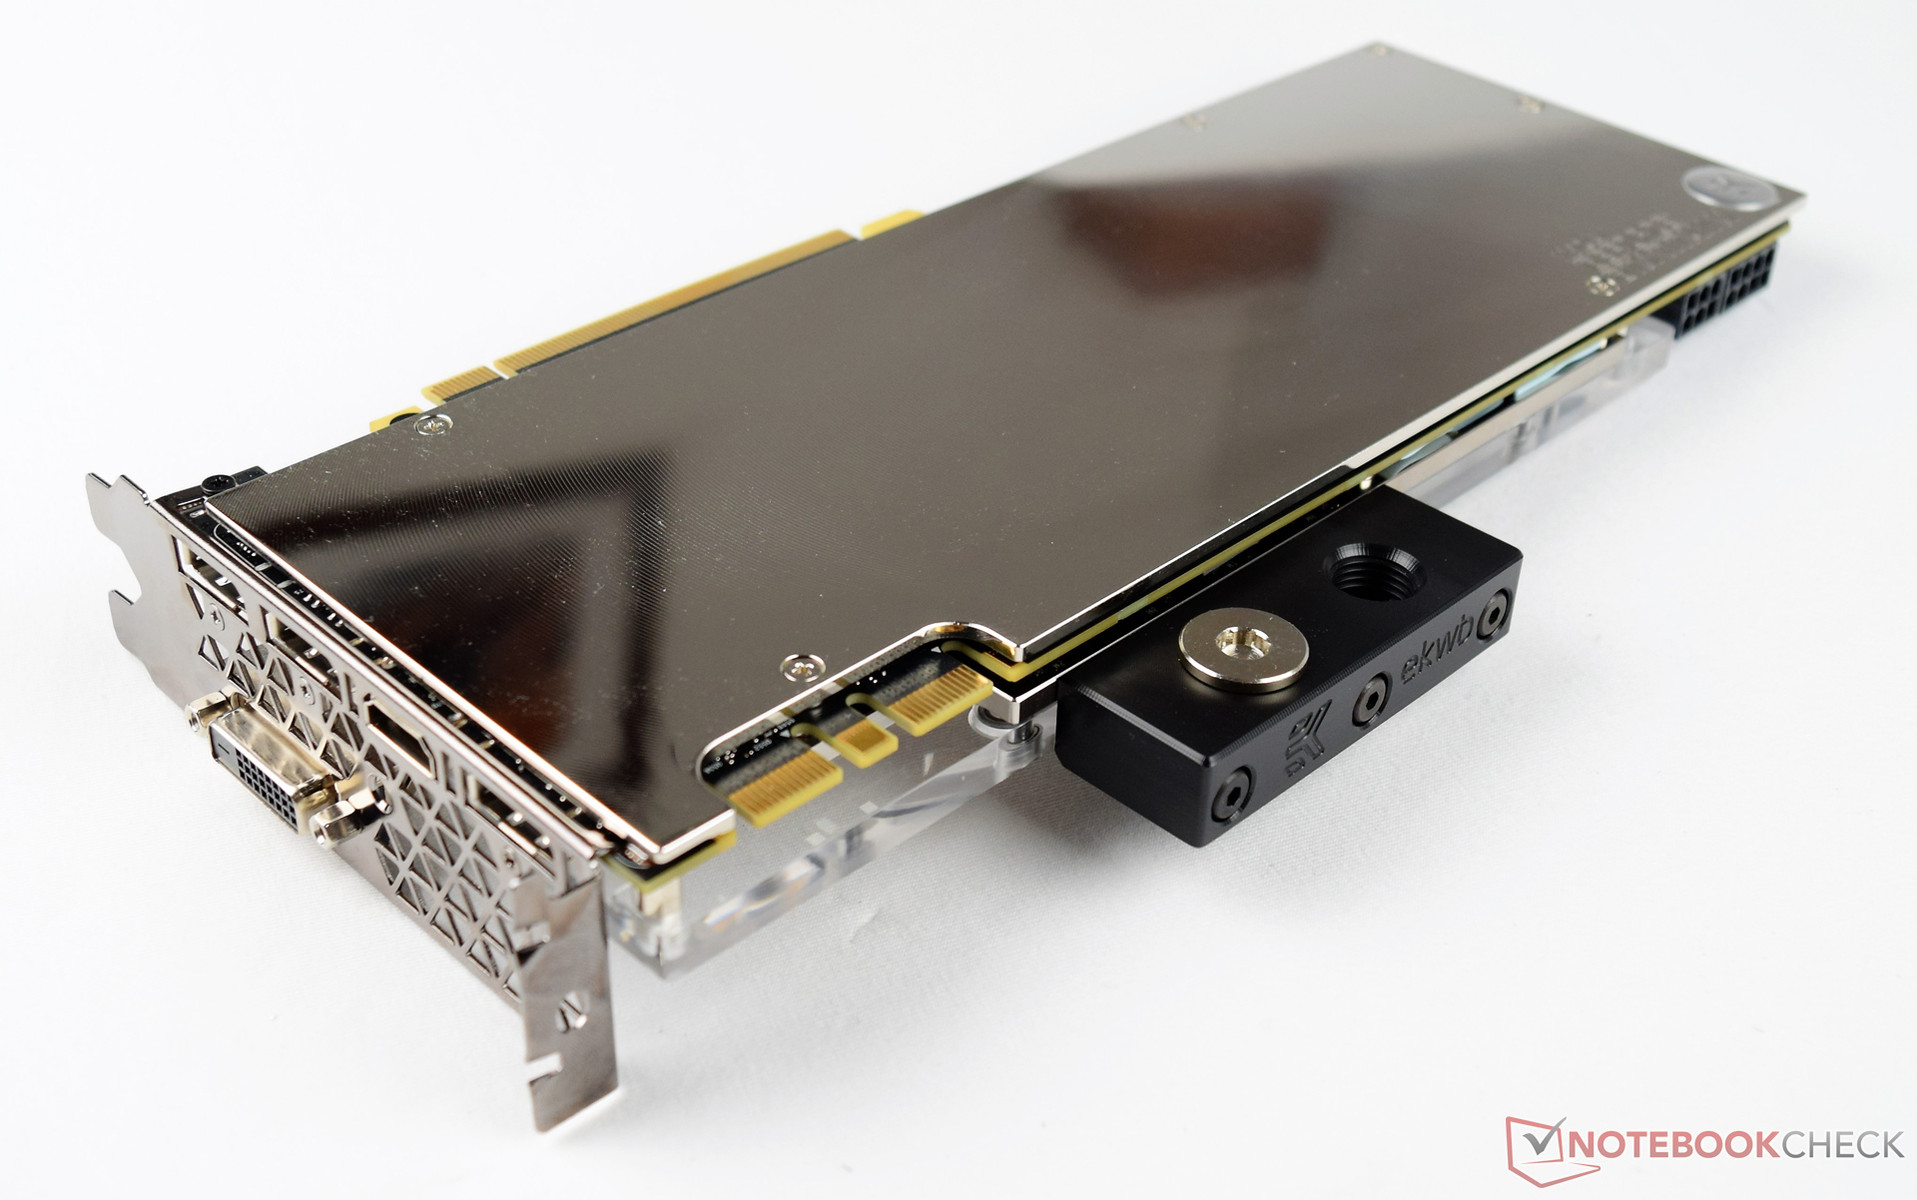
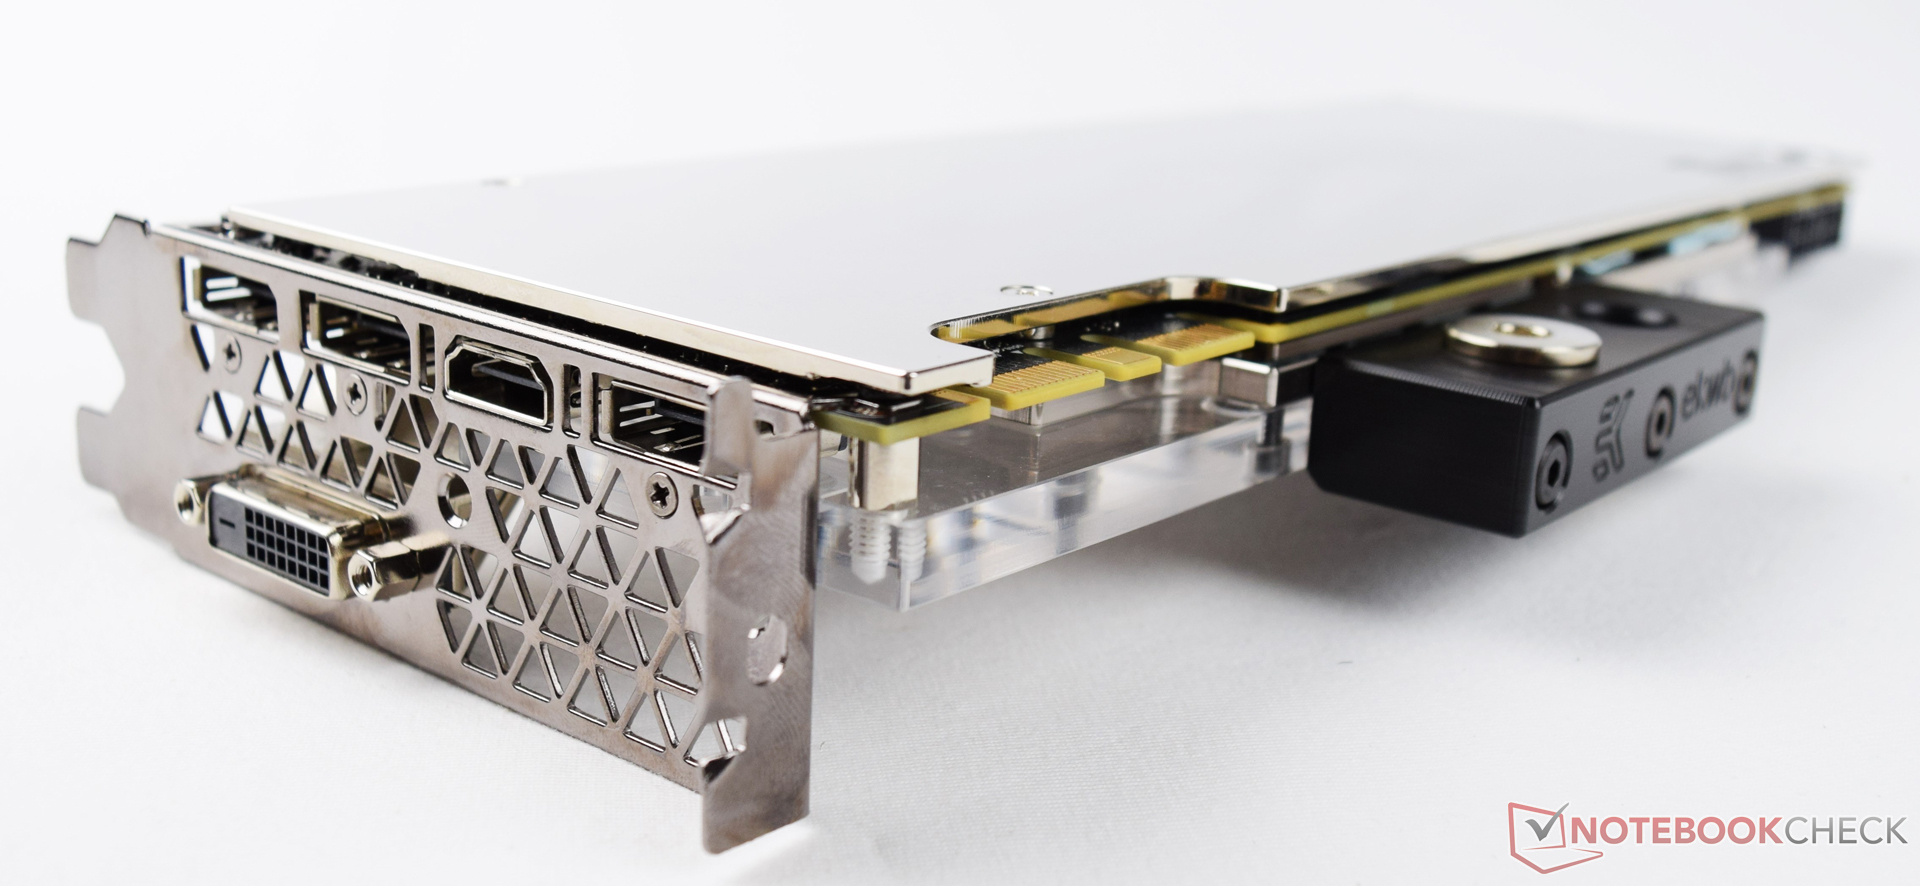
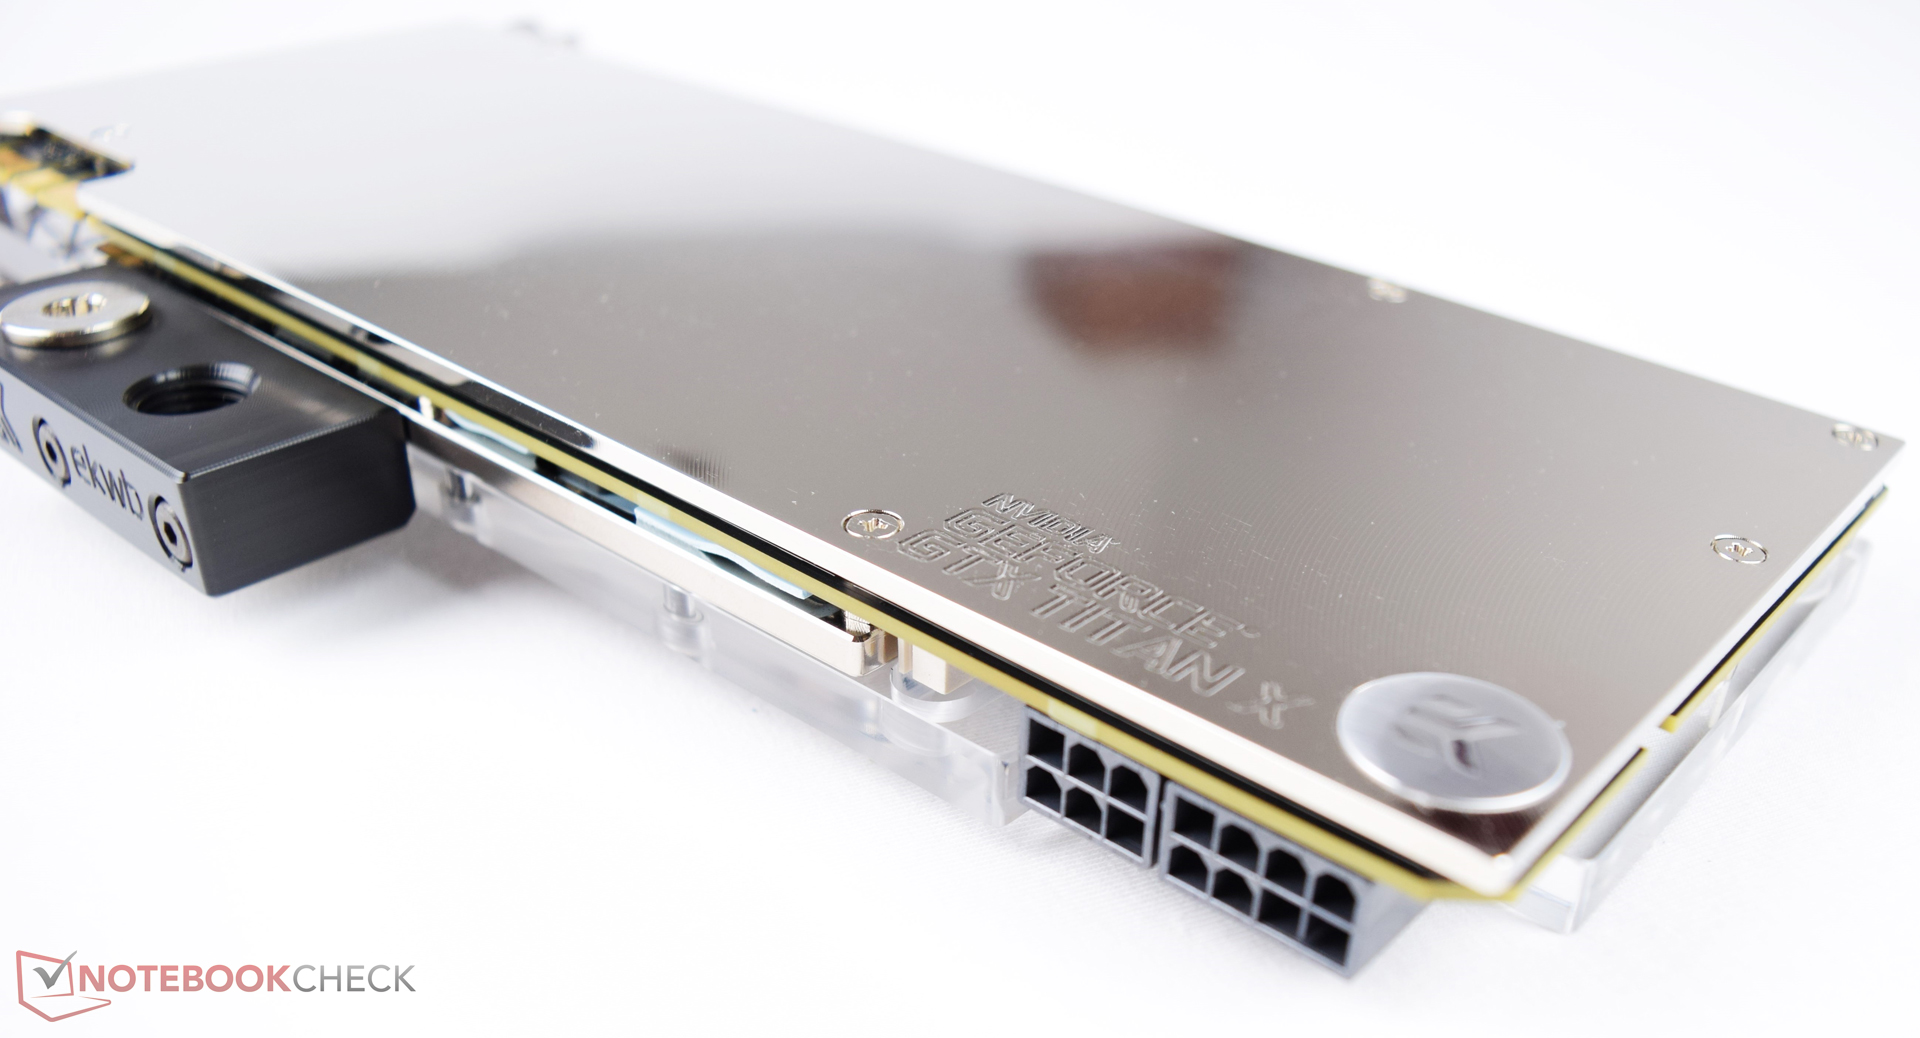
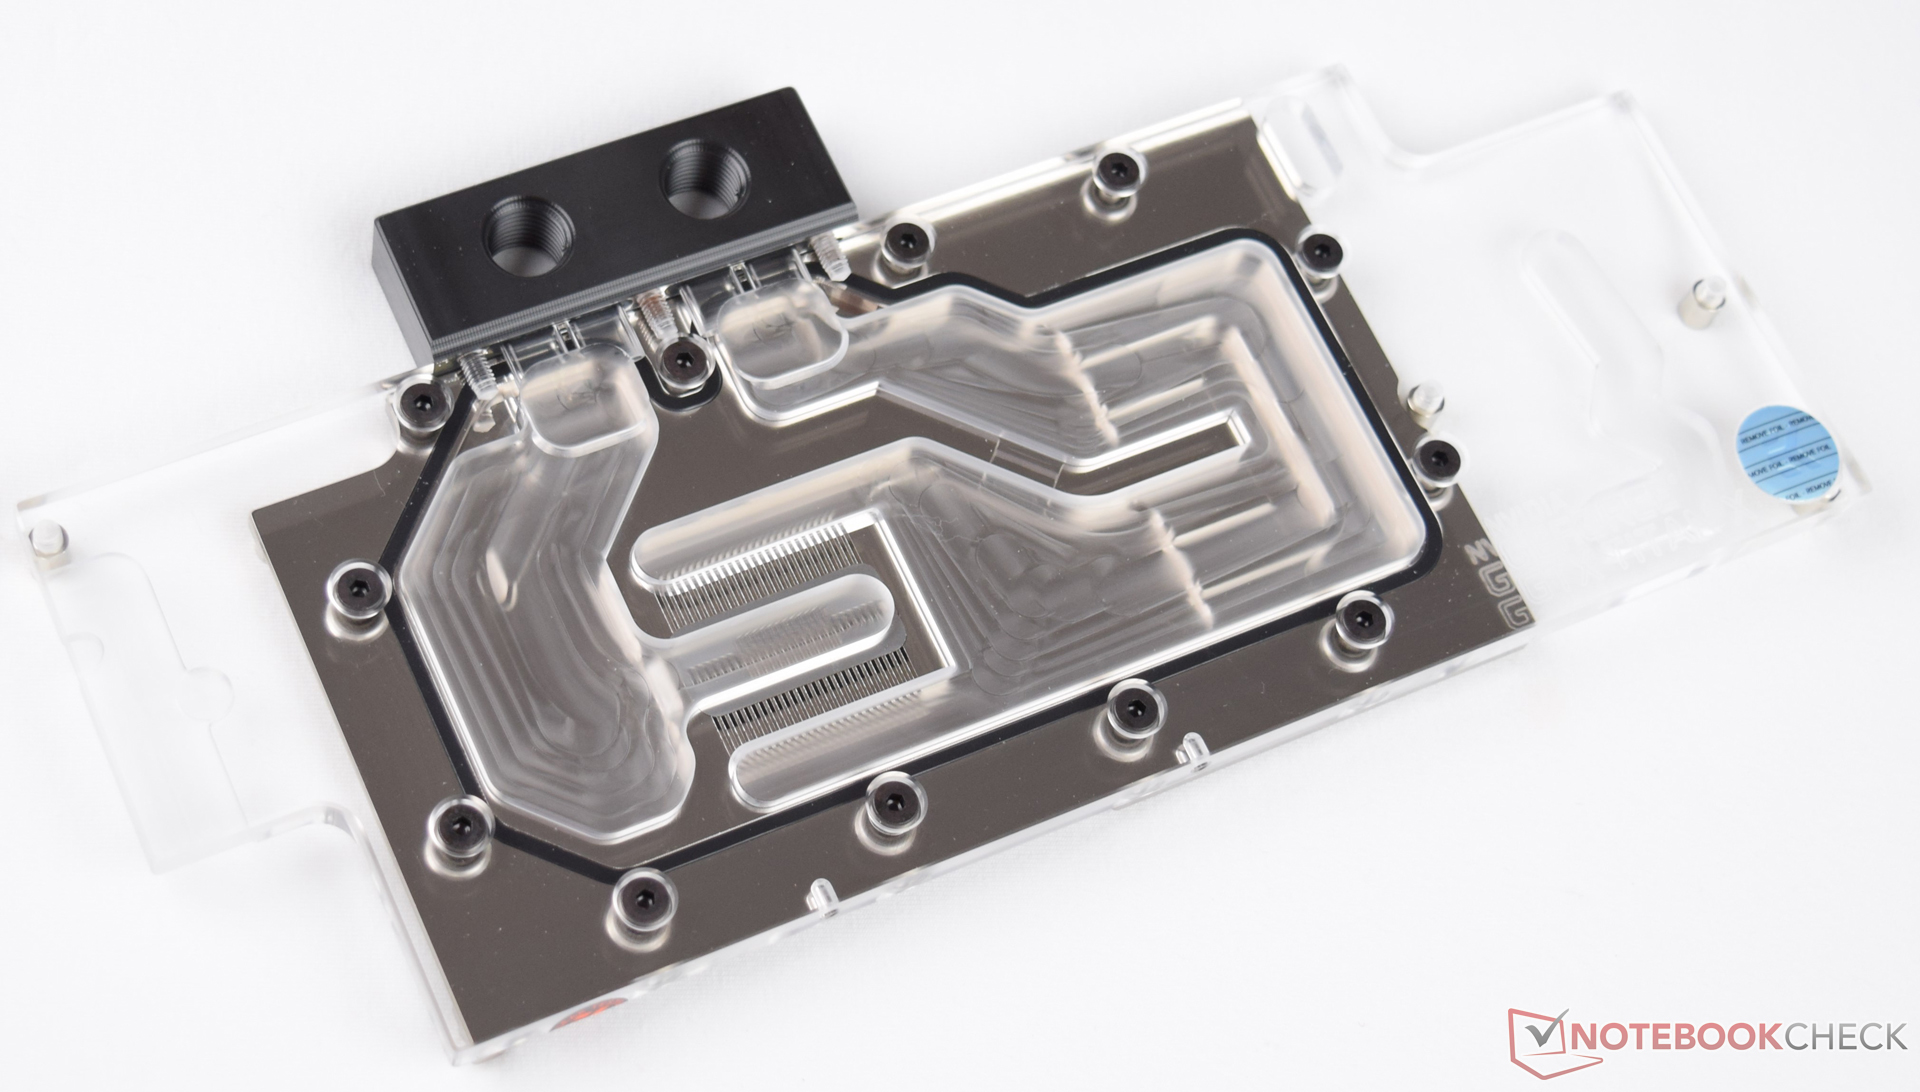
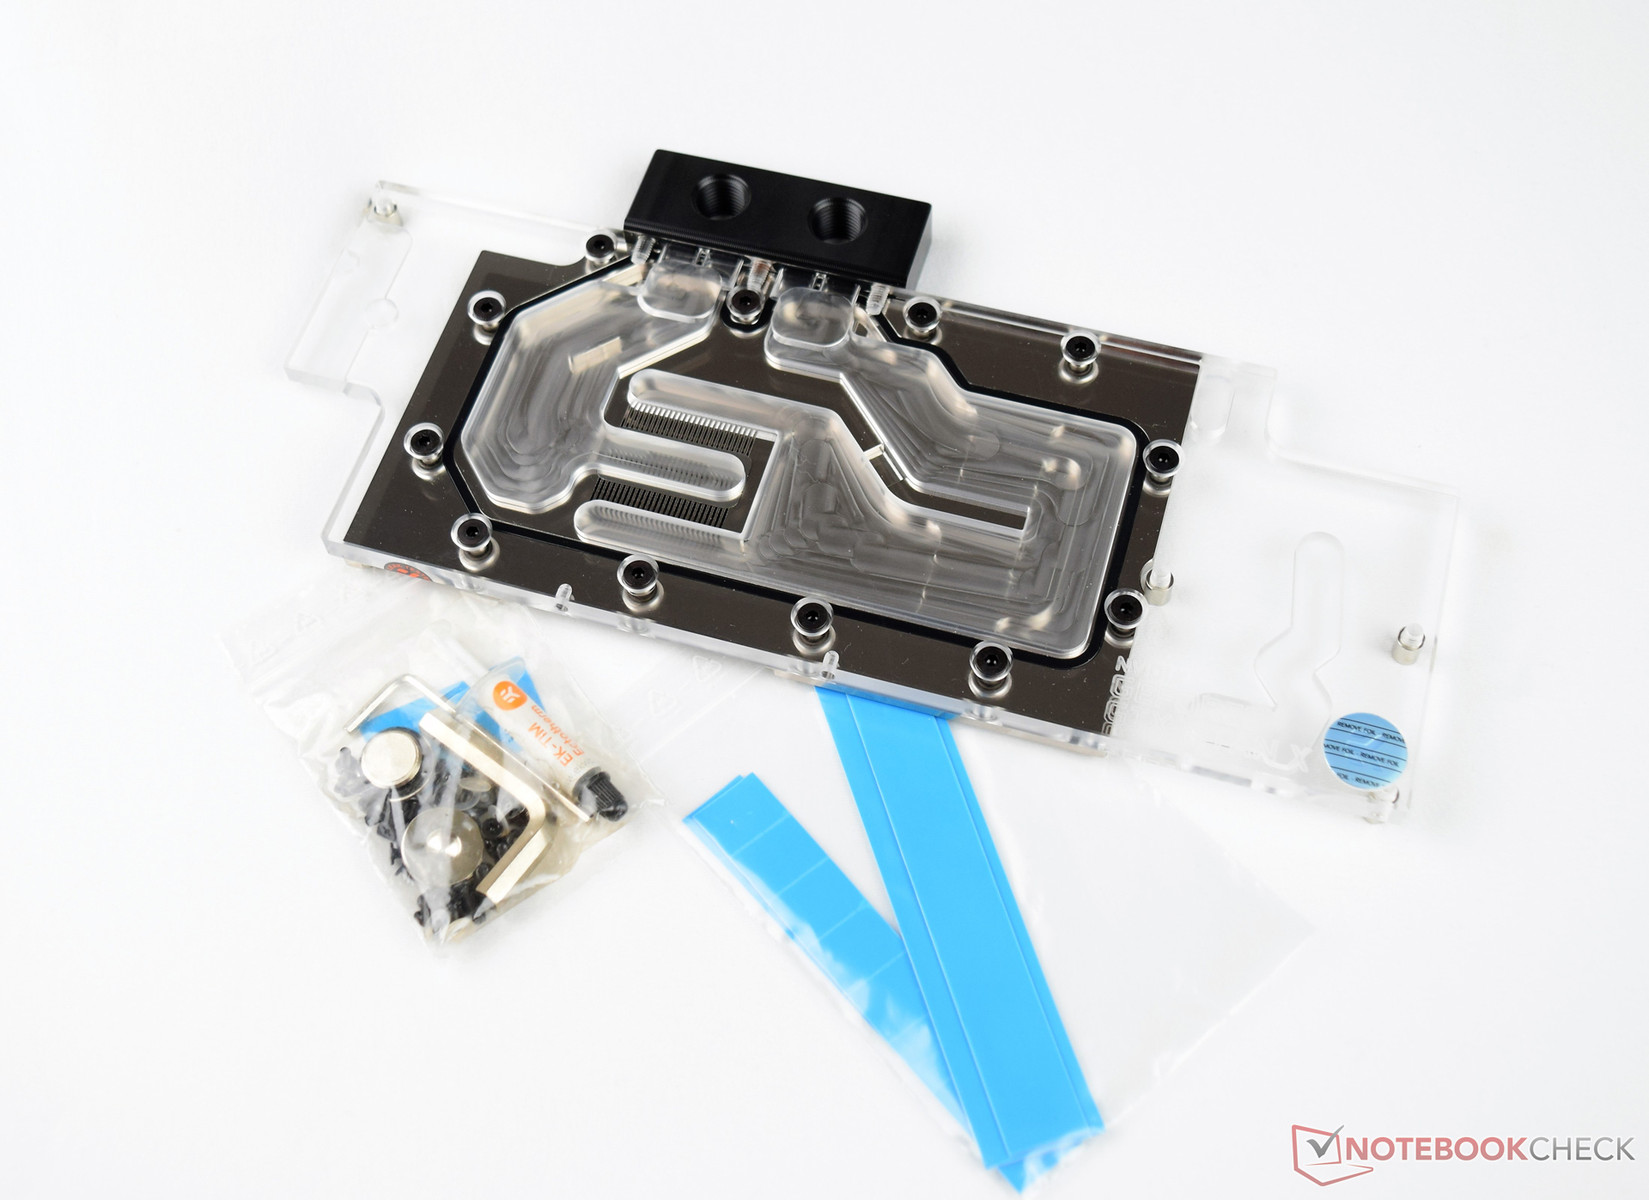
有勇气选择购买Nvidia Titan X (帕斯卡)的用户应该考虑增加一个水冷系统。这样较低的核心温度将会给Titan X带来更长的使用寿命。
如果不看售价只考虑性能的话,英伟达的Titan X确实为我们带来了目前最强的单显卡性能。只有多显卡系统如英伟达 GeForce GTX 1080 SLI可以胜过Titan X。不过,如果在没有SLI模式的情况下Titan X的表现确实更胜一筹。但是看到最新消息的用户可能听说了英伟达GeForce GTX 1080 Ti将会在未来几个月内上市。www.fudzilla.com 网站提到它可能会在CES 2017发布。它的技术特性可能与Titan X相近,不过GTX 1080 Ti将只搭配3328个CUDA核心(96个ROP/208个TMU)。这款显卡的核心频率可能会高于Titan X(1503 MHz, 加速后 1623 MHz)。英伟达GeForce GTX 1080 Ti的价位将会介于非Ti版本和这块测试显卡之间。那么谁才会是对这块显卡最感兴趣的用户呢?可能会是游戏玩家。只需要全高清或WQHD分辨率的玩家可能对英伟达 GeForce GTX 1080 和英伟达 GeForce GTX 1070 的性能会十分满意。目前,Titan X只会对需要UHD分辨率高设置无卡帧的流畅游戏有一定意义。
注:本文是基于完整评测的缩减版本,阅读完整的英文评测,请点击这里 。
Benchmarks Performance Rating - 3DMark 11 + Fire Strike + Time Spy
12.4 pt (37%)
...
AMD Radeon RX 5700 XT (Desktop)
NVIDIA GeForce RTX 3060 Ti
AMD Radeon VII
NVIDIA RTX A6000
NVIDIA GeForce RTX 2080 (Desktop)
4x NVIDIA RTX A6000
AMD Radeon Pro W6800
...
3DMark - 3DMark Time Spy Score
min: 8942 avg: 9451 median: 9417 (27%) max: 9877 Points
...
NVIDIA GeForce RTX 2060 Super (Desktop)
AMD Radeon RX 5700 XT (Desktop)
AMD Radeon VII
NVIDIA GeForce RTX 3060 Ti
...
3DMark - 3DMark Time Spy Graphics
min: 9031 avg: 9203 median: 9076 (24%) max: 9635 Points
...
AMD Radeon RX 5700 XT (Desktop)
NVIDIA GeForce RTX 2060 Super (Desktop)
AMD Radeon VII
...
3DMark - 3DMark Ice Storm Unlimited Graphics
min: 238961 avg: 526905 median: 496070 (56%) max: 796701 Points
...
AMD Radeon RX 6650 XT
NVIDIA GeForce RTX 2060 Super (Desktop)
AMD Radeon RX 5700 XT (Desktop)
NVIDIA GeForce GTX 1660 (Desktop)
AMD Radeon RX 5700 (Desktop)
AMD Radeon RX 6750 XT
NVIDIA GeForce RTX 3060
AMD Radeon RX 5600 XT (Desktop)
...
3DMark - 3DMark Ice Storm Extreme Graphics
min: 215098 avg: 382871 median: 365538 (47%) max: 546817 Points
Vivante GC1000+ Dual-Core
...
NVIDIA GeForce RTX 2080 (Desktop)
NVIDIA GeForce RTX 3060
AMD Radeon RX 5600 XT (Desktop)
AMD Radeon RX 5700 (Desktop)
AMD Radeon RX 5700 XT (Desktop)
AMD Radeon Pro W6800
...
3DMark - 3DMark Cloud Gate Score
min: 36851 avg: 57843 median: 58418 (62%) max: 75037 Points
Intel Graphics Media Accelerator (GMA) 4500MHD
...
NVIDIA GeForce RTX 2060 Super (Desktop)
NVIDIA GeForce GTX 1660 Super (Desktop)
AMD Radeon VII
NVIDIA Titan RTX
AMD Radeon RX 5600 XT (Desktop)
AMD Radeon RX 5700 XT (Desktop)
AMD Radeon RX 5700 (Desktop)
...
3DMark - 3DMark Cloud Gate Graphics
min: 102781 avg: 131615 median: 135092 (36%) max: 153552 Points
Intel Graphics Media Accelerator (GMA) 4500MHD
...
NVIDIA GeForce GTX 1080 Mobile
NVIDIA GeForce RTX 3060 Ti
AMD Radeon RX Vega 56
AMD Radeon RX 5700 (Desktop)
NVIDIA GeForce GTX 1070 SLI (Desktop)
NVIDIA GeForce RTX 2080 Super Mobile
...
3DMark - 3DMark Fire Strike Standard Score
min: 19107 avg: 23634 median: 23165 (41%) max: 26925 Points
...
AMD Radeon RX 5700 XT (Desktop)
AMD Radeon R9 Fury
AMD Radeon Pro W6800
4x NVIDIA RTX A6000
NVIDIA RTX A6000
...
3DMark - 3DMark Fire Strike Standard Graphics
min: 25642 avg: 26877 median: 27315.5 (31%) max: 27864 Points
...
AMD Radeon RX 5700 XT (Desktop)
AMD Radeon VII
NVIDIA RTX A6000
NVIDIA GeForce RTX 2080 (Desktop)
...
3DMark - 3DMark Ice Storm Graphics
min: 226697 avg: 431186 median: 405420 (49%) max: 627765 Points
...
4x NVIDIA RTX A6000
AMD Radeon RX 5700 (Desktop)
AMD Radeon RX 5600 XT (Desktop)
NVIDIA GeForce RTX 3060
AMD Radeon RX 5700 XT (Desktop)
NVIDIA RTX A6000
...
3DMark - 3DMark Wild Life Unlimited
65616 Points (33%)
...
NVIDIA GeForce RTX 2070 Super Mobile
AMD Radeon RX 5600 XT (Desktop)
AMD Radeon RX 5700 (Desktop)
NVIDIA GeForce RTX 2060 Super (Desktop)
AMD Radeon RX 5700 XT (Desktop)
Apple M1 Max 32-Core GPU
NVIDIA GeForce RTX 3060 Ti
AMD Radeon RX 6750 XT
...
3DMark - 3DMark Night Raid
min: 52892 avg: 54141 median: 54141 (51%) max: 55390 Points
...
4x NVIDIA RTX A6000
NVIDIA GeForce RTX 3060
AMD Radeon RX 5600 XT (Desktop)
AMD Radeon VII
AMD Radeon Pro W6800
NVIDIA GeForce RTX 3060 Ti
...
3DMark - 3DMark Night Raid Graphics Score
min: 102111 avg: 104649 median: 104649 (40%) max: 107187 Points
...
AMD Radeon RX 5700 XT (Desktop)
AMD Radeon VII
4x NVIDIA RTX A6000
NVIDIA GeForce RTX 3060 Ti
AMD Radeon RX 6650 XT
NVIDIA Titan RTX
...
3DMark 11 - 3DM11 Performance Score
min: 23186 avg: 29573 median: 30628 (42%) max: 35183 Points
...
AMD Radeon RX 5600 XT (Desktop)
NVIDIA GeForce RTX 2080 Super Mobile
NVIDIA GeForce RTX 2080 (Desktop)
AMD Radeon RX 5700 XT (Desktop)
4x NVIDIA RTX A6000
AMD Radeon Pro W6800
NVIDIA GeForce RTX 3060 Ti
...
3DMark 11 - 3DM11 Performance GPU
min: 27632 avg: 34424 median: 35995 (31%) max: 37012 Points
...
AMD Radeon RX 5600 XT (Desktop)
AMD Radeon RX 5700 XT (Desktop)
NVIDIA GeForce RTX 2080 Super Mobile
NVIDIA GeForce RTX 3060 Ti
...
3DMark Vantage + 3DMark Vantage - 3DM Vant. Perf. total
min: 97575 avg: 100949 median: 100948 (29%) max: 104322 Points
...
AMD Radeon RX 5700 (Desktop)
NVIDIA Titan RTX
AMD Radeon RX 6650 XT
AMD Radeon RX 6750 XT
AMD Radeon RX 6700 XT
...
NVIDIA T600
3DM Vant. Perf. GPU no PhysX + 3DMark Vantage - 3DM Vant. Perf. GPU no PhysX
min: 103537 avg: 103837 median: 103837 (59%) max: 104137 Points
...
NVIDIA Titan RTX
NVIDIA RTX A6000
AMD Radeon RX 6650 XT
AMD Radeon RX 6750 XT
AMD Radeon RX 6700 XT
...
3DMark 03 - 3DMark 03 - Standard
101407 Points (53%)
VIA S3 Graphics ProSavage8
...
NVIDIA GeForce GTX 570
NVIDIA GeForce GTX 480
AMD Radeon HD 6970
NVIDIA GeForce GTX 580
AMD Radeon HD 7870
NVIDIA GeForce RTX 2060 (Desktop)
NVIDIA GeForce GTX 1070 SLI (Desktop)
AMD Radeon RX 580 (Desktop)
...
NVIDIA GeForce GTX 1080 Mobile
3DMark 05 - 3DMark 05 - Standard
min: 24206 avg: 67108 median: 86558 (95%) max: 90559 Points
Intel Graphics Media Accelerator (GMA) 500
...
NVIDIA GeForce RTX 3060
AMD Radeon RX 5700 XT (Desktop)
NVIDIA Titan RTX
NVIDIA GeForce RTX 2060 Super (Desktop)
NVIDIA GeForce RTX 3060 Ti
AMD Radeon RX 5700 (Desktop)
Intel Arc A380
AMD Radeon RX 6750 XT
...
3DMark 06 3DMark 06 - Standard 1280x1024 +
min: 22088 avg: 53433 median: 69049 (90%) max: 69161 Points
...
NVIDIA Titan RTX
NVIDIA GeForce RTX 3060 Ti
NVIDIA GeForce RTX 3060
AMD Radeon RX 5700 XT (Desktop)
NVIDIA GeForce RTX 2060 Super (Desktop)
AMD Radeon RX 5700 (Desktop)
...
Unigine Valley 1.0 - Unigine Valley 1.0 DX
min: 88.5 avg: 128.3 median: 139.8 (46%) max: 145.2 fps
...
NVIDIA GeForce RTX 2080 (Desktop)
4x NVIDIA RTX A6000
NVIDIA GeForce RTX 3060 Ti
AMD Radeon RX 6700 XT
AMD Radeon RX 6750 XT
AMD Radeon Pro W6800
...
SPECviewperf 12 + SPECviewperf 12 - specvp12 sw-03
min: 48.75 avg: 78.5 median: 65.1 (16%) max: 135 fps
...
AMD Radeon RX Vega 56
AMD Radeon 660M
AMD Radeon Pro WX Vega M GL
NVIDIA Quadro M3000M
AMD Radeon RX Vega 64
NVIDIA Quadro P620
NVIDIA Quadro P1000
AMD Radeon VII
AMD Radeon 680M
NVIDIA Quadro M4000M
...
specvp12 snx-02 + SPECviewperf 12 - specvp12 snx-02
min: 8.58 avg: 114.5 median: 107.7 (16%) max: 234 fps
Intel Iris Xe MAX Graphics
...
AMD Radeon RX 5700 (Desktop)
NVIDIA Quadro RTX 3000 Max-Q
AMD Radeon RX 5700 XT (Desktop)
AMD Radeon RX 5600 XT (Desktop)
NVIDIA Quadro P4000 Max-Q
NVIDIA Quadro M4000M
NVIDIA Quadro P3200
NVIDIA Quadro RTX 4000 Max-Q
AMD Radeon Pro Vega 56
NVIDIA Quadro RTX 5000 Max-Q
AMD Radeon RX 6700 XT
...
specvp12 showcase-01 + SPECviewperf 12 - specvp12 showcase-01
min: 80.2 avg: 121.9 median: 131.7 (29%) max: 144 fps
...
AMD Radeon RX Vega 64
NVIDIA GeForce RTX 2060 Super (Desktop)
NVIDIA GeForce RTX 3060 Ti
AMD Radeon RX 5600 XT (Desktop)
...
specvp12 mediacal-01 + SPECviewperf 12 - specvp12 mediacal-01
min: 28.22 avg: 63.5 median: 69.8 (18%) max: 86.3 fps
...
NVIDIA Quadro RTX 4000 (Laptop)
NVIDIA Quadro RTX 5000 Max-Q
AMD Radeon RX 5700 (Desktop)
AMD Radeon RX 5600 XT (Desktop)
AMD Radeon RX 5700 XT (Desktop)
AMD Radeon Pro Vega 56
...
specvp12 maya-04 + SPECviewperf 12 - specvp12 maya-04
min: 79.7 avg: 136.1 median: 124.3 (34%) max: 216 fps
...
NVIDIA GeForce RTX 2060 (Desktop)
AMD Radeon RX 5700 (Desktop)
NVIDIA GeForce GTX 1660 Super (Desktop)
NVIDIA GeForce GTX 1080 (Desktop)
AMD Radeon RX 5700 XT (Desktop)
...
specvp12 energy-01 + SPECviewperf 12 - specvp12 energy-01
min: 7.75 avg: 15.1 median: 16.3 (15%) max: 19.78 fps
...
NVIDIA Quadro RTX 4000 (Laptop)
NVIDIA Quadro RTX 5000 Max-Q
NVIDIA Quadro P5200
AMD Radeon VII
...
specvp12 creo-01 + SPECviewperf 12 - specvp12 creo-01
min: 40.53 avg: 81.9 median: 59.6 (24%) max: 168 fps
...
NVIDIA GeForce RTX 3070 Ti
AMD Radeon RX 5700 (Desktop)
NVIDIA T600
NVIDIA Quadro M5000M
AMD Radeon RX 5700 XT (Desktop)
AMD Radeon RX 5600 XT (Desktop)
AMD Radeon Pro Vega 56
NVIDIA Quadro T2000 Max-Q
...
specvp12 catia-04 + SPECviewperf 12 - specvp12 catia-04
min: 62.6 avg: 125.4 median: 91.9 (15%) max: 255 fps
...
NVIDIA Quadro P4000
NVIDIA Quadro P3200
NVIDIA Quadro RTX 4000 Max-Q
NVIDIA Quadro RTX 5000 Max-Q
AMD Radeon Pro Vega 56
NVIDIA GeForce RTX 3070 Ti
AMD Radeon RX Vega 56
...
specvp12 3dsmax-05 + SPECviewperf 12 - specvp12 3dsmax-05
min: 144 avg: 174.6 median: 151.9 (27%) max: 228 fps
...
NVIDIA GeForce GTX 1660 Ti (Desktop)
AMD Radeon VII
NVIDIA Quadro RTX 4000 Max-Q
NVIDIA Quadro RTX 5000 Max-Q
NVIDIA GeForce RTX 2060 (Desktop)
NVIDIA GeForce RTX 3060
AMD Radeon RX 5700 (Desktop)
...
SPECviewperf 13 specvp13 sw-04 + SPECviewperf 13 - specvp13 sw-04
min: 71.7 avg: 104.6 median: 82.1 (22%) max: 160 fps
Intel Iris Plus Graphics G7 (Ice Lake 64 EU)
...
NVIDIA GeForce RTX 2080 (Desktop)
AMD Radeon RX Vega 64
NVIDIA Quadro T2000 Max-Q
AMD Radeon VII
...
specvp13 snx-03 + SPECviewperf 13 - specvp13 snx-03
min: 15.35 avg: 269.1 median: 370.9 (41%) max: 421 fps
Intel Iris Xe MAX Graphics
...
NVIDIA Quadro RTX 3000 Max-Q
AMD Radeon RX 5700 XT (Desktop)
NVIDIA Quadro P3200
NVIDIA Quadro RTX 4000 Max-Q
AMD Radeon RX 6700 XT
NVIDIA Quadro RTX 5000 Max-Q
NVIDIA Quadro RTX 4000 (Laptop)
...
specvp13 showcase-02 + SPECviewperf 13 - specvp13 showcase-02
min: 78.6 avg: 119.5 median: 136.8 (30%) max: 143 fps
Intel UHD Graphics 24EUs (Alder Lake-N)
...
AMD Radeon RX 5600 XT (Desktop)
NVIDIA GeForce RTX 2060 Super (Desktop)
NVIDIA GeForce RTX 3060 Ti
AMD Radeon RX 5700 (Desktop)
...
specvp13 medical-02 + SPECviewperf 13 - specvp13 medical-02
min: 40.57 avg: 63 median: 71.4 (15%) max: 76.9 fps
...
NVIDIA GeForce RTX 2080 Super Mobile
NVIDIA Quadro P5200
NVIDIA GeForce RTX 3060 Ti
AMD Radeon RX Vega 56
AMD Radeon RX 5600 XT (Desktop)
NVIDIA Quadro RTX 3000 Max-Q
...
specvp13 maya-05 + SPECviewperf 13 - specvp13 maya-05
min: 203 avg: 259.5 median: 236.5 (27%) max: 339 fps
Intel UHD Graphics 24EUs (Alder Lake-N)
...
NVIDIA GeForce RTX 3060
NVIDIA GeForce RTX 2060 (Desktop)
NVIDIA Quadro RTX 4000 (Laptop)
AMD Radeon RX 5700 (Desktop)
NVIDIA Quadro P5200
NVIDIA GeForce RTX 2060 Super (Desktop)
AMD Radeon RX 5700 XT (Desktop)
...
specvp13 energy-02 + SPECviewperf 13 - specvp13 energy-02
min: 11.31 avg: 25.3 median: 32 (10%) max: 32.46 fps
...
AMD Radeon RX Vega 56
NVIDIA GeForce RTX 3060 Ti
NVIDIA Quadro RTX 3000 Max-Q
NVIDIA GeForce RTX 3070 Ti
...
Intel UHD Graphics 24EUs (Alder Lake-N)
specvp13 creo-02 + SPECviewperf 13 - specvp13 creo-02
min: 134 avg: 204.7 median: 185.2 (27%) max: 295 fps
Intel Iris Plus Graphics G7 (Ice Lake 64 EU)
...
NVIDIA GeForce RTX 2060 Super (Desktop)
NVIDIA Quadro RTX 4000 Max-Q
NVIDIA GeForce RTX 3060 Ti
AMD Radeon RX 5700 XT (Desktop)
NVIDIA Quadro RTX 5000 Max-Q
NVIDIA GeForce RTX 2080 (Desktop)
...
specvp13 catia-05 + SPECviewperf 13 - specvp13 catia-05
min: 91 avg: 218.8 median: 161.4 (18%) max: 404 fps
Intel UHD Graphics 24EUs (Alder Lake-N)
...
NVIDIA GeForce RTX 3070 Ti
NVIDIA Quadro RTX 4000 Max-Q
AMD Radeon RX Vega 56
NVIDIA Quadro RTX 5000 Max-Q
AMD Radeon RX Vega 64
AMD Radeon RX 5600 XT (Desktop)
...
specvp13 3dsmax-06 + SPECviewperf 13 - specvp13 3dsmax-06
min: 143 avg: 174.8 median: 153.4 (27%) max: 228 fps
Intel UHD Graphics 24EUs (Alder Lake-N)
...
NVIDIA GeForce GTX 1660 Super (Desktop)
NVIDIA GeForce GTX 1660 Ti (Desktop)
NVIDIA Quadro RTX 5000 Max-Q
AMD Radeon VII
NVIDIA GeForce RTX 2070 Super Max-Q
NVIDIA Quadro RTX 4000 (Laptop)
...
SPECviewperf 2020 specvp2020 solidworks-05 4k + SPECviewperf 2020 - specvp2020 solidworks-05 4k
min: 64.1 avg: 85.6 median: 85.6 (25%) max: 107 fps
...
AMD Radeon VII
AMD Radeon RX 6650 XT
AMD Radeon RX 6700 XT
AMD Radeon RX 6750 XT
NVIDIA GeForce RTX 3060
NVIDIA GeForce RTX 3060 Ti
NVIDIA GeForce RTX 2060 Super (Desktop)
...
specvp2020 snx-04 4k + SPECviewperf 2020 - specvp2020 snx-04 4k
min: 11.7 avg: 161.9 median: 161.9 (17%) max: 312 fps
...
NVIDIA Quadro RTX 4000 Max-Q
AMD Radeon RX 5600 XT (Desktop)
AMD Radeon RX 5700 (Desktop)
AMD Radeon RX 5700 XT (Desktop)
AMD Radeon RX 6700 XT
AMD Radeon RX 6650 XT
...
specvp2020 medical-03 4k + SPECviewperf 2020 - specvp2020 medical-03 4k
min: 6.11 avg: 9.5 median: 9.5 (9%) max: 12.8 fps
Intel UHD Graphics Xe 32EUs (Tiger Lake-H)
...
AMD Radeon 660M
NVIDIA GeForce GTX 1650 Super (Desktop)
NVIDIA GeForce GTX 1660 Super (Desktop)
NVIDIA GeForce GTX 1660 (Desktop)
NVIDIA GeForce GTX 1660 Ti (Desktop)
AMD Radeon 680M
NVIDIA GeForce RTX 2060 Super (Desktop)
NVIDIA GeForce RTX 3060 Ti
...
specvp2020 maya-06 4k + SPECviewperf 2020 - specvp2020 maya-06 4k
min: 113 avg: 154.5 median: 154.5 (25%) max: 196 fps
Intel UHD Graphics Xe 32EUs (Tiger Lake-H)
...
AMD Radeon RX Vega 64
NVIDIA GeForce RTX 3060
AMD Radeon RX 5700 (Desktop)
NVIDIA GeForce RTX 2060 Super (Desktop)
NVIDIA GeForce RTX 3060 Ti
AMD Radeon VII
AMD Radeon RX 5700 XT (Desktop)
AMD Radeon RX 6650 XT
...
specvp2020 energy-03 4k + SPECviewperf 2020 - specvp2020 energy-03 4k
min: 13.76 avg: 26.4 median: 26.4 (6%) max: 39 fps
...
AMD Radeon RX 5600 XT (Desktop)
NVIDIA GeForce RTX 2060 Super (Desktop)
AMD Radeon RX Vega 64
AMD Radeon RX 5700 (Desktop)
...
specvp2020 creo-03 4k + SPECviewperf 2020 - specvp2020 creo-03 4k
min: 52.9 avg: 76.2 median: 76.2 (36%) max: 99.4 fps
Intel UHD Graphics Xe 32EUs (Tiger Lake-H)
...
NVIDIA GeForce RTX 2060 Super (Desktop)
AMD Radeon RX 5700 XT (Desktop)
4x NVIDIA RTX A6000
...
specvp2020 catia-06 4k + SPECviewperf 2020 - specvp2020 catia-06 4k
min: 20.53 avg: 43.7 median: 43.7 (29%) max: 66.9 fps
...
AMD Radeon RX 5700 (Desktop)
AMD Radeon RX 5700 XT (Desktop)
NVIDIA GeForce RTX 3070 Ti
...
specvp2020 3dsmax-07 4k + SPECviewperf 2020 - specvp2020 3dsmax-07 4k
min: 42.19 avg: 55.6 median: 55.6 (23%) max: 69 fps
...
AMD Radeon RX 5700 XT (Desktop)
AMD Radeon RX 6650 XT
NVIDIA GeForce RTX 2060 Super (Desktop)
AMD Radeon VII
NVIDIA GeForce RTX 3060 Ti
NVIDIA GeForce RTX 3060
...
Cinebench R10 Cinebench R10 Shading (32bit) + Cinebench R10 - Cinebench R10 Shading (32bit)
6756 points (5%)
Intel Graphics Media Accelerator (GMA) 500
...
AMD Radeon R7 M260X
NVIDIA GeForce GTX 765M
AMD Radeon HD 8850M
NVIDIA GeForce GTX 960M
NVIDIA Quadro K2100M
NVIDIA GeForce GT 745M
NVIDIA Quadro K3100M
NVIDIA Quadro P2000
NVIDIA GeForce GTX 960
NVIDIA Quadro P3200
NVIDIA GeForce GTX 770M
...
Cinebench R11.5 Cinebench R11.5 OpenGL 64 Bit + Cinebench R11.5 - Cinebench R11.5 OpenGL 64 Bit
min: 52 avg: 77 median: 77 (27%) max: 102 fps
Intel Graphics Media Accelerator (GMA) 4500MHD
...
AMD Radeon HD 6790
AMD Radeon HD 6870
4x NVIDIA RTX A6000
AMD Radeon Pro WX 3100
NVIDIA GeForce GTX 980 (Laptop)
NVIDIA Quadro M2000M
NVIDIA GeForce GTX 1080 Mobile
Intel UHD Graphics Xe 32EUs (Tiger Lake-H)
...
Cinebench R15 + Cinebench R15 - Cinebench R15 OpenGL 64 Bit
min: 112.2 avg: 122 median: 122 (7%) max: 131.7 fps
Intel Graphics Media Accelerator (GMA) 4500MHD
...
AMD Radeon 660M
NVIDIA Quadro K5100M
NVIDIA GeForce GTX 960
AMD Radeon HD 7870
NVIDIA GeForce GTX 980 (Laptop)
...
Cinebench R15 OpenGL Ref. Match 64 Bit + Cinebench R15 - Cinebench R15 OpenGL Ref. Match 64 Bit
99.6 % (100%)
...
NVIDIA Quadro T2000 Max-Q
NVIDIA Quadro K3100M
NVIDIA Quadro P3200
NVIDIA Quadro RTX 4000 (Laptop)
...
Geekbench 6.2 - Geekbench 6.2 GPU OpenCL
69162 points (20%)
Model CPU GPU RAM Value Nvidia Titan X (Pascal) R9 7950X 230 W / 170 W Titan X Pascal 1531 / 1251 MHz 12 GB 32 GB 69162
...
AMD Radeon RX 5700 (Desktop)
AMD Radeon RX 5600 XT (Desktop)
AMD Radeon RX 5700 XT (Desktop)
...
Geekbench 6.2 - Geekbench 6.2 GPU Vulkan
81572 points (27%)
Model CPU GPU RAM Value Nvidia Titan X (Pascal) R9 7950X 230 W / 170 W Titan X Pascal 1531 / 1251 MHz 12 GB 32 GB 81572
...
AMD Radeon RX 5600 XT (Desktop)
AMD Radeon RX 5700 (Desktop)
AMD Radeon RX 5700 XT (Desktop)
NVIDIA GeForce RTX 2060 Super (Desktop)
...
LuxMark v2.0 64Bit - LuxMark v2.0 Room GPU
2991 Samples/s (14%)
...
NVIDIA Quadro RTX 4000 (Laptop)
AMD Radeon RX 6750 XT
AMD Radeon RX 6700 XT
NVIDIA GeForce RTX 2060 Super (Desktop)
...
4x NVIDIA RTX A6000
LuxMark v2.0 64Bit - LuxMark v2.0 Sala GPU
6920 Samples/s (12%)
...
NVIDIA Quadro RTX 4000 (Laptop)
AMD Radeon VII
NVIDIA GeForce RTX 2060 Super (Desktop)
NVIDIA GeForce RTX 3060
NVIDIA GeForce RTX 2080 (Desktop)
...
4x NVIDIA RTX A6000
ComputeMark v2.1 - ComputeMark v2.1 Result
min: 21512 avg: 21682 median: 21682 (23%) max: 21852 points
...
NVIDIA GeForce RTX 3060
AMD Radeon RX 6650 XT
NVIDIA GeForce RTX 2080 (Desktop)
AMD Radeon VII
...
Power Consumption - Furmark Stress Test Power Consumption - external Monitor *
min: 377 avg: 381.7 median: 381.7 (54%) max: 386.4 Watt
GPU TDP ? TDP 250 W 100% 103%
...
AMD Radeon RX 6700 XT
AMD Radeon RX 6750 XT
NVIDIA GeForce RTX 2080 (Desktop)
AMD Radeon VII
NVIDIA Titan RTX
...
4x NVIDIA RTX A6000
0 25 50 75 100 125 150 175 200 225 250 275 300 325 350 375 400 Tooltip Nvidia Titan X Pascal: Ø377 (352-423)
Power Consumption - The Witcher 3 Power Consumption - external Monitor *
min: 378.5 avg: 381.8 median: 381.8 (53%) max: 385 Watt
GPU TDP ? TDP 250 W 102% 100%
...
AMD Radeon RX Vega 56
AMD Radeon RX 5700 XT (Desktop)
AMD Radeon RX 6700 XT
NVIDIA GeForce RTX 3060 Ti
AMD Radeon RX Vega 64
NVIDIA GeForce RTX 2080 (Desktop)
NVIDIA Titan RTX
AMD Radeon RX 6750 XT
...
4x NVIDIA RTX A6000
0 30 60 90 120 150 180 210 240 270 300 330 360 390 420 450 480 510 Tooltip Nvidia Titan X Pascal: Ø385 (351-512)
- Range of benchmark values for this graphics card
- Average benchmark values for this graphics card
* Smaller numbers mean a higher performance
v1.26
log 24. 19:36:19
#0 no ids found in url (should be separated by "_") +0s ... 0s
#1 not redirecting to Ajax server +0s ... 0s
#2 did not recreate cache, as it is less than 5 days old! Created at Mon, 22 Apr 2024 05:40:21 +0200 +0.001s ... 0.001s
#3 getting avg benchmarks for device 7461 +0.016s ... 0.017s
#4 got single benchmarks 7461 +0.026s ... 0.043s
#5 got avg benchmarks for devices +0s ... 0.043s
#6 min, max, avg, median took s +0.912s ... 0.955s
#7 return log +0s ... 0.955s
Game Benchmarks The following benchmarks stem from our benchmarks of review laptops. The performance depends on the used graphics memory, clock rate, processor, system settings, drivers, and operating systems. So the results don't have to be representative for all laptops with this GPU. For detailed information on the benchmark results, click on the fps number.
Intel Arc A380
NVIDIA GeForce GTX 1650 Super (Desktop)
NVIDIA GeForce GTX 1660 Super (Desktop)
NVIDIA GeForce RTX 2060 Super (Desktop)
AMD Radeon RX 5600 XT (Desktop)
...
...
Intel Arc A380
NVIDIA GeForce GTX 1650 Super (Desktop)
NVIDIA GeForce GTX 1660 Super (Desktop)
NVIDIA GeForce RTX 2060 Super (Desktop)
AMD Radeon RX 5600 XT (Desktop)
NVIDIA GeForce RTX 3060 Ti
...
NVIDIA GeForce GTX 1650 Super (Desktop)
NVIDIA GeForce GTX 1660 Super (Desktop)
NVIDIA GeForce RTX 2060 Super (Desktop)
AMD Radeon RX 5600 XT (Desktop)
AMD Radeon RX 6650 XT
...
NVIDIA GeForce GTX 1660 Super (Desktop)
AMD Radeon RX 5600 XT (Desktop)
AMD Radeon RX 6650 XT
NVIDIA GeForce RTX 2060 Super (Desktop)
AMD Radeon RX 5700 (Desktop)
...
» With all tested laptops playable in detail settings high.
Additional Benchmarks
Low Preset 1280x720
69.2 [X] Nvidia Titan X Pascal Intel Core i9-14900K 3.2GHz
Titan X Pascal
min:
36.8 fps, P0.1:
42.8 fps, P1:
46.5 fps, max:
95.4 fps
...
NVIDIA GeForce RTX 3060 Ti
AMD Radeon RX 6750 XT
NVIDIA Titan RTX
...
NVIDIA Titan RTX
...
NVIDIA Titan RTX
...
AMD Radeon RX 5600 XT (Desktop)
NVIDIA GeForce RTX 2060 Super (Desktop)
AMD Radeon RX 5700 XT (Desktop)
AMD Radeon RX 6650 XT
NVIDIA GeForce RTX 3060 Ti
...
NVIDIA GeForce GTX 1650 Super (Desktop)
...
AMD Radeon RX 5600 XT (Desktop)
AMD Radeon RX 5700 (Desktop)
NVIDIA GeForce RTX 2060 Super (Desktop)
AMD Radeon RX 5700 XT (Desktop)
AMD Radeon RX 6650 XT
...
NVIDIA GeForce GTX 1660 Super (Desktop)
...
NVIDIA GeForce RTX 2060 Super (Desktop)
AMD Radeon RX 5700 (Desktop)
AMD Radeon RX 5700 XT (Desktop)
NVIDIA GeForce RTX 3060 Ti
AMD Radeon RX 6700 XT
AMD Radeon RX 6750 XT
...
NVIDIA GeForce GTX 1660 Super (Desktop)
...
AMD Radeon RX 5600 XT (Desktop)
AMD Radeon RX 6650 XT
NVIDIA GeForce RTX 2060 Super (Desktop)
AMD Radeon RX 5700 XT (Desktop)
NVIDIA GeForce RTX 3060 Ti
AMD Radeon RX 6700 XT
AMD Radeon RX 6750 XT
NVIDIA Titan RTX
...
» With all tested laptops playable in detail settings ultra.
Additional Benchmarks
Very Low Preset 1280x720
243 [X] Nvidia Titan X Pascal Intel Core i9-14900K 3.2GHz
Titan X Pascal
min:
1.485 fps, P0.1:
19.6 fps, P1:
83 fps, max:
1149 fps
...
AMD Radeon RX 5700 (Desktop)
AMD Radeon RX 5700 XT (Desktop)
NVIDIA GeForce RTX 2060 Super (Desktop)
AMD Radeon RX 6650 XT
AMD Radeon RX 6700 XT
AMD Radeon RX 6750 XT
NVIDIA GeForce RTX 3060 Ti
...
...
NVIDIA GeForce RTX 2060 Super (Desktop)
AMD Radeon RX 5700 XT (Desktop)
AMD Radeon RX 6650 XT
AMD Radeon RX 6700 XT
AMD Radeon RX 6750 XT
NVIDIA GeForce RTX 3060 Ti
...
...
NVIDIA GeForce RTX 2060 Super (Desktop)
AMD Radeon RX 5700 XT (Desktop)
AMD Radeon RX 5700 (Desktop)
AMD Radeon RX 6650 XT
AMD Radeon RX 6700 XT
AMD Radeon RX 6750 XT
...
...
AMD Radeon RX 5700 (Desktop)
AMD Radeon RX 5700 XT (Desktop)
AMD Radeon RX 6650 XT
NVIDIA GeForce RTX 2060 Super (Desktop)
AMD Radeon RX 6700 XT
AMD Radeon RX 6750 XT
NVIDIA GeForce RTX 3060 Ti
...
...
AMD Radeon RX 5700 XT (Desktop)
AMD Radeon RX 6700 XT
AMD Radeon RX 6750 XT
NVIDIA GeForce RTX 3060 Ti
NVIDIA Titan RTX
...
...
NVIDIA GeForce RTX 2060 Super (Desktop)
NVIDIA GeForce RTX 3060 Ti
AMD Radeon RX 6750 XT
NVIDIA Titan RTX
AMD Radeon RX 6700 XT
...
AMD Radeon RX 6650 XT
NVIDIA GeForce RTX 2060 Super (Desktop)
AMD Radeon RX 6750 XT
AMD Radeon RX 6700 XT
NVIDIA GeForce RTX 3060 Ti
NVIDIA Titan RTX
...
» With all tested laptops playable in detail settings ultra.
Additional Benchmarks
Low Preset 1280x720
310 [X] Nvidia Titan X Pascal Intel Core i9-14900K 3.2GHz
Titan X Pascal
min:
7.25 fps, P0.1:
29.2 fps, P1:
224 fps, max:
548 fps
...
AMD Radeon RX 6650 XT
NVIDIA GeForce RTX 2060 Super (Desktop)
AMD Radeon RX 5700 (Desktop)
AMD Radeon RX 5700 XT (Desktop)
NVIDIA Titan RTX
AMD Radeon RX 6750 XT
AMD Radeon RX 6700 XT
NVIDIA GeForce RTX 3060 Ti
...
NVIDIA GeForce RTX 2060 Super (Desktop)
AMD Radeon RX 6650 XT
AMD Radeon RX 5700 (Desktop)
AMD Radeon RX 5700 XT (Desktop)
NVIDIA GeForce RTX 3060 Ti
AMD Radeon RX 6700 XT
AMD Radeon RX 6750 XT
NVIDIA Titan RTX
...
...
NVIDIA GeForce RTX 2060 Super (Desktop)
AMD Radeon RX 5700 XT (Desktop)
NVIDIA GeForce RTX 3060 Ti
AMD Radeon RX 6700 XT
AMD Radeon RX 6750 XT
NVIDIA Titan RTX
...
...
NVIDIA GeForce RTX 2060 Super (Desktop)
AMD Radeon RX 6700 XT
AMD Radeon RX 6650 XT
AMD Radeon RX 6750 XT
NVIDIA GeForce RTX 3060 Ti
NVIDIA Titan RTX
...
...
NVIDIA GeForce RTX 2060 Super (Desktop)
AMD Radeon RX 6650 XT
AMD Radeon RX 5700 (Desktop)
AMD Radeon RX 6700 XT
AMD Radeon RX 6750 XT
NVIDIA GeForce RTX 3060 Ti
NVIDIA Titan RTX
...
...
AMD Radeon RX 6700 XT
NVIDIA GeForce RTX 2060 Super (Desktop)
AMD Radeon RX 6750 XT
AMD Radeon RX 5700 (Desktop)
NVIDIA GeForce RTX 3060 Ti
NVIDIA Titan RTX
...
» With all tested laptops playable in detail settings ultra.
Additional Benchmarks
Very Low Preset 1280x720
298 [X] Nvidia Titan X Pascal Intel Core i9-14900K 3.2GHz
Titan X Pascal
min:
27.4 fps, P0.1:
172.2 fps, P1:
247 fps, max:
539 fps
...
NVIDIA GeForce GTX 1660 Super (Desktop)
AMD Radeon RX 5600 XT (Desktop)
AMD Radeon RX 5700 (Desktop)
NVIDIA GeForce RTX 2060 Super (Desktop)
AMD Radeon RX 5700 XT (Desktop)
AMD Radeon RX 6650 XT
NVIDIA GeForce RTX 3060 Ti
...
...
NVIDIA GeForce GTX 1660 Super (Desktop)
AMD Radeon RX 5600 XT (Desktop)
AMD Radeon RX 5700 (Desktop)
AMD Radeon RX 5700 XT (Desktop)
AMD Radeon RX 6650 XT
...
...
NVIDIA GeForce GTX 1660 Super (Desktop)
AMD Radeon RX 5600 XT (Desktop)
AMD Radeon RX 5700 (Desktop)
AMD Radeon RX 5700 XT (Desktop)
AMD Radeon RX 6650 XT
AMD Radeon RX 6700 XT
...
...
AMD Radeon RX 5600 XT (Desktop)
NVIDIA GeForce RTX 2060 Super (Desktop)
AMD Radeon RX 5700 (Desktop)
AMD Radeon RX 6650 XT
AMD Radeon RX 5700 XT (Desktop)
AMD Radeon RX 6700 XT
NVIDIA GeForce RTX 3060 Ti
AMD Radeon RX 6750 XT
...
...
AMD Radeon RX 5600 XT (Desktop)
NVIDIA GeForce RTX 2060 Super (Desktop)
AMD Radeon RX 5700 (Desktop)
AMD Radeon RX 6650 XT
AMD Radeon RX 6700 XT
AMD Radeon RX 6750 XT
NVIDIA GeForce RTX 3060 Ti
...
NVIDIA GeForce GTX 1650 Super (Desktop)
...
NVIDIA GeForce GTX 1660 Super (Desktop)
AMD Radeon RX 6650 XT
AMD Radeon RX 5700 (Desktop)
NVIDIA GeForce RTX 2060 Super (Desktop)
AMD Radeon RX 5600 XT (Desktop)
AMD Radeon RX 5700 XT (Desktop)
AMD Radeon RX 6700 XT
AMD Radeon RX 6750 XT
...
NVIDIA GeForce GTX 1650 Super (Desktop)
...
NVIDIA GeForce RTX 2060 Super (Desktop)
AMD Radeon RX 5700 (Desktop)
AMD Radeon RX 6650 XT
AMD Radeon RX 5600 XT (Desktop)
AMD Radeon RX 5700 XT (Desktop)
AMD Radeon RX 6750 XT
AMD Radeon RX 6700 XT
NVIDIA GeForce RTX 3060 Ti
NVIDIA Titan RTX
...
» With all tested laptops playable in detail settings ultra.
Additional Benchmarks
Low Preset TAA 1280x720
123 [X] Nvidia Titan X Pascal Intel Core i9-14900K 3.2GHz
Titan X Pascal
...
AMD Radeon RX 5600 XT (Desktop)
AMD Radeon RX 5700 (Desktop)
AMD Radeon RX 5700 XT (Desktop)
AMD Radeon RX 6650 XT
NVIDIA GeForce RTX 2060 Super (Desktop)
...
...
AMD Radeon RX 5600 XT (Desktop)
AMD Radeon RX 5700 (Desktop)
AMD Radeon RX 5700 XT (Desktop)
AMD Radeon RX 6650 XT
NVIDIA GeForce RTX 2060 Super (Desktop)
AMD Radeon RX 6700 XT
...
...
AMD Radeon RX 5600 XT (Desktop)
AMD Radeon RX 5700 (Desktop)
AMD Radeon RX 5700 XT (Desktop)
NVIDIA GeForce RTX 2060 Super (Desktop)
AMD Radeon RX 6650 XT
...
...
AMD Radeon RX 5600 XT (Desktop)
AMD Radeon RX 5700 (Desktop)
AMD Radeon RX 5700 XT (Desktop)
NVIDIA GeForce RTX 2060 Super (Desktop)
AMD Radeon RX 6650 XT
...
...
AMD Radeon RX 5700 (Desktop)
AMD Radeon RX 5700 XT (Desktop)
AMD Radeon RX 6650 XT
NVIDIA GeForce RTX 2060 Super (Desktop)
AMD Radeon RX 6700 XT
AMD Radeon RX 6750 XT
NVIDIA GeForce RTX 3060 Ti
...
...
AMD Radeon RX 6650 XT
AMD Radeon RX 5700 (Desktop)
AMD Radeon RX 5700 XT (Desktop)
NVIDIA GeForce RTX 2060 Super (Desktop)
AMD Radeon RX 6700 XT
AMD Radeon RX 6750 XT
NVIDIA GeForce RTX 3060 Ti
...
» With all tested laptops playable in detail settings ultra.
Additional Benchmarks
Low Preset 1280x720
158.9 [X] Nvidia Titan X Pascal Intel Core i9-14900K 3.2GHz
Titan X Pascal
min:
68.4 fps, P0.1:
100.7 fps, P1:
140.6 fps, max:
219 fps
...
NVIDIA GeForce GTX 1660 Super (Desktop)
AMD Radeon RX 5600 XT (Desktop)
AMD Radeon RX 5700 (Desktop)
NVIDIA GeForce RTX 2060 Super (Desktop)
AMD Radeon RX 5700 XT (Desktop)
AMD Radeon RX 6650 XT
...
...
NVIDIA GeForce GTX 1660 Super (Desktop)
AMD Radeon RX 5700 (Desktop)
AMD Radeon RX 5600 XT (Desktop)
NVIDIA GeForce RTX 2060 Super (Desktop)
AMD Radeon RX 5700 XT (Desktop)
AMD Radeon RX 6650 XT
...
...
NVIDIA GeForce GTX 1660 Super (Desktop)
AMD Radeon RX 5700 (Desktop)
AMD Radeon RX 5600 XT (Desktop)
NVIDIA GeForce RTX 2060 Super (Desktop)
AMD Radeon RX 5700 XT (Desktop)
AMD Radeon RX 6650 XT
...
...
AMD Radeon RX 5600 XT (Desktop)
AMD Radeon RX 5700 (Desktop)
NVIDIA GeForce RTX 2060 Super (Desktop)
AMD Radeon RX 5700 XT (Desktop)
AMD Radeon RX 6650 XT
...
...
NVIDIA GeForce GTX 1660 Super (Desktop)
AMD Radeon RX 5600 XT (Desktop)
AMD Radeon RX 5700 (Desktop)
NVIDIA GeForce RTX 2060 Super (Desktop)
AMD Radeon RX 5700 XT (Desktop)
...
NVIDIA GeForce GTX 1660 Super (Desktop)
AMD Radeon RX 5600 XT (Desktop)
AMD Radeon RX 5700 (Desktop)
AMD Radeon RX 5700 XT (Desktop)
NVIDIA GeForce RTX 2060 Super (Desktop)
AMD Radeon RX 6700 XT
...
NVIDIA GeForce GTX 1660 Super (Desktop)
AMD Radeon RX 5600 XT (Desktop)
AMD Radeon RX 6650 XT
NVIDIA GeForce RTX 2060 Super (Desktop)
AMD Radeon RX 5700 (Desktop)
AMD Radeon RX 5700 XT (Desktop)
...
» With all tested laptops playable in detail settings ultra.
Additional Benchmarks
Max. Performance 1280x720
99.5 [X] Nvidia Titan X Pascal Intel Core i9-14900K 3.2GHz
Titan X Pascal
min:
69.7 fps, P0.1:
71 fps, P1:
73.1 fps, max:
179.9 fps
...
AMD Radeon RX 5700 (Desktop)
NVIDIA GeForce RTX 2060 Super (Desktop)
AMD Radeon RX 5700 XT (Desktop)
AMD Radeon RX 6650 XT
NVIDIA Titan RTX
AMD Radeon RX 6700 XT
AMD Radeon RX 6750 XT
NVIDIA GeForce RTX 3060 Ti
...
...
AMD Radeon RX 5700 XT (Desktop)
NVIDIA GeForce RTX 2060 Super (Desktop)
AMD Radeon RX 6650 XT
NVIDIA Titan RTX
AMD Radeon RX 6700 XT
AMD Radeon RX 6750 XT
NVIDIA GeForce RTX 3060 Ti
...
...
AMD Radeon RX 5700 XT (Desktop)
AMD Radeon RX 6650 XT
NVIDIA GeForce RTX 2060 Super (Desktop)
NVIDIA Titan RTX
AMD Radeon RX 6700 XT
AMD Radeon RX 6750 XT
...
...
AMD Radeon RX 5700 XT (Desktop)
AMD Radeon RX 6650 XT
NVIDIA GeForce RTX 2060 Super (Desktop)
NVIDIA Titan RTX
AMD Radeon RX 6700 XT
AMD Radeon RX 6750 XT
...
...
AMD Radeon RX 5700 (Desktop)
AMD Radeon RX 5600 XT (Desktop)
AMD Radeon RX 5700 XT (Desktop)
NVIDIA GeForce RTX 2060 Super (Desktop)
AMD Radeon RX 6650 XT
NVIDIA Titan RTX
AMD Radeon RX 6700 XT
AMD Radeon RX 6750 XT
...
...
AMD Radeon RX 5700 (Desktop)
NVIDIA GeForce RTX 2060 Super (Desktop)
AMD Radeon RX 5700 XT (Desktop)
AMD Radeon RX 6650 XT
AMD Radeon RX 6700 XT
NVIDIA Titan RTX
AMD Radeon RX 6750 XT
...
» With all tested laptops playable in detail settings ultra.
Additional Benchmarks
Very Low Preset 1280x720
229 [X] Nvidia Titan X Pascal Intel Core i9-14900K 3.2GHz
Titan X Pascal
min:
60.9 fps, P0.1:
166.9 fps, P1:
184.4 fps, max:
451 fps
Intel UHD Graphics 32EUs (Alder Lake)
...
AMD Radeon RX 5700 (Desktop)
NVIDIA GeForce RTX 3060 Ti
AMD Radeon RX 5700 XT (Desktop)
NVIDIA GeForce GTX 1660 Super (Desktop)
...
...
AMD Radeon RX 6700 XT
...
...
NVIDIA GeForce GTX 1660 Super (Desktop)
...
Intel UHD Graphics Xe 32EUs (Tiger Lake-H)
...
AMD Radeon RX 6650 XT
AMD Radeon RX 5700 XT (Desktop)
NVIDIA GeForce RTX 3060 Ti
AMD Radeon RX 6750 XT
AMD Radeon RX 6700 XT
NVIDIA Titan RTX
...
...
AMD Radeon RX 6650 XT
AMD Radeon RX 5700 XT (Desktop)
NVIDIA GeForce RTX 3060 Ti
AMD Radeon RX 6700 XT
AMD Radeon RX 6750 XT
NVIDIA Titan RTX
...
» With all tested laptops playable in detail settings ultra.
...
AMD Radeon RX 5700 (Desktop)
AMD Radeon RX 5700 XT (Desktop)
AMD Radeon RX 6650 XT
NVIDIA GeForce RTX 2060 Super (Desktop)
AMD Radeon RX 6700 XT
AMD Radeon RX 6750 XT
NVIDIA GeForce RTX 3060 Ti
...
Intel Iris Plus Graphics G7 (Ice Lake 64 EU)
...
AMD Radeon RX 5700 XT (Desktop)
NVIDIA GeForce RTX 2060 Super (Desktop)
AMD Radeon RX 6650 XT
AMD Radeon RX 6700 XT
...
AMD Radeon RX Vega 6 (Ryzen 4000/5000)
...
AMD Radeon RX 5600 XT (Desktop)
AMD Radeon RX 5700 (Desktop)
AMD Radeon RX 5700 XT (Desktop)
NVIDIA GeForce RTX 2060 Super (Desktop)
AMD Radeon RX 6650 XT
...
AMD Radeon RX Vega 6 (Ryzen 4000/5000)
...
NVIDIA GeForce GTX 1660 Super (Desktop)
AMD Radeon RX 5600 XT (Desktop)
AMD Radeon RX 5700 (Desktop)
AMD Radeon RX 5700 XT (Desktop)
NVIDIA GeForce RTX 2060 Super (Desktop)
AMD Radeon RX 6650 XT
...
...
NVIDIA GeForce GTX 1660 Super (Desktop)
AMD Radeon RX 5600 XT (Desktop)
AMD Radeon RX 5700 (Desktop)
NVIDIA GeForce RTX 2060 Super (Desktop)
AMD Radeon RX 5700 XT (Desktop)
AMD Radeon RX 6650 XT
AMD Radeon RX 6700 XT
...
NVIDIA GeForce GTX 1650 Super (Desktop)
...
NVIDIA GeForce GTX 1660 Super (Desktop)
NVIDIA GeForce GTX 1660 (Desktop)
AMD Radeon RX 5600 XT (Desktop)
AMD Radeon RX 5700 (Desktop)
NVIDIA GeForce RTX 2060 Super (Desktop)
AMD Radeon RX 5700 XT (Desktop)
AMD Radeon RX 6650 XT
NVIDIA GeForce RTX 3060 Ti
...
» With all tested laptops playable in detail settings ultra.
Intel UHD Graphics Xe 16EUs (Tiger Lake-H)
...
NVIDIA GeForce GTX 1650 Super (Desktop)
NVIDIA GeForce GTX 1660 (Desktop)
AMD Radeon RX 5600 XT (Desktop)
NVIDIA GeForce GTX 1660 Super (Desktop)
AMD Radeon RX 5700 (Desktop)
AMD Radeon RX 5700 XT (Desktop)
NVIDIA GeForce RTX 2060 Super (Desktop)
AMD Radeon RX 6650 XT
...
Intel UHD Graphics 32EUs (Alder Lake)
...
AMD Radeon RX 5600 XT (Desktop)
NVIDIA GeForce GTX 1660 (Desktop)
NVIDIA GeForce GTX 1660 Super (Desktop)
AMD Radeon RX 5700 (Desktop)
AMD Radeon RX 5700 XT (Desktop)
NVIDIA GeForce RTX 2060 Super (Desktop)
...
0 100 200 300 400 500 600 Tooltip
Intel UHD Graphics 32EUs (Alder Lake)
...
NVIDIA GeForce GTX 1650 Super (Desktop)
NVIDIA GeForce GTX 1660 (Desktop)
NVIDIA GeForce GTX 1660 Super (Desktop)
AMD Radeon RX 5700 (Desktop)
AMD Radeon RX 5600 XT (Desktop)
AMD Radeon RX 5700 XT (Desktop)
NVIDIA GeForce RTX 2060 Super (Desktop)
...
Intel UHD Graphics 32EUs (Alder Lake)
...
NVIDIA GeForce GTX 1660 (Desktop)
NVIDIA GeForce GTX 1660 Super (Desktop)
AMD Radeon RX 5600 XT (Desktop)
AMD Radeon RX 5700 (Desktop)
AMD Radeon RX 5700 XT (Desktop)
NVIDIA GeForce RTX 2060 Super (Desktop)
AMD Radeon RX 6650 XT
...
...
NVIDIA GeForce GTX 1650 Super (Desktop)
NVIDIA GeForce GTX 1660 (Desktop)
NVIDIA GeForce GTX 1660 Super (Desktop)
AMD Radeon RX 5700 (Desktop)
AMD Radeon RX 5600 XT (Desktop)
AMD Radeon RX 5700 XT (Desktop)
NVIDIA GeForce RTX 2060 Super (Desktop)
AMD Radeon RX 6650 XT
...
...
NVIDIA GeForce GTX 1660 (Desktop)
NVIDIA GeForce GTX 1660 Super (Desktop)
AMD Radeon RX 5600 XT (Desktop)
AMD Radeon RX 5700 (Desktop)
NVIDIA GeForce RTX 2060 Super (Desktop)
AMD Radeon RX 5700 XT (Desktop)
AMD Radeon RX 6650 XT
...
» With all tested laptops playable in detail settings ultra.
Additional Benchmarks
Low Preset 1280x720
295 [X] Nvidia Titan X (Pascal) AMD Ryzen 9 7950X 4.5GHz
Titan X Pascal
min:
70.2 fps, P0.1:
162 fps, P1:
203 fps, max:
493 fps
...
NVIDIA GeForce GTX 1660 (Desktop)
NVIDIA GeForce GTX 1660 Super (Desktop)
NVIDIA GeForce RTX 2060 Super (Desktop)
AMD Radeon RX 5600 XT (Desktop)
AMD Radeon RX 5700 (Desktop)
AMD Radeon RX 5700 XT (Desktop)
...
...
NVIDIA GeForce GTX 1660 (Desktop)
NVIDIA GeForce GTX 1660 Super (Desktop)
NVIDIA GeForce RTX 2060 Super (Desktop)
AMD Radeon RX 5600 XT (Desktop)
AMD Radeon RX 5700 (Desktop)
AMD Radeon RX 5700 XT (Desktop)
...
...
NVIDIA GeForce GTX 1650 Super (Desktop)
NVIDIA GeForce GTX 1660 (Desktop)
NVIDIA GeForce GTX 1660 Super (Desktop)
NVIDIA GeForce RTX 2060 Super (Desktop)
AMD Radeon RX 5600 XT (Desktop)
AMD Radeon RX 5700 (Desktop)
...
...
NVIDIA GeForce GTX 1650 Super (Desktop)
NVIDIA GeForce GTX 1660 (Desktop)
NVIDIA GeForce GTX 1660 Super (Desktop)
NVIDIA GeForce RTX 2060 Super (Desktop)
AMD Radeon RX 5700 (Desktop)
AMD Radeon RX 5600 XT (Desktop)
...
NVIDIA GeForce GTX 1650 Super (Desktop)
NVIDIA GeForce RTX 2060 Super (Desktop)
...
NVIDIA GeForce GTX 1650 Super (Desktop)
NVIDIA GeForce RTX 2060 Super (Desktop)
...
» With all tested laptops playable in detail settings high.
Additional Benchmarks
Low Preset TAA 1280x720
89 [X] Nvidia Titan X (Pascal) AMD Ryzen 9 7950X 4.5GHz
Titan X Pascal
min:
49 fps, max:
117 fps
Intel UHD Graphics Xe 16EUs (Tiger Lake-H)
...
NVIDIA GeForce GTX 1660 (Desktop)
NVIDIA GeForce GTX 1660 Super (Desktop)
NVIDIA GeForce RTX 2060 Super (Desktop)
AMD Radeon RX 5600 XT (Desktop)
AMD Radeon RX 5700 (Desktop)
AMD Radeon RX 5700 XT (Desktop)
...
AMD Radeon RX Vega 6 (Ryzen 4000/5000)
...
NVIDIA GeForce GTX 1650 Super (Desktop)
NVIDIA GeForce GTX 1660 (Desktop)
NVIDIA GeForce GTX 1660 Super (Desktop)
NVIDIA GeForce RTX 2060 Super (Desktop)
AMD Radeon RX 5600 XT (Desktop)
AMD Radeon RX 5700 (Desktop)
AMD Radeon RX 5700 XT (Desktop)
...
...
NVIDIA GeForce GTX 1660 (Desktop)
NVIDIA GeForce RTX 2060 Super (Desktop)
AMD Radeon RX 5700 (Desktop)
AMD Radeon RX 5700 XT (Desktop)
...
...
NVIDIA GeForce GTX 1660 Super (Desktop)
NVIDIA GeForce GTX 1660 (Desktop)
NVIDIA GeForce RTX 2060 Super (Desktop)
AMD Radeon RX 5600 XT (Desktop)
AMD Radeon RX 5700 (Desktop)
AMD Radeon RX 5700 XT (Desktop)
...
...
AMD Radeon RX 5600 XT (Desktop)
NVIDIA GeForce GTX 1650 Super (Desktop)
NVIDIA GeForce GTX 1660 Super (Desktop)
NVIDIA GeForce GTX 1660 (Desktop)
NVIDIA GeForce RTX 2060 Super (Desktop)
AMD Radeon RX 5700 (Desktop)
AMD Radeon RX 5700 XT (Desktop)
...
AMD Radeon RX 5600 XT (Desktop)
NVIDIA GeForce GTX 1660 Super (Desktop)
NVIDIA GeForce GTX 1660 (Desktop)
NVIDIA GeForce RTX 2060 Super (Desktop)
AMD Radeon RX 5700 (Desktop)
AMD Radeon RX 5700 XT (Desktop)
...
» With all tested laptops playable in detail settings ultra.
Additional Benchmarks
Minimum Preset 1280x720
151 [X] Nvidia Titan X (Pascal) AMD Ryzen 9 7950X 4.5GHz
Titan X Pascal
...
NVIDIA GeForce GTX 1660 (Desktop)
NVIDIA GeForce GTX 1660 Super (Desktop)
AMD Radeon RX 5600 XT (Desktop)
NVIDIA GeForce RTX 2060 Super (Desktop)
AMD Radeon RX 5700 (Desktop)
AMD Radeon RX 5700 XT (Desktop)
...
...
NVIDIA GeForce GTX 1660 Super (Desktop)
AMD Radeon RX 5600 XT (Desktop)
AMD Radeon RX 5700 (Desktop)
AMD Radeon RX 5700 XT (Desktop)
NVIDIA GeForce RTX 2060 Super (Desktop)
...
0 100 200 300 400 500 600 700 800 Tooltip
...
NVIDIA GeForce GTX 1660 Super (Desktop)
AMD Radeon RX 5600 XT (Desktop)
AMD Radeon RX 5700 (Desktop)
AMD Radeon RX 5700 XT (Desktop)
NVIDIA GeForce RTX 2060 Super (Desktop)
...
...
NVIDIA GeForce GTX 1660 Super (Desktop)
AMD Radeon RX 5600 XT (Desktop)
AMD Radeon RX 5700 (Desktop)
AMD Radeon RX 5700 XT (Desktop)
NVIDIA GeForce RTX 2060 Super (Desktop)
...
0 100 200 300 400 500 600 700 800 900 1000 1100 1200 1300 1400 1500 1600 1700 1800 1900 2000 2100 Tooltip
...
AMD Radeon RX 5600 XT (Desktop)
AMD Radeon RX 5700 (Desktop)
AMD Radeon RX 5700 XT (Desktop)
NVIDIA GeForce RTX 2060 Super (Desktop)
AMD Radeon RX 6650 XT
...
NVIDIA GeForce GTX 1660 Super (Desktop)
...
AMD Radeon RX 5600 XT (Desktop)
AMD Radeon RX 5700 (Desktop)
NVIDIA GeForce RTX 2060 Super (Desktop)
AMD Radeon RX 5700 XT (Desktop)
AMD Radeon RX 6650 XT
NVIDIA GeForce RTX 3060 Ti
...
» With all tested laptops playable in detail settings ultra.
Additional Benchmarks
Ultra Low Preset LowAA 1280x720
215 [X] Nvidia Titan X (Pascal) AMD Ryzen 9 7950X 4.5GHz
Titan X Pascal
min:
10.7 fps, P0.1:
32.5 fps, P1:
130.1 fps, max:
363 fps
0 100 200 300 400 500 600 Tooltip
AMD Radeon 680M
NVIDIA GeForce GTX 1650 Super (Desktop)
...
AMD Radeon 680M
NVIDIA GeForce GTX 1650 Super (Desktop)
...
AMD Radeon 680M
NVIDIA GeForce GTX 1650 Super (Desktop)
NVIDIA GeForce GTX 1660 (Desktop)
...
NVIDIA GeForce GTX 1650 Super (Desktop)
NVIDIA GeForce GTX 1660 (Desktop)
NVIDIA GeForce GTX 1660 Super (Desktop)
AMD Radeon RX 5600 XT (Desktop)
AMD Radeon RX 5700 (Desktop)
AMD Radeon RX 5700 XT (Desktop)
...
NVIDIA GeForce GTX 1660 (Desktop)
NVIDIA GeForce GTX 1660 Super (Desktop)
AMD Radeon RX 5600 XT (Desktop)
AMD Radeon RX 5700 (Desktop)
AMD Radeon RX 5700 XT (Desktop)
...
» The benchmarks indicate that the game is not playable in the tested settings.
Additional Benchmarks
Low Preset 1280x720
23.7 [X] Nvidia Titan X (Pascal) AMD Ryzen 9 7950X 4.5GHz
Titan X Pascal
min:
10.5 fps, P0.1:
10.9 fps, P1:
16.5 fps, max:
60.3 fps
...
NVIDIA GeForce GTX 1650 Super (Desktop)
NVIDIA GeForce GTX 1660 (Desktop)
NVIDIA GeForce GTX 1660 Super (Desktop)
AMD Radeon RX 5600 XT (Desktop)
AMD Radeon RX 5700 (Desktop)
NVIDIA GeForce RTX 2060 Super (Desktop)
AMD Radeon RX 5700 XT (Desktop)
...
...
NVIDIA GeForce GTX 1650 Super (Desktop)
NVIDIA GeForce GTX 1660 (Desktop)
NVIDIA GeForce GTX 1660 Super (Desktop)
AMD Radeon RX 5600 XT (Desktop)
AMD Radeon RX 5700 (Desktop)
NVIDIA GeForce RTX 2060 Super (Desktop)
AMD Radeon RX 5700 XT (Desktop)
...
...
AMD Radeon RX 5600 XT (Desktop)
AMD Radeon RX 5700 (Desktop)
AMD Radeon RX 5700 XT (Desktop)
NVIDIA GeForce RTX 2060 Super (Desktop)
AMD Radeon RX 6650 XT
...
...
NVIDIA GeForce GTX 1660 Super (Desktop)
AMD Radeon RX 5600 XT (Desktop)
AMD Radeon RX 5700 (Desktop)
NVIDIA GeForce RTX 2060 Super (Desktop)
AMD Radeon RX 5700 XT (Desktop)
AMD Radeon RX 6650 XT
...
NVIDIA GeForce GTX 1650 Super (Desktop)
...
NVIDIA GeForce GTX 1660 (Desktop)
NVIDIA GeForce GTX 1660 Super (Desktop)
AMD Radeon RX 5600 XT (Desktop)
AMD Radeon RX 5700 (Desktop)
AMD Radeon RX 5700 XT (Desktop)
NVIDIA GeForce RTX 2060 Super (Desktop)
AMD Radeon RX 6650 XT
...
...
AMD Radeon RX 5700 (Desktop)
AMD Radeon RX 5700 XT (Desktop)
NVIDIA GeForce RTX 2060 Super (Desktop)
AMD Radeon RX 6650 XT
AMD Radeon RX 6700 XT
AMD Radeon RX 6750 XT
NVIDIA GeForce RTX 3060 Ti
...
» With all tested laptops playable in detail settings high.
Additional Benchmarks
Low Preset 1280x720
93.9 [X] Nvidia Titan X (Pascal) AMD Ryzen 9 7950X 4.5GHz
Titan X Pascal
min:
20.9 fps, P0.1:
26.3 fps, P1:
70.1 fps, max:
194.4 fps
...
AMD Radeon RX 5700 XT (Desktop)
NVIDIA GeForce RTX 2060 Super (Desktop)
AMD Radeon RX 6650 XT
NVIDIA GeForce RTX 3060 Ti
AMD Radeon RX 6700 XT
AMD Radeon RX 6750 XT
NVIDIA Titan RTX
NVIDIA GeForce RTX 3070 Ti
...
...
AMD Radeon RX 5700 (Desktop)
NVIDIA GeForce RTX 2060 Super (Desktop)
AMD Radeon RX 5700 XT (Desktop)
AMD Radeon RX 6650 XT
NVIDIA GeForce RTX 3060 Ti
AMD Radeon RX 6700 XT
AMD Radeon RX 6750 XT
NVIDIA Titan RTX
...
Intel UHD Graphics G1 (Ice Lake 32 EU)
...
AMD Radeon RX 5700 XT (Desktop)
NVIDIA GeForce RTX 2060 Super (Desktop)
AMD Radeon RX 6650 XT
NVIDIA GeForce RTX 3060 Ti
AMD Radeon RX 6700 XT
...
...
NVIDIA GeForce RTX 2060 Super (Desktop)
AMD Radeon RX 5700 XT (Desktop)
AMD Radeon RX 6650 XT
NVIDIA GeForce RTX 3060 Ti
AMD Radeon RX 6700 XT
...
...
NVIDIA GeForce RTX 2060 Super (Desktop)
AMD Radeon RX 6650 XT
NVIDIA GeForce RTX 3060 Ti
AMD Radeon RX 6700 XT
AMD Radeon RX 6750 XT
...
...
NVIDIA GeForce RTX 2060 Super (Desktop)
AMD Radeon RX 6650 XT
AMD Radeon RX 6700 XT
NVIDIA GeForce RTX 3060 Ti
AMD Radeon RX 6750 XT
...
» With all tested laptops playable in detail settings ultra.
Additional Benchmarks
Low Preset 1280x720
544.6 [X] Nvidia Titan X (Pascal) AMD Ryzen 9 7950X 4.5GHz
Titan X Pascal
Intel UHD Graphics Xe 16EUs (Tiger Lake-H)
...
NVIDIA GeForce GTX 1660 (Desktop)
NVIDIA GeForce GTX 1660 Super (Desktop)
AMD Radeon RX 5600 XT (Desktop)
AMD Radeon RX 5700 (Desktop)
AMD Radeon RX 5700 XT (Desktop)
NVIDIA GeForce RTX 2060 Super (Desktop)
...
AMD Radeon RX Vega 6 (Ryzen 4000/5000)
...
NVIDIA GeForce GTX 1660 (Desktop)
AMD Radeon RX 5600 XT (Desktop)
NVIDIA GeForce GTX 1660 Super (Desktop)
AMD Radeon RX 5700 (Desktop)
AMD Radeon RX 5700 XT (Desktop)
NVIDIA GeForce RTX 2060 Super (Desktop)
...
AMD Radeon RX Vega 6 (Ryzen 4000/5000)
...
NVIDIA GeForce GTX 1660 (Desktop)
AMD Radeon RX 5600 XT (Desktop)
NVIDIA GeForce GTX 1660 Super (Desktop)
AMD Radeon RX 5700 (Desktop)
AMD Radeon RX 5700 XT (Desktop)
NVIDIA GeForce RTX 2060 Super (Desktop)
...
...
NVIDIA GeForce GTX 1660 (Desktop)
NVIDIA GeForce GTX 1660 Super (Desktop)
AMD Radeon RX 5600 XT (Desktop)
AMD Radeon RX 5700 (Desktop)
AMD Radeon RX 5700 XT (Desktop)
NVIDIA GeForce RTX 2060 Super (Desktop)
...
...
NVIDIA GeForce GTX 1660 Super (Desktop)
AMD Radeon RX 5600 XT (Desktop)
AMD Radeon RX 5700 (Desktop)
AMD Radeon RX 5700 XT (Desktop)
NVIDIA GeForce RTX 2060 Super (Desktop)
...
...
AMD Radeon RX 5700 (Desktop)
AMD Radeon RX 5700 XT (Desktop)
AMD Radeon RX 5600 XT (Desktop)
...
» With all tested laptops playable in detail settings ultra.
Additional Benchmarks
Low Preset (Adaptive Quality Off) 1280x720
110 [X] Nvidia Titan X (Pascal) AMD Ryzen 9 7950X 4.5GHz
Titan X Pascal
min:
37 fps, P0.1:
43 fps, P1:
67 fps, max:
221 fps
Intel UHD Graphics Xe 16EUs (Tiger Lake-H)
...
NVIDIA GeForce GTX 1660 (Desktop)
NVIDIA GeForce GTX 1660 Super (Desktop)
NVIDIA GeForce RTX 2060 Super (Desktop)
AMD Radeon RX 5600 XT (Desktop)
AMD Radeon RX 5700 (Desktop)
AMD Radeon RX 6650 XT
AMD Radeon RX 5700 XT (Desktop)
...
...
NVIDIA GeForce GTX 1660 (Desktop)
NVIDIA GeForce GTX 1660 Super (Desktop)
NVIDIA GeForce RTX 2060 Super (Desktop)
AMD Radeon RX 5600 XT (Desktop)
AMD Radeon RX 5700 (Desktop)
...
0 100 200 300 400 500 600 Tooltip
...
NVIDIA GeForce GTX 1660 Super (Desktop)
NVIDIA GeForce RTX 2060 Super (Desktop)
AMD Radeon RX 5600 XT (Desktop)
AMD Radeon RX 5700 (Desktop)
...
...
NVIDIA GeForce GTX 1660 Super (Desktop)
AMD Radeon RX 5600 XT (Desktop)
NVIDIA GeForce RTX 2060 Super (Desktop)
AMD Radeon RX 5700 (Desktop)
...
...
NVIDIA GeForce GTX 1650 Super (Desktop)
NVIDIA GeForce GTX 1660 (Desktop)
NVIDIA GeForce GTX 1660 Super (Desktop)
NVIDIA GeForce RTX 2060 Super (Desktop)
AMD Radeon RX 5600 XT (Desktop)
AMD Radeon RX 5700 (Desktop)
AMD Radeon RX 6650 XT
...
NVIDIA GeForce GTX 1650 Super (Desktop)
NVIDIA GeForce GTX 1660 Super (Desktop)
NVIDIA GeForce GTX 1660 (Desktop)
NVIDIA GeForce RTX 2060 Super (Desktop)
AMD Radeon RX 5600 XT (Desktop)
AMD Radeon RX 6650 XT
AMD Radeon RX 5700 (Desktop)
...
» With all tested laptops playable in detail settings ultra.
Additional Benchmarks
Low Preset 1280x720
280 [X] Nvidia Titan X (Pascal) AMD Ryzen 9 7950X 4.5GHz
Titan X Pascal
min:
99.5 fps, P0.1:
192.4 fps, P1:
208 fps, max:
393 fps
Intel UHD Graphics 32EUs (Alder Lake)
...
NVIDIA GeForce GTX 1660 (Desktop)
NVIDIA GeForce GTX 1660 Super (Desktop)
AMD Radeon RX 5600 XT (Desktop)
NVIDIA GeForce RTX 2060 Super (Desktop)
AMD Radeon RX 5700 (Desktop)
NVIDIA GeForce RTX 3060 Ti
AMD Radeon RX 6650 XT
AMD Radeon RX 5700 XT (Desktop)
...
Intel UHD Graphics 32EUs (Alder Lake)
...
NVIDIA GeForce GTX 1660 Super (Desktop)
AMD Radeon RX 5600 XT (Desktop)
NVIDIA GeForce RTX 2060 Super (Desktop)
AMD Radeon RX 5700 (Desktop)
AMD Radeon RX 5700 XT (Desktop)
NVIDIA GeForce RTX 3060 Ti
...
Intel UHD Graphics 32EUs (Alder Lake)
...
NVIDIA GeForce RTX 2060 Super (Desktop)
AMD Radeon RX 5700 XT (Desktop)
AMD Radeon RX 6650 XT
AMD Radeon RX 6700 XT
AMD Radeon RX 6750 XT
NVIDIA GeForce RTX 3060 Ti
NVIDIA Titan RTX
NVIDIA GeForce RTX 3070 Ti
...
...
NVIDIA GeForce RTX 2060 Super (Desktop)
AMD Radeon RX 5700 XT (Desktop)
AMD Radeon RX 6650 XT
AMD Radeon RX 6700 XT
NVIDIA GeForce RTX 3060 Ti
AMD Radeon RX 6750 XT
NVIDIA GeForce RTX 3070 Ti
NVIDIA Titan RTX
...
...
NVIDIA GeForce RTX 2060 Super (Desktop)
AMD Radeon RX 5700 XT (Desktop)
AMD Radeon RX 6650 XT
AMD Radeon RX 6750 XT
AMD Radeon RX 6700 XT
NVIDIA GeForce RTX 3060 Ti
NVIDIA Titan RTX
NVIDIA GeForce RTX 3070 Ti
...
» With all tested laptops playable in detail settings ultra.
Additional Benchmarks
Low Preset 1280x720
343 [X] Nvidia Titan X (Pascal) AMD Ryzen 9 7950X 4.5GHz
Titan X Pascal
min:
45 fps, P0.1:
125.9 fps, P1:
162.2 fps, max:
949 fps
Intel UHD Graphics Xe 16EUs (Tiger Lake-H)
...
AMD Radeon RX 5600 XT (Desktop)
AMD Radeon RX 5700 (Desktop)
NVIDIA GeForce GTX 1660 Super (Desktop)
NVIDIA GeForce RTX 2060 Super (Desktop)
AMD Radeon RX 5700 XT (Desktop)
...
...
NVIDIA GeForce GTX 1660 Super (Desktop)
AMD Radeon RX 5600 XT (Desktop)
AMD Radeon RX 5700 (Desktop)
NVIDIA GeForce RTX 2060 Super (Desktop)
AMD Radeon RX 5700 XT (Desktop)
...
...
NVIDIA GeForce GTX 1660 (Desktop)
NVIDIA GeForce GTX 1660 Super (Desktop)
AMD Radeon RX 5600 XT (Desktop)
AMD Radeon RX 5700 (Desktop)
AMD Radeon RX 5700 XT (Desktop)
NVIDIA GeForce RTX 2060 Super (Desktop)
...
...
NVIDIA GeForce GTX 1660 (Desktop)
AMD Radeon RX 5600 XT (Desktop)
NVIDIA GeForce GTX 1080 (Desktop)
NVIDIA GeForce GTX 1660 Super (Desktop)
AMD Radeon RX 5700 (Desktop)
AMD Radeon RX 5700 XT (Desktop)
NVIDIA GeForce RTX 2060 Super (Desktop)
...
...
NVIDIA GeForce GTX 1660 (Desktop)
NVIDIA GeForce GTX 1080 (Desktop)
AMD Radeon RX 5600 XT (Desktop)
NVIDIA GeForce GTX 1660 Super (Desktop)
AMD Radeon RX 5700 (Desktop)
AMD Radeon RX 5700 XT (Desktop)
NVIDIA GeForce RTX 2060 Super (Desktop)
AMD Radeon RX 6650 XT
...
NVIDIA GeForce GTX 1650 Super (Desktop)
...
NVIDIA GeForce GTX 1080 (Desktop)
NVIDIA GeForce GTX 1660 (Desktop)
AMD Radeon RX 5600 XT (Desktop)
NVIDIA GeForce GTX 1660 Super (Desktop)
AMD Radeon RX 5700 (Desktop)
AMD Radeon RX 5700 XT (Desktop)
AMD Radeon RX 6650 XT
NVIDIA GeForce RTX 2060 Super (Desktop)
...
» With all tested laptops playable in detail settings ultra.
Additional Benchmarks
Low Preset (FSR off) 1280x720
133.9 [X] Nvidia Titan X (Pascal) AMD Ryzen 9 7950X 4.5GHz
Titan X Pascal
min:
89.1 fps, max:
212 fps
Steam Deck 1280x720
150 [X] Nvidia Titan X (Pascal) AMD Ryzen 9 7950X 4.5GHz
Titan X Pascal
min:
83.9 fps, max:
238 fps
Intel UHD Graphics Xe 16EUs (Tiger Lake-H)
...
NVIDIA GeForce GTX 1660 (Desktop)
NVIDIA GeForce GTX 1660 Super (Desktop)
AMD Radeon RX 5600 XT (Desktop)
AMD Radeon RX 5700 (Desktop)
NVIDIA GeForce RTX 2060 Super (Desktop)
AMD Radeon RX 5700 XT (Desktop)
...
AMD Radeon RX Vega 6 (Ryzen 4000/5000)
...
NVIDIA GeForce GTX 1660 Super (Desktop)
AMD Radeon RX 5600 XT (Desktop)
AMD Radeon RX 5700 (Desktop)
NVIDIA GeForce RTX 2060 Super (Desktop)
AMD Radeon RX 5700 XT (Desktop)
...
0 100 200 300 400 500 600 700 800 Tooltip
AMD Radeon RX Vega 6 (Ryzen 4000/5000)
...
NVIDIA GeForce GTX 1660 Super (Desktop)
AMD Radeon RX 5600 XT (Desktop)
AMD Radeon RX 5700 (Desktop)
NVIDIA GeForce RTX 2060 Super (Desktop)
AMD Radeon RX 5700 XT (Desktop)
...
0 100 200 300 400 500 600 Tooltip
...
NVIDIA GeForce GTX 1660 Super (Desktop)
AMD Radeon RX 5600 XT (Desktop)
AMD Radeon RX 5700 (Desktop)
AMD Radeon RX 5700 XT (Desktop)
NVIDIA GeForce RTX 2060 Super (Desktop)
...
...
AMD Radeon RX 5600 XT (Desktop)
AMD Radeon RX 5700 (Desktop)
NVIDIA GeForce RTX 2060 Super (Desktop)
AMD Radeon RX 5700 XT (Desktop)
AMD Radeon RX 6650 XT
...
...
AMD Radeon RX 5600 XT (Desktop)
AMD Radeon RX 5700 (Desktop)
NVIDIA GeForce RTX 2060 Super (Desktop)
AMD Radeon RX 5700 XT (Desktop)
AMD Radeon RX 6650 XT
...
» With all tested laptops playable in detail settings ultra.
Additional Benchmarks
Low Preset 1280x720
207 [X] Nvidia Titan X (Pascal) AMD Ryzen 9 7950X 4.5GHz
Titan X Pascal
min:
39.2 fps, P0.1:
99.4 fps, P1:
129.2 fps, max:
404 fps
...
NVIDIA GeForce GTX 1660 (Desktop)
NVIDIA GeForce GTX 1660 Super (Desktop)
AMD Radeon RX 5600 XT (Desktop)
NVIDIA GeForce RTX 2060 Super (Desktop)
AMD Radeon RX 5700 (Desktop)
...
0 100 200 300 400 500 600 700 800 900 Tooltip
...
NVIDIA GeForce GTX 1660 (Desktop)
NVIDIA GeForce GTX 1660 Super (Desktop)
AMD Radeon RX 5600 XT (Desktop)
NVIDIA GeForce RTX 2060 Super (Desktop)
AMD Radeon RX 5700 (Desktop)
...
...
NVIDIA GeForce GTX 1660 Super (Desktop)
NVIDIA GeForce GTX 1660 (Desktop)
AMD Radeon RX 5600 XT (Desktop)
NVIDIA GeForce RTX 2060 Super (Desktop)
AMD Radeon RX 5700 (Desktop)
...
...
NVIDIA GeForce GTX 1660 (Desktop)
NVIDIA GeForce GTX 1660 Super (Desktop)
AMD Radeon RX 5600 XT (Desktop)
NVIDIA GeForce RTX 2060 Super (Desktop)
AMD Radeon RX 5700 (Desktop)
...
NVIDIA GeForce GTX 1650 Super (Desktop)
NVIDIA GeForce GTX 1660 (Desktop)
NVIDIA GeForce GTX 1660 Super (Desktop)
AMD Radeon RX 5600 XT (Desktop)
NVIDIA GeForce RTX 2060 Super (Desktop)
AMD Radeon RX 5700 (Desktop)
...
NVIDIA GeForce GTX 1660 (Desktop)
NVIDIA GeForce GTX 1660 Super (Desktop)
AMD Radeon RX 5600 XT (Desktop)
AMD Radeon RX 5700 (Desktop)
NVIDIA GeForce RTX 2060 Super (Desktop)
...
» With all tested laptops playable in detail settings med..
Additional Benchmarks
Low Preset 1280x720
62.7 [X] Nvidia Titan X (Pascal) AMD Ryzen 9 7950X 4.5GHz
Titan X Pascal
min:
44.8 fps, P0.1:
46.6 fps, P1:
49.3 fps, max:
103.5 fps
...
NVIDIA GeForce RTX 2060 Super (Desktop)
NVIDIA GeForce RTX 3070 Ti
NVIDIA GeForce RTX 3060 Ti
AMD Radeon RX 5700 XT (Desktop)
AMD Radeon RX 6650 XT
AMD Radeon RX 6750 XT
NVIDIA Titan RTX
AMD Radeon RX 6700 XT
...
...
AMD Radeon RX 6650 XT
NVIDIA GeForce RTX 2060 Super (Desktop)
AMD Radeon RX 6700 XT
AMD Radeon RX 6750 XT
NVIDIA GeForce RTX 3060 Ti
NVIDIA GeForce RTX 3070 Ti
NVIDIA Titan RTX
...
...
NVIDIA GeForce RTX 2060 Super (Desktop)
AMD Radeon RX 5700 XT (Desktop)
AMD Radeon RX 6650 XT
AMD Radeon RX 6700 XT
AMD Radeon RX 6750 XT
NVIDIA Titan RTX
NVIDIA GeForce RTX 3060 Ti
...
...
AMD Radeon RX 5700 XT (Desktop)
NVIDIA GeForce RTX 2060 Super (Desktop)
AMD Radeon RX 6650 XT
AMD Radeon RX 6700 XT
AMD Radeon RX 6750 XT
...
...
AMD Radeon RX 5700 XT (Desktop)
NVIDIA GeForce RTX 2060 Super (Desktop)
AMD Radeon RX 6650 XT
AMD Radeon RX 6700 XT
AMD Radeon RX 6750 XT
NVIDIA GeForce RTX 3060 Ti
...
...
NVIDIA GeForce RTX 2060 Super (Desktop)
AMD Radeon RX 6650 XT
AMD Radeon RX 5700 XT (Desktop)
AMD Radeon RX 6700 XT
AMD Radeon RX 6750 XT
NVIDIA GeForce RTX 3060 Ti
...
» With all tested laptops playable in detail settings ultra.
Additional Benchmarks
Low Preset 1280x720
119.6 [X] Nvidia Titan X (Pascal) AMD Ryzen 9 7950X 4.5GHz
Titan X Pascal
min:
49.9 fps, P0.1:
86.7 fps, P1:
97.6 fps, max:
185.3 fps
...
Intel Arc A380
NVIDIA GeForce GTX 1660 (Desktop)
NVIDIA GeForce GTX 1660 Super (Desktop)
NVIDIA GeForce RTX 2060 Super (Desktop)
AMD Radeon RX 5600 XT (Desktop)
AMD Radeon RX 5700 (Desktop)
...
...
NVIDIA GeForce GTX 1660 (Desktop)
NVIDIA GeForce GTX 1660 Super (Desktop)
NVIDIA GeForce RTX 2060 Super (Desktop)
AMD Radeon RX 5600 XT (Desktop)
AMD Radeon RX 5700 (Desktop)
...
...
Intel Arc A380
NVIDIA GeForce GTX 1660 (Desktop)
NVIDIA GeForce GTX 1660 Super (Desktop)
NVIDIA GeForce RTX 2060 Super (Desktop)
AMD Radeon RX 5600 XT (Desktop)
AMD Radeon RX 5700 (Desktop)
...
NVIDIA GeForce GTX 1660 (Desktop)
NVIDIA GeForce GTX 1660 Super (Desktop)
AMD Radeon RX 5700 XT (Desktop)
AMD Radeon RX 5600 XT (Desktop)
NVIDIA GeForce RTX 2060 Super (Desktop)
AMD Radeon RX 5700 (Desktop)
...
NVIDIA GeForce GTX 1660 Super (Desktop)
AMD Radeon RX 5600 XT (Desktop)
NVIDIA GeForce RTX 2060 Super (Desktop)
AMD Radeon RX 5700 (Desktop)
...
» With all tested laptops playable in detail settings high.
Additional Benchmarks
Low 1280x720
78.6 [X] Nvidia Titan X (Pascal) AMD Ryzen 9 7950X 4.5GHz
Titan X Pascal
min:
19.9 fps, P0.1:
33.5 fps, P1:
54.1 fps, max:
145.7 fps
0 100 Tooltip : Ø120.7 (106.214-148.78)
...
NVIDIA GeForce GTX 1660 (Desktop)
NVIDIA GeForce GTX 1660 Super (Desktop)
AMD Radeon RX 5600 XT (Desktop)
AMD Radeon RX 5700 (Desktop)
NVIDIA GeForce RTX 2060 Super (Desktop)
AMD Radeon RX 5700 XT (Desktop)
...
...
NVIDIA GeForce GTX 1660 (Desktop)
NVIDIA GeForce GTX 1660 Super (Desktop)
AMD Radeon RX 5600 XT (Desktop)
AMD Radeon RX 5700 (Desktop)
NVIDIA GeForce RTX 2060 Super (Desktop)
AMD Radeon RX 5700 XT (Desktop)
...
AMD Radeon RX Vega 6 (Ryzen 4000/5000)
...
NVIDIA GeForce GTX 1660 Super (Desktop)
AMD Radeon RX 5600 XT (Desktop)
AMD Radeon RX 5700 (Desktop)
NVIDIA GeForce RTX 2060 Super (Desktop)
AMD Radeon RX 5700 XT (Desktop)
...
0 100 200 300 400 500 600 700 800 Tooltip
...
NVIDIA GeForce GTX 1660 Super (Desktop)
AMD Radeon RX 5600 XT (Desktop)
AMD Radeon RX 5700 (Desktop)
NVIDIA GeForce RTX 2060 Super (Desktop)
AMD Radeon RX 5700 XT (Desktop)
AMD Radeon RX 6650 XT
...
...
AMD Radeon RX 5600 XT (Desktop)
NVIDIA GeForce GTX 1660 (Desktop)
NVIDIA GeForce GTX 1660 Super (Desktop)
AMD Radeon RX 5700 (Desktop)
NVIDIA GeForce RTX 2060 Super (Desktop)
AMD Radeon RX 5700 XT (Desktop)
AMD Radeon RX 6650 XT
...
...
NVIDIA GeForce GTX 1660 Super (Desktop)
AMD Radeon RX 5700 (Desktop)
NVIDIA GeForce RTX 2060 Super (Desktop)
AMD Radeon RX 5700 XT (Desktop)
AMD Radeon RX 6650 XT
AMD Radeon RX 6700 XT
...
» With all tested laptops playable in detail settings ultra.
Additional Benchmarks
Low Preset 1280x720
191.4 [X] Nvidia Titan X (Pascal) AMD Ryzen 9 7950X 4.5GHz
Titan X Pascal
min:
60.1 fps, P0.1:
110 fps, P1:
146.2 fps, max:
253 fps
...
NVIDIA GeForce GTX 1660 Super (Desktop)
AMD Radeon RX 5600 XT (Desktop)
AMD Radeon RX 5700 (Desktop)
AMD Radeon RX 5700 XT (Desktop)
...
...
NVIDIA GeForce GTX 1660 Super (Desktop)
AMD Radeon RX 5600 XT (Desktop)
AMD Radeon RX 5700 (Desktop)
AMD Radeon RX 5700 XT (Desktop)
...
...
NVIDIA GeForce GTX 1660 (Desktop)
NVIDIA GeForce GTX 1660 Super (Desktop)
AMD Radeon RX 5600 XT (Desktop)
AMD Radeon RX 5700 (Desktop)
AMD Radeon RX 5700 XT (Desktop)
NVIDIA GeForce RTX 2060 Super (Desktop)
...
...
NVIDIA GeForce GTX 1660 (Desktop)
NVIDIA GeForce GTX 1660 Super (Desktop)
NVIDIA GeForce GTX 1080 (Desktop)
AMD Radeon RX 5600 XT (Desktop)
AMD Radeon RX 5700 (Desktop)
NVIDIA GeForce RTX 2060 Super (Desktop)
AMD Radeon RX 5700 XT (Desktop)
...
...
NVIDIA GeForce GTX 1650 Super (Desktop)
NVIDIA GeForce GTX 1660 (Desktop)
NVIDIA GeForce GTX 1660 Super (Desktop)
NVIDIA GeForce GTX 1080 (Desktop)
AMD Radeon RX 5600 XT (Desktop)
AMD Radeon RX 5700 (Desktop)
NVIDIA GeForce RTX 2060 Super (Desktop)
AMD Radeon RX 5700 XT (Desktop)
...
NVIDIA GeForce GTX 1650 Super (Desktop)
...
NVIDIA GeForce GTX 1660 (Desktop)
NVIDIA GeForce GTX 1660 Super (Desktop)
NVIDIA GeForce GTX 1080 (Desktop)
AMD Radeon RX 5600 XT (Desktop)
AMD Radeon RX 5700 (Desktop)
NVIDIA GeForce RTX 2060 Super (Desktop)
AMD Radeon RX 5700 XT (Desktop)
...
» With all tested laptops playable in detail settings ultra.
Additional Benchmarks
Low Preset 1280x720
169.2 [X] Nvidia Titan X (Pascal) AMD Ryzen 9 7950X 4.5GHz
Titan X Pascal
min:
65.2 fps, P0.1:
94.9 fps, P1:
140 fps, max:
422 fps
...
AMD Radeon RX 5700 XT (Desktop)
NVIDIA GeForce RTX 3060 Ti
AMD Radeon RX 6700 XT
AMD Radeon RX 6750 XT
NVIDIA GeForce RTX 3070 Ti
...
...
NVIDIA GeForce RTX 2060 Super (Desktop)
NVIDIA GeForce RTX 3060 Ti
AMD Radeon RX 6700 XT
AMD Radeon RX 6750 XT
NVIDIA GeForce RTX 3070 Ti
...
AMD Radeon RX 560X (Laptop)
...
AMD Radeon RX 5700 XT (Desktop)
NVIDIA GeForce RTX 2060 Super (Desktop)
NVIDIA GeForce RTX 3060 Ti
AMD Radeon RX 6700 XT
...
0 100 200 300 400 500 600 700 Tooltip
...
AMD Radeon RX 5700 (Desktop)
AMD Radeon RX 5700 XT (Desktop)
NVIDIA GeForce RTX 2060 Super (Desktop)
NVIDIA GeForce RTX 3060 Ti
AMD Radeon RX 6700 XT
...
...
AMD Radeon RX 5700 (Desktop)
AMD Radeon RX 5700 XT (Desktop)
NVIDIA GeForce RTX 2060 Super (Desktop)
NVIDIA GeForce RTX 3060 Ti
AMD Radeon RX 6700 XT
...
...
AMD Radeon RX 5600 XT (Desktop)
AMD Radeon RX 6650 XT
AMD Radeon RX 5700 (Desktop)
AMD Radeon RX 5700 XT (Desktop)
NVIDIA GeForce RTX 2060 Super (Desktop)
AMD Radeon RX 6750 XT
...
» With all tested laptops playable in detail settings ultra.
Additional Benchmarks
Very Low Preset 1280x720
138.1 [X] Nvidia Titan X (Pascal) AMD Ryzen 9 7950X 4.5GHz
Titan X Pascal
min:
108.8 fps, P0.1:
114.5 fps, P1:
122.1 fps, max:
181.2 fps
Intel UHD Graphics Xe 16EUs (Tiger Lake-H)
...
AMD Radeon RX 5600 XT (Desktop)
AMD Radeon RX 5700 (Desktop)
NVIDIA GeForce RTX 2060 Super (Desktop)
AMD Radeon RX 5700 XT (Desktop)
...
...
AMD Radeon RX 5600 XT (Desktop)
AMD Radeon RX 5700 (Desktop)
NVIDIA GeForce RTX 2060 Super (Desktop)
AMD Radeon RX 5700 XT (Desktop)
...
Intel UHD Graphics Xe 16EUs (Tiger Lake-H)
...
AMD Radeon RX 5600 XT (Desktop)
AMD Radeon RX 5700 (Desktop)
NVIDIA GeForce RTX 2060 Super (Desktop)
AMD Radeon RX 5700 XT (Desktop)
...
...
NVIDIA GeForce RTX 3070 Ti
AMD Radeon RX 5600 XT (Desktop)
AMD Radeon RX 5700 (Desktop)
AMD Radeon RX 5700 XT (Desktop)
...
AMD Radeon RX 5600 XT (Desktop)
AMD Radeon RX 5700 (Desktop)
AMD Radeon RX 5700 XT (Desktop)
...
AMD Radeon RX 5600 XT (Desktop)
AMD Radeon RX 5700 (Desktop)
AMD Radeon RX 5700 XT (Desktop)
» With all tested laptops playable in detail settings ultra.
Additional Benchmarks
Ultra Low Preset TAA 1280x720
384 [X] Nvidia Titan X (Pascal) AMD Ryzen 9 7950X 4.5GHz
Titan X Pascal
min:
287 fps, P1:
254 fps, max:
463 fps
...
AMD Radeon RX 5700 XT (Desktop)
NVIDIA GeForce RTX 2060 Super (Desktop)
AMD Radeon RX 6650 XT
AMD Radeon RX 6700 XT
AMD Radeon RX 6750 XT
...
...
AMD Radeon RX 5600 XT (Desktop)
AMD Radeon RX 5700 (Desktop)
AMD Radeon RX 5700 XT (Desktop)
NVIDIA GeForce RTX 2060 Super (Desktop)
AMD Radeon RX 6650 XT
...
Intel UHD Graphics 32EUs (Alder Lake)
...
AMD Radeon RX 6650 XT
AMD Radeon RX 6700 XT
NVIDIA GeForce RTX 3060 Ti
AMD Radeon RX 6750 XT
NVIDIA Titan RTX
...
Intel UHD Graphics 32EUs (Alder Lake)
...
AMD Radeon RX 5700 XT (Desktop)
NVIDIA GeForce RTX 2060 Super (Desktop)
AMD Radeon RX 6650 XT
...
...
AMD Radeon RX 5700 XT (Desktop)
NVIDIA GeForce RTX 2060 Super (Desktop)
AMD Radeon RX 6650 XT
NVIDIA GeForce RTX 3060 Ti
AMD Radeon RX 6700 XT
...
...
NVIDIA GeForce GTX 1660 Super (Desktop)
AMD Radeon RX 5600 XT (Desktop)
AMD Radeon RX 5700 (Desktop)
NVIDIA GeForce RTX 2060 Super (Desktop)
AMD Radeon RX 5700 XT (Desktop)
AMD Radeon RX 6650 XT
...
» With all tested laptops playable in detail settings ultra.
Additional Benchmarks
Low Preset 1280x720
381 [X] Nvidia Titan X (Pascal) AMD Ryzen 9 7950X 4.5GHz
Titan X Pascal
min:
58.3 fps, P0.1:
180.8 fps, P1:
262 fps, max:
678 fps
...
NVIDIA GeForce GTX 1660 (Desktop)
NVIDIA GeForce GTX 1660 Super (Desktop)
AMD Radeon RX 5700 (Desktop)
AMD Radeon RX 5600 XT (Desktop)
NVIDIA GeForce RTX 2060 Super (Desktop)
AMD Radeon RX 5700 XT (Desktop)
...
...
NVIDIA GeForce GTX 1660 (Desktop)
NVIDIA GeForce GTX 1660 Super (Desktop)
AMD Radeon RX 5700 (Desktop)
AMD Radeon RX 5600 XT (Desktop)
NVIDIA GeForce RTX 2060 Super (Desktop)
AMD Radeon RX 5700 XT (Desktop)
...
0 100 200 300 400 500 600 700 800 900 Tooltip
AMD Radeon RX 560X (Laptop)
...
NVIDIA GeForce GTX 1660 (Desktop)
NVIDIA GeForce GTX 1660 Super (Desktop)
AMD Radeon RX 5700 (Desktop)
NVIDIA GeForce RTX 2060 Super (Desktop)
AMD Radeon RX 5600 XT (Desktop)
AMD Radeon RX 5700 XT (Desktop)
...
...
NVIDIA GeForce GTX 1660 Super (Desktop)
AMD Radeon RX 5700 (Desktop)
NVIDIA GeForce RTX 2060 Super (Desktop)
AMD Radeon RX 5600 XT (Desktop)
AMD Radeon RX 5700 XT (Desktop)
...
...
NVIDIA GeForce GTX 1660 Super (Desktop)
AMD Radeon RX 5700 (Desktop)
NVIDIA GeForce RTX 2060 Super (Desktop)
AMD Radeon RX 5600 XT (Desktop)
AMD Radeon RX 5700 XT (Desktop)
AMD Radeon RX 6650 XT
...
NVIDIA GeForce GTX 1650 Super (Desktop)
...
AMD Radeon RX 5600 XT (Desktop)
AMD Radeon RX 5700 (Desktop)
NVIDIA GeForce RTX 2060 Super (Desktop)
AMD Radeon RX 5700 XT (Desktop)
AMD Radeon RX 6650 XT
...
» With all tested laptops playable in detail settings ultra.
Additional Benchmarks
Low Preset 1280x720
113.9 [X] Nvidia Titan X (Pascal) AMD Ryzen 9 7950X 4.5GHz
Titan X Pascal
min:
38 fps, P0.1:
49.2 fps, P1:
80.8 fps, max:
175.7 fps
...
AMD Radeon RX 5700 (Desktop)
AMD Radeon RX 5700 XT (Desktop)
NVIDIA GeForce RTX 2060 Super (Desktop)
AMD Radeon RX 6650 XT
NVIDIA Titan RTX
...
AMD Radeon RX Vega 8 (Ryzen 2000/3000)
...
AMD Radeon RX 5700 (Desktop)
AMD Radeon RX 5700 XT (Desktop)
NVIDIA GeForce RTX 2060 Super (Desktop)
AMD Radeon RX 6650 XT
...
0 100 Tooltip : Ø144.6 (123.179-184.39)
...
AMD Radeon RX 5700 (Desktop)
AMD Radeon RX 5700 XT (Desktop)
NVIDIA GeForce RTX 2060 Super (Desktop)
AMD Radeon RX 6650 XT
...
...
NVIDIA GeForce GTX 1660 Super (Desktop)
AMD Radeon RX 5600 XT (Desktop)
AMD Radeon RX 5700 (Desktop)
NVIDIA GeForce RTX 2060 Super (Desktop)
AMD Radeon RX 5700 XT (Desktop)
AMD Radeon RX 6650 XT
...
...
AMD Radeon RX 5600 XT (Desktop)
AMD Radeon RX 5700 (Desktop)
NVIDIA GeForce RTX 2060 Super (Desktop)
AMD Radeon RX 5700 XT (Desktop)
AMD Radeon RX 6650 XT
...
NVIDIA GeForce GTX 1650 Super (Desktop)
...
NVIDIA GeForce GTX 1660 Super (Desktop)
AMD Radeon RX 5600 XT (Desktop)
AMD Radeon RX 5700 (Desktop)
NVIDIA GeForce RTX 2060 Super (Desktop)
AMD Radeon RX 5700 XT (Desktop)
AMD Radeon RX 6650 XT
...
» With all tested laptops playable in detail settings ultra.
Additional Benchmarks
Low Preset Low TAA 1280x720
338 [X] Nvidia Titan X (Pascal) AMD Ryzen 9 7950X 4.5GHz
Titan X Pascal
min:
14.1 fps, P0.1:
43.6 fps, P1:
222 fps, max:
451 fps
0 100 200 300 400 500 600 700 800 900 1000 1100 Tooltip
...
NVIDIA GeForce GTX 1650 Super (Desktop)
NVIDIA GeForce GTX 1660 (Desktop)
NVIDIA GeForce GTX 1660 Super (Desktop)
AMD Radeon RX 5600 XT (Desktop)
AMD Radeon RX 5700 (Desktop)
NVIDIA GeForce RTX 2060 Super (Desktop)
...
...
NVIDIA GeForce GTX 1650 Super (Desktop)
NVIDIA GeForce GTX 1660 (Desktop)
NVIDIA GeForce GTX 1660 Super (Desktop)
AMD Radeon RX 5600 XT (Desktop)
AMD Radeon RX 5700 (Desktop)
NVIDIA GeForce RTX 2060 Super (Desktop)
...
...
NVIDIA GeForce GTX 1660 (Desktop)
NVIDIA GeForce GTX 1660 Super (Desktop)
AMD Radeon RX 5600 XT (Desktop)
AMD Radeon RX 5700 (Desktop)
NVIDIA GeForce RTX 2060 Super (Desktop)
AMD Radeon RX 5700 XT (Desktop)
...
AMD Radeon RX 560X (Laptop)
...
NVIDIA GeForce GTX 1660 Super (Desktop)
AMD Radeon RX 5600 XT (Desktop)
NVIDIA GeForce RTX 2060 Super (Desktop)
AMD Radeon RX 5700 (Desktop)
AMD Radeon RX 6650 XT
AMD Radeon RX 5700 XT (Desktop)
...
NVIDIA GeForce GTX 1650 Super (Desktop)
...
NVIDIA GeForce GTX 1660 Super (Desktop)
AMD Radeon RX 5600 XT (Desktop)
NVIDIA GeForce RTX 2060 Super (Desktop)
AMD Radeon RX 5700 (Desktop)
AMD Radeon RX 6650 XT
AMD Radeon RX 5700 XT (Desktop)
...
NVIDIA GeForce GTX 1660 Super (Desktop)
...
NVIDIA GeForce RTX 2060 Super (Desktop)
NVIDIA GeForce RTX 3060 Ti
AMD Radeon RX 6650 XT
AMD Radeon RX 5700 (Desktop)
AMD Radeon RX 5700 XT (Desktop)
AMD Radeon RX 6700 XT
...
» With all tested laptops playable in detail settings ultra.
Additional Benchmarks
Low Preset 1280x720
98.1 [X] Nvidia Titan X (Pascal) AMD Ryzen 9 7950X 4.5GHz
Titan X Pascal
min:
11 fps, P0.1:
75 fps, P1:
82.2 fps, max:
138.4 fps
...
NVIDIA GeForce GTX 1660 Super (Desktop)
NVIDIA GeForce RTX 2060 Super (Desktop)
AMD Radeon RX 5600 XT (Desktop)
AMD Radeon RX 5700 (Desktop)
AMD Radeon RX 5700 XT (Desktop)
...
...
NVIDIA GeForce GTX 1660 Super (Desktop)
AMD Radeon RX 5600 XT (Desktop)
NVIDIA GeForce RTX 2060 Super (Desktop)
AMD Radeon RX 5700 (Desktop)
...
...
NVIDIA GeForce GTX 1660 Super (Desktop)
AMD Radeon RX 5600 XT (Desktop)
NVIDIA GeForce RTX 2060 Super (Desktop)
AMD Radeon RX 5700 (Desktop)
AMD Radeon RX 5700 XT (Desktop)
...
0 100 200 300 400 500 600 700 800 900 1000 1100 1200 1300 1400 1500 1600 1700 1800 1900 2000 2100 2200 2300 Tooltip
...
AMD Radeon RX 5700 (Desktop)
AMD Radeon RX 5700 XT (Desktop)
AMD Radeon RX 6700 XT
AMD Radeon RX 6750 XT
...
...
AMD Radeon RX 5600 XT (Desktop)
AMD Radeon RX 5700 (Desktop)
AMD Radeon RX 5700 XT (Desktop)
AMD Radeon RX 6700 XT
...
NVIDIA GeForce GTX 1650 Super (Desktop)
...
AMD Radeon RX 5600 XT (Desktop)
AMD Radeon RX 5700 (Desktop)
AMD Radeon RX 5700 XT (Desktop)
AMD Radeon RX 6700 XT
AMD Radeon RX 6750 XT
...
» With all tested laptops playable in detail settings ultra.
Additional Benchmarks
Prioritize Performance Preset 1280x720
188.6 [X] Nvidia Titan X (Pascal) AMD Ryzen 9 7950X 4.5GHz
Titan X Pascal
min:
18.9 fps, P0.1:
85.4 fps, P1:
149 fps, max:
243 fps
...
NVIDIA GeForce GTX 1660 (Desktop)
NVIDIA GeForce GTX 1660 Super (Desktop)
AMD Radeon RX 5600 XT (Desktop)
AMD Radeon RX 5700 (Desktop)
NVIDIA GeForce RTX 2060 Super (Desktop)
...
AMD Radeon RX Vega 8 (Ryzen 2000/3000)
...
NVIDIA GeForce GTX 1660 (Desktop)
NVIDIA GeForce GTX 1660 Super (Desktop)
AMD Radeon RX 5600 XT (Desktop)
AMD Radeon RX 5700 (Desktop)
NVIDIA GeForce RTX 2060 Super (Desktop)
...
AMD Radeon RX Vega 6 (Ryzen 4000/5000)
...
NVIDIA GeForce GTX 1660 (Desktop)
NVIDIA GeForce GTX 1660 Super (Desktop)
AMD Radeon RX 5600 XT (Desktop)
AMD Radeon RX 5700 (Desktop)
NVIDIA GeForce RTX 2060 Super (Desktop)
AMD Radeon RX 5700 XT (Desktop)
...
AMD Radeon RX Vega 6 (Ryzen 4000/5000)
...
NVIDIA GeForce GTX 1660 (Desktop)
NVIDIA GeForce GTX 1660 Super (Desktop)
AMD Radeon RX 5600 XT (Desktop)
AMD Radeon RX 5700 (Desktop)
NVIDIA GeForce RTX 2060 Super (Desktop)
AMD Radeon RX 5700 XT (Desktop)
...
NVIDIA GeForce GTX 1650 Super (Desktop)
...
NVIDIA GeForce GTX 1660 (Desktop)
NVIDIA GeForce GTX 1660 Super (Desktop)
AMD Radeon RX 5600 XT (Desktop)
AMD Radeon RX 5700 (Desktop)
NVIDIA GeForce RTX 2060 Super (Desktop)
AMD Radeon RX 5700 XT (Desktop)
AMD Radeon RX 6650 XT
...
...
AMD Radeon RX 5600 XT (Desktop)
NVIDIA GeForce RTX 2060 Super (Desktop)
AMD Radeon RX 5700 (Desktop)
AMD Radeon RX 6650 XT
AMD Radeon RX 5700 XT (Desktop)
...
» With all tested laptops playable in detail settings ultra.
Additional Benchmarks
Minimum Settings 1280x720
167.8 [X] Nvidia Titan X (Pascal) AMD Ryzen 9 7950X 4.5GHz
Titan X Pascal
...
AMD Radeon RX 5600 XT (Desktop)
NVIDIA GeForce RTX 2060 Super (Desktop)
AMD Radeon RX 5700 (Desktop)
AMD Radeon RX 5700 XT (Desktop)
...
...
AMD Radeon RX 5600 XT (Desktop)
AMD Radeon RX 5700 (Desktop)
NVIDIA GeForce RTX 2060 Super (Desktop)
AMD Radeon RX 5700 XT (Desktop)
...
...
AMD Radeon RX 5600 XT (Desktop)
AMD Radeon RX 5700 (Desktop)
NVIDIA GeForce RTX 2060 Super (Desktop)
AMD Radeon RX 5700 XT (Desktop)
...
...
AMD Radeon RX 5700 (Desktop)
NVIDIA GeForce RTX 2060 Super (Desktop)
AMD Radeon RX 5700 XT (Desktop)
...
0 100 200 300 400 500 600 Tooltip
...
AMD Radeon RX 5600 XT (Desktop)
AMD Radeon RX 5700 (Desktop)
NVIDIA GeForce RTX 2060 Super (Desktop)
AMD Radeon RX 5700 XT (Desktop)
AMD Radeon RX 6650 XT
...
...
AMD Radeon RX 5600 XT (Desktop)
AMD Radeon RX 5700 (Desktop)
AMD Radeon RX 5700 XT (Desktop)
NVIDIA GeForce RTX 2060 Super (Desktop)
AMD Radeon RX 6650 XT
AMD Radeon RX 6700 XT
...
» With all tested laptops playable in detail settings ultra.
Additional Benchmarks
Ultra Low Preset 1280x720
128.1 [X] Nvidia Titan X (Pascal) AMD Ryzen 9 7950X 4.5GHz
Titan X Pascal
min:
8.62 fps, P0.1:
69.1 fps, P1:
90 fps, max:
185.5 fps
Intel UHD Graphics Xe 16EUs (Tiger Lake-H)
...
AMD Radeon RX 5700 (Desktop)
NVIDIA GeForce RTX 2060 Super (Desktop)
AMD Radeon RX 5700 XT (Desktop)
...
...
AMD Radeon RX 5600 XT (Desktop)
AMD Radeon RX 5700 (Desktop)
NVIDIA GeForce RTX 2060 Super (Desktop)
AMD Radeon RX 5700 XT (Desktop)
...
...
AMD Radeon RX 5600 XT (Desktop)
AMD Radeon RX 5700 (Desktop)
NVIDIA GeForce RTX 2060 Super (Desktop)
AMD Radeon RX 5700 XT (Desktop)
AMD Radeon RX 6650 XT
...
...
AMD Radeon RX 5700 (Desktop)
NVIDIA GeForce RTX 2060 Super (Desktop)
AMD Radeon RX 5700 XT (Desktop)
AMD Radeon RX 6650 XT
...
NVIDIA GeForce GTX 1650 Super (Desktop)
...
AMD Radeon RX 5600 XT (Desktop)
AMD Radeon RX 5700 (Desktop)
NVIDIA GeForce RTX 2060 Super (Desktop)
AMD Radeon RX 5700 XT (Desktop)
AMD Radeon RX 6650 XT
...
NVIDIA GeForce GTX 1650 Super (Desktop)
...
AMD Radeon RX 5600 XT (Desktop)
AMD Radeon RX 5700 (Desktop)
NVIDIA GeForce RTX 2060 Super (Desktop)
AMD Radeon RX 5700 XT (Desktop)
AMD Radeon RX 6650 XT
...
» With all tested laptops playable in detail settings ultra.
Additional Benchmarks
Low Preset 1280x720
247 [X] Nvidia Titan X (Pascal) AMD Ryzen 9 7950X 4.5GHz
Titan X Pascal
min:
68 fps, P0.1:
180.5 fps, P1:
210 fps, max:
344 fps
...
NVIDIA GeForce GTX 1660 (Desktop)
AMD Radeon RX 5700 (Desktop)
NVIDIA GeForce GTX 1660 Super (Desktop)
AMD Radeon RX 5700 XT (Desktop)
NVIDIA GeForce RTX 2060 Super (Desktop)
...
...
NVIDIA GeForce GTX 1660 (Desktop)
AMD Radeon RX 5700 (Desktop)
NVIDIA GeForce GTX 1660 Super (Desktop)
AMD Radeon RX 5700 XT (Desktop)
NVIDIA GeForce RTX 2060 Super (Desktop)
...
...
AMD Radeon RX 5600 XT (Desktop)
AMD Radeon RX 5700 (Desktop)
NVIDIA GeForce GTX 1660 Super (Desktop)
AMD Radeon RX 5700 XT (Desktop)
NVIDIA GeForce RTX 2060 Super (Desktop)
...
...
AMD Radeon RX 5600 XT (Desktop)
NVIDIA GeForce GTX 1660 Super (Desktop)
AMD Radeon RX 5700 (Desktop)
AMD Radeon RX 5700 XT (Desktop)
NVIDIA GeForce RTX 2060 Super (Desktop)
...
...
AMD Radeon RX 5700 (Desktop)
AMD Radeon RX 5700 XT (Desktop)
NVIDIA GeForce RTX 2060 Super (Desktop)
AMD Radeon RX 6650 XT
...
NVIDIA GeForce GTX 1650 Super (Desktop)
...
AMD Radeon RX 5700 (Desktop)
AMD Radeon RX 5700 XT (Desktop)
NVIDIA GeForce RTX 2060 Super (Desktop)
AMD Radeon RX 6650 XT
...
» With all tested laptops playable in detail settings ultra.
Additional Benchmarks
Low Preset 1280x720
102 [X] Nvidia Titan X (Pascal) AMD Ryzen 9 7950X 4.5GHz
Titan X Pascal
0 100 Tooltip : Ø120.6 (108.197-134.15)
Intel UHD Graphics G1 (Ice Lake 32 EU)
...
AMD Radeon RX 5600 XT (Desktop)
AMD Radeon RX 5700 (Desktop)
AMD Radeon RX 5700 XT (Desktop)
NVIDIA GeForce RTX 2060 Super (Desktop)
AMD Radeon RX 6650 XT
NVIDIA GeForce RTX 3060 Ti
...
...
AMD Radeon RX 5600 XT (Desktop)
AMD Radeon RX 5700 (Desktop)
NVIDIA GeForce RTX 2060 Super (Desktop)
AMD Radeon RX 5700 XT (Desktop)
...
...
AMD Radeon RX 5600 XT (Desktop)
AMD Radeon RX 5700 (Desktop)
NVIDIA GeForce RTX 2060 Super (Desktop)
AMD Radeon RX 5700 XT (Desktop)
...
...
AMD Radeon RX 5600 XT (Desktop)
AMD Radeon RX 5700 (Desktop)
NVIDIA GeForce RTX 2060 Super (Desktop)
AMD Radeon RX 5700 XT (Desktop)
...
...
AMD Radeon RX 5600 XT (Desktop)
AMD Radeon RX 5700 (Desktop)
NVIDIA GeForce GTX 1660 Super (Desktop)
NVIDIA GeForce RTX 2060 Super (Desktop)
AMD Radeon RX 5700 XT (Desktop)
AMD Radeon RX 6650 XT
...
...
NVIDIA GeForce GTX 1660 (Desktop)
NVIDIA GeForce GTX 1660 Super (Desktop)
AMD Radeon RX 5600 XT (Desktop)
AMD Radeon RX 5700 (Desktop)
NVIDIA GeForce RTX 2060 Super (Desktop)
AMD Radeon RX 5700 XT (Desktop)
AMD Radeon RX 6650 XT
...
» With all tested laptops playable in detail settings ultra.
Additional Benchmarks
Low Preset Low TAA 1280x720
157.1 [X] Nvidia Titan X (Pascal) AMD Ryzen 9 7950X 4.5GHz
Titan X Pascal
min:
51.6 fps, P0.1:
93.1 fps, P1:
113 fps, max:
197.4 fps
Intel UHD Graphics Xe 16EUs (Tiger Lake-H)
...
NVIDIA GeForce GTX 1660 Super (Desktop)
AMD Radeon RX 5600 XT (Desktop)
AMD Radeon RX 5700 (Desktop)
NVIDIA GeForce RTX 2060 Super (Desktop)
AMD Radeon RX 5700 XT (Desktop)
...
...
AMD Radeon RX 5600 XT (Desktop)
AMD Radeon RX 5700 (Desktop)
NVIDIA GeForce RTX 2060 Super (Desktop)
AMD Radeon RX 5700 XT (Desktop)
...
AMD Radeon RX 560X (Laptop)
...
Intel Arc A380
NVIDIA GeForce GTX 1650 Super (Desktop)
NVIDIA GeForce GTX 1660 (Desktop)
NVIDIA GeForce GTX 1660 Super (Desktop)
...
59.3 [X] Nvidia Titan X (Pascal) AMD Ryzen 9 7950X 4.5GHz
Titan X Pascal
min:
31.9 fps, P0.1:
36.2 fps, P1:
44.1 fps, max:
147.9 fps
59.4 [X] Nvidia Titan X (Pascal) AMD Ryzen 9 7950X 4.5GHz
Titan X Pascal
min:
27.1 fps, P0.1:
30.8 fps, P1:
43.9 fps, max:
178.2 fps
~ 59 fps
+ Compare
- Hide Comparison
+ 📈 Graph
- 📈 Hide Graph
0 100 Tooltip : Ø61.6 (48.372-95.6)
: Ø71.1 (49.3-148.3)
...
AMD Radeon RX 5600 XT (Desktop)
AMD Radeon RX 5700 (Desktop)
NVIDIA GeForce RTX 2060 Super (Desktop)
AMD Radeon RX 5700 XT (Desktop)
AMD Radeon RX 6650 XT
...
...
AMD Radeon RX 6650 XT
AMD Radeon RX 5700 (Desktop)
NVIDIA GeForce RTX 2060 Super (Desktop)
AMD Radeon RX 5700 XT (Desktop)
...
» With all tested laptops playable in detail settings ultra.
Additional Benchmarks
Low Preset TAA 1280x720
113.2 [X] Nvidia Titan X (Pascal) AMD Ryzen 9 7950X 4.5GHz
Titan X Pascal
min:
36.5 fps, P0.1:
41.6 fps, P1:
71.3 fps, max:
484 fps
...
AMD Radeon RX 6650 XT
AMD Radeon RX 5700 XT (Desktop)
NVIDIA GeForce RTX 2060 Super (Desktop)
AMD Radeon RX 6700 XT
AMD Radeon RX 6750 XT
NVIDIA GeForce RTX 3060 Ti
...
0 100 200 300 400 500 600 700 800 900 1000 1100 1200 1300 1400 1500 1600 1700 1800 1900 Tooltip
Intel UHD Graphics 32EUs (Alder Lake)
...
AMD Radeon RX 6650 XT
AMD Radeon RX 5700 XT (Desktop)
NVIDIA GeForce RTX 2060 Super (Desktop)
AMD Radeon RX 6700 XT
AMD Radeon RX 6750 XT
NVIDIA GeForce RTX 3060 Ti
...
AMD Radeon RX Vega 6 (Ryzen 4000/5000)
...
NVIDIA GeForce RTX 2060 Super (Desktop)
AMD Radeon RX 5700 XT (Desktop)
AMD Radeon RX 6650 XT
AMD Radeon RX 6700 XT
AMD Radeon RX 6750 XT
NVIDIA GeForce RTX 3060 Ti
...
...
AMD Radeon RX 5700 (Desktop)
NVIDIA GeForce RTX 2060 Super (Desktop)
AMD Radeon RX 6650 XT
AMD Radeon RX 5700 XT (Desktop)
AMD Radeon RX 6700 XT
...
...
AMD Radeon RX 6650 XT
NVIDIA GeForce RTX 2060 Super (Desktop)
AMD Radeon RX 5700 XT (Desktop)
AMD Radeon RX 6700 XT
NVIDIA GeForce RTX 3060 Ti
...
...
NVIDIA GeForce RTX 2060 Super (Desktop)
AMD Radeon RX 5700 XT (Desktop)
AMD Radeon RX 6700 XT
AMD Radeon RX 6750 XT
...
» With all tested laptops playable in detail settings ultra.
Additional Benchmarks
Low Preset / Off 1280x720
286 [X] Nvidia Titan X (Pascal) AMD Ryzen 9 7950X 4.5GHz
Titan X Pascal
min:
19.4 fps, P0.1:
75.1 fps, P1:
209 fps, max:
425 fps
Intel UHD Graphics Xe 16EUs (Tiger Lake-H)
...
AMD Radeon RX 5600 XT (Desktop)
NVIDIA GeForce RTX 2060 Super (Desktop)
AMD Radeon RX 5700 (Desktop)
AMD Radeon RX 5700 XT (Desktop)
...
...
NVIDIA GeForce RTX 2060 Super (Desktop)
AMD Radeon RX 5700 (Desktop)
AMD Radeon RX 5700 XT (Desktop)
...
...
AMD Radeon RX 5600 XT (Desktop)
NVIDIA GeForce RTX 2060 Super (Desktop)
AMD Radeon RX 5700 (Desktop)
AMD Radeon RX 5700 XT (Desktop)
...
...
AMD Radeon RX 5600 XT (Desktop)
NVIDIA GeForce RTX 2060 Super (Desktop)
AMD Radeon RX 5700 (Desktop)
AMD Radeon RX 5700 XT (Desktop)
...
...
AMD Radeon RX 5600 XT (Desktop)
NVIDIA GeForce RTX 2060 Super (Desktop)
AMD Radeon RX 5700 (Desktop)
AMD Radeon RX 5700 XT (Desktop)
AMD Radeon RX 6650 XT
...
...
AMD Radeon RX 5700 (Desktop)
AMD Radeon RX 5600 XT (Desktop)
AMD Radeon RX 6650 XT
AMD Radeon RX 5700 XT (Desktop)
...
» With all tested laptops playable in detail settings ultra.
Additional Benchmarks
Low Preset 1280x720
323 [X] Nvidia Titan X (Pascal) AMD Ryzen 9 7950X 4.5GHz
Titan X Pascal
min:
32.5 fps, P0.1:
166.2 fps, P1:
226 fps, max:
465 fps
...
NVIDIA GeForce GTX 1660 Super (Desktop)
AMD Radeon RX 5600 XT (Desktop)
AMD Radeon RX 5700 (Desktop)
NVIDIA GeForce RTX 2060 Super (Desktop)
AMD Radeon RX 5700 XT (Desktop)
...
...
AMD Radeon RX 5600 XT (Desktop)
AMD Radeon RX 5700 (Desktop)
NVIDIA GeForce RTX 2060 Super (Desktop)
AMD Radeon RX 5700 XT (Desktop)
...
...
AMD Radeon RX 5600 XT (Desktop)
NVIDIA GeForce RTX 2060 Super (Desktop)
AMD Radeon RX 5700 (Desktop)
AMD Radeon RX 5700 XT (Desktop)
AMD Radeon RX 6650 XT
...
...
AMD Radeon RX 5600 XT (Desktop)
NVIDIA GeForce RTX 2060 Super (Desktop)
AMD Radeon RX 5700 (Desktop)
AMD Radeon RX 5700 XT (Desktop)
AMD Radeon RX 6650 XT
...
...
AMD Radeon RX 5600 XT (Desktop)
AMD Radeon RX 5700 (Desktop)
NVIDIA GeForce RTX 2060 Super (Desktop)
AMD Radeon RX 5700 XT (Desktop)
AMD Radeon RX 6650 XT
AMD Radeon RX 6700 XT
...
...
AMD Radeon RX 5600 XT (Desktop)
AMD Radeon RX 5700 (Desktop)
NVIDIA GeForce RTX 2060 Super (Desktop)
AMD Radeon RX 5700 XT (Desktop)
AMD Radeon RX 6650 XT
AMD Radeon RX 6700 XT
...
» With all tested laptops playable in detail settings ultra.
Additional Benchmarks
Low Preset (without FSR Upscaling) 1280x720
178.5 [X] Nvidia Titan X (Pascal) AMD Ryzen 9 7950X 4.5GHz
Titan X Pascal
Ultra Preset (without FSR Upscaling) + Full Ray-Tracing 1920x1080
8.7 [X] Nvidia Titan X (Pascal) AMD Ryzen 9 7950X 4.5GHz
Titan X Pascal
...
AMD Radeon RX 5600 XT (Desktop)
AMD Radeon RX 5700 (Desktop)
AMD Radeon RX 5700 XT (Desktop)
NVIDIA GeForce RTX 2060 Super (Desktop)
AMD Radeon RX 6650 XT
AMD Radeon RX 6700 XT
...
...
AMD Radeon RX 5600 XT (Desktop)
AMD Radeon RX 5700 (Desktop)
NVIDIA GeForce RTX 2060 Super (Desktop)
AMD Radeon RX 5700 XT (Desktop)
AMD Radeon RX 6650 XT
AMD Radeon RX 6700 XT
...
...
AMD Radeon RX 5600 XT (Desktop)
AMD Radeon RX 5700 (Desktop)
NVIDIA GeForce RTX 2060 Super (Desktop)
AMD Radeon RX 5700 XT (Desktop)
AMD Radeon RX 6650 XT
...
...
AMD Radeon RX 5600 XT (Desktop)
AMD Radeon RX 5700 (Desktop)
AMD Radeon RX 5700 XT (Desktop)
AMD Radeon RX 6650 XT
NVIDIA GeForce RTX 2060 Super (Desktop)
...
...
AMD Radeon RX 5600 XT (Desktop)
AMD Radeon RX 5700 (Desktop)
NVIDIA GeForce RTX 2060 Super (Desktop)
AMD Radeon RX 5700 XT (Desktop)
AMD Radeon RX 6650 XT
AMD Radeon RX 6700 XT
...
NVIDIA GeForce GTX 1650 Super (Desktop)
...
AMD Radeon RX 5600 XT (Desktop)
NVIDIA GeForce RTX 2060 Super (Desktop)
AMD Radeon RX 5700 (Desktop)
AMD Radeon RX 6650 XT
AMD Radeon RX 5700 XT (Desktop)
AMD Radeon RX 6700 XT
...
» With all tested laptops playable in detail settings ultra.
Additional Benchmarks
Low Preset 1280x720
167.3 [X] Nvidia Titan X (Pascal) AMD Ryzen 9 7950X 4.5GHz
Titan X Pascal
min:
52.7 fps, P0.1:
90.1 fps, P1:
113.7 fps, max:
245 fps
Intel UHD Graphics Xe 16EUs (Tiger Lake-H)
...
NVIDIA GeForce GTX 1660 (Desktop)
NVIDIA GeForce GTX 1660 Super (Desktop)
AMD Radeon RX 5600 XT (Desktop)
AMD Radeon RX 5700 (Desktop)
NVIDIA GeForce RTX 3060 Ti
...
...
NVIDIA GeForce GTX 1650 Super (Desktop)
NVIDIA GeForce GTX 1660 (Desktop)
NVIDIA GeForce GTX 1660 Super (Desktop)
AMD Radeon RX 5600 XT (Desktop)
AMD Radeon RX 5700 (Desktop)
...
...
AMD Radeon RX 5600 XT (Desktop)
NVIDIA GeForce GTX 1660 Super (Desktop)
AMD Radeon RX 5700 (Desktop)
AMD Radeon RX 6650 XT
NVIDIA GeForce RTX 2060 Super (Desktop)
...
...
NVIDIA GeForce GTX 1660 Super (Desktop)
AMD Radeon RX 5700 (Desktop)
AMD Radeon RX 6650 XT
AMD Radeon RX 5700 XT (Desktop)
NVIDIA GeForce RTX 3060 Ti
...
...
AMD Radeon RX 5600 XT (Desktop)
AMD Radeon RX 5700 (Desktop)
NVIDIA GeForce RTX 3060 Ti
NVIDIA GeForce RTX 2060 Super (Desktop)
AMD Radeon RX 5700 XT (Desktop)
AMD Radeon RX 6650 XT
...
...
AMD Radeon RX 6650 XT
AMD Radeon RX 5600 XT (Desktop)
AMD Radeon RX 5700 (Desktop)
NVIDIA GeForce RTX 3060 Ti
NVIDIA GeForce RTX 2060 Super (Desktop)
AMD Radeon RX 5700 XT (Desktop)
...
» With all tested laptops playable in detail settings ultra.
Additional Benchmarks
Very Low Preset 1280x720
136.5 [X] Nvidia Titan X (Pascal) AMD Ryzen 9 7950X 4.5GHz
Titan X Pascal
min:
87.2 fps, P0.1:
93.9 fps, P1:
101.1 fps, max:
263 fps
...
NVIDIA GeForce GTX 1660 Super (Desktop)
NVIDIA GeForce RTX 2060 Super (Desktop)
AMD Radeon RX 5600 XT (Desktop)
AMD Radeon RX 5700 (Desktop)
AMD Radeon RX 5700 XT (Desktop)
NVIDIA GeForce RTX 3070 Ti
NVIDIA GeForce RTX 3060 Ti
NVIDIA Titan RTX
...
...
NVIDIA GeForce GTX 1660 (Desktop)
NVIDIA GeForce GTX 1660 Super (Desktop)
NVIDIA GeForce RTX 2060 Super (Desktop)
AMD Radeon RX 5600 XT (Desktop)
AMD Radeon RX 5700 (Desktop)
NVIDIA Titan RTX
AMD Radeon RX 5700 XT (Desktop)
...
...
NVIDIA GeForce GTX 1660 Super (Desktop)
NVIDIA GeForce RTX 2060 Super (Desktop)
AMD Radeon RX 5600 XT (Desktop)
AMD Radeon RX 5700 (Desktop)
...
...
NVIDIA GeForce GTX 1080 (Desktop)
NVIDIA GeForce RTX 2060 Super (Desktop)
AMD Radeon RX 5600 XT (Desktop)
AMD Radeon RX 5700 (Desktop)
AMD Radeon RX 5700 XT (Desktop)
...
...
NVIDIA GeForce GTX 1080 (Desktop)
NVIDIA GeForce GTX 1660 Super (Desktop)
NVIDIA GeForce RTX 2060 Super (Desktop)
AMD Radeon RX 5600 XT (Desktop)
AMD Radeon RX 5700 (Desktop)
AMD Radeon RX 5700 XT (Desktop)
...
...
NVIDIA GeForce GTX 1660 (Desktop)
NVIDIA GeForce GTX 1660 Super (Desktop)
NVIDIA GeForce GTX 1080 (Desktop)
NVIDIA GeForce RTX 2060 Super (Desktop)
AMD Radeon RX 5700 (Desktop)
AMD Radeon RX 5700 XT (Desktop)
NVIDIA GeForce RTX 3060 Ti
...
» With all tested laptops playable in detail settings ultra.
Additional Benchmarks
Basic Quality Preset T2X SMAA 1280x720
166 [X] Nvidia Titan X (Pascal) AMD Ryzen 9 7950X 4.5GHz
Titan X Pascal
...
NVIDIA GeForce GTX 1650 Super (Desktop)
NVIDIA GeForce GTX 1660 (Desktop)
NVIDIA GeForce GTX 1660 Super (Desktop)
AMD Radeon RX 5600 XT (Desktop)
...
AMD Radeon RX Vega 8 (Ryzen 2000/3000)
...
NVIDIA GeForce GTX 1650 Super (Desktop)
NVIDIA GeForce GTX 1660 (Desktop)
NVIDIA GeForce GTX 1660 Super (Desktop)
AMD Radeon RX 5600 XT (Desktop)
NVIDIA GeForce RTX 2060 Super (Desktop)
AMD Radeon RX 5700 (Desktop)
...
...
NVIDIA GeForce GTX 1660 (Desktop)
NVIDIA GeForce GTX 1660 Super (Desktop)
AMD Radeon RX 5600 XT (Desktop)
NVIDIA GeForce RTX 2060 Super (Desktop)
...
...
NVIDIA GeForce GTX 1660 (Desktop)
NVIDIA GeForce GTX 1660 Super (Desktop)
AMD Radeon RX 5600 XT (Desktop)
NVIDIA GeForce RTX 2060 Super (Desktop)
AMD Radeon RX 5700 (Desktop)
...
...
AMD Radeon RX 5600 XT (Desktop)
AMD Radeon RX 5700 (Desktop)
NVIDIA GeForce RTX 2060 Super (Desktop)
AMD Radeon RX 5700 XT (Desktop)
...
...
AMD Radeon RX 5600 XT (Desktop)
NVIDIA GeForce RTX 2060 Super (Desktop)
AMD Radeon RX 5700 (Desktop)
AMD Radeon RX 6650 XT
AMD Radeon RX 5700 XT (Desktop)
NVIDIA GeForce RTX 3060 Ti
NVIDIA GeForce RTX 3070 Ti
...
» With all tested laptops playable in detail settings ultra.
Additional Benchmarks
Low Preset 1280x720
68.9 [X] Nvidia Titan X (Pascal) AMD Ryzen 9 7950X 4.5GHz
Titan X Pascal
min:
59 fps, P0.1:
59.3 fps, P1:
61.2 fps, max:
79 fps
Intel UHD Graphics Xe 16EUs (Tiger Lake-H)
...
AMD Radeon RX 5600 XT (Desktop)
AMD Radeon RX 5700 (Desktop)
NVIDIA GeForce RTX 2060 Super (Desktop)
AMD Radeon RX 5700 XT (Desktop)
AMD Radeon RX 6650 XT
...
...
AMD Radeon RX 5700 (Desktop)
NVIDIA GeForce RTX 2060 Super (Desktop)
AMD Radeon RX 5700 XT (Desktop)
AMD Radeon RX 6650 XT
...
...
AMD Radeon RX 5700 (Desktop)
NVIDIA GeForce RTX 2060 Super (Desktop)
AMD Radeon RX 5700 XT (Desktop)
AMD Radeon RX 6650 XT
...
...
AMD Radeon RX 5700 (Desktop)
NVIDIA GeForce RTX 2060 Super (Desktop)
AMD Radeon RX 5700 XT (Desktop)
AMD Radeon RX 6650 XT
...
...
AMD Radeon RX 5600 XT (Desktop)
NVIDIA GeForce RTX 2060 Super (Desktop)
AMD Radeon RX 5700 (Desktop)
AMD Radeon RX 5700 XT (Desktop)
AMD Radeon RX 6650 XT
...
...
NVIDIA GeForce RTX 2060 Super (Desktop)
AMD Radeon RX 5700 (Desktop)
AMD Radeon RX 6650 XT
AMD Radeon RX 5700 XT (Desktop)
AMD Radeon RX 6700 XT
...
» With all tested laptops playable in detail settings ultra.
Additional Benchmarks
Low Preset 1280x720
126.8 [X] Nvidia Titan X (Pascal) AMD Ryzen 9 7950X 4.5GHz
Titan X Pascal
min:
67.8 fps, P0.1:
78.2 fps, P1:
95.5 fps, max:
200 fps
0 100 200 300 400 500 600 700 800 900 1000 1100 1200 1300 1400 1500 1600 1700 1800 1900 2000 2100 2200 2300 2400 2500 2600 2700 2800 2900 3000 3100 3200 3300 3400 3500 3600 3700 3800 3900 4000 4100 4200 4300 4400 4500 4600 4700 4800 4900 5000 5100 5200 5300 5400 5500 5600 5700 5800 5900 6000 6100 6200 6300 6400 6500 6600 6700 6800 6900 7000 7100 7200 7300 7400 7500 7600 7700 7800 7900 8000 8100 8200 8300 8400 8500 8600 8700 8800 8900 9000 9100 9200 9300 9400 9500 9600 9700 9800 9900 Tooltip
...
NVIDIA GeForce GTX 1650 Super (Desktop)
NVIDIA GeForce GTX 1660 (Desktop)
NVIDIA GeForce GTX 1660 Super (Desktop)
NVIDIA Titan RTX
AMD Radeon RX 5600 XT (Desktop)
NVIDIA GeForce RTX 2060 Super (Desktop)
AMD Radeon RX 5700 (Desktop)
AMD Radeon RX 6700 XT
AMD Radeon RX 5700 XT (Desktop)
...
...
NVIDIA GeForce GTX 1660 (Desktop)
NVIDIA GeForce GTX 1660 Super (Desktop)
NVIDIA Titan RTX
AMD Radeon RX 5600 XT (Desktop)
NVIDIA GeForce RTX 2060 Super (Desktop)
AMD Radeon RX 5700 (Desktop)
AMD Radeon RX 6700 XT
AMD Radeon RX 6650 XT
NVIDIA GeForce RTX 3070 Ti
...
0 100 200 300 400 500 600 700 800 900 1000 1100 1200 1300 1400 1500 1600 1700 1800 1900 Tooltip
...
NVIDIA GeForce GTX 1660 (Desktop)
NVIDIA GeForce GTX 1660 Super (Desktop)
AMD Radeon RX 5600 XT (Desktop)
AMD Radeon RX 5700 (Desktop)
NVIDIA GeForce RTX 2060 Super (Desktop)
AMD Radeon RX 6650 XT
AMD Radeon RX 6700 XT
AMD Radeon RX 5700 XT (Desktop)
...
...
NVIDIA GeForce GTX 1650 Super (Desktop)
NVIDIA GeForce GTX 1660 (Desktop)
NVIDIA GeForce GTX 1660 Super (Desktop)
AMD Radeon RX 5600 XT (Desktop)
AMD Radeon RX 5700 (Desktop)
NVIDIA GeForce RTX 2060 Super (Desktop)
AMD Radeon RX 6650 XT
AMD Radeon RX 6700 XT
AMD Radeon RX 5700 XT (Desktop)
...
...
NVIDIA GeForce GTX 1660 Super (Desktop)
NVIDIA GeForce RTX 2060 Super (Desktop)
AMD Radeon RX 5600 XT (Desktop)
AMD Radeon RX 5700 (Desktop)
AMD Radeon RX 6650 XT
AMD Radeon RX 5700 XT (Desktop)
AMD Radeon RX 6700 XT
...
NVIDIA GeForce GTX 1650 Super (Desktop)
...
NVIDIA GeForce GTX 1660 (Desktop)
NVIDIA GeForce GTX 1660 Super (Desktop)
NVIDIA GeForce RTX 2060 Super (Desktop)
AMD Radeon RX 5600 XT (Desktop)
AMD Radeon RX 5700 (Desktop)
AMD Radeon RX 6650 XT
AMD Radeon RX 6700 XT
AMD Radeon RX 5700 XT (Desktop)
...
» With all tested laptops playable in detail settings ultra.
Additional Benchmarks
Low Rendering Quality 1280x720
320 [X] Nvidia Titan X (Pascal) AMD Ryzen 9 7950X 4.5GHz
Titan X Pascal
min:
132.1 fps, P0.1:
209 fps, P1:
233 fps, max:
436 fps
144.5 [X] Nvidia Titan X (Pascal) AMD Ryzen 9 7950X 4.5GHz
Titan X Pascal
min:
31.8 fps, P0.1:
69.7 fps, P1:
121.5 fps, max:
330 fps
149 [X] Nvidia Titan X (Pascal) AMD Ryzen 9 7900X 4.7GHz
Titan X Pascal
min:
4.78 fps, P0.1:
40.5 fps, P1:
126 fps, max:
272 fps
~ 147 fps
+ Compare
- Hide Comparison
+ 📈 Graph
- 📈 Hide Graph
0 100 200 300 400 Tooltip : Ø155.2 (126.292-423)
: Ø153.2 (103.527-206.7)
Intel UHD Graphics Xe 16EUs (Tiger Lake-H)
...
AMD Radeon RX 5700 (Desktop)
AMD Radeon RX 5700 XT (Desktop)
NVIDIA GeForce RTX 2060 Super (Desktop)
AMD Radeon RX 6650 XT
AMD Radeon RX 6700 XT
NVIDIA GeForce RTX 3060 Ti
...
0 100 200 300 400 500 600 700 Tooltip : Ø114.3 (96-169.1)
: Ø128.8 (93.338-713)
Intel UHD Graphics Xe G4 48EUs
...
AMD Radeon RX 5700 (Desktop)
NVIDIA GeForce RTX 2060 Super (Desktop)
AMD Radeon RX 5700 XT (Desktop)
AMD Radeon RX 6650 XT
AMD Radeon RX 6700 XT
NVIDIA GeForce RTX 3060 Ti
...
88 [X] Nvidia Titan X (Pascal) AMD Ryzen 9 7950X 4.5GHz
Titan X Pascal
min:
37.6 fps, P0.1:
48.6 fps, P1:
71.9 fps, max:
246 fps
90.7 [X] Nvidia Titan X (Pascal) AMD Ryzen 9 7900X 4.7GHz
Titan X Pascal
min:
21.3 fps, P0.1:
45.6 fps, P1:
73 fps, max:
214 fps
~ 89 fps
+ Compare
- Hide Comparison
+ 📈 Graph
- 📈 Hide Graph
0 100 Tooltip : Ø90.8 (73.194-126.8)
: Ø93.3 (76.28-111.5)
...
AMD Radeon RX 5700 (Desktop)
NVIDIA GeForce RTX 2060 Super (Desktop)
AMD Radeon RX 5700 XT (Desktop)
AMD Radeon RX 6650 XT
AMD Radeon RX 6700 XT
NVIDIA GeForce RTX 3060 Ti
...
68.6 [X] Nvidia Titan X (Pascal) AMD Ryzen 9 7950X 4.5GHz
Titan X Pascal
min:
30.6 fps, P0.1:
33.3 fps, P1:
57.9 fps, max:
209 fps
69.9 [X] Nvidia Titan X (Pascal) AMD Ryzen 9 7900X 4.7GHz
Titan X Pascal
min:
31.4 fps, P0.1:
34.4 fps, P1:
57.6 fps, max:
236 fps
~ 69 fps
+ Compare
- Hide Comparison
+ 📈 Graph
- 📈 Hide Graph
0 100 200 300 400 500 600 700 800 900 1000 1100 1200 1300 1400 1500 1600 1700 Tooltip : Ø73.8 (60.266-150.1)
: Ø107.9 (62.583-1715)
...
AMD Radeon RX 5700 (Desktop)
AMD Radeon RX 5700 XT (Desktop)
NVIDIA GeForce RTX 2060 Super (Desktop)
AMD Radeon RX 6650 XT
AMD Radeon RX 6700 XT
...
47.3 [X] Nvidia Titan X (Pascal) AMD Ryzen 9 7950X 4.5GHz
Titan X Pascal
min:
18.4 fps, P0.1:
20.3 fps, P1:
41.4 fps, max:
150.1 fps
47.8 [X] Nvidia Titan X (Pascal) AMD Ryzen 9 7900X 4.7GHz
Titan X Pascal
min:
18.7 fps, P0.1:
20.6 fps, P1:
39.8 fps, max:
210 fps
~ 48 fps
+ Compare
- Hide Comparison
+ 📈 Graph
- 📈 Hide Graph
0 Tooltip : Ø50.6 (43.252-88.9)
: Ø51.3 (44.007-100)
...
AMD Radeon RX 5700 XT (Desktop)
NVIDIA GeForce RTX 2060 Super (Desktop)
AMD Radeon RX 6650 XT
AMD Radeon RX 6700 XT
AMD Radeon RX 6750 XT
NVIDIA GeForce RTX 3060 Ti
...
25.1 [X] Nvidia Titan X (Pascal) AMD Ryzen 9 7950X 4.5GHz
Titan X Pascal
min:
9.24 fps, P0.1:
9.41 fps, P1:
18.3 fps, max:
56.4 fps
25.3 [X] Nvidia Titan X (Pascal) AMD Ryzen 9 7900X 4.7GHz
Titan X Pascal
min:
9.05 fps, P0.1:
9.21 fps, P1:
18 fps, max:
47.4 fps
~ 25 fps
+ Compare
- Hide Comparison
+ 📈 Graph
- 📈 Hide Graph
0 Tooltip : Ø27.7 (22.251-50.6)
: Ø27.7 (22.005-88.2)
...
AMD Radeon RX 5700 XT (Desktop)
NVIDIA GeForce RTX 3060 Ti
AMD Radeon RX 6700 XT
AMD Radeon RX 6750 XT
NVIDIA Titan RTX
...
» With all tested laptops playable in detail settings ultra.
Additional Benchmarks
Low Preset 1280x720
198.9 [X] Nvidia Titan X (Pascal) AMD Ryzen 9 7950X 4.5GHz
Titan X Pascal
min:
26.2 fps, P0.1:
64.2 fps, P1:
161.2 fps, max:
318 fps
283 [X] Nvidia Titan X (Pascal) 918016
AMD Ryzen 9 7900X 4.7GHz
Titan X Pascal
min:
235 fps, P1:
193 fps, max:
326 fps
285 [X] Nvidia Titan X (Pascal) 923650
AMD Ryzen 9 7950X 4.5GHz
Titan X Pascal
min:
230 fps, P1:
197 fps, max:
326 fps
~ 284 fps
+ Compare
- Hide Comparison
Intel UHD Graphics Xe 16EUs (Tiger Lake-H)
...
NVIDIA GeForce RTX 2060 Super (Desktop)
AMD Radeon RX 5700 XT (Desktop)
AMD Radeon RX 6650 XT
...
250 [X] Nvidia Titan X (Pascal) 918016
AMD Ryzen 9 7900X 4.7GHz
Titan X Pascal
min:
210 fps, P1:
180 fps, max:
284 fps
254 [X] Nvidia Titan X (Pascal) 923650
AMD Ryzen 9 7950X 4.5GHz
Titan X Pascal
min:
220 fps, P1:
184 fps, max:
289 fps
~ 252 fps
+ Compare
- Hide Comparison
Intel UHD Graphics Xe 16EUs (Tiger Lake-H)
...
AMD Radeon RX 5700 XT (Desktop)
AMD Radeon RX 6650 XT
...
184.6 [X] Nvidia Titan X (Pascal) 918016
AMD Ryzen 9 7900X 4.7GHz
Titan X Pascal
min:
160 fps, P1:
141 fps, max:
202 fps
188 [X] Nvidia Titan X (Pascal) 923650
AMD Ryzen 9 7950X 4.5GHz
Titan X Pascal
min:
167 fps, P1:
144 fps, max:
209 fps
~ 186 fps
+ Compare
- Hide Comparison
Intel UHD Graphics Xe 16EUs (Tiger Lake-H)
...
AMD Radeon RX 5700 XT (Desktop)
...
...
AMD Radeon RX 5700 XT (Desktop)
...
100.2 [X] Nvidia Titan X (Pascal) 918016
AMD Ryzen 9 7900X 4.7GHz
Titan X Pascal
min:
87 fps, P1:
83 fps, max:
113 fps
101.5 [X] Nvidia Titan X (Pascal) 923650
AMD Ryzen 9 7950X 4.5GHz
Titan X Pascal
min:
88 fps, P1:
85 fps, max:
115 fps
~ 101 fps
+ Compare
- Hide Comparison
...
AMD Radeon RX 5700 (Desktop)
AMD Radeon RX 5700 XT (Desktop)
59.5 [X] Nvidia Titan X (Pascal) 918016
AMD Ryzen 9 7900X 4.7GHz
Titan X Pascal
min:
52 fps, P1:
51 fps, max:
67 fps
59.5 [X] Nvidia Titan X (Pascal) 923650
AMD Ryzen 9 7950X 4.5GHz
Titan X Pascal
min:
51 fps, P1:
52 fps, max:
66 fps
~ 60 fps
+ Compare
- Hide Comparison
...
AMD Radeon RX 5600 XT (Desktop)
AMD Radeon RX 5700 (Desktop)
AMD Radeon RX 5700 XT (Desktop)
» With all tested laptops playable in detail settings ultra.
Additional Benchmarks
Ultra Low Preset 16xAF TAA 1280x720
425 [X] Nvidia Titan X (Pascal) AMD Ryzen 9 7900X 4.7GHz
Titan X Pascal
min:
328 fps, P1:
274 fps, max:
504 fps
444 [X] Nvidia Titan X (Pascal) AMD Ryzen 9 7950X 4.5GHz
Titan X Pascal
min:
351 fps, P1:
286 fps, max:
515 fps
337 [X] Nvidia Titan X (Pascal) AMD Ryzen 9 5900X 3.7GHz
Titan X Pascal
min:
158.1 fps, P0.1:
199.5 fps, P1:
239 fps, max:
541 fps
391 [X] Nvidia Titan X (Pascal) AMD Ryzen 9 5900X 3.7GHz
Titan X Pascal
min:
122.4 fps, P0.1:
221 fps, P1:
278 fps, max:
564 fps
~ 364 fps
+ Compare
- Hide Comparison
+ 📈 Graph
- 📈 Hide Graph
0 100 200 300 400 Tooltip : Ø340 (298.081-417.9)
: Ø396 (347.049-463.1)
...
AMD Radeon RX 5600 XT (Desktop)
AMD Radeon RX 5700 (Desktop)
AMD Radeon RX 6750 XT
NVIDIA GeForce RTX 2060 Super (Desktop)
AMD Radeon RX 5700 XT (Desktop)
NVIDIA GeForce RTX 3060
AMD Radeon RX 6650 XT
NVIDIA Titan RTX
NVIDIA GeForce RTX 3060 Ti
AMD Radeon RX 6700 XT
...
198 [X] Nvidia Titan X (Pascal) AMD Ryzen 9 5900X 3.7GHz
Titan X Pascal
min:
32.4 fps, P0.1:
136.7 fps, P1:
154.2 fps, max:
315 fps
267 [X] Nvidia Titan X (Pascal) AMD Ryzen 9 5900X 3.7GHz
Titan X Pascal
min:
3.05 fps, P0.1:
159.9 fps, P1:
198.4 fps, max:
468 fps
~ 233 fps
+ Compare
- Hide Comparison
+ 📈 Graph
- 📈 Hide Graph
0 100 200 300 Tooltip : Ø199.4 (177.585-229.04)
: Ø269 (180.63-341.9)
...
NVIDIA GeForce RTX 3060 Ti
AMD Radeon RX 6700 XT
AMD Radeon RX 6650 XT
NVIDIA Titan RTX
AMD Radeon RX 6750 XT
...
185.4 [X] Nvidia Titan X (Pascal) AMD Ryzen 9 5900X 3.7GHz
Titan X Pascal
min:
100.7 fps, P0.1:
115.4 fps, P1:
139.1 fps, max:
339 fps
252 [X] Nvidia Titan X (Pascal) AMD Ryzen 9 5900X 3.7GHz
Titan X Pascal
min:
83.9 fps, P0.1:
155.8 fps, P1:
180.8 fps, max:
434 fps
~ 219 fps
+ Compare
- Hide Comparison
+ 📈 Graph
- 📈 Hide Graph
0 100 200 300 400 500 600 700 800 900 1000 1100 1200 1300 1400 1500 1600 1700 1800 1900 2000 2100 2200 2300 2400 2500 2600 2700 2800 2900 3000 3100 3200 3300 3400 3500 3600 3700 3800 3900 4000 4100 4200 Tooltip : Ø336 (163.273-4254)
: Ø260 (227.012-407.1)
...
NVIDIA GeForce RTX 3060 Ti
AMD Radeon RX 6700 XT
AMD Radeon RX 6650 XT
NVIDIA Titan RTX
AMD Radeon RX 6750 XT
...
179.2 [X] Nvidia Titan X (Pascal) AMD Ryzen 9 5900X 3.7GHz
Titan X Pascal
min:
65.7 fps, P0.1:
98.9 fps, P1:
138.9 fps, max:
349 fps
244 [X] Nvidia Titan X (Pascal) AMD Ryzen 9 5900X 3.7GHz
Titan X Pascal
min:
64.3 fps, P0.1:
156.2 fps, P1:
177.7 fps, max:
408 fps
~ 212 fps
+ Compare
- Hide Comparison
+ 📈 Graph
- 📈 Hide Graph
0 100 200 Tooltip : Ø179.9 (158.997-217.023)
: Ø246 (218.302-298.568)
Intel UHD Graphics Xe G4 48EUs
...
AMD Radeon RX 6650 XT
AMD Radeon RX 6700 XT
NVIDIA GeForce RTX 3060 Ti
NVIDIA Titan RTX
AMD Radeon RX 6750 XT
...
0 100 200 300 Tooltip : Ø132.3 (107.242-367)
: Ø175 (148.322-209.8)
...
AMD Radeon RX 6650 XT
AMD Radeon RX 6700 XT
NVIDIA GeForce RTX 3060 Ti
AMD Radeon RX 6750 XT
NVIDIA Titan RTX
...
65.3 [X] Nvidia Titan X (Pascal) AMD Ryzen 9 5900X 3.7GHz
Titan X Pascal
min:
36 fps, P0.1:
43.4 fps, P1:
50.7 fps, max:
140.4 fps
93.6 [X] Nvidia Titan X (Pascal) AMD Ryzen 9 5900X 3.7GHz
Titan X Pascal
min:
27.1 fps, P0.1:
57.1 fps, P1:
71.5 fps, max:
250 fps
~ 79 fps
+ Compare
- Hide Comparison
+ 📈 Graph
- 📈 Hide Graph
0 100 Tooltip : Ø69.8 (57.89-140.7)
: Ø98 (82.63-123)
...
AMD Radeon RX 6650 XT
NVIDIA GeForce RTX 3060 Ti
AMD Radeon RX 6700 XT
AMD Radeon RX 6750 XT
NVIDIA Titan RTX
...
» With all tested laptops playable in detail settings ultra.
Additional Benchmarks
Low Preset 1280x720
391 [X] Nvidia Titan X (Pascal) AMD Ryzen 9 5900X 3.7GHz
Titan X Pascal
min:
37 fps, P0.1:
237 fps, P1:
276 fps, max:
555 fps
411 [X] Nvidia Titan X (Pascal) AMD Ryzen 9 5900X 3.7GHz
Titan X Pascal
min:
34.2 fps, P0.1:
230 fps, P1:
289 fps, max:
568 fps
138.9 [X] Nvidia Titan X (Pascal) AMD Ryzen 9 5900X 3.7GHz
Titan X Pascal
min:
46.1 fps, P0.1:
81.1 fps, P1:
94.7 fps, max:
245 fps
205 [X] Nvidia Titan X (Pascal) AMD Ryzen 9 5900X 3.7GHz
Titan X Pascal
min:
45.7 fps, P0.1:
100 fps, P1:
148.9 fps, max:
277 fps
~ 172 fps
+ Compare
- Hide Comparison
+ 📈 Graph
- 📈 Hide Graph
0 100 200 Tooltip : Ø142.7 (122.405-160.9)
: Ø208 (193.91-225.5)
...
AMD Radeon RX 5700 XT (Desktop)
AMD Radeon RX 5700 (Desktop)
NVIDIA GeForce RTX 3060 Ti
AMD Radeon RX 6700 XT
AMD Radeon RX 6650 XT
NVIDIA Titan RTX
...
137.9 [X] Nvidia Titan X (Pascal) AMD Ryzen 9 5900X 3.7GHz
Titan X Pascal
min:
30.2 fps, P0.1:
83.2 fps, P1:
95.3 fps, max:
238 fps
203 [X] Nvidia Titan X (Pascal) AMD Ryzen 9 5900X 3.7GHz
Titan X Pascal
min:
42 fps, P0.1:
95.2 fps, P1:
150.5 fps, max:
271 fps
~ 170 fps
+ Compare
- Hide Comparison
+ 📈 Graph
- 📈 Hide Graph
0 100 200 300 400 500 Tooltip : Ø140.4 (122.1-163.9)
: Ø216 (189.848-540)
...
AMD Radeon RX 5700 XT (Desktop)
AMD Radeon RX 6650 XT
AMD Radeon RX 6700 XT
NVIDIA GeForce RTX 3060 Ti
NVIDIA Titan RTX
...
0 100 200 300 Tooltip : Ø156.3 (118.602-391)
: Ø199.1 (188.018-216.481)
...
AMD Radeon RX 5700 XT (Desktop)
AMD Radeon RX 6650 XT
AMD Radeon RX 6700 XT
NVIDIA Titan RTX
...
136.5 [X] Nvidia Titan X (Pascal) AMD Ryzen 9 5900X 3.7GHz
Titan X Pascal
min:
31.5 fps, P0.1:
77.8 fps, P1:
92.2 fps, max:
236 fps
202 [X] Nvidia Titan X (Pascal) AMD Ryzen 9 5900X 3.7GHz
Titan X Pascal
min:
40.3 fps, P0.1:
106.5 fps, P1:
151 fps, max:
274 fps
~ 169 fps
+ Compare
- Hide Comparison
+ 📈 Graph
- 📈 Hide Graph
0 100 200 300 Tooltip : Ø147.5 (119.664-248.3)
: Ø209 (191.24-364.4)
...
AMD Radeon RX 6650 XT
AMD Radeon RX 6700 XT
NVIDIA GeForce RTX 3060 Ti
NVIDIA Titan RTX
AMD Radeon RX 6750 XT
...
92.5 [X] Nvidia Titan X (Pascal) AMD Ryzen 9 5900X 3.7GHz
Titan X Pascal
min:
32.7 fps, P0.1:
49.1 fps, P1:
56.2 fps, max:
228 fps
141 [X] Nvidia Titan X (Pascal) AMD Ryzen 9 5900X 3.7GHz
Titan X Pascal
min:
34.5 fps, P0.1:
65.6 fps, P1:
95.5 fps, max:
243 fps
~ 117 fps
+ Compare
- Hide Comparison
+ 📈 Graph
- 📈 Hide Graph
0 100 200 300 Tooltip : Ø105.1 (85.89-340)
: Ø144.4 (135.024-177.7)
...
NVIDIA GeForce RTX 3060 Ti
AMD Radeon RX 6700 XT
AMD Radeon RX 6750 XT
NVIDIA Titan RTX
...
48 [X] Nvidia Titan X (Pascal) AMD Ryzen 9 5900X 3.7GHz
Titan X Pascal
min:
16.2 fps, P0.1:
22.5 fps, P1:
26.6 fps, max:
219 fps
73.3 [X] Nvidia Titan X (Pascal) AMD Ryzen 9 5900X 3.7GHz
Titan X Pascal
min:
33.4 fps, P0.1:
39.4 fps, P1:
42.6 fps, max:
236 fps
~ 61 fps
+ Compare
- Hide Comparison
+ 📈 Graph
- 📈 Hide Graph
0 100 Tooltip : Ø51.4 (45.044-79.9)
: Ø79.2 (70.739-143.2)
...
AMD Radeon RX 6700 XT
NVIDIA GeForce RTX 3060 Ti
AMD Radeon RX 6750 XT
NVIDIA Titan RTX
...
» With all tested laptops playable in detail settings ultra.
Additional Benchmarks
Lowest Settings 1280x720
224 [X] Nvidia Titan X (Pascal) AMD Ryzen 9 5900X 3.7GHz
Titan X Pascal
min:
25.6 fps, P0.1:
100.4 fps, P1:
177.9 fps, max:
279 fps
203 [X] Nvidia Titan X (Pascal) AMD Ryzen 9 5900X 3.7GHz
Titan X Pascal
min:
24.6 fps, P0.1:
87.4 fps, P1:
145.4 fps, max:
281 fps
Highest Settings + Maximum Ray Tracing 1920x1080
74.5 [X] Nvidia Titan X (Pascal) AMD Ryzen 9 5900X 3.7GHz
Titan X Pascal
min:
22.7 fps, P0.1:
36.8 fps, P1:
47.7 fps, max:
151.1 fps
14.1 [X] Nvidia Titan X (Pascal) AMD Ryzen 9 5900X 3.7GHz
Titan X Pascal
min:
5.91 fps, P0.1:
5.94 fps, P1:
6.53 fps, max:
143.3 fps
171 [X] Nvidia Titan X (Pascal) AMD Ryzen 9 5900X 3.7GHz
Titan X Pascal
176.9 [X] Nvidia Titan X (Pascal) AMD Ryzen 9 7900X 4.7GHz
Titan X Pascal
180.3 [X] Nvidia Titan X (Pascal) AMD Ryzen 9 7950X 4.5GHz
Titan X Pascal
245 [X] Nvidia Titan X (Pascal) AMD Ryzen 9 5900X 3.7GHz
Titan X Pascal
~ 193 fps
+ Compare
- Hide Comparison
...
AMD Radeon RX 5600 XT (Desktop)
AMD Radeon RX 5700 (Desktop)
...
141.6 [X] Nvidia Titan X (Pascal) AMD Ryzen 9 5900X 3.7GHz
Titan X Pascal
142 [X] Nvidia Titan X (Pascal) AMD Ryzen 9 7900X 4.7GHz
Titan X Pascal
146.3 [X] Nvidia Titan X (Pascal) AMD Ryzen 9 7950X 4.5GHz
Titan X Pascal
201 [X] Nvidia Titan X (Pascal) AMD Ryzen 9 5900X 3.7GHz
Titan X Pascal
~ 158 fps
+ Compare
- Hide Comparison
...
AMD Radeon RX 5600 XT (Desktop)
AMD Radeon RX 5700 (Desktop)
AMD Radeon RX 5700 XT (Desktop)
...
100.3 [X] Nvidia Titan X (Pascal) AMD Ryzen 9 7900X 4.7GHz
Titan X Pascal
103.2 [X] Nvidia Titan X (Pascal) AMD Ryzen 9 7950X 4.5GHz
Titan X Pascal
103.4 [X] Nvidia Titan X (Pascal) AMD Ryzen 9 5900X 3.7GHz
Titan X Pascal
151.3 [X] Nvidia Titan X (Pascal) AMD Ryzen 9 5900X 3.7GHz
Titan X Pascal
~ 115 fps
+ Compare
- Hide Comparison
...
AMD Radeon RX 5700 XT (Desktop)
AMD Radeon RX 6650 XT
NVIDIA GeForce RTX 3060 Ti
...
80.5 [X] Nvidia Titan X (Pascal) AMD Ryzen 9 7900X 4.7GHz
Titan X Pascal
82.2 [X] Nvidia Titan X (Pascal) AMD Ryzen 9 7950X 4.5GHz
Titan X Pascal
84.6 [X] Nvidia Titan X (Pascal) AMD Ryzen 9 5900X 3.7GHz
Titan X Pascal
124.3 [X] Nvidia Titan X (Pascal) AMD Ryzen 9 5900X 3.7GHz
Titan X Pascal
~ 93 fps
+ Compare
- Hide Comparison
Intel UHD Graphics 24EUs (Alder Lake-N)
...
AMD Radeon RX 6650 XT
NVIDIA GeForce RTX 3060 Ti
AMD Radeon RX 6700 XT
...
56.3 [X] Nvidia Titan X (Pascal) AMD Ryzen 9 7900X 4.7GHz
Titan X Pascal
57.6 [X] Nvidia Titan X (Pascal) AMD Ryzen 9 7950X 4.5GHz
Titan X Pascal
62.3 [X] Nvidia Titan X (Pascal) AMD Ryzen 9 5900X 3.7GHz
Titan X Pascal
92.4 [X] Nvidia Titan X (Pascal) AMD Ryzen 9 5900X 3.7GHz
Titan X Pascal
~ 67 fps
+ Compare
- Hide Comparison
...
AMD Radeon RX 6650 XT
NVIDIA GeForce RTX 3060 Ti
AMD Radeon RX 6700 XT
NVIDIA Titan RTX
...
30.9 [X] Nvidia Titan X (Pascal) AMD Ryzen 9 7900X 4.7GHz
Titan X Pascal
31.5 [X] Nvidia Titan X (Pascal) AMD Ryzen 9 7950X 4.5GHz
Titan X Pascal
34.1 [X] Nvidia Titan X (Pascal) AMD Ryzen 9 5900X 3.7GHz
Titan X Pascal
50.4 [X] Nvidia Titan X (Pascal) AMD Ryzen 9 5900X 3.7GHz
Titan X Pascal
~ 37 fps
+ Compare
- Hide Comparison
...
NVIDIA GeForce RTX 3060 Ti
AMD Radeon RX 6700 XT
NVIDIA Titan RTX
NVIDIA GeForce RTX 3070 Ti
...
» With all tested laptops playable in detail settings ultra.
Additional Benchmarks
Lowest Preset (DX12) 1280x720
330 [X] Nvidia Titan X (Pascal) AMD Ryzen 9 5900X 3.7GHz
Titan X Pascal
268 [X] Nvidia Titan X (Pascal) AMD Ryzen 9 5900X 3.7GHz
Titan X Pascal
303 [X] Nvidia Titan X (Pascal) AMD Ryzen 9 7950X 4.5GHz
Titan X Pascal
79.1 [X] Nvidia Titan X (Pascal) AMD Ryzen 9 5900X 3.7GHz
Titan X Pascal
86.6 [X] Nvidia Titan X (Pascal) 1.6
AMD Ryzen 9 7950X 4.5GHz
Titan X Pascal
min:
59.3 fps, max:
220 fps
~ 83 fps
+ Compare
- Hide Comparison
...
NVIDIA GeForce GTX 1660 Ti (Desktop)
AMD Radeon RX 5700 XT (Desktop)
NVIDIA Titan RTX
NVIDIA GeForce RTX 3060
AMD Radeon RX 5600 XT (Desktop)
AMD Radeon RX 5700 (Desktop)
NVIDIA GeForce RTX 2060 Super (Desktop)
...
70.4 [X] Nvidia Titan X (Pascal) 1.6
AMD Ryzen 9 7950X 4.5GHz
Titan X Pascal
min:
51.5 fps, max:
155.9 fps
77.6 [X] Nvidia Titan X (Pascal) AMD Ryzen 9 5900X 3.7GHz
Titan X Pascal
~ 74 fps
+ Compare
- Hide Comparison
AMD Radeon RX Vega 8 (Ryzen 2000/3000)
...
NVIDIA GeForce GTX 1660 Ti (Desktop)
AMD Radeon RX 5600 XT (Desktop)
AMD Radeon RX 5700 (Desktop)
AMD Radeon RX 5700 XT (Desktop)
NVIDIA GeForce RTX 3060
NVIDIA GeForce RTX 2060 Super (Desktop)
NVIDIA Titan RTX
...
61.5 [X] Nvidia Titan X (Pascal) 1.6
AMD Ryzen 9 7950X 4.5GHz
Titan X Pascal
min:
45.6 fps, max:
93.4 fps
69.2 [X] Nvidia Titan X (Pascal) AMD Ryzen 9 5900X 3.7GHz
Titan X Pascal
~ 65 fps
+ Compare
- Hide Comparison
...
NVIDIA GeForce GTX 1660 Ti (Desktop)
AMD Radeon RX 5600 XT (Desktop)
AMD Radeon RX 5700 (Desktop)
NVIDIA GeForce RTX 2060 Super (Desktop)
NVIDIA GeForce RTX 3060
...
55.5 [X] Nvidia Titan X (Pascal) 1.6
AMD Ryzen 9 7950X 4.5GHz
Titan X Pascal
min:
37.9 fps, max:
77.1 fps
59.2 [X] Nvidia Titan X (Pascal) AMD Ryzen 9 5900X 3.7GHz
Titan X Pascal
~ 57 fps
+ Compare
- Hide Comparison
AMD Radeon RX Vega 8 (Ryzen 2000/3000)
...
NVIDIA GeForce GTX 1660 Ti (Desktop)
NVIDIA GeForce GTX 1660 Super (Desktop)
AMD Radeon RX 5600 XT (Desktop)
AMD Radeon RX 5700 (Desktop)
NVIDIA GeForce RTX 2060 Super (Desktop)
...
35.2 [X] Nvidia Titan X (Pascal) 1.6
AMD Ryzen 9 7950X 4.5GHz
Titan X Pascal
min:
24.2 fps, max:
46 fps
37.9 [X] Nvidia Titan X (Pascal) AMD Ryzen 9 5900X 3.7GHz
Titan X Pascal
~ 37 fps
+ Compare
- Hide Comparison
...
AMD Radeon RX 5600 XT (Desktop)
AMD Radeon RX 5700 (Desktop)
NVIDIA GeForce RTX 3060
NVIDIA GeForce RTX 2060 Super (Desktop)
AMD Radeon RX 5700 XT (Desktop)
...
16.6 [X] Nvidia Titan X (Pascal) 1.6
AMD Ryzen 9 7950X 4.5GHz
Titan X Pascal
min:
12.2 fps, max:
21.5 fps
17.5 [X] Nvidia Titan X (Pascal) AMD Ryzen 9 5900X 3.7GHz
Titan X Pascal
~ 17 fps
+ Compare
- Hide Comparison
NVIDIA GeForce GTX 1650 Super (Desktop)
...
NVIDIA GeForce GTX 1660 Super (Desktop)
NVIDIA GeForce GTX 1660 Ti (Desktop)
AMD Radeon RX 5600 XT (Desktop)
AMD Radeon RX 5700 (Desktop)
NVIDIA GeForce RTX 3060
AMD Radeon RX 6650 XT
NVIDIA GeForce RTX 2060 Super (Desktop)
...
» With all tested laptops playable in detail settings ultra.
Additional Benchmarks
Low Preset 1280x720
79.7 [X] Nvidia Titan X (Pascal) AMD Ryzen 9 5900X 3.7GHz
Titan X Pascal
129.9 [X] Nvidia Titan X (Pascal) AMD Ryzen 9 7950X 4.5GHz
Titan X Pascal
min:
58.9 fps, max:
250 fps
90.2 [X] Nvidia Titan X (Pascal) AMD Ryzen 9 5900X 3.7GHz
Titan X Pascal
min:
23.9 fps, P0.1:
63.6 fps, P1:
74 fps, max:
128 fps
94 [X] Nvidia Titan X (Pascal) AMD Ryzen 9 5900X 3.7GHz
Titan X Pascal
min:
25.3 fps, P0.1:
51.3 fps, P1:
73.5 fps, max:
151 fps
~ 92 fps
+ Compare
- Hide Comparison
+ 📈 Graph
- 📈 Hide Graph
0 100 Tooltip : Ø94.3 (80.254-132)
: Ø98.1 (84.638-148.5)
...
AMD Radeon RX 5700 (Desktop)
AMD Radeon RX 6700 XT
AMD Radeon RX 5700 XT (Desktop)
NVIDIA GeForce RTX 2060 Super (Desktop)
NVIDIA GeForce RTX 3060
NVIDIA Titan RTX
NVIDIA GeForce RTX 3060 Ti
...
...
AMD Radeon RX 5700 (Desktop)
AMD Radeon RX 6700 XT
AMD Radeon RX 5700 XT (Desktop)
NVIDIA GeForce RTX 2060 Super (Desktop)
NVIDIA GeForce RTX 3060
NVIDIA GeForce RTX 3060 Ti
NVIDIA Titan RTX
...
...
AMD Radeon RX 5700 (Desktop)
AMD Radeon RX 5700 XT (Desktop)
NVIDIA GeForce RTX 2060 Super (Desktop)
NVIDIA GeForce RTX 3060
NVIDIA GeForce RTX 3060 Ti
...
...
AMD Radeon RX 5700 (Desktop)
NVIDIA GeForce RTX 2060 Super (Desktop)
AMD Radeon RX 5700 XT (Desktop)
NVIDIA GeForce RTX 3060
AMD Radeon RX 6700 XT
NVIDIA GeForce RTX 3060 Ti
...
...
AMD Radeon RX 5700 (Desktop)
NVIDIA GeForce RTX 2060 Super (Desktop)
AMD Radeon RX 5700 XT (Desktop)
NVIDIA GeForce RTX 3060
NVIDIA GeForce RTX 3060 Ti
NVIDIA Titan RTX
AMD Radeon RX 6700 XT
...
» With all tested laptops playable in detail settings ultra.
Additional Benchmarks
Low / Off 1280x720
100 [X] Nvidia Titan X (Pascal) AMD Ryzen 9 5900X 3.7GHz
Titan X Pascal
min:
27.5 fps, P0.1:
40 fps, P1:
68 fps, max:
175 fps
205 [X] Nvidia Titan X (Pascal) AMD Ryzen 9 5900X 3.7GHz
Titan X Pascal
224.1 [X] Nvidia Titan X (Pascal) AMD Ryzen 9 7900X 4.7GHz
Titan X Pascal
234 [X] Nvidia Titan X (Pascal) 591708
AMD Ryzen 9 7950X 4.5GHz
Titan X Pascal
min:
76.7 fps, max:
391 fps
~ 221 fps
+ Compare
- Hide Comparison
...
NVIDIA GeForce RTX 3060
NVIDIA GeForce GTX 1660 Super (Desktop)
AMD Radeon RX 5600 XT (Desktop)
NVIDIA GeForce RTX 3060 Ti
AMD Radeon RX 5700 (Desktop)
NVIDIA GeForce RTX 2060 Super (Desktop)
...
164.2 [X] Nvidia Titan X (Pascal) AMD Ryzen 9 5900X 3.7GHz
Titan X Pascal
172.6 [X] Nvidia Titan X (Pascal) AMD Ryzen 9 7900X 4.7GHz
Titan X Pascal
180.3 [X] Nvidia Titan X (Pascal) 591708
AMD Ryzen 9 7950X 4.5GHz
Titan X Pascal
min:
69.4 fps, max:
325 fps
~ 172 fps
+ Compare
- Hide Comparison
...
NVIDIA GeForce RTX 3060
AMD Radeon RX 5600 XT (Desktop)
NVIDIA GeForce RTX 3060 Ti
AMD Radeon RX 6650 XT
NVIDIA GeForce RTX 2060 Super (Desktop)
AMD Radeon RX 5700 (Desktop)
...
137 [X] Nvidia Titan X (Pascal) AMD Ryzen 9 5900X 3.7GHz
Titan X Pascal
139.9 [X] Nvidia Titan X (Pascal) AMD Ryzen 9 7900X 4.7GHz
Titan X Pascal
146 [X] Nvidia Titan X (Pascal) 591708
AMD Ryzen 9 7950X 4.5GHz
Titan X Pascal
min:
46.9 fps, max:
296 fps
~ 141 fps
+ Compare
- Hide Comparison
Intel UHD Graphics 24EUs (Alder Lake-N)
...
NVIDIA GeForce RTX 3060
AMD Radeon RX 5600 XT (Desktop)
NVIDIA GeForce RTX 3060 Ti
NVIDIA GeForce RTX 2060 Super (Desktop)
AMD Radeon RX 5700 (Desktop)
...
104.5 [X] Nvidia Titan X (Pascal) AMD Ryzen 9 5900X 3.7GHz
Titan X Pascal
110.4 [X] Nvidia Titan X (Pascal) AMD Ryzen 9 7900X 4.7GHz
Titan X Pascal
115.9 [X] Nvidia Titan X (Pascal) 591708
AMD Ryzen 9 7950X 4.5GHz
Titan X Pascal
min:
43.6 fps, max:
256 fps
~ 110 fps
+ Compare
- Hide Comparison
AMD Radeon RX Vega 6 (Ryzen 4000/5000)
...
NVIDIA GeForce RTX 3060
NVIDIA GeForce RTX 2060 Super (Desktop)
AMD Radeon RX 5600 XT (Desktop)
NVIDIA GeForce RTX 3060 Ti
AMD Radeon RX 5700 (Desktop)
...
84.4 [X] Nvidia Titan X (Pascal) AMD Ryzen 9 5900X 3.7GHz
Titan X Pascal
88.6 [X] Nvidia Titan X (Pascal) AMD Ryzen 9 7900X 4.7GHz
Titan X Pascal
91.6 [X] Nvidia Titan X (Pascal) 591708
AMD Ryzen 9 7950X 4.5GHz
Titan X Pascal
min:
53 fps, max:
243 fps
~ 88 fps
+ Compare
- Hide Comparison
...
NVIDIA GeForce RTX 3060
NVIDIA GeForce RTX 2060 Super (Desktop)
AMD Radeon RX 5600 XT (Desktop)
NVIDIA GeForce RTX 3060 Ti
AMD Radeon RX 5700 (Desktop)
...
53.4 [X] Nvidia Titan X (Pascal) AMD Ryzen 9 5900X 3.7GHz
Titan X Pascal
56.1 [X] Nvidia Titan X (Pascal) AMD Ryzen 9 7900X 4.7GHz
Titan X Pascal
57.3 [X] Nvidia Titan X (Pascal) 591708
AMD Ryzen 9 7950X 4.5GHz
Titan X Pascal
min:
40.6 fps, max:
109.4 fps
~ 56 fps
+ Compare
- Hide Comparison
...
NVIDIA GeForce GTX 1660 Ti (Desktop)
NVIDIA GeForce GTX 1660 Super (Desktop)
NVIDIA GeForce RTX 3060
NVIDIA GeForce RTX 2060 Super (Desktop)
AMD Radeon RX 5600 XT (Desktop)
AMD Radeon RX 5700 (Desktop)
...
» With all tested laptops playable in detail settings ultra.
Additional Benchmarks
Low Preset 1280x720
204.4 [X] Nvidia Titan X (Pascal) AMD Ryzen 9 5900X 3.7GHz
Titan X Pascal
283 [X] Nvidia Titan X (Pascal) AMD Ryzen 9 7950X 4.5GHz
Titan X Pascal
min:
75.8 fps, max:
426 fps
...
NVIDIA GeForce GTX 1650 Super (Desktop)
AMD Radeon RX 5600 XT (Desktop)
NVIDIA GeForce GTX 1660 (Desktop)
NVIDIA GeForce RTX 2060 Super (Desktop)
NVIDIA GeForce RTX 3060 Ti
NVIDIA Titan RTX
NVIDIA GeForce GTX 1660 Ti (Desktop)
NVIDIA GeForce GTX 1660 Super (Desktop)
...
...
NVIDIA GeForce GTX 1660 (Desktop)
NVIDIA GeForce RTX 2060 Super (Desktop)
NVIDIA Titan RTX
AMD Radeon RX 5600 XT (Desktop)
NVIDIA GeForce GTX 1660 Ti (Desktop)
NVIDIA GeForce GTX 1660 Super (Desktop)
...
...
NVIDIA GeForce GTX 1660 (Desktop)
NVIDIA Titan RTX
NVIDIA GeForce RTX 2060 Super (Desktop)
AMD Radeon RX 5600 XT (Desktop)
NVIDIA GeForce GTX 1660 Super (Desktop)
NVIDIA GeForce GTX 1660 Ti (Desktop)
NVIDIA GeForce RTX 3060 Ti
AMD Radeon RX 5700 (Desktop)
...
59.9 [X] Nvidia Titan X (Pascal) AMD Ryzen 9 5900X 3.7GHz
Titan X Pascal
min:
27 fps, P0.1:
35.2 fps, P1:
51.2 fps, max:
98.4 fps
59.9 [X] Nvidia Titan X (Pascal) AMD Ryzen 9 5900X 3.7GHz
Titan X Pascal
min:
29.8 fps, P0.1:
35.8 fps, P1:
49.7 fps, max:
104.7 fps
~ 60 fps
+ Compare
- Hide Comparison
+ 📈 Graph
- 📈 Hide Graph
0 100 200 300 400 500 600 700 800 900 1000 1100 1200 1300 1400 1500 1600 1700 1800 1900 2000 2100 2200 2300 2400 2500 2600 2700 2800 2900 3000 3100 3200 3300 3400 3500 3600 3700 3800 3900 4000 4100 4200 4300 4400 4500 4600 4700 4800 4900 5000 5100 5200 5300 5400 5500 5600 5700 5800 5900 6000 6100 6200 6300 6400 6500 6600 6700 6800 6900 7000 7100 7200 7300 7400 7500 7600 7700 7800 7900 8000 8100 8200 8300 8400 8500 8600 8700 8800 8900 9000 9100 9200 9300 9400 9500 9600 9700 9800 9900 Tooltip : Ø61.8 (59.009-90.2)
: Ø422 (59.028-10149)
Intel UHD Graphics Xe G4 48EUs
...
AMD Radeon RX 5600 XT (Desktop)
AMD Radeon RX 5700 XT (Desktop)
NVIDIA GeForce RTX 3060 Ti
NVIDIA GeForce RTX 2060 Super (Desktop)
NVIDIA Titan RTX
NVIDIA GeForce RTX 3060
...
...
AMD Radeon RX 5700 (Desktop)
NVIDIA GeForce RTX 2060 Super (Desktop)
NVIDIA GeForce RTX 3060 Ti
NVIDIA Titan RTX
AMD Radeon RX 6700 XT
...
...
NVIDIA GeForce RTX 3060
AMD Radeon RX 5700 (Desktop)
AMD Radeon RX 5700 XT (Desktop)
NVIDIA GeForce RTX 3060 Ti
AMD Radeon RX 6700 XT
NVIDIA GeForce RTX 2060 Super (Desktop)
...
» With all tested laptops playable in detail settings ultra.
Additional Benchmarks
Low Preset 1280x720
59.9 [X] Nvidia Titan X (Pascal) AMD Ryzen 9 5900X 3.7GHz
Titan X Pascal
0 100 Tooltip : Ø127.8 (121.585-135.18)
...
NVIDIA GeForce RTX 2060 Super (Desktop)
NVIDIA GeForce RTX 3060 Ti
AMD Radeon RX 5600 XT (Desktop)
AMD Radeon RX 5700 (Desktop)
NVIDIA Titan RTX
AMD Radeon RX 5700 XT (Desktop)
...
...
NVIDIA GeForce RTX 2060 Super (Desktop)
NVIDIA GeForce RTX 3060
AMD Radeon RX 5600 XT (Desktop)
AMD Radeon RX 5700 (Desktop)
AMD Radeon RX 5700 XT (Desktop)
...
...
NVIDIA GeForce RTX 2060 Super (Desktop)
AMD Radeon RX 5600 XT (Desktop)
NVIDIA GeForce RTX 3060
AMD Radeon RX 5700 (Desktop)
AMD Radeon RX 5700 XT (Desktop)
...
...
NVIDIA GeForce RTX 2060 Super (Desktop)
AMD Radeon RX 5600 XT (Desktop)
AMD Radeon RX 5700 (Desktop)
NVIDIA GeForce RTX 3060
AMD Radeon RX 5700 XT (Desktop)
...
...
NVIDIA GeForce GTX 1660 Ti (Desktop)
AMD Radeon RX 5600 XT (Desktop)
NVIDIA GeForce RTX 2060 Super (Desktop)
AMD Radeon RX 5700 (Desktop)
NVIDIA GeForce RTX 3060
AMD Radeon RX 5700 XT (Desktop)
...
» With all tested laptops playable in detail settings high.
Additional Benchmarks
Low Quality 1280x720
158 [X] Nvidia Titan X (Pascal) AMD Ryzen 9 5900X 3.7GHz
Titan X Pascal
min:
34.6 fps, P0.1:
88 fps, P1:
134 fps, max:
188 fps
...
NVIDIA GeForce GTX 1650 Super (Desktop)
NVIDIA GeForce GTX 1660 (Desktop)
NVIDIA GeForce GTX 1660 Super (Desktop)
NVIDIA GeForce GTX 1660 Ti (Desktop)
NVIDIA GeForce RTX 2060 Super (Desktop)
AMD Radeon RX 5700 (Desktop)
NVIDIA GeForce RTX 3060
AMD Radeon RX 5700 XT (Desktop)
AMD Radeon RX 5600 XT (Desktop)
...
...
NVIDIA GeForce RTX 2060 Super (Desktop)
AMD Radeon RX 5700 (Desktop)
NVIDIA GeForce RTX 3060
AMD Radeon RX 5700 XT (Desktop)
AMD Radeon RX 6650 XT
AMD Radeon RX 5600 XT (Desktop)
...
...
NVIDIA GeForce GTX 1660 Ti (Desktop)
AMD Radeon RX 5600 XT (Desktop)
NVIDIA GeForce RTX 2060 Super (Desktop)
AMD Radeon RX 5700 (Desktop)
NVIDIA GeForce RTX 3060
AMD Radeon RX 5700 XT (Desktop)
...
...
NVIDIA GeForce GTX 1660 Ti (Desktop)
AMD Radeon RX 5600 XT (Desktop)
NVIDIA GeForce RTX 2060 Super (Desktop)
AMD Radeon RX 5700 (Desktop)
NVIDIA GeForce RTX 3060
AMD Radeon RX 6650 XT
AMD Radeon RX 5700 XT (Desktop)
...
...
AMD Radeon RX 5600 XT (Desktop)
NVIDIA GeForce RTX 2060 Super (Desktop)
AMD Radeon RX 5700 (Desktop)
NVIDIA GeForce RTX 3060
AMD Radeon RX 6650 XT
AMD Radeon RX 5700 XT (Desktop)
NVIDIA GeForce RTX 3060 Ti
...
...
NVIDIA GeForce RTX 2060 Super (Desktop)
AMD Radeon RX 5700 (Desktop)
AMD Radeon RX 5700 XT (Desktop)
AMD Radeon RX 6650 XT
AMD Radeon RX 6700 XT
NVIDIA GeForce RTX 3060 Ti
AMD Radeon RX 6750 XT
...
» With all tested laptops playable in detail settings ultra.
Additional Benchmarks
Ultra Low Preset (with Fixed Resolution Quality) 1280x720
286 [X] Nvidia Titan X (Pascal) AMD Ryzen 9 5900X 3.7GHz
Titan X Pascal
115 [X] Nvidia Titan X (Pascal) AMD Ryzen 9 5900X 3.7GHz
Titan X Pascal
min:
81 fps, P0.1:
84.5 fps, P1:
95 fps, max:
213 fps
116.3 [X] Nvidia Titan X (Pascal) AMD Ryzen 9 7900X 4.7GHz
Titan X Pascal
min:
59.1 fps, P0.1:
75.9 fps, P1:
99.7 fps, max:
530 fps
116.6 [X] Nvidia Titan X (Pascal) AMD Ryzen 9 7950X 4.5GHz
Titan X Pascal
min:
65.4 fps, P0.1:
85.9 fps, P1:
103.6 fps, max:
295 fps
~ 116 fps
+ Compare
- Hide Comparison
+ 📈 Graph
- 📈 Hide Graph
0 100 200 Tooltip : Ø120.2 (108.711-225)
: Ø122.7 (111.06-190.1)
: Ø118.8 (109.43-144.7)
Intel UHD Graphics G1 (Ice Lake 32 EU)
...
NVIDIA GeForce GTX 1660 Super (Desktop)
AMD Radeon RX 5600 XT (Desktop)
NVIDIA GeForce RTX 2060 Super (Desktop)
AMD Radeon RX 5700 (Desktop)
NVIDIA GeForce RTX 3060
...
98.2 [X] Nvidia Titan X (Pascal) AMD Ryzen 9 7900X 4.7GHz
Titan X Pascal
min:
55.2 fps, P0.1:
69.3 fps, P1:
86.3 fps, max:
510 fps
98.8 [X] Nvidia Titan X (Pascal) AMD Ryzen 9 5900X 3.7GHz
Titan X Pascal
min:
70.8 fps, P0.1:
75.8 fps, P1:
82.8 fps, max:
163 fps
102.6 [X] Nvidia Titan X (Pascal) AMD Ryzen 9 7950X 4.5GHz
Titan X Pascal
min:
67.5 fps, P0.1:
84.2 fps, P1:
93 fps, max:
230 fps
~ 100 fps
+ Compare
- Hide Comparison
+ 📈 Graph
- 📈 Hide Graph
0 100 200 300 400 Tooltip : Ø113.3 (93.291-494)
: Ø113.4 (92.629-427)
: Ø104 (98.373-109.963)
...
AMD Radeon RX 5700 (Desktop)
AMD Radeon RX 5600 XT (Desktop)
NVIDIA GeForce RTX 3060
NVIDIA GeForce RTX 2060 Super (Desktop)
AMD Radeon RX 5700 XT (Desktop)
NVIDIA GeForce RTX 3060 Ti
...
82.2 [X] Nvidia Titan X (Pascal) AMD Ryzen 9 5900X 3.7GHz
Titan X Pascal
min:
58.9 fps, P0.1:
62.2 fps, P1:
70.1 fps, max:
152 fps
82.2 [X] Nvidia Titan X (Pascal) AMD Ryzen 9 7900X 4.7GHz
Titan X Pascal
min:
55.4 fps, P0.1:
61.8 fps, P1:
72.2 fps, max:
151.9 fps
84.6 [X] Nvidia Titan X (Pascal) AMD Ryzen 9 7950X 4.5GHz
Titan X Pascal
min:
43.6 fps, P0.1:
62.3 fps, P1:
75.7 fps, max:
349 fps
~ 83 fps
+ Compare
- Hide Comparison
+ 📈 Graph
- 📈 Hide Graph
0 100 200 300 400 Tooltip : Ø92.3 (77.011-281)
: Ø87.6 (77.716-173.9)
: Ø103.2 (80.62-422)
...
AMD Radeon RX 5600 XT (Desktop)
NVIDIA GeForce RTX 3060
NVIDIA GeForce RTX 2060 Super (Desktop)
AMD Radeon RX 5700 (Desktop)
AMD Radeon RX 5700 XT (Desktop)
NVIDIA GeForce RTX 3060 Ti
...
59.7 [X] Nvidia Titan X (Pascal) AMD Ryzen 9 5900X 3.7GHz
Titan X Pascal
min:
40.8 fps, P0.1:
44 fps, P1:
49.7 fps, max:
98.1 fps
60 [X] Nvidia Titan X (Pascal) AMD Ryzen 9 7950X 4.5GHz
Titan X Pascal
min:
37.5 fps, P0.1:
40.3 fps, P1:
52.8 fps, max:
147.7 fps
62.4 [X] Nvidia Titan X (Pascal) AMD Ryzen 9 7900X 4.7GHz
Titan X Pascal
min:
38.7 fps, P0.1:
48 fps, P1:
54.8 fps, max:
134.2 fps
~ 61 fps
+ Compare
- Hide Comparison
+ 📈 Graph
- 📈 Hide Graph
0 100 Tooltip : Ø64.1 (52.184-100.6)
: Ø63.3 (54.765-72.8)
: Ø65.3 (58.057-83.9)
...
AMD Radeon RX 5700 (Desktop)
NVIDIA GeForce RTX 2060 Super (Desktop)
AMD Radeon RX 5700 XT (Desktop)
AMD Radeon RX 6650 XT
NVIDIA GeForce RTX 3060 Ti
...
49.3 [X] Nvidia Titan X (Pascal) AMD Ryzen 9 5900X 3.7GHz
Titan X Pascal
min:
37.1 fps, P0.1:
40.3 fps, P1:
42.2 fps, max:
77.4 fps
50 [X] Nvidia Titan X (Pascal) AMD Ryzen 9 7950X 4.5GHz
Titan X Pascal
min:
37.6 fps, P0.1:
39.1 fps, P1:
43.9 fps, max:
80.7 fps
50.9 [X] Nvidia Titan X (Pascal) AMD Ryzen 9 7900X 4.7GHz
Titan X Pascal
min:
32.6 fps, P0.1:
37 fps, P1:
43.4 fps, max:
105.3 fps
~ 50 fps
+ Compare
- Hide Comparison
+ 📈 Graph
- 📈 Hide Graph
0 100 200 300 400 500 600 700 800 900 1000 1100 1200 1300 1400 1500 1600 1700 1800 1900 2000 2100 2200 2300 2400 2500 2600 2700 2800 2900 3000 3100 3200 3300 3400 3500 3600 3700 3800 3900 4000 4100 4200 4300 4400 4500 4600 4700 4800 4900 5000 5100 5200 5300 5400 5500 5600 5700 5800 5900 6000 6100 6200 6300 6400 6500 6600 6700 6800 6900 7000 7100 7200 7300 7400 7500 7600 7700 7800 7900 8000 8100 8200 8300 8400 8500 8600 8700 8800 8900 9000 9100 9200 9300 9400 9500 9600 9700 9800 9900 Tooltip : Ø51.5 (44.51-60.4)
: Ø437 (46.5-11337)
: Ø59.9 (46.15-244.8)
...
AMD Radeon RX 5700 (Desktop)
NVIDIA GeForce RTX 3060
NVIDIA GeForce RTX 2060 Super (Desktop)
AMD Radeon RX 6650 XT
AMD Radeon RX 5700 XT (Desktop)
...
33.3 [X] Nvidia Titan X (Pascal) AMD Ryzen 9 5900X 3.7GHz
Titan X Pascal
min:
26.2 fps, P0.1:
26.2 fps, P1:
30.3 fps, max:
41.8 fps
33.6 [X] Nvidia Titan X (Pascal) AMD Ryzen 9 7900X 4.7GHz
Titan X Pascal
min:
23.9 fps, P0.1:
28.3 fps, P1:
30 fps, max:
52.4 fps
34.2 [X] Nvidia Titan X (Pascal) AMD Ryzen 9 7950X 4.5GHz
Titan X Pascal
min:
26.8 fps, P0.1:
28.7 fps, P1:
30.3 fps, max:
45 fps
~ 34 fps
+ Compare
- Hide Comparison
+ 📈 Graph
- 📈 Hide Graph
0 Tooltip : Ø40.7 (31.295-96.3)
: Ø38.3 (32.055-77.9)
: Ø37.2 (31.586-50.6)
...
NVIDIA GeForce RTX 2060 Super (Desktop)
NVIDIA GeForce RTX 3060
AMD Radeon RX 6650 XT
AMD Radeon RX 5700 XT (Desktop)
...
» With all tested laptops playable in detail settings ultra.
Additional Benchmarks
Low Preset 1280x720
154 [X] Nvidia Titan X (Pascal) AMD Ryzen 9 5900X 3.7GHz
Titan X Pascal
min:
41.2 fps, P0.1:
89.4 fps, P1:
110 fps, max:
390 fps
163.8 [X] Nvidia Titan X (Pascal) AMD Ryzen 9 7950X 4.5GHz
Titan X Pascal
min:
79.6 fps, P0.1:
127.1 fps, P1:
141 fps, max:
480 fps
...
AMD Radeon RX 5700 (Desktop)
NVIDIA GeForce GTX 1660 Super (Desktop)
AMD Radeon RX 5600 XT (Desktop)
AMD Radeon RX 5700 XT (Desktop)
NVIDIA GeForce GTX 1660 Ti (Desktop)
NVIDIA GeForce RTX 3060
NVIDIA GeForce RTX 2060 Super (Desktop)
...
...
AMD Radeon RX 5700 XT (Desktop)
NVIDIA GeForce GTX 1650 Super (Desktop)
NVIDIA GeForce GTX 1660 Super (Desktop)
NVIDIA GeForce GTX 1660 Ti (Desktop)
NVIDIA GeForce RTX 3060
NVIDIA GeForce RTX 2060 Super (Desktop)
...
...
AMD Radeon RX 5700 XT (Desktop)
NVIDIA GeForce GTX 1660 (Desktop)
NVIDIA GeForce GTX 1660 Super (Desktop)
AMD Radeon RX 5700 (Desktop)
NVIDIA GeForce GTX 1650 Super (Desktop)
AMD Radeon RX 5600 XT (Desktop)
NVIDIA GeForce RTX 3060
NVIDIA GeForce RTX 2060 Super (Desktop)
...
...
AMD Radeon RX 5600 XT (Desktop)
NVIDIA GeForce GTX 1650 Super (Desktop)
AMD Radeon RX 5700 (Desktop)
NVIDIA GeForce RTX 2060 Super (Desktop)
AMD Radeon RX 5700 XT (Desktop)
NVIDIA GeForce GTX 1660 Super (Desktop)
NVIDIA GeForce GTX 1660 (Desktop)
NVIDIA GeForce RTX 3060
...
...
NVIDIA GeForce GTX 1660 (Desktop)
NVIDIA GeForce RTX 2060 Super (Desktop)
NVIDIA GeForce GTX 1660 Super (Desktop)
NVIDIA GeForce RTX 3060
NVIDIA Titan RTX
AMD Radeon RX 6700 XT
» With all tested laptops playable in detail settings ultra.
Additional Benchmarks
Low Preset 1920x1080
110 [X] Nvidia Titan X (Pascal) AMD Ryzen 9 5900X 3.7GHz
Titan X Pascal
min:
28.8 fps, P0.1:
55.2 fps, P1:
83.5 fps, max:
281 fps
...
Intel Arc A380
NVIDIA GeForce RTX 3060
NVIDIA GeForce RTX 2060 Super (Desktop)
NVIDIA Titan RTX
AMD Radeon RX 6650 XT
NVIDIA GeForce GTX 1660 (Desktop)
AMD Radeon RX 5700 XT (Desktop)
AMD Radeon RX 6700 XT
NVIDIA GeForce GTX 1660 Ti (Desktop)
AMD Radeon RX 5700 (Desktop)
...
...
NVIDIA GeForce RTX 3060
AMD Radeon RX 6650 XT
AMD Radeon RX 5700 XT (Desktop)
NVIDIA Titan RTX
NVIDIA GeForce RTX 2060 Super (Desktop)
AMD Radeon RX 6750 XT
AMD Radeon RX 6700 XT
NVIDIA GeForce RTX 3060 Ti
...
...
AMD Radeon RX 5700 XT (Desktop)
NVIDIA GeForce RTX 2060 Super (Desktop)
AMD Radeon RX 6650 XT
NVIDIA Titan RTX
AMD Radeon RX 6700 XT
...
AMD Radeon RX Vega 6 (Ryzen 4000/5000)
...
NVIDIA GeForce RTX 2060 Super (Desktop)
AMD Radeon RX 6650 XT
NVIDIA Titan RTX
...
...
AMD Radeon RX 5700 XT (Desktop)
NVIDIA GeForce RTX 2060 Super (Desktop)
...
...
NVIDIA GeForce RTX 2060 Super (Desktop)
AMD Radeon RX 5700 XT (Desktop)
AMD Radeon RX 6650 XT
NVIDIA GeForce RTX 3060 Ti
...
» With all tested laptops playable in detail settings ultra.
Additional Benchmarks
Low Preset 1920x1080
291 [X] Nvidia Titan X (Pascal) AMD Ryzen 9 5900X 3.7GHz
Titan X Pascal
min:
36.6 fps, P0.1:
143 fps, P1:
172 fps, max:
363 fps
...
AMD Radeon RX 5700 (Desktop)
NVIDIA GeForce GTX 1660 (Desktop)
NVIDIA GeForce RTX 3060
NVIDIA GeForce GTX 1660 Super (Desktop)
NVIDIA GeForce GTX 1660 Ti (Desktop)
AMD Radeon RX 5700 XT (Desktop)
AMD Radeon RX 5600 XT (Desktop)
NVIDIA GeForce RTX 3060 Ti
Intel UHD Graphics Xe 32EUs (Tiger Lake-H)
...
NVIDIA GeForce GTX 1660 Super (Desktop)
NVIDIA GeForce GTX 1660 Ti (Desktop)
AMD Radeon RX 5600 XT (Desktop)
NVIDIA GeForce RTX 2060 Super (Desktop)
AMD Radeon RX 5700 (Desktop)
NVIDIA GeForce RTX 3060
AMD Radeon RX 5700 XT (Desktop)
NVIDIA GeForce RTX 3060 Ti
...
...
NVIDIA GeForce GTX 1660 (Desktop)
NVIDIA GeForce GTX 1660 Ti (Desktop)
NVIDIA GeForce GTX 1660 Super (Desktop)
AMD Radeon RX 5600 XT (Desktop)
NVIDIA GeForce RTX 2060 Super (Desktop)
AMD Radeon RX 5700 (Desktop)
AMD Radeon RX 5700 XT (Desktop)
NVIDIA GeForce RTX 3060 Ti
...
...
NVIDIA GeForce GTX 1660 (Desktop)
NVIDIA GeForce GTX 1660 Super (Desktop)
NVIDIA GeForce GTX 1660 Ti (Desktop)
AMD Radeon RX 5600 XT (Desktop)
NVIDIA GeForce RTX 2060 Super (Desktop)
AMD Radeon RX 5700 (Desktop)
NVIDIA GeForce RTX 3060
AMD Radeon RX 5700 XT (Desktop)
NVIDIA GeForce RTX 3060 Ti
...
...
NVIDIA GeForce GTX 1660 Super (Desktop)
NVIDIA GeForce GTX 1660 Ti (Desktop)
AMD Radeon RX 5600 XT (Desktop)
NVIDIA GeForce RTX 2060 Super (Desktop)
NVIDIA GeForce RTX 3060
AMD Radeon RX 5700 (Desktop)
AMD Radeon RX 5700 XT (Desktop)
NVIDIA GeForce RTX 3060 Ti
...
0 100 200 300 400 500 600 700 Tooltip
...
NVIDIA GeForce GTX 1660 (Desktop)
NVIDIA GeForce GTX 1660 Super (Desktop)
AMD Radeon RX 5600 XT (Desktop)
NVIDIA GeForce RTX 2060 Super (Desktop)
NVIDIA GeForce RTX 3060
AMD Radeon RX 5700 (Desktop)
AMD Radeon RX 5700 XT (Desktop)
NVIDIA GeForce RTX 3060 Ti
AMD Radeon RX 6700 XT
...
» With all tested laptops playable in detail settings ultra.
Additional Benchmarks
Low Preset 1920x1080
135 [X] Nvidia Titan X (Pascal) AMD Ryzen 9 5900X 3.7GHz
Titan X Pascal
min:
7.89 fps, P0.1:
67 fps, P1:
97.9 fps, max:
184 fps
178 [X] Nvidia Titan X (Pascal) AMD Ryzen 9 5900X 3.7GHz
Titan X Pascal
206 [X] Nvidia Titan X (Pascal) AMD Ryzen 9 7900X 4.7GHz
Titan X Pascal
211 [X] Nvidia Titan X (Pascal) AMD Ryzen 9 7950X 4.5GHz
Titan X Pascal
~ 198 fps
+ Compare
- Hide Comparison
...
AMD Radeon RX 5600 XT (Desktop)
NVIDIA GeForce GTX 1650 Super (Desktop)
NVIDIA GeForce RTX 3060
NVIDIA GeForce GTX 1660 (Desktop)
NVIDIA GeForce GTX 1660 Ti (Desktop)
NVIDIA GeForce GTX 1660 Super (Desktop)
...
115 [X] Nvidia Titan X (Pascal) AMD Ryzen 9 5900X 3.7GHz
Titan X Pascal
119 [X] Nvidia Titan X (Pascal) AMD Ryzen 9 7900X 4.7GHz
Titan X Pascal
123 [X] Nvidia Titan X (Pascal) AMD Ryzen 9 7950X 4.5GHz
Titan X Pascal
~ 119 fps
+ Compare
- Hide Comparison
Intel UHD Graphics Xe 16EUs (Tiger Lake-H)
...
AMD Radeon RX 5600 XT (Desktop)
NVIDIA GeForce GTX 1660 Super (Desktop)
NVIDIA GeForce GTX 1660 Ti (Desktop)
NVIDIA GeForce RTX 2060 Super (Desktop)
NVIDIA GeForce RTX 3060
...
103 [X] Nvidia Titan X (Pascal) AMD Ryzen 9 5900X 3.7GHz
Titan X Pascal
106 [X] Nvidia Titan X (Pascal) AMD Ryzen 9 7900X 4.7GHz
Titan X Pascal
110 [X] Nvidia Titan X (Pascal) AMD Ryzen 9 7950X 4.5GHz
Titan X Pascal
~ 106 fps
+ Compare
- Hide Comparison
...
AMD Radeon RX 5600 XT (Desktop)
NVIDIA GeForce GTX 1660 (Desktop)
NVIDIA GeForce GTX 1660 Super (Desktop)
NVIDIA GeForce GTX 1660 Ti (Desktop)
NVIDIA GeForce RTX 2060 Super (Desktop)
NVIDIA GeForce RTX 3060
AMD Radeon RX 5700 (Desktop)
...
64 [X] Nvidia Titan X (Pascal) AMD Ryzen 9 5900X 3.7GHz
Titan X Pascal
66 [X] Nvidia Titan X (Pascal) AMD Ryzen 9 7900X 4.7GHz
Titan X Pascal
68 [X] Nvidia Titan X (Pascal) AMD Ryzen 9 7950X 4.5GHz
Titan X Pascal
~ 66 fps
+ Compare
- Hide Comparison
...
AMD Radeon RX 5600 XT (Desktop)
NVIDIA GeForce GTX 1660 Ti (Desktop)
AMD Radeon RX 5700 (Desktop)
NVIDIA GeForce RTX 2060 Super (Desktop)
AMD Radeon RX 5700 XT (Desktop)
...
56 [X] Nvidia Titan X (Pascal) AMD Ryzen 9 5900X 3.7GHz
Titan X Pascal
57 [X] Nvidia Titan X (Pascal) AMD Ryzen 9 7900X 4.7GHz
Titan X Pascal
58 [X] Nvidia Titan X (Pascal) AMD Ryzen 9 7950X 4.5GHz
Titan X Pascal
~ 57 fps
+ Compare
- Hide Comparison
...
NVIDIA GeForce GTX 1660 Ti (Desktop)
AMD Radeon RX 5700 (Desktop)
NVIDIA GeForce RTX 2060 Super (Desktop)
NVIDIA GeForce RTX 3060
AMD Radeon RX 6650 XT
...
41 [X] Nvidia Titan X (Pascal) AMD Ryzen 9 5900X 3.7GHz
Titan X Pascal
41 [X] Nvidia Titan X (Pascal) AMD Ryzen 9 7900X 4.7GHz
Titan X Pascal
42 [X] Nvidia Titan X (Pascal) AMD Ryzen 9 7950X 4.5GHz
Titan X Pascal
~ 41 fps
+ Compare
- Hide Comparison
...
NVIDIA GeForce GTX 1660 Ti (Desktop)
AMD Radeon RX 5700 (Desktop)
NVIDIA GeForce RTX 2060 Super (Desktop)
AMD Radeon RX 5700 XT (Desktop)
NVIDIA GeForce RTX 3060
AMD Radeon RX 6650 XT
...
» With all tested laptops playable in detail settings ultra.
Additional Benchmarks
Low Preset 1920x1080
135 [X] Nvidia Titan X (Pascal) AMD Ryzen 9 5900X 3.7GHz
Titan X Pascal
148 [X] Nvidia Titan X (Pascal) AMD Ryzen 9 7950X 4.5GHz
Titan X Pascal
...
AMD Radeon RX 5600 XT (Desktop)
AMD Radeon RX 5700 (Desktop)
NVIDIA GeForce GTX 1650 Super (Desktop)
NVIDIA GeForce GTX 1660 (Desktop)
NVIDIA GeForce GTX 1660 Super (Desktop)
AMD Radeon RX 5700 XT (Desktop)
NVIDIA GeForce GTX 1660 Ti (Desktop)
NVIDIA GeForce RTX 3060 Ti
NVIDIA GeForce RTX 2060 Super (Desktop)
NVIDIA GeForce RTX 3060
NVIDIA Titan RTX
...
0 100 200 300 400 500 600 700 800 900 1000 1100 1200 Tooltip
...
NVIDIA GeForce GTX 1660 Ti (Desktop)
NVIDIA GeForce RTX 3060 Ti
AMD Radeon RX 5600 XT (Desktop)
NVIDIA GeForce RTX 2060 Super (Desktop)
AMD Radeon RX 5700 (Desktop)
NVIDIA GeForce RTX 3060
AMD Radeon RX 5700 XT (Desktop)
NVIDIA Titan RTX
...
...
NVIDIA GeForce GTX 1650 Super (Desktop)
NVIDIA GeForce RTX 2060 Super (Desktop)
AMD Radeon RX 5600 XT (Desktop)
NVIDIA GeForce RTX 3060
AMD Radeon RX 5700 (Desktop)
AMD Radeon RX 5700 XT (Desktop)
NVIDIA GeForce RTX 3060 Ti
NVIDIA Titan RTX
AMD Radeon RX 6700 XT
...
NVIDIA GeForce GTX 1050 Ti Mobile
...
NVIDIA GeForce RTX 2060 Super (Desktop)
AMD Radeon RX 5600 XT (Desktop)
NVIDIA GeForce RTX 3060
AMD Radeon RX 6700 XT
AMD Radeon RX 5700 (Desktop)
AMD Radeon RX 5700 XT (Desktop)
NVIDIA GeForce RTX 3060 Ti
NVIDIA Titan RTX
...
...
AMD Radeon RX 5600 XT (Desktop)
NVIDIA GeForce RTX 2060 Super (Desktop)
NVIDIA GeForce RTX 3060
AMD Radeon RX 5700 (Desktop)
AMD Radeon RX 5700 XT (Desktop)
AMD Radeon RX 6700 XT
NVIDIA GeForce RTX 3060 Ti
NVIDIA Titan RTX
...
...
NVIDIA GeForce RTX 2060 Super (Desktop)
AMD Radeon RX 5700 (Desktop)
NVIDIA GeForce RTX 3060
AMD Radeon RX 5700 XT (Desktop)
NVIDIA GeForce GTX 1650 Super (Desktop)
NVIDIA Titan RTX
NVIDIA GeForce RTX 3060 Ti
...
» With all tested laptops playable in detail settings ultra.
Additional Benchmarks
Low Preset 1920x1080
78.3 [X] Nvidia Titan X (Pascal) AMD Ryzen 9 5900X 3.7GHz
Titan X Pascal
...
AMD Radeon RX 6750 XT
NVIDIA GeForce GTX 1660 (Desktop)
NVIDIA GeForce GTX 1660 Super (Desktop)
NVIDIA GeForce GTX 1660 Ti (Desktop)
NVIDIA GeForce RTX 2060 Super (Desktop)
NVIDIA GeForce RTX 3060
...
...
AMD Radeon RX 5600 XT (Desktop)
NVIDIA GeForce RTX 2060 Super (Desktop)
AMD Radeon RX 5700 (Desktop)
AMD Radeon RX 5700 XT (Desktop)
AMD Radeon RX 6700 XT
AMD Radeon RX 6650 XT
AMD Radeon RX 6750 XT
...
...
AMD Radeon RX 5600 XT (Desktop)
NVIDIA GeForce RTX 2060 Super (Desktop)
NVIDIA GeForce RTX 3060
AMD Radeon RX 5700 XT (Desktop)
AMD Radeon RX 6650 XT
AMD Radeon RX 6700 XT
...
...
AMD Radeon RX 5600 XT (Desktop)
NVIDIA GeForce RTX 2060 Super (Desktop)
AMD Radeon RX 5700 (Desktop)
AMD Radeon RX 5700 XT (Desktop)
AMD Radeon RX 6650 XT
NVIDIA GeForce RTX 3060 Ti
...
...
NVIDIA GeForce RTX 3060
NVIDIA GeForce RTX 2060 Super (Desktop)
AMD Radeon RX 5700 (Desktop)
AMD Radeon RX 5700 XT (Desktop)
AMD Radeon RX 6650 XT
NVIDIA GeForce RTX 3060 Ti
...
...
AMD Radeon RX 5700 (Desktop)
AMD Radeon RX 6650 XT
NVIDIA GeForce RTX 2060 Super (Desktop)
NVIDIA GeForce RTX 3060
AMD Radeon RX 5700 XT (Desktop)
NVIDIA GeForce RTX 3060 Ti
AMD Radeon RX 6700 XT
AMD Radeon RX 6750 XT
...
» With all tested laptops playable in detail settings ultra.
Additional Benchmarks
Low Preset 1920x1080
143 [X] Nvidia Titan X (Pascal) AMD Ryzen 9 5900X 3.7GHz
Titan X Pascal
min:
119 fps, max:
179 fps
...
NVIDIA GeForce GTX 1660 (Desktop)
NVIDIA GeForce GTX 1660 Super (Desktop)
NVIDIA GeForce RTX 2060 Super (Desktop)
AMD Radeon RX 6700 XT
NVIDIA GeForce RTX 3060
...
...
AMD Radeon RX 5700 (Desktop)
AMD Radeon RX 5600 XT (Desktop)
NVIDIA GeForce GTX 1660 Super (Desktop)
AMD Radeon RX 5700 XT (Desktop)
...
...
NVIDIA GeForce GTX 1660 Super (Desktop)
AMD Radeon RX 5700 (Desktop)
AMD Radeon RX 5600 XT (Desktop)
AMD Radeon RX 5700 XT (Desktop)
...
AMD Radeon RX 560X (Laptop)
...
AMD Radeon RX 5700 XT (Desktop)
...
...
AMD Radeon RX 5700 (Desktop)
AMD Radeon RX 5600 XT (Desktop)
AMD Radeon RX 5700 XT (Desktop)
NVIDIA GeForce RTX 2060 Super (Desktop)
NVIDIA GeForce RTX 3060
AMD Radeon RX 6650 XT
...
...
AMD Radeon RX 5700 (Desktop)
AMD Radeon RX 5700 XT (Desktop)
NVIDIA GeForce RTX 2060 Super (Desktop)
AMD Radeon RX 6650 XT
AMD Radeon RX 6700 XT
...
» With all tested laptops playable in detail settings ultra.
Additional Benchmarks
Low Preset 1920x1080
114 [X] Nvidia Titan X (Pascal) AMD Ryzen 9 5900X 3.7GHz
Titan X Pascal
Ultra Preset + Ultra Ray-Tracing 1920x1080
25 [X] Nvidia Titan X (Pascal) AMD Ryzen 9 5900X 3.7GHz
Titan X Pascal
...
AMD Radeon RX 5700 (Desktop)
NVIDIA GeForce RTX 2060 Super (Desktop)
NVIDIA GeForce RTX 3060
AMD Radeon RX 5700 XT (Desktop)
AMD Radeon RX 6700 XT
...
...
NVIDIA GeForce RTX 2060 Super (Desktop)
AMD Radeon RX 5700 XT (Desktop)
AMD Radeon RX 6700 XT
...
0 100 200 Tooltip : Ø181.3 (140.032-238.31)
Intel UHD Graphics Xe G4 48EUs
...
NVIDIA GeForce RTX 2060 Super (Desktop)
AMD Radeon RX 5700 XT (Desktop)
NVIDIA GeForce RTX 3060
AMD Radeon RX 6700 XT
...
...
AMD Radeon RX 5700 (Desktop)
NVIDIA GeForce RTX 2060 Super (Desktop)
AMD Radeon RX 5700 XT (Desktop)
NVIDIA GeForce RTX 3060
AMD Radeon RX 6700 XT
...
...
AMD Radeon RX 5700 (Desktop)
NVIDIA GeForce RTX 2060 Super (Desktop)
NVIDIA GeForce RTX 3060
AMD Radeon RX 5700 XT (Desktop)
AMD Radeon RX 6700 XT
NVIDIA Titan RTX
...
» With all tested laptops playable in detail settings ultra.
Additional Benchmarks
Low Preset (DX12) 1920x1080
292 [X] Nvidia Titan X (Pascal) AMD Ryzen 9 5900X 3.7GHz
Titan X Pascal
min:
31.1 fps, P0.1:
57.3 fps, P1:
162 fps, max:
604 fps
132 [X] Nvidia Titan X (Pascal) AMD Ryzen 9 5900X 3.7GHz
Titan X Pascal
min:
111 fps, max:
177 fps
154.8 [X] Nvidia Titan X (Pascal) AMD Ryzen 9 7900X 4.7GHz
Titan X Pascal
min:
118 fps, max:
214 fps
154.9 [X] Nvidia Titan X (Pascal) AMD Ryzen 9 7950X 4.5GHz
Titan X Pascal
min:
117 fps, max:
215 fps
~ 147 fps
+ Compare
- Hide Comparison
+ 📈 Graph
- 📈 Hide Graph
0 100 200 Tooltip : Ø132.2 (111-177)
: Ø154.8 (118-214)
: Ø154.9 (117-215)
...
NVIDIA GeForce RTX 3060
NVIDIA GeForce RTX 3060 Ti
NVIDIA GeForce GTX 1650 Super (Desktop)
NVIDIA GeForce GTX 1660 (Desktop)
NVIDIA GeForce GTX 1660 Ti (Desktop)
...
0 100 Tooltip : Ø100.6 (83-122)
: Ø104.1 (81-126)
: Ø104.9 (84-131)
...
NVIDIA GeForce GTX 1660 Ti (Desktop)
NVIDIA GeForce GTX 1660 Super (Desktop)
NVIDIA GeForce RTX 3060 Ti
NVIDIA GeForce RTX 3060
...
84.7 [X] Nvidia Titan X (Pascal) AMD Ryzen 9 5900X 3.7GHz
Titan X Pascal
min:
65 fps, max:
104 fps
87.4 [X] Nvidia Titan X (Pascal) AMD Ryzen 9 7900X 4.7GHz
Titan X Pascal
min:
66 fps, max:
111 fps
88.8 [X] Nvidia Titan X (Pascal) AMD Ryzen 9 7950X 4.5GHz
Titan X Pascal
min:
66 fps, max:
113 fps
~ 87 fps
+ Compare
- Hide Comparison
+ 📈 Graph
- 📈 Hide Graph
0 100 Tooltip : Ø84.7 (65-104)
: Ø87.4 (66-111)
: Ø88.8 (66-113)
Intel UHD Graphics Xe 32EUs (Tiger Lake-H)
...
NVIDIA GeForce GTX 1660 (Desktop)
NVIDIA GeForce GTX 1660 Ti (Desktop)
NVIDIA GeForce GTX 1660 Super (Desktop)
NVIDIA GeForce RTX 3060 Ti
...
76.1 [X] Nvidia Titan X (Pascal) AMD Ryzen 9 7900X 4.7GHz
Titan X Pascal
min:
55 fps, max:
101 fps
77.2 [X] Nvidia Titan X (Pascal) AMD Ryzen 9 5900X 3.7GHz
Titan X Pascal
min:
57 fps, max:
102 fps
78.4 [X] Nvidia Titan X (Pascal) AMD Ryzen 9 7950X 4.5GHz
Titan X Pascal
min:
56 fps, max:
105 fps
~ 77 fps
+ Compare
- Hide Comparison
+ 📈 Graph
- 📈 Hide Graph
0 100 Tooltip : Ø76.1 (55-101)
: Ø77.2 (57-102)
: Ø78.4 (56-105)
...
NVIDIA GeForce GTX 1660 Super (Desktop)
NVIDIA GeForce RTX 3060 Ti
AMD Radeon RX 5600 XT (Desktop)
...
0 Tooltip : Ø59.9 (46-71)
: Ø60.6 (46-71)
: Ø61.1 (48-71)
...
AMD Radeon RX 5600 XT (Desktop)
NVIDIA GeForce RTX 3060 Ti
AMD Radeon RX 5700 (Desktop)
NVIDIA GeForce RTX 2060 Super (Desktop)
...
37.7 [X] Nvidia Titan X (Pascal) AMD Ryzen 9 7900X 4.7GHz
Titan X Pascal
min:
32 fps, max:
42 fps
39 [X] Nvidia Titan X (Pascal) AMD Ryzen 9 7950X 4.5GHz
Titan X Pascal
min:
33 fps, max:
43 fps
39.6 [X] Nvidia Titan X (Pascal) AMD Ryzen 9 5900X 3.7GHz
Titan X Pascal
min:
33 fps, max:
43 fps
~ 39 fps
+ Compare
- Hide Comparison
+ 📈 Graph
- 📈 Hide Graph
0 Tooltip : Ø37.7 (32-42)
: Ø39 (33-43)
: Ø39.6 (33-43)
NVIDIA GeForce GTX 1660 Ti (Desktop)
...
AMD Radeon RX 5700 (Desktop)
AMD Radeon RX 5700 XT (Desktop)
NVIDIA GeForce RTX 3060
AMD Radeon RX 6750 XT
...
» With all tested laptops playable in detail settings ultra.
Additional Benchmarks
Low Graphics Quality 1920x1080
121 [X] Nvidia Titan X (Pascal) AMD Ryzen 9 5900X 3.7GHz
Titan X Pascal
min:
96 fps, max:
151 fps
125.8 [X] Nvidia Titan X (Pascal) AMD Ryzen 9 7950X 4.5GHz
Titan X Pascal
min:
97 fps, max:
157 fps
...
NVIDIA GeForce GTX 1650 Super (Desktop)
NVIDIA GeForce GTX 1660 (Desktop)
NVIDIA Titan RTX
NVIDIA GeForce RTX 2060 Super (Desktop)
AMD Radeon RX 6700 XT
AMD Radeon RX 5700 XT (Desktop)
AMD Radeon RX 5600 XT (Desktop)
NVIDIA GeForce RTX 3060
NVIDIA GeForce GTX 1660 Super (Desktop)
...
...
NVIDIA GeForce GTX 1650 Super (Desktop)
NVIDIA GeForce GTX 1660 (Desktop)
NVIDIA Titan RTX
AMD Radeon RX 6700 XT
NVIDIA GeForce RTX 2060 Super (Desktop)
AMD Radeon RX 5700 XT (Desktop)
NVIDIA GeForce RTX 3060
AMD Radeon RX 5600 XT (Desktop)
...
...
NVIDIA GeForce GTX 1650 Super (Desktop)
NVIDIA GeForce GTX 1660 (Desktop)
NVIDIA Titan RTX
AMD Radeon RX 5700 XT (Desktop)
AMD Radeon RX 6700 XT
AMD Radeon RX 5600 XT (Desktop)
NVIDIA GeForce RTX 2060 Super (Desktop)
NVIDIA GeForce GTX 1660 Super (Desktop)
AMD Radeon RX 5700 (Desktop)
NVIDIA GeForce RTX 3060
...
...
NVIDIA GeForce GTX 1660 Super (Desktop)
AMD Radeon RX 5600 XT (Desktop)
AMD Radeon RX 5700 (Desktop)
AMD Radeon RX 5700 XT (Desktop)
NVIDIA GeForce RTX 2060 Super (Desktop)
AMD Radeon RX 6700 XT
NVIDIA GeForce RTX 3060
NVIDIA Titan RTX
» With all tested laptops playable in detail settings high.
Additional Benchmarks
Low Preset 1920x1080
95.4 [X] Nvidia Titan X (Pascal) AMD Ryzen 9 5900X 3.7GHz
Titan X Pascal
min:
20.6 fps, P0.1:
42.1 fps, P1:
72.7 fps, max:
209 fps
...
NVIDIA GeForce RTX 3060
NVIDIA GeForce RTX 2060 Super (Desktop)
NVIDIA GeForce RTX 3060 Ti
NVIDIA Titan RTX
0 100 Tooltip : Ø130.2 (100.597-179.79)
...
AMD Radeon RX 6750 XT
NVIDIA GeForce RTX 2060 Super (Desktop)
NVIDIA GeForce RTX 3060
AMD Radeon RX 6650 XT
NVIDIA GeForce RTX 3060 Ti
NVIDIA Titan RTX
...
AMD Radeon RX 6750 XT
AMD Radeon RX 6700 XT
NVIDIA GeForce RTX 2060 Super (Desktop)
NVIDIA GeForce RTX 3060
AMD Radeon RX 6650 XT
NVIDIA GeForce RTX 3060 Ti
NVIDIA Titan RTX
0 100 Tooltip : Ø107.3 (80.837-145.606)
...
NVIDIA GeForce RTX 2060 Super (Desktop)
AMD Radeon RX 6700 XT
NVIDIA GeForce RTX 3060
AMD Radeon RX 6650 XT
AMD Radeon RX 6750 XT
NVIDIA GeForce RTX 3060 Ti
NVIDIA Titan RTX
...
...
AMD Radeon RX 5700 XT (Desktop)
NVIDIA GeForce RTX 2060 Super (Desktop)
AMD Radeon RX 6650 XT
NVIDIA GeForce RTX 3060
NVIDIA GeForce RTX 3060 Ti
AMD Radeon RX 6700 XT
AMD Radeon RX 6750 XT
...
...
NVIDIA GeForce RTX 2060 Super (Desktop)
AMD Radeon RX 6650 XT
NVIDIA GeForce RTX 3060
AMD Radeon RX 6700 XT
NVIDIA GeForce RTX 3060 Ti
AMD Radeon RX 6750 XT
...
» With all tested laptops playable in detail settings ultra.
Additional Benchmarks
Low Video Quality 1920x1080
161 [X] Nvidia Titan X (Pascal) AMD Ryzen 9 5900X 3.7GHz
Titan X Pascal
min:
61.8 fps, P0.1:
80.9 fps, P1:
107 fps, max:
328 fps
...
NVIDIA GeForce GTX 1650 Super (Desktop)
NVIDIA GeForce GTX 1660 (Desktop)
NVIDIA GeForce RTX 2060 Super (Desktop)
NVIDIA Titan RTX
NVIDIA GeForce GTX 1660 Super (Desktop)
AMD Radeon RX 5700 XT (Desktop)
AMD Radeon RX 5700 (Desktop)
AMD Radeon RX 6700 XT
...
AMD Radeon RX 5600 XT (Desktop)
...
NVIDIA GeForce RTX 2060 Super (Desktop)
AMD Radeon RX 5600 XT (Desktop)
NVIDIA GeForce RTX 3060
AMD Radeon RX 5700 (Desktop)
AMD Radeon RX 5700 XT (Desktop)
...
...
NVIDIA GeForce RTX 2060 Super (Desktop)
NVIDIA GeForce RTX 3060
AMD Radeon RX 5700 (Desktop)
AMD Radeon RX 5700 XT (Desktop)
AMD Radeon RX 6700 XT
...
...
NVIDIA GeForce RTX 2060 Super (Desktop)
AMD Radeon RX 5700 XT (Desktop)
NVIDIA GeForce RTX 3060
AMD Radeon RX 6700 XT
...
...
AMD Radeon RX 5700 (Desktop)
NVIDIA GeForce RTX 2060 Super (Desktop)
AMD Radeon RX 5700 XT (Desktop)
NVIDIA GeForce RTX 3060
AMD Radeon RX 6700 XT
NVIDIA Titan RTX
...
...
AMD Radeon RX 5700 (Desktop)
AMD Radeon RX 5700 XT (Desktop)
NVIDIA GeForce RTX 2060 Super (Desktop)
NVIDIA GeForce RTX 3060
AMD Radeon RX 6700 XT
NVIDIA Titan RTX
» With all tested laptops playable in detail settings ultra.
Additional Benchmarks
Low Preset 1920x1080
120 [X] Nvidia Titan X (Pascal) AMD Ryzen 9 5900X 3.7GHz
Titan X Pascal
min:
65.1 fps, P0.1:
79.7 fps, P1:
95.5 fps, max:
159 fps
391 [X] Nvidia Titan X (Pascal) 874931
AMD Ryzen 9 7900X 4.7GHz
Titan X Pascal
min:
281 fps, P1:
257 fps, max:
445 fps
428 [X] Nvidia Titan X (Pascal) 831795
AMD Ryzen 9 5900X 3.7GHz
Titan X Pascal
min:
322 fps, P1:
277 fps, max:
466 fps
575 [X] Nvidia Titan X (Pascal) 874931
AMD Ryzen 9 7950X 4.5GHz
Titan X Pascal
min:
459 fps, P1:
374 fps, max:
669 fps
~ 465 fps
+ Compare
- Hide Comparison
...
AMD Radeon RX Vega 64
NVIDIA GeForce GTX 1660 Super (Desktop)
NVIDIA GeForce GTX 1660 Ti (Desktop)
NVIDIA GeForce RTX 2060 Super (Desktop)
AMD Radeon RX 5600 XT (Desktop)
NVIDIA Titan RTX
AMD Radeon RX 5700 (Desktop)
...
286 [X] Nvidia Titan X (Pascal) 831795
AMD Ryzen 9 5900X 3.7GHz
Titan X Pascal
min:
240 fps, P1:
212 fps, max:
322 fps
297 [X] Nvidia Titan X (Pascal) 874931
AMD Ryzen 9 7900X 4.7GHz
Titan X Pascal
min:
243 fps, P1:
218 fps, max:
331 fps
307 [X] Nvidia Titan X (Pascal) 874931
AMD Ryzen 9 7950X 4.5GHz
Titan X Pascal
min:
264 fps, P1:
240 fps, max:
344 fps
~ 297 fps
+ Compare
- Hide Comparison
...
NVIDIA GeForce RTX 2080 (Desktop)
AMD Radeon RX 5600 XT (Desktop)
AMD Radeon RX 5700 (Desktop)
4x NVIDIA RTX A6000
NVIDIA RTX A6000
...
225 [X] Nvidia Titan X (Pascal) 831795
AMD Ryzen 9 5900X 3.7GHz
Titan X Pascal
min:
193 fps, P1:
138 fps, max:
252 fps
235 [X] Nvidia Titan X (Pascal) 874931
AMD Ryzen 9 7900X 4.7GHz
Titan X Pascal
min:
203 fps, P1:
145 fps, max:
259 fps
240 [X] Nvidia Titan X (Pascal) 874931
AMD Ryzen 9 7950X 4.5GHz
Titan X Pascal
min:
211 fps, P1:
174 fps, max:
266 fps
~ 233 fps
+ Compare
- Hide Comparison
...
NVIDIA GeForce RTX 2060 Super (Desktop)
AMD Radeon RX 5600 XT (Desktop)
NVIDIA GeForce RTX 2080 (Desktop)
AMD Radeon RX 5700 (Desktop)
...
158 [X] Nvidia Titan X (Pascal) 831795
AMD Ryzen 9 5900X 3.7GHz
Titan X Pascal
min:
128 fps, P1:
127 fps, max:
179 fps
159.9 [X] Nvidia Titan X (Pascal) 874931
AMD Ryzen 9 7900X 4.7GHz
Titan X Pascal
min:
136 fps, P1:
135 fps, max:
185 fps
161.2 [X] Nvidia Titan X (Pascal) 874931
AMD Ryzen 9 7950X 4.5GHz
Titan X Pascal
min:
138 fps, P1:
138 fps, max:
185 fps
~ 160 fps
+ Compare
- Hide Comparison
...
AMD Radeon RX 5600 XT (Desktop)
AMD Radeon RX 6700 XT
AMD Radeon RX 6750 XT
AMD Radeon RX 5700 (Desktop)
4x NVIDIA RTX A6000
NVIDIA RTX A6000
NVIDIA Titan RTX
AMD Radeon RX 5700 XT (Desktop)
NVIDIA GeForce RTX 3070 Ti
...
123.2 [X] Nvidia Titan X (Pascal) 874931
AMD Ryzen 9 7900X 4.7GHz
Titan X Pascal
min:
106 fps, P1:
106 fps, max:
137 fps
124 [X] Nvidia Titan X (Pascal) 831795
AMD Ryzen 9 5900X 3.7GHz
Titan X Pascal
min:
104 fps, P1:
102 fps, max:
139 fps
125.2 [X] Nvidia Titan X (Pascal) 874931
AMD Ryzen 9 7950X 4.5GHz
Titan X Pascal
min:
109 fps, P1:
108 fps, max:
140 fps
~ 124 fps
+ Compare
- Hide Comparison
...
AMD Radeon RX 6700 XT
AMD Radeon RX 5600 XT (Desktop)
AMD Radeon RX 6750 XT
AMD Radeon RX 5700 (Desktop)
NVIDIA Titan RTX
AMD Radeon RX 5700 XT (Desktop)
NVIDIA GeForce RTX 3070 Ti
4x NVIDIA RTX A6000
...
75.2 [X] Nvidia Titan X (Pascal) 874931
AMD Ryzen 9 7900X 4.7GHz
Titan X Pascal
min:
65 fps, P1:
64 fps, max:
84 fps
76 [X] Nvidia Titan X (Pascal) 874931
AMD Ryzen 9 7950X 4.5GHz
Titan X Pascal
min:
66 fps, P1:
65 fps, max:
86 fps
77.4 [X] Nvidia Titan X (Pascal) 831795
AMD Ryzen 9 5900X 3.7GHz
Titan X Pascal
min:
66 fps, P1:
65 fps, max:
86 fps
~ 76 fps
+ Compare
- Hide Comparison
...
AMD Radeon RX 5700 (Desktop)
NVIDIA Titan RTX
NVIDIA GeForce RTX 3070 Ti
AMD Radeon RX 5700 XT (Desktop)
4x NVIDIA RTX A6000
NVIDIA RTX A6000
...
» With all tested laptops playable in detail settings ultra.
...
AMD Radeon RX 6700 XT
...
...
AMD Radeon RX 5700 XT (Desktop)
NVIDIA GeForce GTX 1660 Super (Desktop)
...
...
AMD Radeon RX Vega 64
NVIDIA GeForce GTX 1650 Super (Desktop)
NVIDIA GeForce GTX 1660 (Desktop)
...
Intel UHD Graphics Xe 32EUs (Tiger Lake-H)
...
NVIDIA GeForce GTX 1650 Super (Desktop)
NVIDIA GeForce GTX 1660 (Desktop)
NVIDIA GeForce GTX 1660 Super (Desktop)
AMD Radeon RX 5700 XT (Desktop)
AMD Radeon RX Vega 64
NVIDIA GeForce RTX 2060 Super (Desktop)
...
Intel UHD Graphics Xe 32EUs (Tiger Lake-H)
...
AMD Radeon RX 5700 (Desktop)
NVIDIA GeForce RTX 2060 Super (Desktop)
AMD Radeon RX 5700 XT (Desktop)
NVIDIA GeForce RTX 3060
AMD Radeon RX 6700 XT
NVIDIA Titan RTX
...
» With all tested laptops playable in detail settings high.
Additional Benchmarks
Low Preset 1920x1080
144 [X] Nvidia Titan X (Pascal) AMD Ryzen 9 5900X 3.7GHz
Titan X Pascal
...
NVIDIA GeForce GTX 1660 Ti (Desktop)
AMD Radeon RX 5600 XT (Desktop)
AMD Radeon RX 5700 (Desktop)
AMD Radeon RX Vega 64
NVIDIA Titan RTX
NVIDIA GeForce RTX 2060 Super (Desktop)
NVIDIA GeForce RTX 3060 Ti
NVIDIA GeForce RTX 3060
...
AMD Radeon RX 5600 XT (Desktop)
AMD Radeon RX 5700 (Desktop)
NVIDIA GeForce RTX 2060 Super (Desktop)
NVIDIA GeForce RTX 3060
AMD Radeon RX 5700 XT (Desktop)
NVIDIA GeForce RTX 2080 (Desktop)
AMD Radeon RX 6700 XT
...
Intel UHD Graphics Xe 32EUs (Tiger Lake-H)
...
AMD Radeon RX 5600 XT (Desktop)
AMD Radeon RX 5700 (Desktop)
NVIDIA GeForce RTX 2060 Super (Desktop)
NVIDIA GeForce RTX 3060
AMD Radeon RX 5700 XT (Desktop)
NVIDIA GeForce RTX 2080 (Desktop)
AMD Radeon RX 6700 XT
NVIDIA GeForce RTX 3060 Ti
...
...
NVIDIA GeForce RTX 2060 Super (Desktop)
NVIDIA GeForce RTX 3060
AMD Radeon RX 5700 XT (Desktop)
AMD Radeon RX 6700 XT
NVIDIA GeForce RTX 3060 Ti
NVIDIA GeForce RTX 2080 (Desktop)
...
0 100 200 300 400 500 600 700 800 900 1000 1100 1200 1300 1400 Tooltip
...
AMD Radeon RX 5700 (Desktop)
NVIDIA GeForce RTX 2060 Super (Desktop)
NVIDIA GeForce RTX 3060
AMD Radeon RX 5700 XT (Desktop)
NVIDIA GeForce RTX 3060 Ti
NVIDIA GeForce RTX 2080 (Desktop)
...
...
AMD Radeon RX 5700 (Desktop)
AMD Radeon RX 5700 XT (Desktop)
NVIDIA GeForce RTX 2060 Super (Desktop)
NVIDIA GeForce RTX 3060
NVIDIA GeForce RTX 3060 Ti
NVIDIA GeForce RTX 2080 (Desktop)
NVIDIA Titan RTX
...
AMD Radeon RX Vega 64
» With all tested laptops playable in detail settings ultra.
Additional Benchmarks
Low Preset 1920x1080
167 [X] Nvidia Titan X (Pascal) AMD Ryzen 9 5900X 3.7GHz
Titan X Pascal
min:
31.8 fps, P0.1:
47.8 fps, P1:
79.5 fps, max:
432 fps
...
AMD Radeon RX 6700 XT
AMD Radeon 680M
AMD Radeon RX Vega 64
NVIDIA GeForce RTX 2060 Super (Desktop)
AMD Radeon RX 5700 XT (Desktop)
NVIDIA GeForce GTX 1650 Super (Desktop)
AMD Radeon RX 5700 (Desktop)
NVIDIA GeForce GTX 1660 (Desktop)
...
0 100 Tooltip : Ø115.9 (74.329-167.568)
...
AMD Radeon RX 5600 XT (Desktop)
NVIDIA GeForce GTX 1660 Super (Desktop)
NVIDIA GeForce GTX 1660 (Desktop)
NVIDIA GeForce RTX 3060
NVIDIA GeForce RTX 2080 (Desktop)
...
AMD Radeon RX 5600 XT (Desktop)
AMD Radeon RX 5700 XT (Desktop)
NVIDIA GeForce GTX 1660 Super (Desktop)
AMD Radeon RX Vega 64
NVIDIA Titan RTX
NVIDIA GeForce RTX 3060
NVIDIA GeForce RTX 2080 (Desktop)
» With all tested laptops playable in detail settings ultra.
...
NVIDIA GeForce GTX 1650 Super (Desktop)
NVIDIA GeForce GTX 1660 (Desktop)
NVIDIA GeForce GTX 1660 Super (Desktop)
NVIDIA Titan RTX
AMD Radeon RX 5600 XT (Desktop)
AMD Radeon RX 5700 (Desktop)
AMD Radeon RX 5700 XT (Desktop)
AMD Radeon RX 6700 XT
NVIDIA GeForce RTX 2060 Super (Desktop)
AMD Radeon RX Vega 64
...
NVIDIA GeForce RTX 3060
...
NVIDIA GeForce GTX 1660 Super (Desktop)
AMD Radeon RX Vega 64
AMD Radeon RX 5600 XT (Desktop)
AMD Radeon RX 5700 (Desktop)
NVIDIA GeForce RTX 2060 Super (Desktop)
NVIDIA GeForce RTX 3060
NVIDIA GeForce RTX 2080 (Desktop)
...
AMD Radeon RX 6700 XT
0 100 200 Tooltip : Ø164.5 (137.127-202.029)
...
AMD Radeon RX Vega 64
AMD Radeon RX 5600 XT (Desktop)
NVIDIA GeForce RTX 2060 Super (Desktop)
AMD Radeon RX 5700 (Desktop)
NVIDIA GeForce RTX 3060
NVIDIA GeForce RTX 2080 (Desktop)
...
AMD Radeon RX 6700 XT
...
AMD Radeon RX Vega 64
AMD Radeon RX 5600 XT (Desktop)
NVIDIA GeForce RTX 2060 Super (Desktop)
AMD Radeon RX 5700 (Desktop)
NVIDIA GeForce RTX 3060
...
...
AMD Radeon RX 5600 XT (Desktop)
AMD Radeon RX Vega 64
NVIDIA GeForce RTX 2060 Super (Desktop)
AMD Radeon RX 5700 (Desktop)
NVIDIA GeForce RTX 3060
AMD Radeon RX 5700 XT (Desktop)
NVIDIA GeForce RTX 2080 (Desktop)
...
...
NVIDIA GeForce GTX 1660 Super (Desktop)
NVIDIA GeForce RTX 2060 Super (Desktop)
AMD Radeon RX Vega 64
AMD Radeon RX 5700 (Desktop)
NVIDIA GeForce RTX 3060
AMD Radeon RX 5700 XT (Desktop)
NVIDIA GeForce RTX 2080 (Desktop)
...
» With all tested laptops playable in detail settings ultra.
Additional Benchmarks
Prioritize Performance Preset 1920x1080
235 [X] Nvidia Titan X (Pascal) AMD Ryzen 9 5900X 3.7GHz
Titan X Pascal
min:
86 fps, P0.1:
155 fps, P1:
179 fps, max:
298 fps
...
AMD Radeon 680M
NVIDIA GeForce RTX 2060 Super (Desktop)
NVIDIA GeForce RTX 3060
NVIDIA Titan RTX
AMD Radeon RX 5600 XT (Desktop)
AMD Radeon RX 5700 (Desktop)
AMD Radeon RX Vega 64
NVIDIA GeForce GTX 1650 Super (Desktop)
...
AMD Radeon RX 6700 XT
...
NVIDIA GeForce RTX 2080 (Desktop)
AMD Radeon RX Vega 64
AMD Radeon RX 5600 XT (Desktop)
NVIDIA GeForce RTX 2060 Super (Desktop)
AMD Radeon RX 5700 (Desktop)
NVIDIA GeForce RTX 3060
AMD Radeon RX 5700 XT (Desktop)
NVIDIA Titan RTX
...
AMD Radeon RX 6700 XT
0 100 Tooltip : Ø125.7 (91.877-167.012)
AMD Radeon RX Vega 6 (Ryzen 2000/3000)
...
AMD Radeon RX Vega 64
AMD Radeon RX 5600 XT (Desktop)
NVIDIA GeForce RTX 2060 Super (Desktop)
AMD Radeon RX 5700 (Desktop)
NVIDIA GeForce RTX 2080 (Desktop)
...
NVIDIA Titan RTX
...
AMD Radeon RX 5700 (Desktop)
NVIDIA GeForce RTX 3060
AMD Radeon RX 5700 XT (Desktop)
NVIDIA GeForce RTX 2080 (Desktop)
AMD Radeon RX 6700 XT
...
NVIDIA Titan RTX
...
AMD Radeon RX 5600 XT (Desktop)
NVIDIA GeForce RTX 2060 Super (Desktop)
AMD Radeon RX 5700 (Desktop)
NVIDIA GeForce RTX 3060
AMD Radeon RX 5700 XT (Desktop)
NVIDIA GeForce RTX 2080 (Desktop)
AMD Radeon RX 6700 XT
...
...
AMD Radeon RX 5700 (Desktop)
NVIDIA GeForce RTX 2060 Super (Desktop)
NVIDIA GeForce RTX 3060
AMD Radeon RX 5700 XT (Desktop)
NVIDIA GeForce RTX 2080 (Desktop)
AMD Radeon RX 6700 XT
NVIDIA Titan RTX
...
» With all tested laptops playable in detail settings ultra.
Additional Benchmarks
Low Preset 1920x1080
144 [X] Nvidia Titan X (Pascal) AMD Ryzen 9 5900X 3.7GHz
Titan X Pascal
min:
20 fps, P0.1:
35.8 fps, P1:
79.1 fps, max:
241 fps
...
NVIDIA GeForce RTX 2060 Super (Desktop)
NVIDIA GeForce GTX 1660 Super (Desktop)
NVIDIA Titan RTX
AMD Radeon RX Vega 64
AMD Radeon RX 5700 XT (Desktop)
AMD Radeon RX 6700 XT
...
NVIDIA GeForce RTX 2060 Super (Desktop)
AMD Radeon RX 5600 XT (Desktop)
AMD Radeon RX Vega 64
AMD Radeon RX 5700 (Desktop)
NVIDIA GeForce RTX 2080 (Desktop)
AMD Radeon RX 5700 XT (Desktop)
...
...
NVIDIA GeForce RTX 2060 Super (Desktop)
AMD Radeon RX 5600 XT (Desktop)
AMD Radeon RX Vega 64
AMD Radeon RX 5700 (Desktop)
AMD Radeon RX 5700 XT (Desktop)
NVIDIA GeForce RTX 2080 (Desktop)
...
...
AMD Radeon RX 5600 XT (Desktop)
NVIDIA GeForce RTX 2060 Super (Desktop)
AMD Radeon RX 5700 (Desktop)
AMD Radeon RX Vega 64
AMD Radeon RX 5700 XT (Desktop)
...
...
AMD Radeon RX 5600 XT (Desktop)
AMD Radeon RX 5700 (Desktop)
AMD Radeon RX Vega 64
NVIDIA GeForce RTX 2060 Super (Desktop)
AMD Radeon RX 5700 XT (Desktop)
...
...
NVIDIA GeForce GTX 1660 Super (Desktop)
AMD Radeon RX 5600 XT (Desktop)
AMD Radeon RX 5700 (Desktop)
NVIDIA GeForce RTX 2060 Super (Desktop)
AMD Radeon RX 5700 XT (Desktop)
...
» With all tested laptops playable in detail settings ultra.
...
NVIDIA GeForce GTX 1660 Super (Desktop)
NVIDIA Titan RTX
NVIDIA GeForce RTX 2060 Super (Desktop)
AMD Radeon RX 5600 XT (Desktop)
NVIDIA GeForce RTX 2070 Super Max-Q
NVIDIA GeForce RTX 3060 Ti
AMD Radeon RX 5700 (Desktop)
...
AMD Radeon RX 6700 XT
...
NVIDIA GeForce GTX 1080 Mobile
AMD Radeon RX 5600 XT (Desktop)
NVIDIA GeForce RTX 2070 Super Max-Q
AMD Radeon RX Vega 64
AMD Radeon RX 5700 (Desktop)
NVIDIA GeForce RTX 2060 Super (Desktop)
NVIDIA GeForce RTX 3060
AMD Radeon VII
...
...
NVIDIA GeForce GTX 1080 Mobile
AMD Radeon RX Vega 64
AMD Radeon RX 5600 XT (Desktop)
NVIDIA GeForce RTX 2070 Super Max-Q
AMD Radeon RX 5700 (Desktop)
NVIDIA GeForce RTX 2060 Super (Desktop)
AMD Radeon VII
AMD Radeon RX 5700 XT (Desktop)
...
...
NVIDIA GeForce GTX 1080 Mobile
AMD Radeon RX Vega 64
AMD Radeon RX 5600 XT (Desktop)
NVIDIA GeForce RTX 2070 Super Max-Q
AMD Radeon RX 5700 (Desktop)
NVIDIA GeForce RTX 2060 Super (Desktop)
NVIDIA GeForce RTX 3060
...
...
NVIDIA GeForce GTX 1660 Super (Desktop)
NVIDIA GeForce GTX 1080 Mobile
AMD Radeon RX 5600 XT (Desktop)
AMD Radeon RX Vega 64
AMD Radeon RX 5700 (Desktop)
NVIDIA GeForce RTX 3060
NVIDIA GeForce RTX 2060 Super (Desktop)
AMD Radeon RX 5700 XT (Desktop)
AMD Radeon VII
...
...
NVIDIA GeForce GTX 1660 Super (Desktop)
NVIDIA GeForce GTX 1080 Mobile
AMD Radeon RX 5600 XT (Desktop)
AMD Radeon RX Vega 64
AMD Radeon RX 5700 (Desktop)
NVIDIA GeForce RTX 3060
AMD Radeon RX 5700 XT (Desktop)
NVIDIA GeForce RTX 2060 Super (Desktop)
AMD Radeon VII
...
» With all tested laptops playable in detail settings ultra.
Additional Benchmarks
Low Preset 1920x1080
84.3 [X] Nvidia Titan X (Pascal) AMD Ryzen 9 5900X 3.7GHz
Titan X Pascal
min:
21.5 fps, P0.1:
54.8 fps, P1:
67 fps, max:
150 fps
...
NVIDIA GeForce GTX 1660 (Desktop)
AMD Radeon RX Vega 64
NVIDIA GeForce GTX 1660 Super (Desktop)
AMD Radeon VII
NVIDIA Quadro RTX 3000 Max-Q
AMD Radeon RX 5700 (Desktop)
AMD Radeon RX 5600 XT (Desktop)
AMD Radeon RX 5700 XT (Desktop)
NVIDIA GeForce GTX 1650 Super (Desktop)
...
Intel UHD Graphics G1 (Ice Lake 32 EU)
...
NVIDIA Quadro RTX 3000 Max-Q
NVIDIA GeForce GTX 1080 Mobile
AMD Radeon RX Vega 64
NVIDIA GeForce GTX 1650 Super (Desktop)
...
...
NVIDIA Quadro RTX 3000 Max-Q
NVIDIA GeForce GTX 1650 Super (Desktop)
NVIDIA GeForce GTX 1080 Mobile
NVIDIA GeForce RTX 2060 Super (Desktop)
AMD Radeon RX Vega 64
...
...
NVIDIA GeForce RTX 2060 Super (Desktop)
NVIDIA Quadro RTX 3000 Max-Q
NVIDIA GeForce GTX 1650 Super (Desktop)
NVIDIA GeForce GTX 1080 Mobile
NVIDIA Titan RTX
...
...
NVIDIA GeForce GTX 1650 Super (Desktop)
NVIDIA GeForce RTX 2060 Super (Desktop)
NVIDIA GeForce GTX 1080 Mobile
AMD Radeon RX 5600 XT (Desktop)
AMD Radeon RX Vega 64
NVIDIA Titan RTX
...
...
NVIDIA GeForce GTX 1650 Super (Desktop)
NVIDIA GeForce GTX 1080 Mobile
AMD Radeon RX 5600 XT (Desktop)
AMD Radeon RX Vega 64
NVIDIA GeForce RTX 3060
AMD Radeon RX 5700 XT (Desktop)
AMD Radeon VII
...
» With all tested laptops playable in detail settings ultra.
...
AMD Radeon VII
AMD Radeon RX 5700 XT (Desktop)
AMD Radeon RX Vega 64
AMD Radeon 680M
AMD Radeon RX 5600 XT (Desktop)
NVIDIA GeForce RTX 2060 Super (Desktop)
NVIDIA GeForce GTX 1650 Super (Desktop)
NVIDIA GeForce GTX 1660 (Desktop)
NVIDIA GeForce GTX 1660 Super (Desktop)
...
...
AMD Radeon RX 5700 XT (Desktop)
NVIDIA Quadro RTX 3000 Max-Q
NVIDIA GeForce GTX 1080 Mobile
NVIDIA GeForce RTX 2060 Super (Desktop)
NVIDIA GeForce RTX 2060 (Desktop)
NVIDIA GeForce RTX 2070 Super Max-Q
NVIDIA GeForce RTX 2070 Super Mobile
...
Intel UHD Graphics Xe 32EUs (Tiger Lake-H)
...
AMD Radeon RX 5700 XT (Desktop)
NVIDIA GeForce GTX 1080 Mobile
NVIDIA GeForce RTX 2060 (Desktop)
NVIDIA GeForce RTX 2060 Super (Desktop)
NVIDIA GeForce RTX 2070 Super Max-Q
NVIDIA GeForce RTX 2070 Super Mobile
NVIDIA GeForce RTX 3060
...
...
NVIDIA GeForce RTX 2060 (Desktop)
AMD Radeon RX 5700 XT (Desktop)
NVIDIA GeForce RTX 2060 Super (Desktop)
NVIDIA GeForce RTX 2070 Super Max-Q
NVIDIA GeForce RTX 2070 Super Mobile
NVIDIA GeForce RTX 3060
...
...
AMD Radeon RX 5700 (Desktop)
NVIDIA GeForce RTX 2060 Super (Desktop)
AMD Radeon RX 5700 XT (Desktop)
NVIDIA GeForce RTX 2070 Super Mobile
AMD Radeon VII
NVIDIA GeForce RTX 3060
NVIDIA GeForce RTX 2080 (Desktop)
...
...
NVIDIA GeForce RTX 2060 Super (Desktop)
NVIDIA GeForce RTX 2070 Super Mobile
AMD Radeon RX 5700 XT (Desktop)
NVIDIA GeForce RTX 3060
AMD Radeon VII
NVIDIA GeForce RTX 2080 (Desktop)
AMD Radeon RX 6700 XT
...
» With all tested laptops playable in detail settings ultra.
...
NVIDIA GeForce GTX 1650 Super (Desktop)
NVIDIA GeForce GTX 1660 (Desktop)
AMD Radeon RX Vega 64
NVIDIA GeForce GTX 1660 Super (Desktop)
AMD Radeon RX 5700 (Desktop)
NVIDIA GeForce RTX 2070 Super Max-Q
AMD Radeon RX 5600 XT (Desktop)
NVIDIA GeForce RTX 2060 Super (Desktop)
AMD Radeon VII
NVIDIA GeForce RTX 2070 Super Mobile
...
...
NVIDIA GeForce RTX 2070 Super Mobile
AMD Radeon RX Vega 64
AMD Radeon RX 5600 XT (Desktop)
AMD Radeon RX 5700 (Desktop)
NVIDIA GeForce RTX 2060 Super (Desktop)
NVIDIA GeForce RTX 3060
AMD Radeon VII
NVIDIA GeForce RTX 3060 Ti
NVIDIA GeForce RTX 2080 (Desktop)
AMD Radeon RX 5700 XT (Desktop)
...
...
NVIDIA GeForce RTX 2070 Super Max-Q
AMD Radeon RX 5600 XT (Desktop)
AMD Radeon RX Vega 64
NVIDIA GeForce RTX 2060 Super (Desktop)
AMD Radeon RX 5700 (Desktop)
NVIDIA GeForce RTX 2070 Super Mobile
AMD Radeon VII
NVIDIA GeForce RTX 3060
AMD Radeon RX 5700 XT (Desktop)
NVIDIA GeForce RTX 2080 (Desktop)
...
...
NVIDIA GeForce RTX 2060 (Desktop)
AMD Radeon RX Vega 64
AMD Radeon RX 5600 XT (Desktop)
NVIDIA GeForce RTX 2060 Super (Desktop)
AMD Radeon RX 5700 (Desktop)
NVIDIA GeForce RTX 2070 Super Max-Q
AMD Radeon VII
AMD Radeon RX 5700 XT (Desktop)
NVIDIA GeForce RTX 2070 Super Mobile
...
...
NVIDIA GeForce RTX 2060 (Desktop)
NVIDIA GeForce GTX 1080 Mobile
AMD Radeon RX 5600 XT (Desktop)
AMD Radeon RX Vega 64
NVIDIA GeForce RTX 2060 Super (Desktop)
AMD Radeon RX 5700 (Desktop)
AMD Radeon VII
AMD Radeon RX 5700 XT (Desktop)
NVIDIA GeForce RTX 2070 Super Mobile
...
NVIDIA GeForce GTX 1650 Super (Desktop)
...
AMD Radeon RX Vega 64
AMD Radeon RX 5700 (Desktop)
AMD Radeon RX 5700 XT (Desktop)
NVIDIA GeForce RTX 2070 Super Mobile
NVIDIA GeForce RTX 3060
AMD Radeon VII
NVIDIA GeForce RTX 2080 (Desktop)
...
» With all tested laptops playable in detail settings ultra.
Additional Benchmarks
Highest Settings + Ultra Ray Tracing 1920x1080
24.5 [X] Nvidia Titan X (Pascal) AMD Ryzen 9 5900X 3.7GHz
Titan X Pascal
min:
13.7 fps, P0.1:
14.5 fps, P1:
18 fps, max:
109 fps
...
NVIDIA GeForce GTX 1650 Super (Desktop)
NVIDIA Quadro RTX 3000 Max-Q
NVIDIA GeForce GTX 1660 Super (Desktop)
NVIDIA GeForce GTX 1660 (Desktop)
NVIDIA GeForce RTX 2060 Super (Desktop)
NVIDIA GeForce GTX 1660 Ti (Desktop)
...
...
AMD Radeon RX 5600 XT (Desktop)
AMD Radeon RX 5700 (Desktop)
NVIDIA GeForce RTX 2080 (Desktop)
AMD Radeon VII
NVIDIA GeForce RTX 3060
NVIDIA Titan RTX
...
Intel Iris Xe MAX Graphics
...
AMD Radeon RX 5700 (Desktop)
NVIDIA GeForce RTX 3060 Ti
AMD Radeon VII
NVIDIA GeForce RTX 2080 (Desktop)
NVIDIA Titan RTX
AMD Radeon RX 5700 XT (Desktop)
...
...
NVIDIA GeForce RTX 2060 (Desktop)
NVIDIA GeForce GTX 1080 Mobile
AMD Radeon RX Vega 64
NVIDIA GeForce RTX 2070 Super Max-Q
NVIDIA GeForce RTX 2060 Super (Desktop)
AMD Radeon RX 5600 XT (Desktop)
...
...
AMD Radeon RX 5600 XT (Desktop)
NVIDIA GeForce GTX 1080 Mobile
AMD Radeon RX Vega 64
NVIDIA GeForce RTX 2060 Super (Desktop)
AMD Radeon RX 5700 (Desktop)
...
...
NVIDIA GeForce RTX 2060 Super (Desktop)
AMD Radeon RX 5700 (Desktop)
AMD Radeon RX 5700 XT (Desktop)
AMD Radeon VII
...
» With all tested laptops playable in detail settings ultra.
166 [X] Nvidia Titan X (Pascal) AMD Ryzen 9 5900X 3.7GHz
Titan X Pascal
min:
77.6 fps, P0.1:
112.9 fps, P1:
124.6 fps, max:
226.9 fps
fps
+ Compare
- Hide Comparison
Intel UHD Graphics Xe 16EUs (Tiger Lake-H)
...
NVIDIA GeForce GTX 1660 (Desktop)
AMD Radeon RX Vega 64
NVIDIA GeForce RTX 2070 Super Max-Q
NVIDIA GeForce RTX 2070 Super Mobile
AMD Radeon RX 5600 XT (Desktop)
AMD Radeon RX 5700 (Desktop)
AMD Radeon VII
AMD Radeon RX 5700 XT (Desktop)
...
...
NVIDIA GeForce RTX 2070 Super Max-Q
NVIDIA GeForce GTX 1660 Ti (Desktop)
AMD Radeon RX Vega 64
AMD Radeon RX 5700 (Desktop)
AMD Radeon RX 5600 XT (Desktop)
AMD Radeon RX 5700 XT (Desktop)
AMD Radeon VII
NVIDIA GeForce RTX 2080 (Desktop)
...
...
NVIDIA GeForce GTX 1660 Ti (Desktop)
NVIDIA GeForce RTX 2070 Super Max-Q
AMD Radeon RX Vega 64
AMD Radeon RX 5700 (Desktop)
AMD Radeon RX 5600 XT (Desktop)
AMD Radeon RX 5700 XT (Desktop)
AMD Radeon VII
...
...
NVIDIA GeForce RTX 2070 Super Max-Q
AMD Radeon RX 5600 XT (Desktop)
AMD Radeon RX Vega 64
AMD Radeon RX 5700 (Desktop)
NVIDIA GeForce RTX 3060
AMD Radeon RX 5700 XT (Desktop)
AMD Radeon VII
...
...
NVIDIA GeForce RTX 2080 (Desktop)
NVIDIA GeForce RTX 2070 Super Mobile
AMD Radeon RX Vega 64
AMD Radeon RX 5600 XT (Desktop)
AMD Radeon RX 5700 (Desktop)
NVIDIA GeForce RTX 3060
AMD Radeon RX 5700 XT (Desktop)
...
...
NVIDIA GeForce RTX 2060 (Desktop)
NVIDIA GeForce GTX 1660 Ti (Desktop)
NVIDIA GeForce RTX 2060 Super (Desktop)
NVIDIA GeForce RTX 2070 Super Mobile
AMD Radeon RX Vega 64
AMD Radeon RX 5700 (Desktop)
AMD Radeon RX 5600 XT (Desktop)
NVIDIA GeForce RTX 2080 (Desktop)
...
» With all tested laptops playable in detail settings ultra.
...
NVIDIA Quadro RTX 5000 Max-Q
NVIDIA GeForce RTX 2070 Super Max-Q
NVIDIA GeForce GTX 1650 Super (Desktop)
NVIDIA Quadro RTX 3000 Max-Q
NVIDIA GeForce RTX 2070 Super Mobile
NVIDIA Titan RTX
NVIDIA GeForce GTX 1660 (Desktop)
...
AMD Radeon RX 6700 XT
Intel UHD Graphics Xe 16EUs (Tiger Lake-H)
...
NVIDIA GeForce RTX 2070 Super Max-Q
AMD Radeon RX Vega 64
NVIDIA GeForce RTX 2060 (Desktop)
NVIDIA GeForce RTX 2070 Super Mobile
NVIDIA GeForce RTX 3060
AMD Radeon RX 5700 (Desktop)
NVIDIA GeForce RTX 2080 (Desktop)
...
...
AMD Radeon RX Vega 64
NVIDIA GeForce RTX 2060 (Desktop)
AMD Radeon RX 5600 XT (Desktop)
NVIDIA GeForce RTX 2060 Super (Desktop)
NVIDIA GeForce RTX 2070 Super Mobile
AMD Radeon RX 5700 (Desktop)
NVIDIA GeForce RTX 3060
...
...
NVIDIA GeForce RTX 2060 Super (Desktop)
NVIDIA GeForce RTX 3060
NVIDIA GeForce RTX 2070 Super Mobile
AMD Radeon VII
AMD Radeon RX 6650 XT
AMD Radeon RX 5700 XT (Desktop)
...
...
NVIDIA GeForce RTX 2060 Super (Desktop)
NVIDIA GeForce RTX 2070 Super Mobile
NVIDIA GeForce RTX 3060
AMD Radeon RX 5700 XT (Desktop)
AMD Radeon VII
AMD Radeon RX 6650 XT
...
...
NVIDIA Quadro RTX 5000 Max-Q
AMD Radeon RX 6650 XT
NVIDIA GeForce RTX 2060 Super (Desktop)
NVIDIA GeForce RTX 2070 Super Mobile
NVIDIA GeForce RTX 3060
AMD Radeon VII
...
» With all tested laptops playable in detail settings ultra.
Additional Benchmarks
Ultra Preset + Ultra Ray Tracing (DX12) 1920x1080
22.5 [X] Nvidia Titan X (Pascal) AMD Ryzen 9 3900X 3.8GHz
Titan X Pascal
min:
11.83 fps, P1:
16.6 fps, max:
30.04 fps
...
NVIDIA Quadro RTX 5000 Max-Q
NVIDIA Titan RTX
AMD Radeon VII
NVIDIA GeForce GTX 1660 Super (Desktop)
NVIDIA GeForce RTX 2060 Super (Desktop)
AMD Radeon RX 5700 (Desktop)
NVIDIA GeForce RTX 2080 (Desktop)
AMD Radeon RX 5700 XT (Desktop)
NVIDIA GeForce RTX 2060 (Desktop)
AMD Radeon RX 5600 XT (Desktop)
AMD Radeon RX Vega 64
...
...
AMD Radeon VII
NVIDIA Titan RTX
NVIDIA GeForce GTX 1660 Super (Desktop)
NVIDIA GeForce GTX 1660 (Desktop)
NVIDIA GeForce RTX 2060 Super (Desktop)
NVIDIA GeForce RTX 2080 (Desktop)
NVIDIA GeForce RTX 2060 (Desktop)
...
...
NVIDIA Titan RTX
NVIDIA GeForce GTX 1660 Super (Desktop)
AMD Radeon VII
NVIDIA GeForce GTX 1660 (Desktop)
NVIDIA GeForce RTX 2080 (Desktop)
AMD Radeon RX 5700 (Desktop)
NVIDIA GeForce RTX 2060 (Desktop)
AMD Radeon RX Vega 64
AMD Radeon RX 5600 XT (Desktop)
...
...
NVIDIA Titan RTX
NVIDIA GeForce GTX 1660 Super (Desktop)
NVIDIA GeForce GTX 1660 (Desktop)
NVIDIA GeForce RTX 2060 Super (Desktop)
NVIDIA GeForce RTX 2060 (Desktop)
NVIDIA GeForce RTX 2080 (Desktop)
NVIDIA GeForce RTX 3060 Ti
...
...
AMD Radeon VII
NVIDIA Titan RTX
NVIDIA GeForce RTX 2060 (Desktop)
NVIDIA GeForce RTX 2080 (Desktop)
AMD Radeon RX 5700 XT (Desktop)
AMD Radeon RX 5600 XT (Desktop)
AMD Radeon RX Vega 64
AMD Radeon RX 5700 (Desktop)
NVIDIA GeForce RTX 3060 Ti
...
...
NVIDIA GeForce GTX 1080 Mobile
NVIDIA GeForce GTX 1660 Super (Desktop)
AMD Radeon RX Vega 64
AMD Radeon RX 5600 XT (Desktop)
NVIDIA GeForce RTX 2060 (Desktop)
AMD Radeon RX 5700 (Desktop)
NVIDIA GeForce RTX 2060 Super (Desktop)
AMD Radeon VII
AMD Radeon RX 5700 XT (Desktop)
NVIDIA Titan RTX
...
» With all tested laptops playable in detail settings ultra.
0 100 200 300 400 500 Tooltip 1.5.5.7: Ø435 (366.133-540.7)
...
NVIDIA GeForce RTX 2060 (Desktop)
NVIDIA GeForce RTX 2060 Super (Desktop)
NVIDIA GeForce GTX 1660 (Desktop)
NVIDIA GeForce GTX 1660 Super (Desktop)
NVIDIA GeForce RTX 2080 (Desktop)
AMD Radeon VII
NVIDIA Titan RTX
AMD Radeon RX 5700 XT (Desktop)
NVIDIA GeForce RTX 3060
...
0 100 200 300 Tooltip 1.5.5.7: Ø319 (298.415-343.2)
...
NVIDIA GeForce RTX 2060 (Desktop)
NVIDIA GeForce RTX 3060
NVIDIA GeForce RTX 2060 Super (Desktop)
AMD Radeon RX Vega 64
AMD Radeon RX 5600 XT (Desktop)
AMD Radeon RX 5700 (Desktop)
NVIDIA GeForce RTX 2080 (Desktop)
AMD Radeon VII
...
0 100 200 300 Tooltip 1.5.5.7: Ø268 (243.258-331.5)
AMD Radeon RX Vega 6 (Ryzen 2000/3000)
...
NVIDIA GeForce RTX 2060 Super (Desktop)
NVIDIA GeForce RTX 3060
AMD Radeon RX Vega 64
NVIDIA GeForce RTX 2080 Super Mobile
AMD Radeon RX 5600 XT (Desktop)
AMD Radeon RX 5700 (Desktop)
NVIDIA GeForce RTX 2080 (Desktop)
...
0 100 200 300 400 500 600 Tooltip 1.5.5.7: Ø255 (221.697-608)
...
NVIDIA GeForce RTX 2060 Super (Desktop)
NVIDIA GeForce RTX 3060
AMD Radeon RX Vega 64
NVIDIA GeForce RTX 2080 Super Mobile
AMD Radeon RX 5600 XT (Desktop)
AMD Radeon RX 5700 (Desktop)
NVIDIA GeForce RTX 2080 (Desktop)
AMD Radeon RX 5700 XT (Desktop)
...
0 100 200 Tooltip 1.5.5.7: Ø168.8 (155.081-230.4)
...
NVIDIA GeForce RTX 3060
AMD Radeon RX Vega 64
AMD Radeon RX 5600 XT (Desktop)
AMD Radeon RX 5700 (Desktop)
NVIDIA GeForce RTX 2080 Super Mobile
AMD Radeon RX 5700 XT (Desktop)
NVIDIA GeForce RTX 2080 (Desktop)
...
0 100 200 300 400 Tooltip 1.5.5.7: Ø104.7 (89.115-465)
...
AMD Radeon RX 5600 XT (Desktop)
AMD Radeon RX 5700 (Desktop)
NVIDIA GeForce RTX 3060
AMD Radeon RX 5700 XT (Desktop)
NVIDIA GeForce RTX 2080 Super Mobile
AMD Radeon VII
NVIDIA GeForce RTX 2080 (Desktop)
AMD Radeon RX 6700 XT
...
» With all tested laptops playable in detail settings ultra.
...
NVIDIA GeForce RTX 2070 Super Mobile
NVIDIA GeForce RTX 2080 (Desktop)
NVIDIA GeForce GTX 1660 Super (Desktop)
AMD Radeon VII
NVIDIA GeForce RTX 2060 Super (Desktop)
NVIDIA GeForce RTX 2060 (Desktop)
NVIDIA Titan RTX
NVIDIA GeForce RTX 3060 Ti
...
Intel UHD Graphics G1 (Ice Lake 32 EU)
...
NVIDIA GeForce RTX 2070 Super Mobile
AMD Radeon RX 5700 XT (Desktop)
NVIDIA GeForce RTX 2060 Super (Desktop)
AMD Radeon VII
NVIDIA GeForce RTX 3060
NVIDIA GeForce RTX 2080 (Desktop)
AMD Radeon RX 6700 XT
NVIDIA GeForce RTX 3060 Ti
NVIDIA Titan RTX
...
...
NVIDIA GeForce RTX 2070 Super Mobile
NVIDIA GeForce RTX 2060 Super (Desktop)
AMD Radeon VII
NVIDIA GeForce RTX 3060
NVIDIA GeForce RTX 2080 (Desktop)
AMD Radeon RX 6700 XT
AMD Radeon RX 6650 XT
NVIDIA GeForce RTX 2080 Super Mobile
...
...
NVIDIA GeForce RTX 2060 Super (Desktop)
AMD Radeon RX 5700 XT (Desktop)
NVIDIA GeForce RTX 3060
AMD Radeon RX 6650 XT
AMD Radeon VII
AMD Radeon RX 6700 XT
NVIDIA GeForce RTX 2080 Super Mobile
NVIDIA GeForce RTX 2080 (Desktop)
NVIDIA GeForce RTX 3060 Ti
AMD Radeon RX 6750 XT
...
NVIDIA GeForce GTX 1050 Ti Mobile
...
AMD Radeon RX 6650 XT
NVIDIA GeForce RTX 2060 Super (Desktop)
AMD Radeon RX 5700 XT (Desktop)
NVIDIA GeForce RTX 3060
AMD Radeon VII
AMD Radeon RX 6700 XT
NVIDIA GeForce RTX 2080 Super Mobile
NVIDIA GeForce RTX 2080 (Desktop)
AMD Radeon RX 6750 XT
NVIDIA GeForce RTX 3060 Ti
...
» With all tested laptops playable in detail settings high.
...
NVIDIA GeForce RTX 2070 Super Max-Q
NVIDIA GeForce RTX 2070 Super Mobile
NVIDIA Titan RTX
NVIDIA GeForce GTX 1650 Super (Desktop)
NVIDIA GeForce GTX 1660 (Desktop)
NVIDIA GeForce GTX 1660 Super (Desktop)
NVIDIA GeForce RTX 2060 Super (Desktop)
AMD Radeon RX 5700 (Desktop)
AMD Radeon RX Vega 64
AMD Radeon RX 5700 XT (Desktop)
...
...
NVIDIA GeForce RTX 2060 Super (Desktop)
AMD Radeon RX 5700 (Desktop)
AMD Radeon RX 5700 XT (Desktop)
NVIDIA Titan RTX
AMD Radeon VII
...
AMD Radeon RX 5700 (Desktop)
NVIDIA GeForce RTX 2080 (Desktop)
AMD Radeon VII
AMD Radeon RX 5700 XT (Desktop)
NVIDIA GeForce RTX 2060 (Desktop)
NVIDIA Titan RTX
NVIDIA GeForce RTX 2080 Super Mobile
...
...
AMD Radeon RX 5700 (Desktop)
NVIDIA GeForce RTX 2070 Super Mobile
AMD Radeon VII
NVIDIA GeForce RTX 2060 Super (Desktop)
AMD Radeon RX 5700 XT (Desktop)
NVIDIA GeForce RTX 2080 (Desktop)
NVIDIA GeForce RTX 2080 Super Mobile
NVIDIA Titan RTX
...
...
AMD Radeon RX 5600 XT (Desktop)
NVIDIA GeForce RTX 2070 Super Mobile
AMD Radeon RX 5700 (Desktop)
AMD Radeon VII
AMD Radeon RX 5700 XT (Desktop)
NVIDIA GeForce RTX 2060 Super (Desktop)
NVIDIA GeForce RTX 2080 (Desktop)
NVIDIA GeForce RTX 2080 Super Mobile
NVIDIA Titan RTX
...
...
NVIDIA GeForce RTX 2060 (Desktop)
AMD Radeon RX Vega 64
AMD Radeon RX 5600 XT (Desktop)
NVIDIA GeForce RTX 2070 Super Mobile
AMD Radeon RX 5700 (Desktop)
NVIDIA GeForce RTX 2060 Super (Desktop)
AMD Radeon VII
AMD Radeon RX 5700 XT (Desktop)
NVIDIA GeForce RTX 2080 (Desktop)
NVIDIA GeForce RTX 2080 Super Mobile
NVIDIA Titan RTX
...
» With all tested laptops playable in detail settings ultra.
...
NVIDIA Titan RTX
NVIDIA GeForce RTX 3060
AMD Radeon RX 6650 XT
AMD Radeon RX 6700 XT
NVIDIA GeForce RTX 3060 Ti
...
AMD Radeon VII
AMD Radeon RX 5700 XT (Desktop)
NVIDIA GeForce RTX 2080 (Desktop)
...
0 (!) [X] Nvidia Titan X (Pascal) AMD Ryzen 9 5900X 3.7GHz
Titan X Pascal
fps
+ Compare
- Hide Comparison
AMD Radeon RX Vega 6 (Ryzen 4000/5000)
AMD Radeon RX Vega 7
Intel Iris Plus Graphics G7 (Ice Lake 64 EU)
AMD Radeon RX 560X (Laptop)
...
0 (!) [X] Nvidia Titan X (Pascal) AMD Ryzen 9 5900X 3.7GHz
Titan X Pascal
fps
+ Compare
- Hide Comparison
AMD Radeon 680M
...
0 (!) [X] Nvidia Titan X (Pascal) AMD Ryzen 9 5900X 3.7GHz
Titan X Pascal
fps
+ Compare
- Hide Comparison
NVIDIA GeForce GTX 1650 Super (Desktop)
...
0 (!) [X] Nvidia Titan X (Pascal) AMD Ryzen 9 5900X 3.7GHz
Titan X Pascal
fps
+ Compare
- Hide Comparison
NVIDIA GeForce GTX 1650 Super (Desktop)
...
» With all tested laptops playable in detail settings med..
Intel UHD Graphics Xe 16EUs (Tiger Lake-H)
...
NVIDIA GeForce GTX 1080 (Desktop)
NVIDIA GeForce RTX 2070 Super Mobile
AMD Radeon RX 480 (Desktop)
NVIDIA GeForce RTX 2060 Super (Desktop)
NVIDIA GeForce RTX 2060 (Desktop)
AMD Radeon RX Vega 64
AMD Radeon RX 5700 XT (Desktop)
NVIDIA GeForce RTX 2080 (Desktop)
AMD Radeon RX 5600 XT (Desktop)
AMD Radeon RX 5700 (Desktop)
...
AMD Radeon RX Vega 8 (Ryzen 2000/3000)
...
NVIDIA GeForce GTX 1660 Super (Desktop)
NVIDIA GeForce GTX 1080 Mobile
NVIDIA GeForce RTX 2070 Super Mobile
AMD Radeon RX Vega 64
NVIDIA GeForce GTX 1080 (Desktop)
AMD Radeon RX 5600 XT (Desktop)
AMD Radeon RX 5700 (Desktop)
NVIDIA GeForce RTX 2060 Super (Desktop)
NVIDIA GeForce RTX 2060 (Desktop)
AMD Radeon RX 5700 XT (Desktop)
NVIDIA GeForce RTX 2080 (Desktop)
...
...
NVIDIA GeForce GTX 1080 (Desktop)
NVIDIA GeForce RTX 2070 Super Mobile
NVIDIA GeForce RTX 2060 (Desktop)
AMD Radeon RX 5700 XT (Desktop)
NVIDIA GeForce RTX 2060 Super (Desktop)
NVIDIA GeForce RTX 2080 (Desktop)
NVIDIA Titan RTX
NVIDIA GeForce RTX 2080 Super Mobile
...
...
NVIDIA GeForce GTX 1080 (Desktop)
NVIDIA Quadro RTX 5000 Max-Q
AMD Radeon RX 5700 XT (Desktop)
NVIDIA GeForce RTX 2060 (Desktop)
NVIDIA GeForce RTX 2060 Super (Desktop)
NVIDIA GeForce RTX 2070 Super Mobile
NVIDIA GeForce RTX 2080 Super Mobile
...
NVIDIA GeForce GTX 1050 Ti Mobile
...
AMD Radeon RX 5700 XT (Desktop)
NVIDIA GeForce GTX 1080 (Desktop)
NVIDIA GeForce RTX 2060 (Desktop)
NVIDIA GeForce GTX 1080 Mobile
NVIDIA Quadro RTX 5000 Max-Q
NVIDIA GeForce RTX 2060 Super (Desktop)
NVIDIA GeForce RTX 2080 Super Mobile
NVIDIA GeForce RTX 2080 (Desktop)
...
NVIDIA GeForce GTX 1050 Ti Mobile
...
AMD Radeon RX 5700 (Desktop)
NVIDIA GeForce GTX 1080 (Desktop)
NVIDIA GeForce GTX 1080 Mobile
NVIDIA GeForce RTX 2060 (Desktop)
NVIDIA Quadro RTX 5000 Max-Q
NVIDIA GeForce RTX 2060 Super (Desktop)
NVIDIA GeForce RTX 2080 Super Mobile
NVIDIA GeForce RTX 2080 (Desktop)
NVIDIA Titan RTX
...
» With all tested laptops playable in detail settings ultra.
...
NVIDIA Quadro RTX 5000 Max-Q
NVIDIA GeForce GTX 1650 Super (Desktop)
NVIDIA GeForce GTX 1660 (Desktop)
NVIDIA GeForce GTX 1660 Super (Desktop)
...
Intel UHD Graphics Xe 16EUs (Tiger Lake-H)
...
NVIDIA GeForce RTX 2060 (Desktop)
NVIDIA GeForce RTX 2060 Super (Desktop)
NVIDIA Quadro RTX 5000 Max-Q
AMD Radeon RX 5600 XT (Desktop)
AMD Radeon RX 5700 XT (Desktop)
...
AMD Radeon RX Vega 6 (Ryzen 4000/5000)
...
NVIDIA GeForce GTX 1080 Mobile
NVIDIA GeForce RTX 2060 Super (Desktop)
NVIDIA GeForce RTX 2060 (Desktop)
AMD Radeon RX 5600 XT (Desktop)
AMD Radeon RX 5700 XT (Desktop)
AMD Radeon RX 5700 (Desktop)
...
...
NVIDIA GeForce GTX 1080 Mobile
NVIDIA GeForce RTX 2060 (Desktop)
NVIDIA GeForce RTX 2060 Super (Desktop)
AMD Radeon RX 5700 XT (Desktop)
AMD Radeon RX 5700 (Desktop)
NVIDIA GeForce RTX 2070 Super Mobile
...
...
NVIDIA GeForce RTX 2060 (Desktop)
AMD Radeon RX 5600 XT (Desktop)
NVIDIA GeForce RTX 2060 Super (Desktop)
AMD Radeon RX 5700 XT (Desktop)
AMD Radeon RX 5700 (Desktop)
NVIDIA Quadro RTX 5000 Max-Q
...
...
AMD Radeon RX 5600 XT (Desktop)
AMD Radeon RX 5700 XT (Desktop)
NVIDIA GeForce RTX 2060 (Desktop)
NVIDIA GeForce RTX 2060 Super (Desktop)
AMD Radeon RX 5700 (Desktop)
...
» With all tested laptops playable in detail settings ultra.
...
NVIDIA GeForce GTX 1660 Super (Desktop)
NVIDIA GeForce GTX 1660 Ti (Desktop)
NVIDIA GeForce RTX 2070 Super Max-Q
AMD Radeon RX Vega 64
NVIDIA GeForce RTX 2060 (Desktop)
...
AMD Radeon RX 6700 XT
...
NVIDIA GeForce RTX 2060 Super (Desktop)
AMD Radeon RX 5600 XT (Desktop)
NVIDIA GeForce RTX 2070 Super Mobile
AMD Radeon RX 5700 (Desktop)
AMD Radeon RX 5700 XT (Desktop)
...
...
NVIDIA GeForce RTX 2060 Super (Desktop)
AMD Radeon RX 5600 XT (Desktop)
NVIDIA GeForce RTX 2070 Super Mobile
AMD Radeon RX 5700 (Desktop)
AMD Radeon RX 5700 XT (Desktop)
AMD Radeon VII
...
AMD Radeon RX Vega 6 (Ryzen 2000/3000)
...
NVIDIA GeForce RTX 2060 Super (Desktop)
AMD Radeon RX 5600 XT (Desktop)
NVIDIA GeForce RTX 2070 Super Mobile
AMD Radeon RX 5700 (Desktop)
AMD Radeon RX 5700 XT (Desktop)
AMD Radeon VII
...
...
NVIDIA GeForce RTX 2060 Super (Desktop)
NVIDIA GeForce RTX 2070 Super Mobile
AMD Radeon RX 5600 XT (Desktop)
AMD Radeon RX 5700 (Desktop)
AMD Radeon RX 5700 XT (Desktop)
NVIDIA GeForce RTX 3060
AMD Radeon VII
...
...
NVIDIA GeForce RTX 2060 Super (Desktop)
AMD Radeon RX 5700 (Desktop)
NVIDIA GeForce RTX 2070 Super Mobile
AMD Radeon RX 5700 XT (Desktop)
NVIDIA GeForce RTX 3060
AMD Radeon VII
...
» With all tested laptops playable in detail settings ultra.
291 [X] Nvidia Titan X (Pascal) 675864
AMD Ryzen 9 3900X 3.8GHz
Titan X Pascal
min:
231 fps, max:
318 fps
477 [X] Nvidia Titan X (Pascal) 759689
AMD Ryzen 9 7900X 4.7GHz
Titan X Pascal
min:
408 fps, max:
529 fps
495 [X] Nvidia Titan X (Pascal) 759689
AMD Ryzen 9 7950X 4.5GHz
Titan X Pascal
min:
417 fps, max:
552 fps
~ 421 fps
+ Compare
- Hide Comparison
...
NVIDIA GeForce GTX 1660 Super (Desktop)
AMD Radeon RX 5700 (Desktop)
NVIDIA GeForce RTX 2060 Super (Desktop)
AMD Radeon RX 5700 XT (Desktop)
NVIDIA Titan RTX
AMD Radeon RX 6650 XT
...
245 [X] Nvidia Titan X (Pascal) 675864
AMD Ryzen 9 3900X 3.8GHz
Titan X Pascal
min:
209 fps, max:
280 fps
275 [X] Nvidia Titan X (Pascal) 759689
AMD Ryzen 9 7900X 4.7GHz
Titan X Pascal
min:
235 fps, max:
317 fps
285 [X] Nvidia Titan X (Pascal) 759689
AMD Ryzen 9 7950X 4.5GHz
Titan X Pascal
min:
233 fps, max:
330 fps
~ 268 fps
+ Compare
- Hide Comparison
...
NVIDIA GeForce RTX 2080 Super Mobile
4x NVIDIA RTX A6000
AMD Radeon RX 5700 XT (Desktop)
NVIDIA GeForce RTX 2080 (Desktop)
NVIDIA RTX A6000
AMD Radeon Pro W6800
AMD Radeon RX 6650 XT
...
202 [X] Nvidia Titan X (Pascal) 675864
AMD Ryzen 9 3900X 3.8GHz
Titan X Pascal
min:
178 fps, max:
236 fps
221 [X] Nvidia Titan X (Pascal) 759689
AMD Ryzen 9 7900X 4.7GHz
Titan X Pascal
min:
183 fps, max:
255 fps
226 [X] Nvidia Titan X (Pascal) 759689
AMD Ryzen 9 7950X 4.5GHz
Titan X Pascal
min:
199 fps, max:
265 fps
~ 216 fps
+ Compare
- Hide Comparison
...
NVIDIA GeForce RTX 2060 Super (Desktop)
AMD Radeon RX 5700 XT (Desktop)
NVIDIA GeForce RTX 3060 Ti
NVIDIA GeForce RTX 2080 Super Mobile
NVIDIA GeForce RTX 2080 (Desktop)
NVIDIA RTX A6000
4x NVIDIA RTX A6000
...
141 [X] Nvidia Titan X (Pascal) 675864
AMD Ryzen 9 3900X 3.8GHz
Titan X Pascal
min:
114 fps, max:
168 fps
149.7 [X] Nvidia Titan X (Pascal) 759689
AMD Ryzen 9 7900X 4.7GHz
Titan X Pascal
min:
116 fps, max:
187 fps
153.5 [X] Nvidia Titan X (Pascal) 759689
AMD Ryzen 9 7950X 4.5GHz
Titan X Pascal
min:
119 fps, max:
185 fps
~ 148 fps
+ Compare
- Hide Comparison
...
AMD Radeon RX 5700 XT (Desktop)
NVIDIA GeForce RTX 2060 Super (Desktop)
NVIDIA GeForce RTX 3060 Ti
NVIDIA GeForce RTX 2080 Super Mobile
NVIDIA GeForce RTX 2080 (Desktop)
...
109 [X] Nvidia Titan X (Pascal) 675864
AMD Ryzen 9 3900X 3.8GHz
Titan X Pascal
min:
88 fps, max:
132 fps
117.7 [X] Nvidia Titan X (Pascal) 759689
AMD Ryzen 9 7900X 4.7GHz
Titan X Pascal
min:
94 fps, max:
140 fps
119.2 [X] Nvidia Titan X (Pascal) 759689
AMD Ryzen 9 7950X 4.5GHz
Titan X Pascal
min:
96 fps, max:
141 fps
~ 115 fps
+ Compare
- Hide Comparison
...
AMD Radeon RX 5700 (Desktop)
NVIDIA GeForce RTX 2060 Super (Desktop)
AMD Radeon RX 5700 XT (Desktop)
NVIDIA GeForce RTX 3060
NVIDIA GeForce RTX 3060 Ti
NVIDIA GeForce RTX 2080 Super Mobile
...
64.9 [X] Nvidia Titan X (Pascal) 675864
AMD Ryzen 9 3900X 3.8GHz
Titan X Pascal
min:
53 fps, max:
74 fps
69.5 [X] Nvidia Titan X (Pascal) 759689
AMD Ryzen 9 7900X 4.7GHz
Titan X Pascal
min:
58 fps, max:
82 fps
69.5 [X] Nvidia Titan X (Pascal) 759689
AMD Ryzen 9 7950X 4.5GHz
Titan X Pascal
min:
58 fps, max:
82 fps
~ 68 fps
+ Compare
- Hide Comparison
...
AMD Radeon RX 5700 XT (Desktop)
NVIDIA GeForce RTX 3060
AMD Radeon RX 6650 XT
NVIDIA GeForce RTX 3060 Ti
NVIDIA GeForce RTX 2080 Super Mobile
NVIDIA GeForce RTX 2080 (Desktop)
...
» With all tested laptops playable in detail settings ultra.
...
NVIDIA GeForce RTX 2060 (Desktop)
NVIDIA GeForce RTX 2080 (Desktop)
AMD Radeon RX 5700 (Desktop)
AMD Radeon RX 5600 XT (Desktop)
AMD Radeon RX Vega 64
NVIDIA GeForce GTX 1660 (Desktop)
NVIDIA GeForce GTX 1660 Super (Desktop)
AMD Radeon RX 5700 XT (Desktop)
NVIDIA GeForce RTX 2060 Super (Desktop)
NVIDIA Titan RTX
...
NVIDIA GeForce RTX 2060 (Desktop)
NVIDIA GeForce RTX 2080 (Desktop)
AMD Radeon RX 5600 XT (Desktop)
AMD Radeon RX 5700 (Desktop)
NVIDIA GeForce RTX 2060 Super (Desktop)
NVIDIA GeForce GTX 1660 (Desktop)
AMD Radeon RX 5700 XT (Desktop)
AMD Radeon RX Vega 64
NVIDIA GeForce GTX 1660 Super (Desktop)
NVIDIA Titan RTX
...
NVIDIA GeForce RTX 2060 (Desktop)
NVIDIA GeForce RTX 2080 (Desktop)
AMD Radeon RX 5600 XT (Desktop)
NVIDIA GeForce GTX 1660 (Desktop)
NVIDIA GeForce GTX 1660 Super (Desktop)
AMD Radeon RX 5700 (Desktop)
NVIDIA GeForce RTX 2060 Super (Desktop)
AMD Radeon RX Vega 64
AMD Radeon RX 5700 XT (Desktop)
NVIDIA Titan RTX
...
NVIDIA GeForce GTX 1660 (Desktop)
NVIDIA GeForce RTX 2060 (Desktop)
AMD Radeon RX 480 (Desktop)
NVIDIA GeForce RTX 2080 (Desktop)
AMD Radeon RX 5600 XT (Desktop)
NVIDIA GeForce GTX 1660 Super (Desktop)
AMD Radeon RX Vega 64
NVIDIA GeForce RTX 2060 Super (Desktop)
AMD Radeon RX 5700 (Desktop)
AMD Radeon RX 5700 XT (Desktop)
...
NVIDIA Titan RTX
AMD Radeon RX Vega 6 (Ryzen 4000/5000)
...
NVIDIA GeForce RTX 2060 (Desktop)
NVIDIA GeForce RTX 2060 Super (Desktop)
AMD Radeon RX 5600 XT (Desktop)
AMD Radeon RX 5700 (Desktop)
NVIDIA GeForce RTX 2080 (Desktop)
AMD Radeon RX 5700 XT (Desktop)
NVIDIA Titan RTX
» With all tested laptops playable in detail settings high.
...
NVIDIA GeForce RTX 2060 Super (Desktop)
NVIDIA GeForce GTX 1660 Super (Desktop)
NVIDIA Titan RTX
NVIDIA GeForce RTX 3060 Ti
AMD Radeon RX 5600 XT (Desktop)
AMD Radeon RX 5700 (Desktop)
AMD Radeon RX Vega 64
...
NVIDIA GeForce RTX 3060 Ti
AMD Radeon RX 5700 (Desktop)
NVIDIA GeForce RTX 2080 Super Mobile
NVIDIA GeForce RTX 2080 (Desktop)
...
AMD Radeon RX 5700 (Desktop)
NVIDIA GeForce RTX 2060 Super (Desktop)
NVIDIA Titan RTX
NVIDIA GeForce RTX 2080 Super Mobile
...
...
NVIDIA GeForce RTX 2070 Super Mobile
NVIDIA GeForce RTX 2080 (Desktop)
NVIDIA GeForce RTX 2080 Super Mobile
...
...
NVIDIA GeForce GTX 1080 (Desktop)
AMD Radeon RX 5600 XT (Desktop)
AMD Radeon RX 5700 (Desktop)
AMD Radeon VII
NVIDIA GeForce RTX 2060 Super (Desktop)
NVIDIA GeForce RTX 2070 Super Mobile
NVIDIA GeForce RTX 2080 Super Mobile
...
...
NVIDIA GeForce RTX 2070 Super Mobile
NVIDIA GeForce RTX 2060 Super (Desktop)
NVIDIA GeForce RTX 2080 Super Mobile
AMD Radeon VII
NVIDIA GeForce RTX 2080 (Desktop)
NVIDIA GeForce RTX 3060 Ti
...
» With all tested laptops playable in detail settings ultra.
...
NVIDIA Quadro RTX 5000 Max-Q
NVIDIA GeForce GTX 1080 Mobile
NVIDIA GeForce RTX 2070 Super Mobile
NVIDIA GeForce RTX 2070 Super Max-Q
NVIDIA GeForce RTX 2060 Super (Desktop)
NVIDIA GeForce GTX 1650 Super (Desktop)
...
Intel UHD Graphics Xe 16EUs (Tiger Lake-H)
...
NVIDIA GeForce RTX 2060 (Desktop)
AMD Radeon RX 5700 XT (Desktop)
NVIDIA GeForce RTX 2060 Super (Desktop)
NVIDIA GeForce RTX 2080 Super Mobile
AMD Radeon VII
NVIDIA Titan RTX
...
Intel Iris Plus Graphics G7 (Ice Lake 64 EU)
...
AMD Radeon RX 5600 XT (Desktop)
NVIDIA GeForce RTX 2070 Super Mobile
AMD Radeon RX 5700 XT (Desktop)
AMD Radeon RX 5700 (Desktop)
NVIDIA GeForce RTX 2060 (Desktop)
NVIDIA GeForce RTX 2060 Super (Desktop)
AMD Radeon VII
NVIDIA GeForce RTX 2080 Super Mobile
...
...
NVIDIA GeForce RTX 2060 (Desktop)
NVIDIA GeForce RTX 2070 Super Mobile
NVIDIA GeForce RTX 2060 Super (Desktop)
AMD Radeon VII
NVIDIA GeForce RTX 2080 Super Mobile
...
...
NVIDIA GeForce GTX 1080 Mobile
AMD Radeon RX Vega 64
AMD Radeon RX 5600 XT (Desktop)
NVIDIA Quadro RTX 5000 Max-Q
NVIDIA GeForce RTX 2070 Super Max-Q
NVIDIA GeForce RTX 2060 (Desktop)
NVIDIA GeForce RTX 2060 Super (Desktop)
NVIDIA GeForce RTX 2070 Super Mobile
AMD Radeon RX 5700 XT (Desktop)
...
...
NVIDIA GeForce RTX 2060 (Desktop)
AMD Radeon RX Vega 64
NVIDIA GeForce GTX 1080 Mobile
NVIDIA Quadro RTX 5000 Max-Q
NVIDIA GeForce RTX 2070 Super Max-Q
AMD Radeon RX 5700 (Desktop)
NVIDIA GeForce RTX 2060 Super (Desktop)
NVIDIA GeForce RTX 2070 Super Mobile
AMD Radeon RX 5700 XT (Desktop)
...
» With all tested laptops playable in detail settings ultra.
AMD Radeon R4 (Stoney Ridge)
...
AMD Radeon VII
NVIDIA GeForce GTX 1660 Super (Desktop)
NVIDIA GeForce RTX 2080 (Desktop)
AMD Radeon RX 5600 XT (Desktop)
NVIDIA GeForce RTX 2060 (Desktop)
NVIDIA Titan RTX
NVIDIA GeForce RTX 2060 Super (Desktop)
...
AMD Radeon RX Vega 64
AMD Radeon RX 5700 XT (Desktop)
NVIDIA GeForce RTX 2070 Super Mobile
NVIDIA GeForce RTX 2060 Super (Desktop)
NVIDIA GeForce RTX 2080 Super Mobile
AMD Radeon VII
NVIDIA GeForce RTX 2080 (Desktop)
NVIDIA Titan RTX
...
...
NVIDIA GeForce RTX 2060 (Desktop)
NVIDIA GeForce RTX 2060 Super (Desktop)
AMD Radeon RX 5700 XT (Desktop)
NVIDIA GeForce RTX 2070 Super Mobile
NVIDIA GeForce RTX 2080 Super Mobile
...
...
NVIDIA GeForce RTX 2060 Super (Desktop)
AMD Radeon RX 5700 XT (Desktop)
NVIDIA GeForce RTX 2070 Super Mobile
NVIDIA GeForce RTX 2080 Super Mobile
NVIDIA GeForce RTX 2080 (Desktop)
...
NVIDIA GeForce GTX 1050 Max-Q
...
NVIDIA GeForce RTX 2060 (Desktop)
NVIDIA GeForce RTX 2060 Super (Desktop)
AMD Radeon RX 5700 XT (Desktop)
NVIDIA GeForce RTX 2070 Super Mobile
NVIDIA GeForce RTX 2080 (Desktop)
AMD Radeon VII
...
» With all tested laptops playable in detail settings high.
AMD Radeon R4 (Stoney Ridge)
...
AMD Radeon Pro 560X
NVIDIA GeForce GTX 1050 Ti Mobile
NVIDIA Titan RTX
AMD Radeon RX 5600 XT (Desktop)
NVIDIA GeForce GTX 1660 Ti (Desktop)
NVIDIA GeForce GTX 1660 Super (Desktop)
...
...
AMD Radeon RX 5300M
NVIDIA GeForce GTX 1660 Super (Desktop)
NVIDIA GeForce RTX 2060 Super (Desktop)
NVIDIA Titan RTX
NVIDIA GeForce RTX 2060 (Desktop)
AMD Radeon RX Vega 64
NVIDIA GeForce GTX 1080 Mobile
NVIDIA GeForce RTX 2070 Super Max-Q
...
NVIDIA Titan RTX
AMD Radeon RX Vega 6 (Ryzen 2000/3000)
...
NVIDIA GeForce GTX 1660 (Desktop)
NVIDIA GeForce GTX 1660 Ti (Desktop)
NVIDIA GeForce RTX 2060 Super (Desktop)
NVIDIA GeForce RTX 2070 Super Max-Q
NVIDIA GeForce GTX 1080 Mobile
...
AMD Radeon RX 5700 (Desktop)
...
NVIDIA GeForce GTX 1660 Ti (Desktop)
AMD Radeon RX Vega 64
NVIDIA GeForce RTX 2070 Super Max-Q
NVIDIA GeForce GTX 1080 Mobile
NVIDIA GeForce RTX 2060 (Desktop)
NVIDIA Titan RTX
AMD Radeon RX 5700 XT (Desktop)
...
NVIDIA GeForce RTX 2070 Super Mobile
...
AMD Radeon RX Vega 64
NVIDIA GeForce RTX 2060 Super (Desktop)
NVIDIA GeForce RTX 2070 Super Max-Q
NVIDIA GeForce RTX 2070 Super Mobile
NVIDIA GeForce RTX 2060 (Desktop)
NVIDIA GeForce GTX 1080 Mobile
AMD Radeon RX 5700 (Desktop)
AMD Radeon RX 5700 XT (Desktop)
NVIDIA GeForce RTX 2080 Super Mobile
...
...
AMD Radeon RX Vega 64
NVIDIA GeForce RTX 2070 Super Max-Q
NVIDIA GeForce RTX 2060 Super (Desktop)
NVIDIA GeForce RTX 2060 (Desktop)
NVIDIA GeForce GTX 1080 Mobile
AMD Radeon RX 5700 (Desktop)
NVIDIA GeForce RTX 2070 Super Mobile
AMD Radeon RX 5700 XT (Desktop)
NVIDIA GeForce RTX 2080 Super Mobile
NVIDIA GeForce RTX 2080 (Desktop)
...
NVIDIA Titan RTX
» With all tested laptops playable in detail settings ultra.
AMD Radeon R4 (Stoney Ridge)
...
NVIDIA GeForce RTX 2070 Super Max-Q
NVIDIA GeForce GTX 1660 Ti (Desktop)
NVIDIA GeForce GTX 1660 Super (Desktop)
NVIDIA Titan RTX
NVIDIA GeForce RTX 2060 Super (Desktop)
AMD Radeon RX Vega 64
AMD Radeon RX 5600 XT (Desktop)
AMD Radeon RX 5700 (Desktop)
AMD Radeon RX 5700 XT (Desktop)
NVIDIA GeForce GTX 1080 (Desktop)
...
...
NVIDIA Quadro RTX 5000 Max-Q
NVIDIA GeForce RTX 2070 Super Max-Q
NVIDIA GeForce GTX 1080 Mobile
NVIDIA GeForce GTX 1080 (Desktop)
AMD Radeon RX Vega 64
NVIDIA GeForce RTX 2060 (Desktop)
NVIDIA GeForce RTX 2060 Super (Desktop)
AMD Radeon RX 5700 (Desktop)
NVIDIA GeForce RTX 2070 Super Mobile
NVIDIA GeForce RTX 2080 Super Mobile
...
Intel UHD Graphics Xe 32EUs (Tiger Lake-H)
...
NVIDIA GeForce GTX 1080 Mobile
NVIDIA GeForce RTX 2070 Super Max-Q
NVIDIA GeForce GTX 1080 (Desktop)
AMD Radeon RX 5600 XT (Desktop)
AMD Radeon RX Vega 64
NVIDIA GeForce RTX 2060 (Desktop)
AMD Radeon RX 5700 (Desktop)
NVIDIA GeForce RTX 2060 Super (Desktop)
NVIDIA GeForce RTX 2070 Super Mobile
NVIDIA GeForce RTX 2080 Super Mobile
...
...
NVIDIA GeForce GTX 1080 Mobile
NVIDIA Quadro RTX 5000 Max-Q
NVIDIA GeForce RTX 2070 Super Max-Q
AMD Radeon RX 5600 XT (Desktop)
NVIDIA GeForce GTX 1080 (Desktop)
NVIDIA GeForce RTX 2060 (Desktop)
AMD Radeon RX Vega 64
AMD Radeon RX 5700 (Desktop)
NVIDIA GeForce RTX 2060 Super (Desktop)
NVIDIA GeForce RTX 2070 Super Mobile
AMD Radeon RX 5700 XT (Desktop)
NVIDIA GeForce RTX 2080 Super Mobile
...
NVIDIA GeForce GTX 1650 Super (Desktop)
...
NVIDIA GeForce GTX 1080 Mobile
NVIDIA Quadro RTX 5000 Max-Q
NVIDIA GeForce RTX 2070 Super Max-Q
NVIDIA GeForce GTX 1080 (Desktop)
AMD Radeon RX 5600 XT (Desktop)
NVIDIA GeForce RTX 2060 (Desktop)
AMD Radeon RX Vega 64
AMD Radeon RX 5700 (Desktop)
NVIDIA GeForce RTX 2060 Super (Desktop)
NVIDIA GeForce RTX 2070 Super Mobile
AMD Radeon RX 5700 XT (Desktop)
...
...
NVIDIA GeForce GTX 1080 Mobile
NVIDIA GeForce RTX 2070 Super Max-Q
NVIDIA GeForce GTX 1080 (Desktop)
NVIDIA Quadro RTX 5000 Max-Q
AMD Radeon RX 5600 XT (Desktop)
NVIDIA GeForce RTX 2060 (Desktop)
AMD Radeon RX 5700 (Desktop)
AMD Radeon RX Vega 64
NVIDIA GeForce RTX 2060 Super (Desktop)
NVIDIA GeForce RTX 2070 Super Mobile
AMD Radeon RX 5700 XT (Desktop)
...
» With all tested laptops playable in detail settings ultra.
...
NVIDIA GeForce GTX 1660 Ti (Desktop)
NVIDIA GeForce RTX 2070 Super Mobile
NVIDIA GeForce RTX 2080 Super Mobile
NVIDIA GeForce RTX 2060 Super (Desktop)
AMD Radeon VII
NVIDIA Titan RTX
...
NVIDIA GeForce GTX 1080 (Desktop)
AMD Radeon RX 5700 (Desktop)
NVIDIA GeForce RTX 2070 Super Mobile
AMD Radeon RX 5700 XT (Desktop)
NVIDIA GeForce RTX 2080 Super Mobile
AMD Radeon VII
NVIDIA GeForce RTX 2060 Super (Desktop)
NVIDIA Titan RTX
...
NVIDIA GeForce GTX 1080 (Desktop)
NVIDIA GeForce RTX 2080 Super Mobile
AMD Radeon RX 5700 XT (Desktop)
NVIDIA GeForce RTX 2070 Super Mobile
NVIDIA GeForce RTX 2060 Super (Desktop)
AMD Radeon VII
NVIDIA Titan RTX
...
NVIDIA GeForce GTX 1080 (Desktop)
NVIDIA GeForce RTX 2060 Super (Desktop)
NVIDIA GeForce RTX 2070 Super Mobile
AMD Radeon VII
NVIDIA GeForce RTX 2080 Super Mobile
NVIDIA GeForce RTX 2080 (Desktop)
...
...
AMD Radeon RX 5700 XT (Desktop)
NVIDIA GeForce RTX 2060 Super (Desktop)
NVIDIA GeForce GTX 1080 (Desktop)
NVIDIA GeForce RTX 2070 Super Mobile
AMD Radeon VII
NVIDIA GeForce GTX 1660 Ti (Desktop)
NVIDIA GeForce RTX 2080 Super Mobile
NVIDIA GeForce RTX 2080 (Desktop)
...
» With all tested laptops playable in detail settings ultra.
AMD Radeon R4 (Stoney Ridge)
...
AMD Radeon RX 5700 (Desktop)
AMD Radeon RX 5700 XT (Desktop)
NVIDIA GeForce GTX 1660 Ti (Desktop)
AMD Radeon RX 5600 XT (Desktop)
NVIDIA GeForce GTX 1660 (Desktop)
NVIDIA GeForce GTX 1660 Super (Desktop)
NVIDIA GeForce GTX 1060 (Desktop)
NVIDIA GeForce RTX 2060 (Desktop)
NVIDIA Titan RTX
NVIDIA GeForce GTX 1080 (Desktop)
NVIDIA GeForce RTX 2080 (Desktop)
...
NVIDIA GeForce RTX 2070 Super Max-Q
NVIDIA GeForce RTX 2080 Super Mobile
AMD Radeon RX 5700 (Desktop)
NVIDIA GeForce RTX 2070 Super Mobile
AMD Radeon RX 5700 XT (Desktop)
AMD Radeon RX 5600 XT (Desktop)
NVIDIA GeForce RTX 2060 (Desktop)
NVIDIA Titan RTX
NVIDIA GeForce GTX 1080 (Desktop)
NVIDIA GeForce RTX 2080 (Desktop)
Intel Iris Plus Graphics G7 (Ice Lake 64 EU)
...
NVIDIA GeForce RTX 2060 Super (Desktop)
AMD Radeon RX Vega 64
NVIDIA GeForce RTX 2070 Super Mobile
AMD Radeon RX 5700 XT (Desktop)
AMD Radeon RX 5700 (Desktop)
NVIDIA GeForce RTX 2060 (Desktop)
NVIDIA GeForce GTX 1080 (Desktop)
NVIDIA Titan RTX
NVIDIA GeForce RTX 2080 (Desktop)
...
NVIDIA GeForce RTX 2060 Super (Desktop)
NVIDIA GeForce RTX 2060 (Desktop)
AMD Radeon RX 5700 XT (Desktop)
AMD Radeon RX 5700 (Desktop)
NVIDIA GeForce GTX 1080 (Desktop)
NVIDIA GeForce RTX 2070 Super Mobile
NVIDIA Titan RTX
NVIDIA GeForce RTX 2080 (Desktop)
...
NVIDIA GeForce RTX 2060 Super (Desktop)
AMD Radeon RX 5700 (Desktop)
NVIDIA GeForce RTX 2080 Super Mobile
AMD Radeon RX 5700 XT (Desktop)
NVIDIA GeForce RTX 2070 Super Mobile
NVIDIA GeForce RTX 2080 (Desktop)
...
NVIDIA Titan RTX
NVIDIA GeForce GTX 1050 Ti Mobile
...
NVIDIA GeForce GTX 1080 (Desktop)
AMD Radeon RX 5700 (Desktop)
NVIDIA GeForce RTX 2060 Super (Desktop)
AMD Radeon RX 5700 XT (Desktop)
NVIDIA GeForce RTX 2070 Super Mobile
NVIDIA GeForce RTX 2080 Super Mobile
NVIDIA GeForce RTX 2080 (Desktop)
...
NVIDIA Titan RTX
» With all tested laptops playable in detail settings ultra.
...
NVIDIA GeForce GTX 1080 Mobile
AMD Radeon RX 5700 (Desktop)
NVIDIA GeForce RTX 2060 Super (Desktop)
AMD Radeon RX 5600 XT (Desktop)
AMD Radeon RX Vega 64
NVIDIA GeForce RTX 2060 (Desktop)
AMD Radeon VII
NVIDIA GeForce GTX 1080 (Desktop)
AMD Radeon RX 5700 XT (Desktop)
NVIDIA Titan RTX
...
NVIDIA GeForce RTX 2080 (Desktop)
...
NVIDIA GeForce RTX 2060 (Desktop)
AMD Radeon RX 5600 XT (Desktop)
NVIDIA GeForce RTX 2060 Super (Desktop)
NVIDIA GeForce RTX 2070 Super Mobile
NVIDIA GeForce RTX 2080 Super Mobile
AMD Radeon RX 5700 XT (Desktop)
AMD Radeon RX Vega 64
AMD Radeon VII
NVIDIA GeForce RTX 2080 (Desktop)
NVIDIA Titan RTX
...
AMD Radeon RX 5600 XT (Desktop)
NVIDIA GeForce RTX 2070 Super Max-Q
NVIDIA GeForce GTX 1080 Mobile
AMD Radeon RX Vega 64
NVIDIA GeForce GTX 1080 (Desktop)
NVIDIA GeForce RTX 2060 Super (Desktop)
AMD Radeon RX 5700 XT (Desktop)
NVIDIA GeForce RTX 2060 (Desktop)
NVIDIA GeForce RTX 2070 Super Mobile
AMD Radeon VII
NVIDIA GeForce RTX 2080 Super Mobile
...
NVIDIA Titan RTX
...
NVIDIA GeForce GTX 1080 Mobile
NVIDIA GeForce GTX 1080 (Desktop)
NVIDIA GeForce RTX 2060 (Desktop)
AMD Radeon RX Vega 64
NVIDIA GeForce RTX 2070 Super Mobile
NVIDIA GeForce RTX 2060 Super (Desktop)
AMD Radeon RX 5700 XT (Desktop)
NVIDIA GeForce RTX 2080 Super Mobile
AMD Radeon VII
NVIDIA GeForce RTX 2080 (Desktop)
...
NVIDIA GeForce GTX 1050 Max-Q
...
NVIDIA GeForce GTX 1080 Mobile
NVIDIA GeForce GTX 1080 (Desktop)
NVIDIA GeForce RTX 2070 Super Mobile
NVIDIA GeForce RTX 2060 (Desktop)
AMD Radeon RX Vega 64
AMD Radeon RX 5700 XT (Desktop)
NVIDIA GeForce RTX 2060 Super (Desktop)
NVIDIA GeForce RTX 2080 Super Mobile
AMD Radeon VII
NVIDIA GeForce RTX 2080 (Desktop)
...
NVIDIA GeForce GTX 1050 Ti Mobile
...
NVIDIA GeForce RTX 2070 Super Max-Q
NVIDIA GeForce RTX 2070 Super Mobile
NVIDIA GeForce GTX 1080 (Desktop)
NVIDIA GeForce RTX 2060 (Desktop)
AMD Radeon RX Vega 64
AMD Radeon RX 5700 XT (Desktop)
NVIDIA GeForce RTX 2060 Super (Desktop)
NVIDIA GeForce RTX 2080 Super Mobile
AMD Radeon VII
NVIDIA GeForce RTX 2080 (Desktop)
...
» With all tested laptops playable in detail settings ultra.
Additional Benchmarks
Maximum Settings with Raytracing T2X Filmic SMAA 1920x1080
42.8 [X] Nvidia Titan X (Pascal) AMD Ryzen 9 3900X 3.8GHz
Titan X Pascal
P1:
24.6 fps
Maximum Settings with Raytracing T2X Filmic SMAA 3840x2160
15.3 [X] Nvidia Titan X (Pascal) AMD Ryzen 9 3900X 3.8GHz
Titan X Pascal
P1:
8.2 fps
AMD Radeon R5 (Bristol Ridge)
...
AMD Radeon RX 5700 XT (Desktop)
NVIDIA GeForce GTX 1660 Super (Desktop)
NVIDIA GeForce GTX 1080 (Desktop)
NVIDIA GeForce RTX 2080 (Desktop)
NVIDIA GeForce RTX 2060 (Desktop)
AMD Radeon VII
NVIDIA Titan RTX
...
AMD Radeon VII
NVIDIA GeForce RTX 2070 Super Mobile
NVIDIA GeForce RTX 2080 Super Mobile
NVIDIA GeForce RTX 2060 Super (Desktop)
NVIDIA GeForce RTX 2080 (Desktop)
NVIDIA Titan RTX
...
AMD Radeon RX 5700 (Desktop)
NVIDIA GeForce RTX 2060 Super (Desktop)
AMD Radeon VII
NVIDIA GeForce RTX 2080 (Desktop)
NVIDIA Titan RTX
...
NVIDIA GeForce RTX 2080 Super Mobile
AMD Radeon RX 5700 (Desktop)
NVIDIA GeForce GTX 1080 (Desktop)
AMD Radeon VII
NVIDIA GeForce RTX 2080 (Desktop)
NVIDIA Titan RTX
NVIDIA GeForce GTX 1050 Max-Q
...
AMD Radeon RX 5700 (Desktop)
AMD Radeon RX 5700 XT (Desktop)
AMD Radeon VII
NVIDIA GeForce RTX 2080 (Desktop)
NVIDIA Titan RTX
NVIDIA GeForce GTX 1050 Max-Q
...
NVIDIA GeForce GTX 1080 Mobile
NVIDIA GeForce GTX 1080 (Desktop)
NVIDIA GeForce RTX 2070 Super Mobile
AMD Radeon RX 5700 XT (Desktop)
NVIDIA GeForce RTX 2080 Super Mobile
AMD Radeon RX 5700 (Desktop)
AMD Radeon VII
NVIDIA GeForce RTX 2080 (Desktop)
NVIDIA Titan RTX
...
» With all tested laptops playable in detail settings ultra.
...
NVIDIA Quadro RTX 5000 Max-Q
NVIDIA GeForce GTX 1660 Ti (Desktop)
AMD Radeon RX 5600 XT (Desktop)
AMD Radeon RX 5700 (Desktop)
AMD Radeon RX 5700 XT (Desktop)
NVIDIA GeForce RTX 2060 Super (Desktop)
NVIDIA GeForce RTX 2080 (Desktop)
NVIDIA GeForce GTX 1080 (Desktop)
NVIDIA GeForce RTX 2060 (Desktop)
...
NVIDIA Quadro RTX 5000 Max-Q
NVIDIA GeForce RTX 2070 Super Max-Q
NVIDIA GeForce RTX 2060 Super (Desktop)
AMD Radeon RX 5700 (Desktop)
AMD Radeon RX 5600 XT (Desktop)
NVIDIA GeForce GTX 1080 (Desktop)
NVIDIA GeForce RTX 2060 (Desktop)
NVIDIA GeForce RTX 2080 Super Mobile
NVIDIA GeForce RTX 2070 Super Mobile
AMD Radeon RX 5700 XT (Desktop)
NVIDIA GeForce RTX 2080 (Desktop)
...
NVIDIA Titan RTX
...
NVIDIA GeForce RTX 2070 Super Max-Q
AMD Radeon RX 5700 (Desktop)
NVIDIA Quadro RTX 5000 Max-Q
NVIDIA GeForce RTX 2060 Super (Desktop)
NVIDIA GeForce GTX 1080 (Desktop)
NVIDIA GeForce RTX 2060 (Desktop)
NVIDIA GeForce RTX 2080 Super Mobile
NVIDIA GeForce RTX 2070 Super Mobile
AMD Radeon RX 5700 XT (Desktop)
NVIDIA GeForce RTX 2080 (Desktop)
...
NVIDIA Titan RTX
...
NVIDIA GeForce RTX 2070 Super Max-Q
AMD Radeon RX 5700 (Desktop)
NVIDIA GeForce GTX 1660 Ti (Desktop)
NVIDIA GeForce RTX 2060 (Desktop)
NVIDIA GeForce RTX 2060 Super (Desktop)
NVIDIA GeForce GTX 1080 (Desktop)
NVIDIA GeForce RTX 2080 Super Mobile
AMD Radeon RX 5600 XT (Desktop)
AMD Radeon RX 5700 XT (Desktop)
NVIDIA GeForce RTX 2080 (Desktop)
...
NVIDIA GeForce GTX 1050 Max-Q
...
AMD Radeon RX 5700 (Desktop)
NVIDIA GeForce RTX 2060 (Desktop)
NVIDIA GeForce GTX 1080 (Desktop)
NVIDIA GeForce GTX 1660 Ti (Desktop)
NVIDIA GeForce RTX 2060 Super (Desktop)
NVIDIA GeForce RTX 2070 Super Mobile
NVIDIA GeForce RTX 2080 Super Mobile
AMD Radeon RX 5600 XT (Desktop)
NVIDIA GeForce RTX 2080 (Desktop)
NVIDIA Titan RTX
...
NVIDIA GeForce RTX 2060 (Desktop)
NVIDIA GeForce RTX 2070 Super Max-Q
NVIDIA GeForce GTX 1080 (Desktop)
NVIDIA GeForce RTX 2060 Super (Desktop)
NVIDIA GeForce RTX 2070 Super Mobile
AMD Radeon RX 5700 XT (Desktop)
AMD Radeon RX 5600 XT (Desktop)
NVIDIA GeForce RTX 2080 (Desktop)
NVIDIA Titan RTX
» With all tested laptops playable in detail settings ultra.
...
NVIDIA GeForce GTX 1080 Mobile
NVIDIA GeForce GTX 1660 Ti (Desktop)
NVIDIA GeForce GTX 1660 Super (Desktop)
NVIDIA GeForce GTX 1660 (Desktop)
NVIDIA Titan RTX
AMD Radeon RX 5600 XT (Desktop)
NVIDIA GeForce RTX 2060 Super (Desktop)
NVIDIA GeForce GTX 1060 (Desktop)
...
...
NVIDIA GeForce GTX 1660 Ti (Desktop)
NVIDIA GeForce GTX 1060 (Desktop)
NVIDIA GeForce GTX 1660 Super (Desktop)
NVIDIA GeForce GTX 1660 (Desktop)
NVIDIA Titan RTX
NVIDIA GeForce RTX 2060 Super (Desktop)
NVIDIA GeForce RTX 2070 Super Max-Q
AMD Radeon RX 5600 XT (Desktop)
NVIDIA GeForce GTX 1080 (Desktop)
...
...
NVIDIA GeForce GTX 1660 Ti (Desktop)
NVIDIA GeForce RTX 2070 Super Max-Q
NVIDIA GeForce GTX 1060 (Desktop)
NVIDIA GeForce GTX 1660 Super (Desktop)
NVIDIA Titan RTX
NVIDIA GeForce RTX 2060 Super (Desktop)
AMD Radeon RX 5600 XT (Desktop)
NVIDIA GeForce GTX 1080 (Desktop)
NVIDIA GeForce RTX 2070 Super Mobile
...
...
NVIDIA GeForce GTX 1660 Ti (Desktop)
AMD Radeon RX 480 (Desktop)
NVIDIA GeForce RTX 2070 Super Max-Q
AMD Radeon RX 570 (Desktop)
NVIDIA GeForce GTX 1660 Super (Desktop)
NVIDIA Titan RTX
AMD Radeon RX 5600 XT (Desktop)
NVIDIA GeForce RTX 2060 Super (Desktop)
NVIDIA GeForce GTX 1080 (Desktop)
NVIDIA GeForce RTX 2080 Super Mobile
...
AMD Radeon RX 5700 (Desktop)
...
NVIDIA GeForce GTX 1660 Ti (Desktop)
AMD Radeon RX 5600 XT (Desktop)
NVIDIA GeForce GTX 1660 Super (Desktop)
NVIDIA Titan RTX
NVIDIA GeForce GTX 1080 (Desktop)
NVIDIA GeForce RTX 2060 Super (Desktop)
NVIDIA GeForce RTX 2070 Super Max-Q
NVIDIA GeForce RTX 2060 (Desktop)
AMD Radeon RX Vega 64
NVIDIA GeForce RTX 2080 Super Mobile
...
...
NVIDIA GeForce GTX 1080 (Desktop)
AMD Radeon RX Vega 64
NVIDIA GeForce RTX 2060 (Desktop)
NVIDIA GeForce RTX 2060 Super (Desktop)
NVIDIA GeForce RTX 2070 Super Max-Q
AMD Radeon RX 5700 (Desktop)
AMD Radeon RX 5700 XT (Desktop)
NVIDIA GeForce RTX 2070 Super Mobile
NVIDIA GeForce RTX 2080 Super Mobile
NVIDIA Titan RTX
NVIDIA GeForce RTX 2080 (Desktop)
» With all tested laptops playable in detail settings ultra.
148.5 [X] Nvidia Titan X (Pascal) AMD Ryzen 9 3900X 3.8GHz
Titan X Pascal
233 [X] Nvidia Titan X (Pascal) AMD Ryzen 9 7900X 4.7GHz
Titan X Pascal
239 [X] Nvidia Titan X (Pascal) AMD Ryzen 9 7950X 4.5GHz
Titan X Pascal
~ 207 fps
+ Compare
- Hide Comparison
...
AMD Radeon RX 5700 XT (Desktop)
NVIDIA GeForce RTX 2060 Super (Desktop)
NVIDIA GeForce GTX 1650 Super (Desktop)
NVIDIA GeForce GTX 1660 (Desktop)
NVIDIA GeForce GTX 1660 Super (Desktop)
AMD Radeon RX 6650 XT
AMD Radeon RX 6750 XT
AMD Radeon RX 6700 XT
...
128.5 [X] Nvidia Titan X (Pascal) AMD Ryzen 9 3900X 3.8GHz
Titan X Pascal
154 [X] Nvidia Titan X (Pascal) AMD Ryzen 9 7900X 4.7GHz
Titan X Pascal
159.3 [X] Nvidia Titan X (Pascal) AMD Ryzen 9 7950X 4.5GHz
Titan X Pascal
~ 147 fps
+ Compare
- Hide Comparison
...
AMD Radeon RX 5700 (Desktop)
AMD Radeon RX 5700 XT (Desktop)
NVIDIA GeForce RTX 3060 Ti
NVIDIA Titan RTX
AMD Radeon RX 6650 XT
...
100.7 [X] Nvidia Titan X (Pascal) AMD Ryzen 9 3900X 3.8GHz
Titan X Pascal
107.5 [X] Nvidia Titan X (Pascal) AMD Ryzen 9 7900X 4.7GHz
Titan X Pascal
109.9 [X] Nvidia Titan X (Pascal) AMD Ryzen 9 7950X 4.5GHz
Titan X Pascal
~ 106 fps
+ Compare
- Hide Comparison
Intel UHD Graphics Xe 16EUs (Tiger Lake-H)
...
NVIDIA GeForce RTX 3060
AMD Radeon RX 5700 XT (Desktop)
NVIDIA GeForce RTX 2080 Super Mobile
NVIDIA GeForce RTX 2080 (Desktop)
NVIDIA GeForce RTX 3060 Ti
AMD Radeon RX 6650 XT
...
81.5 [X] Nvidia Titan X (Pascal) AMD Ryzen 9 3900X 3.8GHz
Titan X Pascal
84.1 [X] Nvidia Titan X (Pascal) AMD Ryzen 9 7900X 4.7GHz
Titan X Pascal
85.8 [X] Nvidia Titan X (Pascal) AMD Ryzen 9 7950X 4.5GHz
Titan X Pascal
~ 84 fps
+ Compare
- Hide Comparison
...
AMD Radeon VII
NVIDIA GeForce RTX 3060
AMD Radeon RX 6650 XT
NVIDIA GeForce RTX 2080 Super Mobile
NVIDIA GeForce RTX 2080 (Desktop)
...
58.3 [X] Nvidia Titan X (Pascal) AMD Ryzen 9 3900X 3.8GHz
Titan X Pascal
59.3 [X] Nvidia Titan X (Pascal) AMD Ryzen 9 7900X 4.7GHz
Titan X Pascal
60.1 [X] Nvidia Titan X (Pascal) AMD Ryzen 9 7950X 4.5GHz
Titan X Pascal
~ 59 fps
+ Compare
- Hide Comparison
...
AMD Radeon RX 5700 XT (Desktop)
AMD Radeon VII
NVIDIA GeForce RTX 3060
AMD Radeon RX 6650 XT
...
32 [X] Nvidia Titan X (Pascal) AMD Ryzen 9 3900X 3.8GHz
Titan X Pascal
32.4 [X] Nvidia Titan X (Pascal) AMD Ryzen 9 7900X 4.7GHz
Titan X Pascal
32.8 [X] Nvidia Titan X (Pascal) AMD Ryzen 9 7950X 4.5GHz
Titan X Pascal
~ 32 fps
+ Compare
- Hide Comparison
...
AMD Radeon RX 5700 XT (Desktop)
AMD Radeon RX 6650 XT
AMD Radeon VII
NVIDIA GeForce RTX 3060
...
» With all tested laptops playable in detail settings ultra.
Additional Benchmarks
Very Low Overall Quality (DX11) 1920x1080
217 [X] Nvidia Titan X (Pascal) AMD Ryzen 9 7950X 4.5GHz
Titan X Pascal
...
...
...
NVIDIA GeForce RTX 2070 Super Mobile
NVIDIA GeForce RTX 2060 Super (Desktop)
AMD Radeon RX 5700 (Desktop)
NVIDIA GeForce RTX 2080 Super Mobile
NVIDIA GeForce RTX 3060
...
...
AMD Radeon RX 5700 (Desktop)
NVIDIA GeForce RTX 2060 Super (Desktop)
NVIDIA GeForce RTX 2070 Super Mobile
NVIDIA GeForce RTX 3060
NVIDIA GeForce RTX 2080 Super Mobile
AMD Radeon VII
...
...
AMD Radeon RX 5700 (Desktop)
NVIDIA GeForce RTX 2060 Super (Desktop)
NVIDIA GeForce RTX 2070 Super Mobile
NVIDIA GeForce RTX 3060
AMD Radeon VII
AMD Radeon RX 6650 XT
NVIDIA GeForce RTX 2080 Super Mobile
...
NVIDIA GeForce GTX 1050 Ti Mobile
...
NVIDIA GeForce RTX 2060 (Desktop)
AMD Radeon RX 5700 (Desktop)
NVIDIA GeForce RTX 2060 Super (Desktop)
NVIDIA GeForce RTX 2070 Super Mobile
NVIDIA GeForce RTX 3060
AMD Radeon RX 6650 XT
AMD Radeon VII
...
» With all tested laptops playable in detail settings high.
Additional Benchmarks
High Quality Preset & High Ray Tracing Preset (DX12) 1920x1080
22.1 [X] Nvidia Titan X (Pascal) AMD Ryzen 9 3900X 3.8GHz
Titan X Pascal
min:
19 fps, max:
25 fps
...
NVIDIA GeForce GTX 1080 Mobile
NVIDIA GeForce RTX 2060 Super (Desktop)
NVIDIA GeForce RTX 2060 (Desktop)
AMD Radeon RX 5700 (Desktop)
AMD Radeon RX 580 (Desktop)
AMD Radeon RX 570 (Desktop)
NVIDIA GeForce RTX 2080 (Desktop)
NVIDIA GeForce GTX 1060 (Desktop)
...
NVIDIA GeForce GTX 1660 Super (Desktop)
...
NVIDIA GeForce RTX 2060 Super (Desktop)
NVIDIA GeForce RTX 2070 Super Max-Q
AMD Radeon RX Vega 64
AMD Radeon RX 5700 (Desktop)
NVIDIA GeForce RTX 2070 Super Mobile
NVIDIA GeForce RTX 2060 (Desktop)
NVIDIA GeForce GTX 1080 (Desktop)
NVIDIA GeForce RTX 2080 (Desktop)
NVIDIA GeForce RTX 2080 Super Mobile
AMD Radeon RX 5700 XT (Desktop)
...
...
NVIDIA GeForce GTX 1080 (Desktop)
NVIDIA GeForce RTX 2080 (Desktop)
AMD Radeon RX Vega 64
AMD Radeon RX 5700 (Desktop)
NVIDIA GeForce RTX 2080 Super Mobile
NVIDIA GeForce RTX 2070 Super Mobile
AMD Radeon RX 5600 XT (Desktop)
AMD Radeon RX 5700 XT (Desktop)
...
...
AMD Radeon RX 5600 XT (Desktop)
NVIDIA GeForce RTX 2060 Super (Desktop)
AMD Radeon RX 5700 (Desktop)
NVIDIA GeForce GTX 1080 (Desktop)
AMD Radeon RX Vega 64
NVIDIA GeForce RTX 2060 (Desktop)
NVIDIA Titan RTX
NVIDIA GeForce RTX 2070 Super Max-Q
AMD Radeon RX 5700 XT (Desktop)
NVIDIA GeForce RTX 2080 (Desktop)
...
NVIDIA GeForce RTX 2070 Super Mobile
...
NVIDIA GeForce GTX 1080 Mobile
NVIDIA Quadro RTX 5000 Max-Q
NVIDIA GeForce GTX 1660 Ti (Desktop)
NVIDIA GeForce RTX 2060 Super (Desktop)
NVIDIA GeForce RTX 2060 (Desktop)
AMD Radeon RX 5700 (Desktop)
NVIDIA GeForce GTX 1080 (Desktop)
NVIDIA GeForce RTX 2070 Super Max-Q
AMD Radeon RX 5700 XT (Desktop)
NVIDIA GeForce RTX 2070 Super Mobile
...
...
NVIDIA GeForce GTX 1660 Ti (Desktop)
NVIDIA GeForce GTX 1080 Mobile
NVIDIA Quadro RTX 5000 Max-Q
NVIDIA GeForce RTX 2060 (Desktop)
AMD Radeon RX Vega 64
AMD Radeon RX 5600 XT (Desktop)
NVIDIA GeForce RTX 2060 Super (Desktop)
NVIDIA GeForce RTX 2070 Super Max-Q
NVIDIA GeForce GTX 1080 (Desktop)
AMD Radeon RX 5700 XT (Desktop)
NVIDIA GeForce RTX 2070 Super Mobile
...
NVIDIA Titan RTX
» With all tested laptops playable in detail settings ultra.
...
NVIDIA Quadro RTX 5000 Max-Q
NVIDIA Titan RTX
NVIDIA GeForce GTX 1660 Super (Desktop)
NVIDIA GeForce GTX 1660 (Desktop)
AMD Radeon RX 5700 XT (Desktop)
NVIDIA GeForce RTX 2060 Super (Desktop)
NVIDIA GeForce GTX 1660 Ti (Desktop)
AMD Radeon RX Vega 64
AMD Radeon RX 5700 (Desktop)
Apple M1 Max 32-Core GPU
AMD Radeon RX 5600 XT (Desktop)
...
...
NVIDIA GeForce RTX 2070 Super Max-Q
AMD Radeon RX 5700 XT (Desktop)
AMD Radeon RX 5700 (Desktop)
NVIDIA GeForce RTX 2060 Super (Desktop)
NVIDIA Titan RTX
NVIDIA GeForce RTX 3060 Ti
...
...
NVIDIA GeForce GTX 1080 (Desktop)
NVIDIA GeForce RTX 2060 Super (Desktop)
NVIDIA Titan RTX
NVIDIA GeForce RTX 3060 Ti
...
...
AMD Radeon RX 5700 (Desktop)
NVIDIA GeForce GTX 1080 (Desktop)
NVIDIA GeForce RTX 2060 Super (Desktop)
NVIDIA GeForce RTX 3060 Ti
...
...
Apple M1 Max 32-Core GPU
AMD Radeon RX 5700 (Desktop)
AMD Radeon RX 5700 XT (Desktop)
NVIDIA GeForce RTX 2060 Super (Desktop)
NVIDIA GeForce GTX 1080 (Desktop)
NVIDIA GeForce RTX 3060 Ti
...
...
AMD Radeon RX 5700 (Desktop)
NVIDIA Quadro RTX 5000 Max-Q
Apple M1 Max 32-Core GPU
AMD Radeon RX 5700 XT (Desktop)
NVIDIA GeForce RTX 2060 Super (Desktop)
NVIDIA GeForce GTX 1080 (Desktop)
NVIDIA GeForce RTX 3060 Ti
NVIDIA Titan RTX
...
» With all tested laptops playable in detail settings ultra.
...
NVIDIA GeForce RTX 2060 (Desktop)
NVIDIA GeForce GTX 1660 Super (Desktop)
AMD Radeon RX 5600 XT (Desktop)
AMD Radeon RX 5700 (Desktop)
NVIDIA GeForce GTX 1660 Ti (Desktop)
NVIDIA Quadro RTX 5000 Max-Q
NVIDIA GeForce GTX 1080 (Desktop)
AMD Radeon RX Vega 64
NVIDIA GeForce RTX 2060 Super (Desktop)
AMD Radeon RX 5700 XT (Desktop)
NVIDIA GeForce RTX 2080 (Desktop)
NVIDIA Titan RTX
...
...
AMD Radeon RX 5600 XT (Desktop)
NVIDIA Quadro RTX 5000 Max-Q
NVIDIA GeForce GTX 1080 (Desktop)
NVIDIA GeForce RTX 2070 Super Max-Q
AMD Radeon RX Vega 64
NVIDIA GeForce RTX 2060 Super (Desktop)
AMD Radeon RX 5700 XT (Desktop)
NVIDIA GeForce RTX 2070 Super Mobile
NVIDIA GeForce RTX 2080 Super Mobile
NVIDIA GeForce RTX 2080 (Desktop)
...
...
NVIDIA GeForce RTX 2070 Super Max-Q
NVIDIA GeForce GTX 1080 (Desktop)
AMD Radeon RX 5700 XT (Desktop)
AMD Radeon RX Vega 64
NVIDIA GeForce RTX 2060 Super (Desktop)
NVIDIA GeForce RTX 2070 Super Mobile
NVIDIA GeForce RTX 2080 Super Mobile
NVIDIA GeForce RTX 2080 (Desktop)
...
...
AMD Radeon RX 5600 XT (Desktop)
NVIDIA GeForce RTX 2070 Super Max-Q
NVIDIA GeForce GTX 1080 (Desktop)
AMD Radeon RX 5700 XT (Desktop)
AMD Radeon RX Vega 64
NVIDIA GeForce RTX 2060 Super (Desktop)
NVIDIA GeForce RTX 2070 Super Mobile
NVIDIA GeForce RTX 2080 Super Mobile
NVIDIA GeForce RTX 2080 (Desktop)
...
...
NVIDIA GeForce GTX 1080 (Desktop)
NVIDIA GeForce RTX 2060 (Desktop)
AMD Radeon RX 5700 (Desktop)
AMD Radeon RX 5700 XT (Desktop)
AMD Radeon RX Vega 64
NVIDIA GeForce RTX 2060 Super (Desktop)
NVIDIA GeForce RTX 2070 Super Mobile
NVIDIA GeForce RTX 2080 Super Mobile
NVIDIA GeForce RTX 2080 (Desktop)
...
NVIDIA GeForce GTX 1050 Max-Q
...
NVIDIA GeForce GTX 1080 (Desktop)
AMD Radeon RX 5700 (Desktop)
AMD Radeon RX Vega 64
AMD Radeon RX 5700 XT (Desktop)
NVIDIA GeForce RTX 2060 Super (Desktop)
NVIDIA GeForce RTX 2070 Super Mobile
NVIDIA GeForce RTX 2080 Super Mobile
NVIDIA GeForce RTX 2080 (Desktop)
...
» With all tested laptops playable in detail settings ultra.
...
AMD Radeon Pro 560X
NVIDIA GeForce RTX 2080 (Desktop)
NVIDIA GeForce GTX 1660 Ti (Desktop)
NVIDIA GeForce GTX 1660 (Desktop)
NVIDIA Quadro RTX 5000 Max-Q
AMD Radeon RX 5600 XT (Desktop)
NVIDIA Titan RTX
AMD Radeon RX 570 (Desktop)
AMD Radeon RX 580 (Desktop)
NVIDIA GeForce GTX 1660 Super (Desktop)
...
...
AMD Radeon RX 5700 (Desktop)
NVIDIA GeForce RTX 2060 (Desktop)
AMD Radeon RX 5600 XT (Desktop)
AMD Radeon RX 570 (Desktop)
NVIDIA GeForce GTX 1660 (Desktop)
NVIDIA Quadro RTX 5000 Max-Q
NVIDIA GeForce GTX 1660 Ti (Desktop)
AMD Radeon RX 580 (Desktop)
NVIDIA GeForce GTX 1060 (Desktop)
...
...
NVIDIA Titan RTX
NVIDIA GeForce RTX 2080 (Desktop)
NVIDIA GeForce GTX 1660 Ti (Desktop)
NVIDIA Quadro RTX 4000 (Laptop)
AMD Radeon RX Vega 64
NVIDIA GeForce RTX 2060 Super (Desktop)
NVIDIA GeForce RTX 2070 Super Max-Q
NVIDIA GeForce GTX 1080 (Desktop)
...
...
NVIDIA Quadro RTX 4000 (Laptop)
NVIDIA GeForce RTX 2080 (Desktop)
AMD Radeon RX 5700 XT (Desktop)
NVIDIA Titan RTX
AMD Radeon RX 6700 XT
NVIDIA GeForce RTX 2070 Super Max-Q
...
...
NVIDIA Quadro RTX 4000 (Laptop)
NVIDIA GeForce GTX 1080 (Desktop)
AMD Radeon RX 5700 XT (Desktop)
AMD Radeon RX 6700 XT
NVIDIA GeForce RTX 3060 Ti
NVIDIA GeForce RTX 3060
NVIDIA Titan RTX
NVIDIA GeForce RTX 2080 (Desktop)
...
...
NVIDIA GeForce GTX 1080 (Desktop)
NVIDIA Quadro RTX 4000 (Laptop)
NVIDIA GeForce RTX 3060
NVIDIA GeForce RTX 2070 Super Mobile
AMD Radeon RX 6650 XT
AMD Radeon RX 5700 XT (Desktop)
NVIDIA GeForce RTX 2060 Super (Desktop)
NVIDIA GeForce RTX 2080 Super Mobile
AMD Radeon VII
AMD Radeon RX 6700 XT
NVIDIA GeForce RTX 2080 (Desktop)
...
» With all tested laptops playable in detail settings ultra.
...
AMD Radeon RX 5600 XT (Desktop)
NVIDIA GeForce GTX 1660 Ti (Desktop)
NVIDIA GeForce RTX 2080 (Desktop)
NVIDIA GeForce RTX 2060 (Desktop)
NVIDIA Quadro RTX 4000 (Laptop)
NVIDIA GeForce GTX 1060 (Desktop)
NVIDIA GeForce GTX 1660 (Desktop)
NVIDIA GeForce RTX 2060 Super (Desktop)
AMD Radeon VII
NVIDIA GeForce GTX 1660 Super (Desktop)
...
AMD Radeon RX 6700 XT
...
AMD Radeon RX 5700 XT (Desktop)
AMD Radeon RX Vega 64
NVIDIA GeForce RTX 2060 (Desktop)
NVIDIA GeForce GTX 1080 (Desktop)
NVIDIA GeForce RTX 2060 Super (Desktop)
AMD Radeon VII
NVIDIA GeForce RTX 2080 (Desktop)
NVIDIA Titan RTX
NVIDIA GeForce RTX 2080 Super Mobile
NVIDIA GeForce RTX 2070 Super Mobile
...
...
NVIDIA GeForce RTX 2060 (Desktop)
NVIDIA GeForce RTX 2070 Super Max-Q
AMD Radeon VII
NVIDIA GeForce GTX 1080 (Desktop)
NVIDIA GeForce RTX 2060 Super (Desktop)
NVIDIA GeForce RTX 2070 Super Mobile
NVIDIA GeForce RTX 2080 (Desktop)
NVIDIA GeForce RTX 3060
NVIDIA Titan RTX
...
...
AMD Radeon VII
NVIDIA GeForce GTX 1080 (Desktop)
NVIDIA GeForce RTX 3060
NVIDIA GeForce RTX 2080 Super Mobile
NVIDIA GeForce RTX 2080 (Desktop)
NVIDIA GeForce RTX 3060 Ti
...
...
NVIDIA GeForce RTX 2070 Super Mobile
AMD Radeon VII
NVIDIA GeForce GTX 1080 (Desktop)
NVIDIA GeForce RTX 3060
NVIDIA GeForce RTX 3060 Ti
AMD Radeon RX 6700 XT
NVIDIA GeForce RTX 2080 (Desktop)
...
...
NVIDIA GeForce GTX 1080 (Desktop)
NVIDIA GeForce RTX 3060
AMD Radeon VII
NVIDIA GeForce RTX 2080 Super Mobile
AMD Radeon RX 6700 XT
NVIDIA GeForce RTX 3060 Ti
NVIDIA GeForce RTX 2080 (Desktop)
...
» With all tested laptops playable in detail settings ultra.
...
NVIDIA GeForce GTX 1060 (Desktop)
NVIDIA GeForce RTX 2060 (Desktop)
AMD Radeon RX 5600 XT (Desktop)
NVIDIA GeForce RTX 2060 Super (Desktop)
NVIDIA GeForce GTX 1660 Ti (Desktop)
AMD Radeon RX Vega 56
AMD Radeon RX 5700 XT (Desktop)
AMD Radeon VII
...
NVIDIA GeForce GTX 1660 Super (Desktop)
...
NVIDIA GeForce RTX 2060 (Desktop)
NVIDIA GeForce GTX 1080 (Desktop)
NVIDIA GeForce GTX 1660 Ti (Desktop)
NVIDIA GeForce GTX 1660 Super (Desktop)
NVIDIA GeForce RTX 2080 (Desktop)
AMD Radeon RX Vega 64
NVIDIA Titan RTX
NVIDIA GeForce RTX 2080 Super Mobile
NVIDIA Quadro RTX 5000 Max-Q
AMD Radeon VII
NVIDIA Quadro RTX 4000 (Laptop)
NVIDIA GeForce RTX 2070 Super Max-Q
...
...
NVIDIA GeForce GTX 1660 Super (Desktop)
AMD Radeon RX 5700 (Desktop)
NVIDIA GeForce RTX 2060 (Desktop)
AMD Radeon RX Vega 64
NVIDIA Quadro RTX 4000 (Laptop)
NVIDIA GeForce RTX 2070 Super Max-Q
NVIDIA GeForce RTX 2080 (Desktop)
NVIDIA Quadro RTX 5000 Max-Q
NVIDIA GeForce RTX 2080 Super Mobile
NVIDIA Titan RTX
AMD Radeon VII
AMD Radeon RX Vega 56
NVIDIA GeForce RTX 2060 Super (Desktop)
NVIDIA GeForce RTX 2070 Super Mobile
...
Intel Iris Plus Graphics G4 (Ice Lake 48 EU)
...
AMD Radeon RX Vega 64
NVIDIA Quadro RTX 5000 Max-Q
NVIDIA GeForce RTX 2080 Super Mobile
AMD Radeon RX Vega 56
NVIDIA GeForce RTX 2070 Super Mobile
AMD Radeon RX 5600 XT (Desktop)
AMD Radeon RX 5700 (Desktop)
AMD Radeon VII
NVIDIA GeForce RTX 2060 Super (Desktop)
NVIDIA GeForce RTX 2080 (Desktop)
AMD Radeon RX 5700 XT (Desktop)
...
...
AMD Radeon RX Vega 56
NVIDIA GeForce RTX 2070 Super Mobile
AMD Radeon RX 5600 XT (Desktop)
NVIDIA GeForce RTX 2080 Super Mobile
AMD Radeon RX 5700 (Desktop)
NVIDIA GeForce RTX 2060 Super (Desktop)
AMD Radeon VII
NVIDIA GeForce RTX 2080 (Desktop)
AMD Radeon RX 5700 XT (Desktop)
NVIDIA Titan RTX
...
NVIDIA GeForce GTX 1050 Max-Q
...
NVIDIA GeForce RTX 2060 (Desktop)
NVIDIA GeForce GTX 1080 (Desktop)
AMD Radeon RX Vega 56
AMD Radeon RX Vega 64
AMD Radeon RX 5600 XT (Desktop)
AMD Radeon RX 5700 (Desktop)
NVIDIA GeForce RTX 2060 Super (Desktop)
AMD Radeon RX 5700 XT (Desktop)
AMD Radeon VII
NVIDIA GeForce RTX 2080 (Desktop)
NVIDIA Titan RTX
» With all tested laptops playable in detail settings ultra.
...
NVIDIA GeForce GTX 1080 Mobile
AMD Radeon RX 5700 XT (Desktop)
NVIDIA Titan RTX
AMD Radeon RX 570 (Desktop)
AMD Radeon RX 580 (Desktop)
NVIDIA GeForce GTX 1660 Ti (Desktop)
AMD Radeon RX Vega 64
AMD Radeon RX Vega 56
NVIDIA GeForce RTX 2060 Super (Desktop)
NVIDIA GeForce RTX 2080 (Desktop)
AMD Radeon VII
NVIDIA GeForce RTX 2060 (Desktop)
...
...
NVIDIA GeForce GTX 1080 Mobile
NVIDIA GeForce GTX 1660 Ti (Desktop)
AMD Radeon RX Vega 64
AMD Radeon RX 5700 XT (Desktop)
NVIDIA GeForce GTX 1660 Super (Desktop)
NVIDIA Titan RTX
AMD Radeon VII
AMD Radeon RX Vega 56
NVIDIA GeForce RTX 2060 (Desktop)
NVIDIA GeForce RTX 2080 (Desktop)
NVIDIA GeForce RTX 2060 Super (Desktop)
NVIDIA GeForce GTX 1080 (Desktop)
...
AMD Radeon RX Vega 6 (Ryzen 2000/3000)
...
AMD Radeon RX 5700 (Desktop)
NVIDIA Titan RTX
AMD Radeon VII
AMD Radeon RX Vega 64
AMD Radeon RX 5700 XT (Desktop)
NVIDIA GeForce RTX 2060 (Desktop)
AMD Radeon RX Vega 56
NVIDIA GeForce GTX 1080 (Desktop)
NVIDIA GeForce RTX 2060 Super (Desktop)
NVIDIA GeForce RTX 2080 (Desktop)
AMD Radeon RX Vega 8 (Ryzen 2000/3000)
...
NVIDIA GeForce GTX 1660 Ti (Desktop)
NVIDIA GeForce GTX 1660 Super (Desktop)
AMD Radeon RX 5700 (Desktop)
NVIDIA GeForce RTX 2060 (Desktop)
AMD Radeon RX 5700 XT (Desktop)
AMD Radeon RX Vega 56
AMD Radeon VII
NVIDIA Titan RTX
AMD Radeon RX Vega 64
NVIDIA GeForce GTX 1080 (Desktop)
NVIDIA GeForce RTX 2080 (Desktop)
NVIDIA GeForce RTX 2060 Super (Desktop)
...
...
NVIDIA GeForce GTX 1660 Super (Desktop)
NVIDIA GeForce GTX 1660 Ti (Desktop)
NVIDIA GeForce GTX 1080 Mobile
AMD Radeon RX Vega 56
NVIDIA GeForce RTX 2060 (Desktop)
NVIDIA GeForce GTX 1080 (Desktop)
AMD Radeon RX Vega 64
NVIDIA GeForce RTX 2060 Super (Desktop)
AMD Radeon RX 5700 (Desktop)
AMD Radeon VII
AMD Radeon RX 5700 XT (Desktop)
NVIDIA GeForce RTX 2080 (Desktop)
...
...
NVIDIA GeForce GTX 1660 Ti (Desktop)
NVIDIA GeForce RTX 2060 (Desktop)
NVIDIA GeForce GTX 1080 Mobile
NVIDIA GeForce GTX 1080 (Desktop)
AMD Radeon RX Vega 56
AMD Radeon RX Vega 64
NVIDIA GeForce RTX 2060 Super (Desktop)
AMD Radeon RX 5700 (Desktop)
AMD Radeon RX 5700 XT (Desktop)
AMD Radeon VII
NVIDIA GeForce RTX 2080 (Desktop)
...
NVIDIA Titan RTX
» With all tested laptops playable in detail settings ultra.
117 [X] Nvidia Titan X (Pascal) AMD Ryzen 7 2700X 3.7GHz
Titan X Pascal
min:
89 fps, max:
169 fps
194 [X] Nvidia Titan X (Pascal) AMD Ryzen 9 7900X 4.7GHz
Titan X Pascal
min:
145 fps, max:
290 fps
200 [X] Nvidia Titan X (Pascal) AMD Ryzen 9 7950X 4.5GHz
Titan X Pascal
min:
150 fps, max:
300 fps
~ 170 fps
+ Compare
- Hide Comparison
+ 📈 Graph
- 📈 Hide Graph
0 100 200 Tooltip : Ø193.9 (145-290)
: Ø199.9 (150-300)
...
AMD Radeon RX 5700 (Desktop)
AMD Radeon RX 5600 XT (Desktop)
NVIDIA GeForce GTX 1660 Super (Desktop)
AMD Radeon RX 6700 XT
AMD Radeon RX 6750 XT
AMD Radeon RX 6650 XT
...
103 [X] Nvidia Titan X (Pascal) AMD Ryzen 7 2700X 3.7GHz
Titan X Pascal
min:
81 fps, max:
152 fps
150 [X] Nvidia Titan X (Pascal) AMD Ryzen 9 7900X 4.7GHz
Titan X Pascal
min:
127 fps, max:
183 fps
154 [X] Nvidia Titan X (Pascal) AMD Ryzen 9 7950X 4.5GHz
Titan X Pascal
min:
131 fps, max:
187 fps
~ 136 fps
+ Compare
- Hide Comparison
+ 📈 Graph
- 📈 Hide Graph
0 100 Tooltip : Ø150.4 (127-183)
: Ø154 (131-187)
...
NVIDIA Titan RTX
AMD Radeon RX 5700 (Desktop)
AMD Radeon RX 5700 XT (Desktop)
AMD Radeon RX 6700 XT
AMD Radeon RX 6750 XT
AMD Radeon RX 6650 XT
...
99 [X] Nvidia Titan X (Pascal) AMD Ryzen 7 2700X 3.7GHz
Titan X Pascal
min:
78 fps, max:
143 fps
140 [X] Nvidia Titan X (Pascal) AMD Ryzen 9 7900X 4.7GHz
Titan X Pascal
min:
118 fps, max:
168 fps
144 [X] Nvidia Titan X (Pascal) AMD Ryzen 9 7950X 4.5GHz
Titan X Pascal
min:
122 fps, max:
172 fps
~ 128 fps
+ Compare
- Hide Comparison
+ 📈 Graph
- 📈 Hide Graph
0 100 Tooltip : Ø140.1 (118-168)
: Ø144.4 (122-172)
...
AMD Radeon RX 5700 (Desktop)
NVIDIA Titan RTX
AMD Radeon RX 5700 XT (Desktop)
AMD Radeon RX 6700 XT
AMD Radeon RX 6750 XT
AMD Radeon RX 6650 XT
...
90 [X] Nvidia Titan X (Pascal) AMD Ryzen 7 2700X 3.7GHz
Titan X Pascal
min:
63 fps, max:
143 fps
127 [X] Nvidia Titan X (Pascal) AMD Ryzen 9 7900X 4.7GHz
Titan X Pascal
min:
100 fps, max:
162 fps
131 [X] Nvidia Titan X (Pascal) AMD Ryzen 9 7950X 4.5GHz
Titan X Pascal
min:
98 fps, max:
165 fps
~ 116 fps
+ Compare
- Hide Comparison
+ 📈 Graph
- 📈 Hide Graph
0 100 Tooltip : Ø127.1 (100-162)
: Ø130.8 (98-165)
Intel UHD Graphics Xe 16EUs (Tiger Lake-H)
...
AMD Radeon RX 5700 XT (Desktop)
AMD Radeon RX 5600 XT (Desktop)
NVIDIA GeForce RTX 3060 Ti
AMD Radeon RX 5700 (Desktop)
NVIDIA Titan RTX
AMD Radeon RX 6700 XT
AMD Radeon RX 6750 XT
AMD Radeon RX 6650 XT
...
84 [X] Nvidia Titan X (Pascal) AMD Ryzen 7 2700X 3.7GHz
Titan X Pascal
min:
63 fps, max:
119 fps
101 [X] Nvidia Titan X (Pascal) AMD Ryzen 9 7900X 4.7GHz
Titan X Pascal
min:
80 fps, max:
123 fps
102 [X] Nvidia Titan X (Pascal) AMD Ryzen 9 7950X 4.5GHz
Titan X Pascal
min:
80 fps, max:
125 fps
~ 96 fps
+ Compare
- Hide Comparison
+ 📈 Graph
- 📈 Hide Graph
0 100 Tooltip : Ø100.6 (80-123)
: Ø102.4 (80-125)
...
NVIDIA GeForce RTX 2070 Super Mobile
NVIDIA GeForce RTX 2080 (Desktop)
NVIDIA GeForce RTX 2080 Super Mobile
AMD Radeon RX 5700 XT (Desktop)
NVIDIA GeForce RTX 3060 Ti
NVIDIA Titan RTX
...
55 [X] Nvidia Titan X (Pascal) AMD Ryzen 9 7900X 4.7GHz
Titan X Pascal
min:
45 fps, max:
68 fps
56 [X] Nvidia Titan X (Pascal) AMD Ryzen 7 2700X 3.7GHz
Titan X Pascal
min:
46 fps, max:
69 fps
56 [X] Nvidia Titan X (Pascal) AMD Ryzen 9 7950X 4.5GHz
Titan X Pascal
min:
45 fps, max:
69 fps
~ 56 fps
+ Compare
- Hide Comparison
+ 📈 Graph
- 📈 Hide Graph
0 Tooltip : Ø55.1 (45-68)
: Ø56.2 (45-69)
...
NVIDIA GeForce RTX 2080 Super Mobile
AMD Radeon Pro W6800
AMD Radeon RX 5700 XT (Desktop)
AMD Radeon RX 6650 XT
AMD Radeon VII
NVIDIA GeForce RTX 2080 (Desktop)
NVIDIA GeForce RTX 3060 Ti
...
» With all tested laptops playable in detail settings ultra.
127.7 [X] Nvidia Titan X (Pascal) AMD Ryzen 7 2700X 3.7GHz
Titan X Pascal
min:
72 fps, max:
195 fps
240 [X] Nvidia Titan X (Pascal) AMD Ryzen 9 7900X 4.7GHz
Titan X Pascal
min:
107.17 fps, max:
421.76 fps
246 [X] Nvidia Titan X (Pascal) AMD Ryzen 9 7950X 4.5GHz
Titan X Pascal
min:
113.22 fps, max:
430.29 fps
~ 205 fps
+ Compare
- Hide Comparison
...
NVIDIA Titan RTX
AMD Radeon RX 5700 (Desktop)
NVIDIA GeForce RTX 3060 Ti
AMD Radeon RX 5600 XT (Desktop)
AMD Radeon RX 5700 XT (Desktop)
...
103.3 [X] Nvidia Titan X (Pascal) AMD Ryzen 7 2700X 3.7GHz
Titan X Pascal
min:
50 fps, max:
164 fps
123.5 [X] Nvidia Titan X (Pascal) AMD Ryzen 9 7900X 4.7GHz
Titan X Pascal
min:
53.95 fps, max:
224.47 fps
129.2 [X] Nvidia Titan X (Pascal) AMD Ryzen 9 7950X 4.5GHz
Titan X Pascal
min:
55.99 fps, max:
230.95 fps
~ 119 fps
+ Compare
- Hide Comparison
...
NVIDIA GeForce RTX 2070 Super Mobile
AMD Radeon VII
NVIDIA GeForce RTX 2080 Super Mobile
AMD Radeon Pro W6800
NVIDIA GeForce RTX 3060 Ti
...
81.2 [X] Nvidia Titan X (Pascal) AMD Ryzen 7 2700X 3.7GHz
Titan X Pascal
min:
38 fps, max:
133 fps
91.3 [X] Nvidia Titan X (Pascal) AMD Ryzen 9 7900X 4.7GHz
Titan X Pascal
min:
42.69 fps, max:
171.38 fps
95 [X] Nvidia Titan X (Pascal) AMD Ryzen 9 7950X 4.5GHz
Titan X Pascal
min:
44.68 fps, max:
164.18 fps
~ 89 fps
+ Compare
- Hide Comparison
...
NVIDIA GeForce RTX 2070 Super Mobile
AMD Radeon VII
AMD Radeon RX 5700 XT (Desktop)
NVIDIA GeForce RTX 2080 (Desktop)
NVIDIA GeForce RTX 2080 Super Mobile
NVIDIA GeForce RTX 3060 Ti
4x NVIDIA RTX A6000
...
67.3 [X] Nvidia Titan X (Pascal) AMD Ryzen 7 2700X 3.7GHz
Titan X Pascal
min:
34 fps, max:
112 fps
72.1 [X] Nvidia Titan X (Pascal) AMD Ryzen 9 7900X 4.7GHz
Titan X Pascal
min:
36.4 fps, max:
137.68 fps
74.8 [X] Nvidia Titan X (Pascal) AMD Ryzen 9 7950X 4.5GHz
Titan X Pascal
min:
38.26 fps, max:
131.94 fps
~ 71 fps
+ Compare
- Hide Comparison
...
NVIDIA GeForce RTX 2070 Super Mobile
AMD Radeon VII
AMD Radeon RX 5700 XT (Desktop)
NVIDIA GeForce RTX 3060 Ti
NVIDIA GeForce RTX 2080 (Desktop)
...
54.2 [X] Nvidia Titan X (Pascal) AMD Ryzen 7 2700X 3.7GHz
Titan X Pascal
min:
31 fps, max:
87 fps
57.5 [X] Nvidia Titan X (Pascal) AMD Ryzen 9 7900X 4.7GHz
Titan X Pascal
min:
31.72 fps, max:
112.16 fps
59.3 [X] Nvidia Titan X (Pascal) AMD Ryzen 9 7950X 4.5GHz
Titan X Pascal
min:
32.93 fps, max:
102.57 fps
~ 57 fps
+ Compare
- Hide Comparison
...
NVIDIA GeForce RTX 2070 Super Mobile
NVIDIA GeForce RTX 2080 Super Mobile
AMD Radeon VII
AMD Radeon RX 5700 XT (Desktop)
AMD Radeon RX 6650 XT
NVIDIA GeForce RTX 2080 (Desktop)
NVIDIA GeForce RTX 3060 Ti
...
AMD Radeon Pro W6800
35.3 [X] Nvidia Titan X (Pascal) AMD Ryzen 7 2700X 3.7GHz
Titan X Pascal
min:
23 fps, max:
52 fps
36.3 [X] Nvidia Titan X (Pascal) AMD Ryzen 9 7900X 4.7GHz
Titan X Pascal
min:
22.64 fps, max:
57.32 fps
37.1 [X] Nvidia Titan X (Pascal) AMD Ryzen 9 7950X 4.5GHz
Titan X Pascal
min:
23.11 fps, max:
56.55 fps
~ 36 fps
+ Compare
- Hide Comparison
NVIDIA GeForce GTX 1050 Ti Max-Q
...
NVIDIA GeForce RTX 3060
NVIDIA GeForce RTX 2070 Super Mobile
AMD Radeon RX 5700 XT (Desktop)
NVIDIA GeForce RTX 2080 Super Mobile
AMD Radeon RX 6650 XT
AMD Radeon VII
...
» With all tested laptops playable in detail settings ultra.
...
...
NVIDIA GeForce GTX 1660 Ti (Desktop)
NVIDIA GeForce GTX 1080 Mobile
NVIDIA GeForce RTX 2070 Super Mobile
NVIDIA GeForce GTX 1080 (Desktop)
NVIDIA GeForce RTX 2060 Super (Desktop)
AMD Radeon RX 5700 (Desktop)
NVIDIA Quadro RTX 5000 Max-Q
NVIDIA GeForce RTX 2060 (Desktop)
...
...
NVIDIA GeForce GTX 1080 Mobile
NVIDIA GeForce GTX 1080 (Desktop)
AMD Radeon RX Vega 64
NVIDIA GeForce RTX 2060 (Desktop)
NVIDIA GeForce RTX 2070 Super Max-Q
AMD Radeon RX 5700 XT (Desktop)
NVIDIA GeForce RTX 2070 Super Mobile
NVIDIA GeForce RTX 2060 Super (Desktop)
...
...
NVIDIA GeForce GTX 1080 (Desktop)
AMD Radeon RX Vega 64
AMD Radeon RX 5600 XT (Desktop)
NVIDIA GeForce RTX 2060 (Desktop)
NVIDIA GeForce RTX 2070 Super Max-Q
AMD Radeon RX 5700 (Desktop)
NVIDIA Quadro RTX 5000 Max-Q
AMD Radeon RX 5700 XT (Desktop)
NVIDIA GeForce RTX 2070 Super Mobile
...
...
NVIDIA GeForce GTX 1080 (Desktop)
AMD Radeon RX Vega 64
NVIDIA GeForce RTX 2060 (Desktop)
AMD Radeon RX 5700 (Desktop)
NVIDIA Quadro RTX 5000 Max-Q
NVIDIA GeForce RTX 2070 Super Max-Q
NVIDIA GeForce RTX 2060 Super (Desktop)
AMD Radeon RX 5700 XT (Desktop)
NVIDIA GeForce RTX 2070 Super Mobile
...
...
NVIDIA Quadro RTX 5000 Max-Q
AMD Radeon RX 5700 (Desktop)
NVIDIA GeForce RTX 2070 Super Max-Q
NVIDIA GeForce RTX 2060 Super (Desktop)
AMD Radeon RX 5700 XT (Desktop)
NVIDIA GeForce RTX 2070 Super Mobile
NVIDIA GeForce RTX 2080 Super Mobile
NVIDIA GeForce RTX 2080 (Desktop)
...
» With all tested laptops playable in detail settings ultra.
...
NVIDIA Quadro RTX 4000 (Laptop)
NVIDIA GeForce GTX 1080 Mobile
NVIDIA GeForce GTX 1660 Super (Desktop)
NVIDIA GeForce GTX 1660 Ti (Desktop)
NVIDIA GeForce RTX 2060 (Desktop)
NVIDIA GeForce GTX 1080 (Desktop)
NVIDIA GeForce RTX 2060 Super (Desktop)
NVIDIA GeForce RTX 2080 (Desktop)
NVIDIA Titan RTX
...
AMD Radeon RX 5700 XT (Desktop)
NVIDIA GeForce GTX 1660 Super (Desktop)
NVIDIA Quadro RTX 4000 (Laptop)
NVIDIA GeForce RTX 2060 (Desktop)
NVIDIA GeForce GTX 1080 Mobile
NVIDIA GeForce GTX 1080 (Desktop)
NVIDIA GeForce RTX 2070 Super Max-Q
NVIDIA GeForce RTX 2060 Super (Desktop)
NVIDIA GeForce RTX 2080 Super Mobile
NVIDIA GeForce RTX 2070 Super Mobile
NVIDIA GeForce RTX 2080 (Desktop)
...
NVIDIA Titan RTX
Intel Iris Plus Graphics G7 (Ice Lake 64 EU)
...
NVIDIA GeForce RTX 2060 (Desktop)
NVIDIA GeForce RTX 2070 Super Max-Q
NVIDIA GeForce GTX 1080 Mobile
AMD Radeon VII
NVIDIA GeForce GTX 1080 (Desktop)
AMD Radeon RX 5700 XT (Desktop)
NVIDIA GeForce RTX 2060 Super (Desktop)
NVIDIA GeForce RTX 2070 Super Mobile
NVIDIA GeForce RTX 2080 Super Mobile
NVIDIA GeForce RTX 2080 (Desktop)
...
NVIDIA Titan RTX
...
NVIDIA GeForce RTX 2070 Super Max-Q
NVIDIA GeForce GTX 1080 Mobile
NVIDIA GeForce GTX 1080 (Desktop)
AMD Radeon VII
NVIDIA GeForce RTX 2060 Super (Desktop)
NVIDIA GeForce RTX 2070 Super Mobile
AMD Radeon RX 5700 XT (Desktop)
NVIDIA GeForce RTX 2080 Super Mobile
NVIDIA GeForce RTX 2080 (Desktop)
NVIDIA Titan RTX
...
NVIDIA GeForce RTX 2060 Super (Desktop)
NVIDIA GeForce RTX 2070 Super Mobile
AMD Radeon RX 5700 XT (Desktop)
AMD Radeon VII
NVIDIA GeForce RTX 2080 Super Mobile
NVIDIA GeForce RTX 2080 (Desktop)
NVIDIA Titan RTX
» With all tested laptops playable in detail settings ultra.
...
AMD Radeon RX 5700 (Desktop)
AMD Radeon VII
AMD Radeon RX Vega 56
AMD Radeon RX Vega 64
NVIDIA GeForce GTX 1660 Ti (Desktop)
NVIDIA GeForce GTX 1660 (Desktop)
AMD Radeon RX 5700 XT (Desktop)
AMD Radeon RX 580 (Desktop)
NVIDIA GeForce RTX 2060 Super (Desktop)
...
NVIDIA GeForce GTX 1080 (Desktop)
...
AMD Radeon RX 580 (Desktop)
NVIDIA GeForce GTX 1080 Mobile
NVIDIA GeForce GTX 1060 (Desktop)
NVIDIA GeForce GTX 1660 (Desktop)
AMD Radeon RX 5700 (Desktop)
AMD Radeon RX Vega 64
NVIDIA GeForce GTX 1660 Ti (Desktop)
NVIDIA GeForce GTX 1660 Super (Desktop)
AMD Radeon RX Vega 56
NVIDIA GeForce RTX 2060 Super (Desktop)
...
NVIDIA GeForce RTX 2080 Super Mobile
AMD Radeon RX Vega 6 (Ryzen 2000/3000)
...
AMD Radeon RX 570 (Desktop)
NVIDIA GeForce GTX 1660 Ti (Desktop)
NVIDIA GeForce GTX 1660 Super (Desktop)
AMD Radeon RX Vega 64
AMD Radeon RX 5700 (Desktop)
NVIDIA GeForce RTX 2070 Super Max-Q
NVIDIA Quadro RTX 4000 (Laptop)
NVIDIA GeForce RTX 2060 Super (Desktop)
AMD Radeon RX Vega 56
AMD Radeon VII
NVIDIA GeForce RTX 2060 (Desktop)
...
NVIDIA GeForce RTX 2080 Super Mobile
...
AMD Radeon RX Vega 64
AMD Radeon RX 5700 (Desktop)
NVIDIA Quadro RTX 4000 (Laptop)
NVIDIA GeForce RTX 2070 Super Max-Q
NVIDIA GeForce RTX 2060 (Desktop)
NVIDIA GeForce RTX 2060 Super (Desktop)
AMD Radeon VII
AMD Radeon RX 5700 XT (Desktop)
NVIDIA GeForce GTX 1080 (Desktop)
...
...
NVIDIA GeForce RTX 2060 Super (Desktop)
NVIDIA GeForce RTX 2070 Super Mobile
AMD Radeon VII
NVIDIA GeForce RTX 2080 Super Mobile
NVIDIA GeForce RTX 2080 (Desktop)
NVIDIA Titan RTX
» With all tested laptops playable in detail settings ultra.
...
NVIDIA Quadro RTX 5000 Max-Q
NVIDIA GeForce GTX 1660 Super (Desktop)
AMD Radeon RX Vega M GH
NVIDIA GeForce RTX 2060 Super (Desktop)
NVIDIA GeForce RTX 2060 (Desktop)
NVIDIA Titan RTX
NVIDIA GeForce RTX 3060 Ti
...
...
NVIDIA GeForce RTX 2070 Super Max-Q
NVIDIA GeForce RTX 3060 Ti
NVIDIA GeForce RTX 2060 (Desktop)
AMD Radeon RX Vega 56
AMD Radeon RX Vega 64
NVIDIA GeForce RTX 2080 (Desktop)
NVIDIA Titan RTX
NVIDIA GeForce GTX 1080 (Desktop)
NVIDIA GeForce RTX 2070 Super Mobile
NVIDIA GeForce RTX 2080 Super Mobile
...
...
NVIDIA GeForce RTX 2070 Super Max-Q
AMD Radeon VII
AMD Radeon RX Vega 56
NVIDIA GeForce GTX 1080 (Desktop)
AMD Radeon RX Vega 64
NVIDIA GeForce RTX 2070 Super Mobile
NVIDIA GeForce RTX 2080 (Desktop)
NVIDIA GeForce RTX 2080 Super Mobile
NVIDIA Titan RTX
...
...
NVIDIA GeForce RTX 2070 Super Max-Q
AMD Radeon VII
AMD Radeon RX Vega 56
AMD Radeon RX Vega 64
NVIDIA GeForce RTX 2070 Super Mobile
NVIDIA GeForce RTX 2080 (Desktop)
NVIDIA GeForce RTX 2080 Super Mobile
...
...
NVIDIA GeForce RTX 2070 Super Mobile
NVIDIA GeForce RTX 3060 Ti
NVIDIA GeForce RTX 2080 Super Mobile
AMD Radeon VII
NVIDIA GeForce RTX 2080 (Desktop)
NVIDIA Titan RTX
...
» With all tested laptops playable in detail settings ultra.
...
NVIDIA GeForce GTX 960M
Intel Iris Xe MAX Graphics
AMD Radeon RX Vega M GH
AMD Radeon RX 5700 (Desktop)
NVIDIA GeForce GTX 1050 Ti Mobile
AMD Radeon RX 570 (Desktop)
...
...
AMD Radeon RX Vega M GH
NVIDIA GeForce GTX 1050 Max-Q
NVIDIA GeForce GTX 1050 Ti Mobile
AMD Radeon RX 5700 (Desktop)
NVIDIA GeForce GTX 1050 Ti Max-Q
AMD Radeon RX 570 (Desktop)
AMD Radeon RX Vega 56
...
NVIDIA GeForce GTX 1080 (Desktop)
...
AMD Radeon RX Vega M GH
AMD Radeon RX 5700 (Desktop)
AMD Radeon RX 570 (Desktop)
AMD Radeon RX 580 (Desktop)
AMD Radeon RX Vega 56
AMD Radeon RX Vega 64
NVIDIA GeForce GTX 1080 Mobile
AMD Radeon VII
...
NVIDIA GeForce GTX 1080 (Desktop)
...
AMD Radeon RX 5700 (Desktop)
AMD Radeon RX Vega 56
AMD Radeon RX Vega 64
NVIDIA GeForce GTX 1060 (Desktop)
AMD Radeon VII
NVIDIA GeForce GTX 1080 Mobile
NVIDIA GeForce GTX 1660 (Desktop)
AMD Radeon RX 5700 XT (Desktop)
...
NVIDIA GeForce GTX 1080 (Desktop)
...
NVIDIA GeForce RTX 2060 (Desktop)
NVIDIA GeForce RTX 2060 Super (Desktop)
NVIDIA GeForce GTX 1080 (Desktop)
NVIDIA GeForce RTX 2080 (Desktop)
NVIDIA Titan RTX
» With all tested laptops playable in detail settings ultra.
...
AMD Radeon RX 560X (Laptop)
NVIDIA GeForce GTX 960M
AMD Radeon VII
...
NVIDIA Titan RTX
...
AMD Radeon VII
NVIDIA GeForce GTX 1080 Mobile
...
NVIDIA Titan RTX
...
NVIDIA GeForce GTX 1050 Ti Mobile
NVIDIA GeForce GTX 1080 Mobile
AMD Radeon RX Vega 64
NVIDIA GeForce GTX 1060 (Desktop)
NVIDIA GeForce GTX 1080 (Desktop)
AMD Radeon VII
AMD Radeon RX 580 (Desktop)
...
NVIDIA Titan RTX
AMD Radeon RX Vega 8 (Ryzen 2000/3000)
...
NVIDIA GeForce GTX 1660 Ti (Desktop)
NVIDIA GeForce GTX 1080 Mobile
NVIDIA GeForce GTX 1060 (Desktop)
NVIDIA GeForce GTX 970
AMD Radeon RX Vega 64
AMD Radeon RX 580 (Desktop)
AMD Radeon VII
NVIDIA GeForce GTX 1080 (Desktop)
AMD Radeon RX Vega 56
NVIDIA GeForce RTX 2060 (Desktop)
...
NVIDIA Titan RTX
...
NVIDIA GeForce GTX 1660 Ti (Desktop)
AMD Radeon RX Vega 56
AMD Radeon RX Vega 64
NVIDIA GeForce RTX 2060 (Desktop)
NVIDIA GeForce GTX 1080 Mobile
NVIDIA GeForce GTX 1080 (Desktop)
AMD Radeon VII
NVIDIA Titan RTX
NVIDIA GeForce RTX 2080 (Desktop)
...
NVIDIA Titan RTX
» With all tested laptops playable in detail settings ultra.
Intel HD Graphics (Haswell)
...
NVIDIA GeForce GTX 1050 Ti Max-Q
NVIDIA Quadro RTX 3000 Max-Q
AMD Radeon RX 5300M
AMD Radeon RX 580 (Desktop)
AMD Radeon RX Vega 64
NVIDIA GeForce GTX 1080 (Desktop)
NVIDIA GeForce GTX 1060 (Desktop)
NVIDIA Titan RTX
...
...
NVIDIA GeForce GTX 1080 Mobile
NVIDIA Quadro RTX 3000 Max-Q
AMD Radeon RX 5300M
AMD Radeon RX 570 (Desktop)
NVIDIA GeForce GTX 1060 (Desktop)
AMD Radeon RX 580 (Desktop)
AMD Radeon RX Vega 64
...
NVIDIA GeForce RTX 2080 Super Mobile
AMD Radeon RX Vega 8 (Ryzen 2000/3000)
...
AMD Radeon RX 5300M
NVIDIA Quadro RTX 3000 Max-Q
AMD Radeon RX 570 (Desktop)
NVIDIA GeForce GTX 1060 (Desktop)
AMD Radeon RX 580 (Desktop)
NVIDIA GeForce GTX 1080 (Desktop)
AMD Radeon RX Vega 64
...
AMD Radeon RX Vega 8 (Ryzen 2000/3000)
...
NVIDIA GeForce GTX 1080 Mobile
NVIDIA Quadro RTX 3000 Max-Q
AMD Radeon RX 570 (Desktop)
NVIDIA GeForce GTX 970
NVIDIA GeForce GTX 1060 (Desktop)
AMD Radeon RX 580 (Desktop)
AMD Radeon RX Vega 64
...
...
NVIDIA GeForce RTX 2070 Super Mobile
NVIDIA Quadro RTX 5000 Max-Q
AMD Radeon RX 5700 (Desktop)
NVIDIA GeForce RTX 2080 Super Mobile
AMD Radeon RX 5700 XT (Desktop)
AMD Radeon VII
NVIDIA GeForce RTX 2080 (Desktop)
NVIDIA Titan RTX
» With all tested laptops playable in detail settings ultra.
...
NVIDIA GeForce GTX 1060 (Desktop)
NVIDIA GeForce GTX 1080 (Desktop)
AMD Radeon RX 570 (Desktop)
AMD Radeon RX 5700 (Desktop)
AMD Radeon VII
NVIDIA GeForce RTX 2060 (Desktop)
NVIDIA GeForce GTX 1660 Ti (Desktop)
NVIDIA Titan RTX
AMD Radeon RX 5700 XT (Desktop)
...
...
NVIDIA GeForce GTX 1080 (Desktop)
NVIDIA GeForce RTX 2060 (Desktop)
AMD Radeon VII
NVIDIA GeForce RTX 2060 Super (Desktop)
AMD Radeon RX Vega 56
AMD Radeon RX 5700 (Desktop)
AMD Radeon RX Vega 64
NVIDIA GeForce RTX 2080 (Desktop)
AMD Radeon RX 5700 XT (Desktop)
NVIDIA Titan RTX
...
NVIDIA GeForce RTX 2060 (Desktop)
AMD Radeon VII
AMD Radeon RX Vega 56
NVIDIA GeForce RTX 2060 Super (Desktop)
AMD Radeon RX Vega 64
AMD Radeon RX 5700 (Desktop)
NVIDIA GeForce RTX 2080 (Desktop)
AMD Radeon RX 5700 XT (Desktop)
NVIDIA Titan RTX
...
NVIDIA GeForce RTX 2060 (Desktop)
AMD Radeon RX 5700 XT (Desktop)
NVIDIA GeForce RTX 2060 Super (Desktop)
AMD Radeon VII
AMD Radeon RX Vega 56
AMD Radeon RX Vega 64
NVIDIA GeForce RTX 2080 (Desktop)
NVIDIA Titan RTX
...
AMD Radeon RX 5700 (Desktop)
AMD Radeon RX 5700 XT (Desktop)
AMD Radeon VII
AMD Radeon RX Vega 64
NVIDIA GeForce RTX 2080 (Desktop)
NVIDIA Titan RTX
» With all tested laptops playable in detail settings ultra.
...
NVIDIA GeForce GTX 1660 Ti (Desktop)
NVIDIA GeForce RTX 2080 (Desktop)
NVIDIA Titan RTX
NVIDIA GeForce RTX 2060 Super (Desktop)
NVIDIA GeForce RTX 3060 Ti
...
...
NVIDIA GeForce RTX 2080 Super Mobile
NVIDIA GeForce RTX 2070 Super Max-Q
NVIDIA GeForce RTX 2060 Super (Desktop)
NVIDIA GeForce RTX 2080 (Desktop)
NVIDIA GeForce RTX 3060 Ti
...
...
NVIDIA GeForce RTX 2060 (Desktop)
NVIDIA GeForce RTX 2070 Super Max-Q
NVIDIA GeForce GTX 1080 (Desktop)
NVIDIA GeForce RTX 2060 Super (Desktop)
NVIDIA GeForce RTX 2080 Super Mobile
NVIDIA GeForce RTX 2070 Super Mobile
NVIDIA GeForce RTX 2080 (Desktop)
NVIDIA Titan RTX
NVIDIA GeForce RTX 3060 Ti
...
...
AMD Radeon RX 5700 XT (Desktop)
NVIDIA GeForce GTX 1080 (Desktop)
NVIDIA GeForce RTX 2070 Super Mobile
AMD Radeon VII
NVIDIA GeForce RTX 2080 (Desktop)
NVIDIA GeForce RTX 3060 Ti
NVIDIA Titan RTX
...
...
NVIDIA GeForce RTX 2070 Super Max-Q
NVIDIA GeForce GTX 1080 (Desktop)
AMD Radeon RX 5700 XT (Desktop)
NVIDIA GeForce RTX 2060 Super (Desktop)
NVIDIA GeForce RTX 2070 Super Mobile
NVIDIA GeForce RTX 2080 (Desktop)
AMD Radeon VII
NVIDIA GeForce RTX 3060 Ti
...
» With all tested laptops playable in detail settings ultra.
...
NVIDIA GeForce GTX 1050 Ti Mobile
NVIDIA Quadro P3200
AMD Radeon RX 5700 (Desktop)
NVIDIA GeForce GTX 1060 (Desktop)
AMD Radeon RX 570 (Desktop)
...
...
AMD Radeon RX 580 (Desktop)
NVIDIA GeForce GTX 1080 Mobile
NVIDIA GeForce GTX 1660 Ti (Desktop)
NVIDIA GeForce GTX 1660 (Desktop)
AMD Radeon RX 5700 (Desktop)
NVIDIA GeForce RTX 2060 (Desktop)
NVIDIA GeForce GTX 1080 (Desktop)
AMD Radeon RX Vega 56
...
AMD Radeon RX Vega 6 (Ryzen 2000/3000)
...
NVIDIA GeForce GTX 1080 Mobile
NVIDIA GeForce GTX 1660 Ti (Desktop)
NVIDIA GeForce GTX 1660 (Desktop)
AMD Radeon RX 5700 (Desktop)
NVIDIA GeForce RTX 2060 (Desktop)
AMD Radeon RX Vega 56
NVIDIA GeForce GTX 1660 Super (Desktop)
...
...
NVIDIA GeForce GTX 1080 Mobile
NVIDIA GeForce RTX 2060 (Desktop)
NVIDIA GeForce GTX 1660 Super (Desktop)
AMD Radeon RX Vega 56
AMD Radeon RX 5700 (Desktop)
NVIDIA GeForce RTX 2060 Super (Desktop)
AMD Radeon RX Vega 64
AMD Radeon VII
NVIDIA GeForce RTX 2080 (Desktop)
AMD Radeon RX 5600 XT (Desktop)
...
...
AMD Radeon RX Vega 56
NVIDIA GeForce GTX 1080 Mobile
AMD Radeon RX Vega 64
NVIDIA GeForce GTX 1080 (Desktop)
NVIDIA GeForce RTX 2060 Super (Desktop)
AMD Radeon RX 5700 (Desktop)
AMD Radeon RX 5600 XT (Desktop)
AMD Radeon VII
AMD Radeon RX 5700 XT (Desktop)
NVIDIA GeForce RTX 2080 (Desktop)
...
» With all tested laptops playable in detail settings ultra.
...
NVIDIA GeForce GTX 1050 Ti Mobile
NVIDIA Quadro P1000
NVIDIA GeForce GTX 1080 Mobile
AMD Radeon VII
NVIDIA GeForce RTX 2060 (Desktop)
NVIDIA GeForce GTX 1660 Ti (Desktop)
AMD Radeon RX 570 (Desktop)
NVIDIA GeForce RTX 2080 (Desktop)
...
AMD Radeon RX Vega 6 (Ryzen 2000/3000)
...
NVIDIA GeForce RTX 2060 (Desktop)
NVIDIA GeForce GTX 1080 Mobile
AMD Radeon VII
NVIDIA GeForce GTX 1660 Ti (Desktop)
AMD Radeon RX 570 (Desktop)
NVIDIA GeForce RTX 2080 (Desktop)
...
...
NVIDIA GeForce RTX 2060 (Desktop)
NVIDIA GeForce GTX 1080 Mobile
NVIDIA GeForce GTX 1660 Ti (Desktop)
AMD Radeon VII
NVIDIA GeForce RTX 2080 (Desktop)
NVIDIA Titan RTX
AMD Radeon RX 570 (Desktop)
...
...
NVIDIA GeForce RTX 2060 (Desktop)
AMD Radeon RX 570 (Desktop)
NVIDIA GeForce GTX 1660 Ti (Desktop)
AMD Radeon VII
NVIDIA GeForce RTX 2080 (Desktop)
NVIDIA GeForce GTX 1080 Mobile
NVIDIA Titan RTX
NVIDIA GeForce GTX 1060 (Desktop)
...
...
NVIDIA GeForce GTX 1080 (Desktop)
NVIDIA GeForce RTX 2060 Super (Desktop)
AMD Radeon RX 5700 XT (Desktop)
AMD Radeon RX Vega 56
NVIDIA GeForce RTX 2080 (Desktop)
AMD Radeon VII
NVIDIA Titan RTX
» With all tested laptops playable in detail settings ultra.
117 [X] NVIDIA Titan X Pascal AMD Ryzen Threadripper 1950X 3.4GHz
Titan X Pascal
279 [X] Nvidia Titan X (Pascal) AMD Ryzen 9 7950X 4.5GHz
Titan X Pascal
max:
426.2 fps
285 [X] Nvidia Titan X (Pascal) AMD Ryzen 9 7900X 4.7GHz
Titan X Pascal
max:
492.1 fps
~ 227 fps
+ Compare
- Hide Comparison
...
NVIDIA GeForce RTX 2060 Super (Desktop)
AMD Radeon RX 5700 XT (Desktop)
NVIDIA GeForce RTX 3060 Ti
NVIDIA GeForce GTX 1660 Super (Desktop)
AMD Radeon RX 5600 XT (Desktop)
AMD Radeon RX 5700 (Desktop)
...
112 [X] NVIDIA Titan X Pascal AMD Ryzen Threadripper 1950X 3.4GHz
Titan X Pascal
136.3 [X] Nvidia Titan X (Pascal) AMD Ryzen 9 7950X 4.5GHz
Titan X Pascal
max:
243.5 fps
137.3 [X] Nvidia Titan X (Pascal) AMD Ryzen 9 7900X 4.7GHz
Titan X Pascal
max:
244.5 fps
~ 129 fps
+ Compare
- Hide Comparison
...
AMD Radeon VII
AMD Radeon RX 5600 XT (Desktop)
AMD Radeon RX 5700 (Desktop)
NVIDIA GeForce RTX 2060 Super (Desktop)
NVIDIA GeForce RTX 3060
AMD Radeon RX 5700 XT (Desktop)
NVIDIA GeForce RTX 2080 Super Mobile
...
109 [X] NVIDIA Titan X Pascal AMD Ryzen Threadripper 1950X 3.4GHz
Titan X Pascal
125.9 [X] Nvidia Titan X (Pascal) AMD Ryzen 9 7900X 4.7GHz
Titan X Pascal
max:
210.9 fps
126.2 [X] Nvidia Titan X (Pascal) AMD Ryzen 9 7950X 4.5GHz
Titan X Pascal
max:
222.2 fps
~ 120 fps
+ Compare
- Hide Comparison
AMD Radeon RX Vega 6 (Ryzen 2000/3000)
...
NVIDIA GeForce RTX 2060 Super (Desktop)
AMD Radeon RX 5700 (Desktop)
AMD Radeon VII
NVIDIA GeForce RTX 2080 (Desktop)
AMD Radeon RX 5700 XT (Desktop)
NVIDIA GeForce RTX 3060
...
87 [X] Nvidia Titan X (Pascal) AMD Ryzen 9 7950X 4.5GHz
Titan X Pascal
max:
194.5 fps
103 [X] NVIDIA Titan X Pascal AMD Ryzen Threadripper 1950X 3.4GHz
Titan X Pascal
113.8 [X] Nvidia Titan X (Pascal) AMD Ryzen 9 7900X 4.7GHz
Titan X Pascal
max:
193.1 fps
~ 101 fps
+ Compare
- Hide Comparison
...
NVIDIA GeForce RTX 2060 (Desktop)
NVIDIA GeForce GTX 1080 (Desktop)
AMD Radeon RX 5600 XT (Desktop)
NVIDIA GeForce RTX 2070 Super Max-Q
AMD Radeon RX 5700 (Desktop)
NVIDIA GeForce RTX 2070 Super Mobile
NVIDIA GeForce RTX 2060 Super (Desktop)
...
78 [X] Nvidia Titan X (Pascal) AMD Ryzen 9 7900X 4.7GHz
Titan X Pascal
max:
126.5 fps
78.4 [X] Nvidia Titan X (Pascal) AMD Ryzen 9 7950X 4.5GHz
Titan X Pascal
max:
127.8 fps
~ 78 fps
+ Compare
- Hide Comparison
...
NVIDIA GeForce RTX 2060 Super (Desktop)
NVIDIA GeForce RTX 2070 Super Mobile
AMD Radeon RX 5700 XT (Desktop)
NVIDIA GeForce RTX 3060
NVIDIA GeForce RTX 2080 Super Mobile
...
42.3 [X] Nvidia Titan X (Pascal) AMD Ryzen 9 7950X 4.5GHz
Titan X Pascal
max:
63.5 fps
42.4 [X] Nvidia Titan X (Pascal) AMD Ryzen 9 7900X 4.7GHz
Titan X Pascal
max:
63.3 fps
43 [X] NVIDIA Titan X Pascal AMD Ryzen Threadripper 1950X 3.4GHz
Titan X Pascal
~ 43 fps
+ Compare
- Hide Comparison
...
AMD Radeon RX 6650 XT
NVIDIA GeForce RTX 3060
AMD Radeon VII
NVIDIA GeForce RTX 2080 Super Mobile
NVIDIA GeForce RTX 2080 (Desktop)
...
» With all tested laptops playable in detail settings ultra.
Additional Benchmarks
Lowest Preset 1920x1080
214 [X] Nvidia Titan X (Pascal) AMD Ryzen 9 7950X 4.5GHz
Titan X Pascal
max:
400.3 fps
416 [X] Nvidia Titan X (Pascal) 1.47.22.14 D3D12
AMD Ryzen 9 3900X 3.8GHz
Titan X Pascal
min:
233 fps, P1:
313 fps, max:
675 fps
515 [X] Nvidia Titan X (Pascal) 1.47.22.14 D3D12
AMD Ryzen 9 7900X 4.7GHz
Titan X Pascal
min:
297 fps, P1:
425 fps, max:
742 fps
545 [X] Nvidia Titan X (Pascal) 1.47.22.14 D3D12
AMD Ryzen 9 7950X 4.5GHz
Titan X Pascal
min:
88.5 fps, P1:
447 fps, max:
820 fps
~ 492 fps
+ Compare
- Hide Comparison
...
AMD Radeon RX Vega 64
AMD Radeon RX 5600 XT (Desktop)
NVIDIA GeForce RTX 2060 Super (Desktop)
AMD Radeon RX 5700 (Desktop)
NVIDIA Titan RTX
NVIDIA GeForce RTX 2080 Super Mobile
AMD Radeon RX 5700 XT (Desktop)
...
248 [X] Nvidia Titan X (Pascal) 1.47.22.14 D3D12
AMD Ryzen 9 3900X 3.8GHz
Titan X Pascal
min:
188 fps, P1:
203 fps, max:
352 fps
251 [X] Nvidia Titan X (Pascal) 1.47.22.14 D3D12
AMD Ryzen 9 7900X 4.7GHz
Titan X Pascal
min:
208 fps, P1:
211 fps, max:
335 fps
256 [X] Nvidia Titan X (Pascal) 1.47.22.14 D3D12
AMD Ryzen 9 7950X 4.5GHz
Titan X Pascal
min:
210 fps, P1:
216 fps, max:
384 fps
~ 252 fps
+ Compare
- Hide Comparison
...
NVIDIA GeForce RTX 2060 Super (Desktop)
NVIDIA GeForce RTX 3060 Ti
4x NVIDIA RTX A6000
NVIDIA GeForce RTX 2080 Super Mobile
...
189 [X] Nvidia Titan X (Pascal) 1.47.22.14 D3D12
AMD Ryzen 9 3900X 3.8GHz
Titan X Pascal
min:
138 fps, P1:
141 fps, max:
294 fps
194.2 [X] Nvidia Titan X (Pascal) 1.47.22.14 D3D12
AMD Ryzen 9 7900X 4.7GHz
Titan X Pascal
min:
141.4 fps, P1:
144.3 fps, max:
287 fps
196.9 [X] Nvidia Titan X (Pascal) 1.47.22.14 D3D12
AMD Ryzen 9 7950X 4.5GHz
Titan X Pascal
min:
141.6 fps, P1:
146.6 fps, max:
298 fps
~ 193 fps
+ Compare
- Hide Comparison
...
NVIDIA GeForce RTX 2060 Super (Desktop)
AMD Radeon RX 5700 XT (Desktop)
NVIDIA GeForce RTX 3060 Ti
...
161 [X] Nvidia Titan X (Pascal) 1.47.22.14 D3D12
AMD Ryzen 9 3900X 3.8GHz
Titan X Pascal
min:
121 fps, P1:
124 fps, max:
304 fps
167.4 [X] Nvidia Titan X (Pascal) 1.47.22.14 D3D12
AMD Ryzen 9 7900X 4.7GHz
Titan X Pascal
min:
124.4 fps, P1:
127.7 fps, max:
243 fps
169.5 [X] Nvidia Titan X (Pascal) 1.47.22.14 D3D12
AMD Ryzen 9 7950X 4.5GHz
Titan X Pascal
min:
123.9 fps, P1:
127.8 fps, max:
246 fps
~ 166 fps
+ Compare
- Hide Comparison
...
AMD Radeon RX 5700 (Desktop)
NVIDIA GeForce RTX 2060 Super (Desktop)
AMD Radeon RX 5700 XT (Desktop)
NVIDIA GeForce RTX 3060 Ti
...
117 [X] Nvidia Titan X (Pascal) 1.47.22.14 D3D12
AMD Ryzen 9 3900X 3.8GHz
Titan X Pascal
min:
92.5 fps, P1:
94.6 fps, max:
168 fps
122.3 [X] Nvidia Titan X (Pascal) 1.47.22.14 D3D12
AMD Ryzen 9 7900X 4.7GHz
Titan X Pascal
min:
95.5 fps, P1:
97.3 fps, max:
174.3 fps
122.3 [X] Nvidia Titan X (Pascal) 1.47.22.14 D3D12
AMD Ryzen 9 7950X 4.5GHz
Titan X Pascal
min:
95.7 fps, P1:
97.8 fps, max:
201 fps
~ 121 fps
+ Compare
- Hide Comparison
...
AMD Radeon RX 5700 (Desktop)
NVIDIA GeForce RTX 2060 Super (Desktop)
NVIDIA GeForce RTX 3060
AMD Radeon RX 5700 XT (Desktop)
AMD Radeon RX 6650 XT
...
67.5 [X] Nvidia Titan X (Pascal) 1.47.22.14 D3D12
AMD Ryzen 9 3900X 3.8GHz
Titan X Pascal
min:
54.1 fps, P1:
56.5 fps, max:
92.8 fps
69.5 [X] Nvidia Titan X (Pascal) 1.47.22.14 D3D12
AMD Ryzen 9 7900X 4.7GHz
Titan X Pascal
min:
57.9 fps, P1:
59.5 fps, max:
96.3 fps
69.7 [X] Nvidia Titan X (Pascal) 1.47.22.14 D3D12
AMD Ryzen 9 7950X 4.5GHz
Titan X Pascal
min:
56 fps, P1:
58.4 fps, max:
96.5 fps
~ 69 fps
+ Compare
- Hide Comparison
...
AMD Radeon RX 5700 (Desktop)
AMD Radeon RX 6650 XT
NVIDIA GeForce RTX 2060 Super (Desktop)
NVIDIA GeForce RTX 3060
AMD Radeon RX 5700 XT (Desktop)
...
» With all tested laptops playable in detail settings ultra.
...
NVIDIA GeForce GTX 1050 Ti Mobile
NVIDIA GeForce GTX 1080 Mobile
AMD Radeon RX 580 (Desktop)
AMD Radeon RX Vega 64
NVIDIA Quadro P3200
AMD Radeon RX 480 (Desktop)
NVIDIA GeForce GTX 1060 (Desktop)
AMD Radeon RX 570 (Desktop)
...
AMD Radeon RX Vega 6 (Ryzen 2000/3000)
...
NVIDIA GeForce GTX 1060 (Desktop)
NVIDIA Quadro P5200
AMD Radeon RX Vega 64
NVIDIA GeForce GTX 1660 Ti (Desktop)
NVIDIA Quadro RTX 4000 (Laptop)
AMD Radeon RX Vega 56
NVIDIA GeForce GTX 1080 (Desktop)
NVIDIA GeForce RTX 2060 (Desktop)
...
AMD Radeon RX Vega 6 (Ryzen 2000/3000)
...
NVIDIA Quadro P5200
AMD Radeon RX Vega 64
NVIDIA GeForce GTX 1660 Ti (Desktop)
NVIDIA Quadro RTX 4000 (Laptop)
NVIDIA GeForce GTX 1080 (Desktop)
AMD Radeon RX Vega 56
AMD Radeon VII
...
...
NVIDIA Quadro RTX 4000 (Laptop)
NVIDIA GeForce GTX 1080 Mobile
AMD Radeon RX Vega 64
NVIDIA GeForce GTX 1080 (Desktop)
AMD Radeon RX Vega 56
NVIDIA GeForce RTX 2060 (Desktop)
NVIDIA GeForce RTX 2060 Super (Desktop)
AMD Radeon VII
NVIDIA GeForce RTX 2080 (Desktop)
...
NVIDIA Titan RTX
...
NVIDIA GeForce RTX 2060 (Desktop)
NVIDIA GeForce GTX 1080 (Desktop)
NVIDIA GeForce RTX 2060 Super (Desktop)
AMD Radeon VII
NVIDIA GeForce RTX 2080 (Desktop)
NVIDIA Titan RTX
» With all tested laptops playable in detail settings ultra.
AMD Radeon R4 (Stoney Ridge)
...
NVIDIA GeForce GTX 1080 (Desktop)
AMD Radeon VII
AMD Radeon RX Vega 64
AMD Radeon RX Vega 56
AMD Radeon RX 5700 (Desktop)
AMD Radeon RX 570 (Desktop)
AMD Radeon RX 5700 XT (Desktop)
NVIDIA GeForce RTX 2060 Super (Desktop)
AMD Radeon RX 580 (Desktop)
NVIDIA GeForce GTX 1660 Ti (Desktop)
...
NVIDIA GeForce GTX 1650 Super (Desktop)
...
NVIDIA Quadro P5200
NVIDIA GeForce RTX 2070 Super Max-Q
NVIDIA GeForce RTX 2060 (Desktop)
AMD Radeon VII
NVIDIA GeForce RTX 2060 Super (Desktop)
AMD Radeon RX 5700 XT (Desktop)
NVIDIA GeForce RTX 2070 Super Mobile
NVIDIA GeForce RTX 2080 Super Mobile
NVIDIA GeForce RTX 2080 (Desktop)
NVIDIA Titan RTX
...
NVIDIA GeForce RTX 2060 (Desktop)
AMD Radeon RX 5700 XT (Desktop)
NVIDIA GeForce RTX 2060 Super (Desktop)
AMD Radeon VII
NVIDIA GeForce RTX 2080 Super Mobile
NVIDIA GeForce RTX 2070 Super Mobile
NVIDIA GeForce RTX 2080 (Desktop)
NVIDIA Titan RTX
...
NVIDIA GeForce GTX 1080 (Desktop)
NVIDIA GeForce RTX 2060 Super (Desktop)
AMD Radeon RX 5700 XT (Desktop)
AMD Radeon VII
NVIDIA GeForce RTX 2070 Super Mobile
NVIDIA GeForce RTX 2080 Super Mobile
NVIDIA GeForce RTX 2080 (Desktop)
NVIDIA Titan RTX
NVIDIA GeForce GTX 1050 Max-Q
...
AMD Radeon RX 5700 XT (Desktop)
NVIDIA GeForce RTX 2070 Super Mobile
AMD Radeon VII
NVIDIA GeForce RTX 2060 Super (Desktop)
NVIDIA GeForce RTX 2080 Super Mobile
NVIDIA GeForce RTX 2080 (Desktop)
NVIDIA Titan RTX
» With all tested laptops playable in detail settings ultra.
...
AMD Radeon RX Vega 8 (Ryzen 2000/3000)
AMD Radeon RX 560X (Laptop)
NVIDIA Quadro P600
NVIDIA GeForce GTX 950M
AMD Radeon RX 580 (Desktop)
AMD Radeon Pro 560X
...
AMD Radeon Pro 555
...
AMD Radeon RX 560X (Laptop)
NVIDIA GeForce GTX 1050 Ti Max-Q
NVIDIA GeForce GTX 1050 Ti Mobile
AMD Radeon RX 580 (Desktop)
...
...
AMD Radeon RX 560X (Laptop)
NVIDIA GeForce GTX 1050 Ti Max-Q
NVIDIA GeForce GTX 1050 Ti Mobile
AMD Radeon RX 580 (Desktop)
NVIDIA GeForce RTX 2080 (Desktop)
...
...
AMD Radeon RX Vega M GH
AMD Radeon RX 580 (Desktop)
AMD Radeon RX 570 (Desktop)
...
AMD Radeon RX 480 (Desktop)
...
AMD Radeon VII
NVIDIA GeForce GTX 1080 Mobile
AMD Radeon RX 5700 XT (Desktop)
NVIDIA GeForce GTX 1080 (Desktop)
NVIDIA Titan RTX
NVIDIA GeForce RTX 2080 (Desktop)
...
NVIDIA Titan RTX
» With all tested laptops playable in detail settings ultra.
96 [X] NVIDIA Titan X Pascal AMD Ryzen Threadripper 1950X 3.4GHz
Titan X Pascal
min:
77 fps, max:
116 fps
232 [X] Nvidia Titan X (Pascal) AMD Ryzen 9 7900X 4.7GHz
Titan X Pascal
min:
178 fps, max:
296 fps
242 [X] Nvidia Titan X (Pascal) AMD Ryzen 9 7950X 4.5GHz
Titan X Pascal
min:
188 fps, max:
304 fps
~ 190 fps
+ Compare
- Hide Comparison
+ 📈 Graph
- 📈 Hide Graph
0 100 200 300 Tooltip : Ø232 (178-296)
: Ø242 (188-304)
...
NVIDIA Titan RTX
AMD Radeon RX 5700 (Desktop)
NVIDIA GeForce RTX 3060 Ti
NVIDIA GeForce RTX 2060 Super (Desktop)
NVIDIA GeForce GTX 1660 Super (Desktop)
AMD Radeon RX 5600 XT (Desktop)
AMD Radeon RX 6700 XT
AMD Radeon RX 6750 XT
...
88 [X] NVIDIA Titan X Pascal AMD Ryzen Threadripper 1950X 3.4GHz
Titan X Pascal
min:
72 fps, max:
115 fps
162 [X] Nvidia Titan X (Pascal) AMD Ryzen 9 7900X 4.7GHz
Titan X Pascal
min:
147 fps, max:
178 fps
166 [X] Nvidia Titan X (Pascal) AMD Ryzen 9 7950X 4.5GHz
Titan X Pascal
min:
153 fps, max:
187 fps
~ 139 fps
+ Compare
- Hide Comparison
+ 📈 Graph
- 📈 Hide Graph
0 100 Tooltip : Ø161.7 (147-178)
: Ø166.5 (153-187)
...
AMD Radeon RX 5700 (Desktop)
AMD Radeon RX 5600 XT (Desktop)
AMD Radeon RX 5700 XT (Desktop)
NVIDIA GeForce RTX 3060 Ti
NVIDIA Titan RTX
...
84 [X] NVIDIA Titan X Pascal AMD Ryzen Threadripper 1950X 3.4GHz
Titan X Pascal
min:
69 fps, max:
110 fps
149 [X] Nvidia Titan X (Pascal) AMD Ryzen 9 7900X 4.7GHz
Titan X Pascal
min:
138 fps, max:
176 fps
152 [X] Nvidia Titan X (Pascal) AMD Ryzen 9 7950X 4.5GHz
Titan X Pascal
min:
140 fps, max:
179 fps
~ 128 fps
+ Compare
- Hide Comparison
+ 📈 Graph
- 📈 Hide Graph
0 100 Tooltip : Ø148.6 (138-176)
: Ø152.5 (140-179)
...
NVIDIA GeForce RTX 3060
NVIDIA GeForce RTX 2060 Super (Desktop)
AMD Radeon RX 5700 (Desktop)
AMD Radeon RX 5600 XT (Desktop)
AMD Radeon RX 5700 XT (Desktop)
...
80 [X] NVIDIA Titan X Pascal AMD Ryzen Threadripper 1950X 3.4GHz
Titan X Pascal
min:
64 fps, max:
107 fps
140 [X] Nvidia Titan X (Pascal) AMD Ryzen 9 7900X 4.7GHz
Titan X Pascal
min:
127 fps, max:
161 fps
144 [X] Nvidia Titan X (Pascal) AMD Ryzen 9 7950X 4.5GHz
Titan X Pascal
min:
130 fps, max:
164 fps
~ 121 fps
+ Compare
- Hide Comparison
+ 📈 Graph
- 📈 Hide Graph
0 100 Tooltip : Ø139.5 (127-161)
: Ø144.2 (130-164)
...
NVIDIA GeForce RTX 2060 Super (Desktop)
NVIDIA GeForce RTX 3060
AMD Radeon RX 5700 (Desktop)
AMD Radeon RX 5700 XT (Desktop)
AMD Radeon RX 5600 XT (Desktop)
...
0 100 Tooltip : Ø99.1 (87-118)
: Ø102.6 (92-121)
...
AMD Radeon RX 5700 XT (Desktop)
NVIDIA GeForce RTX 2080 (Desktop)
NVIDIA GeForce RTX 3060 Ti
AMD Radeon RX 6650 XT
...
52 [X] Nvidia Titan X (Pascal) AMD Ryzen 9 7900X 4.7GHz
Titan X Pascal
min:
46 fps, max:
64 fps
53 [X] NVIDIA Titan X Pascal AMD Ryzen Threadripper 1950X 3.4GHz
Titan X Pascal
min:
46 fps, max:
64 fps
53 [X] Nvidia Titan X (Pascal) AMD Ryzen 9 7950X 4.5GHz
Titan X Pascal
min:
46 fps, max:
65 fps
~ 53 fps
+ Compare
- Hide Comparison
+ 📈 Graph
- 📈 Hide Graph
0 Tooltip : Ø52.2 (46-64)
: Ø53.1 (46-65)
...
NVIDIA GeForce RTX 3060
AMD Radeon RX 5700 XT (Desktop)
NVIDIA RTX A6000
AMD Radeon RX 6650 XT
NVIDIA GeForce RTX 2080 (Desktop)
...
» With all tested laptops playable in detail settings ultra.
Additional Benchmarks
Low Preset TAA 1920x1080
187 [X] Nvidia Titan X (Pascal) AMD Ryzen 9 7950X 4.5GHz
Titan X Pascal
min:
168 fps, max:
207 fps
...
NVIDIA GeForce RTX 2060 Super (Desktop)
NVIDIA GeForce GTX 1660 (Desktop)
NVIDIA GeForce GTX 1660 Super (Desktop)
NVIDIA GeForce GTX 1650 Super (Desktop)
NVIDIA GeForce RTX 3070 Ti
...
...
NVIDIA GeForce GTX 1660 (Desktop)
NVIDIA GeForce GTX 1660 Super (Desktop)
NVIDIA GeForce GTX 1650 Super (Desktop)
NVIDIA GeForce RTX 3070 Ti
...
...
NVIDIA GeForce GTX 1660 (Desktop)
NVIDIA GeForce GTX 1660 Super (Desktop)
NVIDIA GeForce GTX 1650 Super (Desktop)
NVIDIA GeForce RTX 3070 Ti
...
...
NVIDIA GeForce RTX 2060 Super (Desktop)
NVIDIA GeForce RTX 3070 Ti
...
» With all tested laptops playable in detail settings high.
...
NVIDIA GeForce GTX 1070 SLI (Desktop)
NVIDIA GeForce GTX 1660 Ti (Desktop)
AMD Radeon RX Vega 56
NVIDIA Titan RTX
NVIDIA GeForce RTX 2080 (Desktop)
AMD Radeon RX 570 (Desktop)
NVIDIA GeForce GTX 1060 (Desktop)
NVIDIA GeForce RTX 2060 Super (Desktop)
AMD Radeon RX 5700 XT (Desktop)
...
...
AMD Radeon RX 5700 (Desktop)
AMD Radeon RX Vega 64
NVIDIA GeForce RTX 2060 (Desktop)
AMD Radeon RX Vega 56
AMD Radeon VII
NVIDIA GeForce GTX 1080 (Desktop)
AMD Radeon RX 5700 XT (Desktop)
NVIDIA Titan RTX
NVIDIA GeForce RTX 2070 Super Max-Q
NVIDIA GeForce RTX 2080 (Desktop)
NVIDIA GeForce RTX 2060 Super (Desktop)
...
...
NVIDIA GeForce GTX 1660 Ti (Desktop)
AMD Radeon RX Vega 64
AMD Radeon RX 5700 (Desktop)
AMD Radeon VII
NVIDIA GeForce RTX 2060 (Desktop)
AMD Radeon RX Vega 56
NVIDIA GeForce GTX 1080 Mobile
NVIDIA GeForce GTX 1080 (Desktop)
NVIDIA Titan RTX
AMD Radeon RX 5700 XT (Desktop)
NVIDIA GeForce RTX 2080 (Desktop)
...
...
NVIDIA GeForce GTX 1660 Ti (Desktop)
AMD Radeon RX 5700 (Desktop)
AMD Radeon RX Vega 64
AMD Radeon RX Vega 56
NVIDIA GeForce RTX 2060 (Desktop)
AMD Radeon VII
AMD Radeon RX 5700 XT (Desktop)
...
...
NVIDIA GeForce RTX 2070 Super Max-Q
AMD Radeon RX Vega 64
AMD Radeon RX 5700 XT (Desktop)
NVIDIA GeForce RTX 2060 Super (Desktop)
AMD Radeon VII
NVIDIA GeForce RTX 2070 Super Mobile
NVIDIA GeForce RTX 2080 Super Mobile
NVIDIA GeForce RTX 2080 (Desktop)
NVIDIA Titan RTX
» With all tested laptops playable in detail settings ultra.
148.9 [X] Intel Xeon E5-2680 v4 2.4GHz
Titan X Pascal
min:
103 fps, max:
185 fps
231 [X] Nvidia Titan X (Pascal) 1.3
AMD Ryzen 9 7900X 4.7GHz
Titan X Pascal
233 [X] Nvidia Titan X (Pascal) 1.3
AMD Ryzen 9 7950X 4.5GHz
Titan X Pascal
~ 204 fps
+ Compare
- Hide Comparison
Intel UHD Graphics (Elkhart Lake 16 EU)
...
NVIDIA GeForce RTX 3060 Ti
NVIDIA GeForce RTX 2080 Super Mobile
AMD Radeon RX 5600 XT (Desktop)
NVIDIA GeForce RTX 2060 Super (Desktop)
AMD Radeon RX 5700 XT (Desktop)
...
124.7 [X] Intel Xeon E5-2680 v4 2.4GHz
Titan X Pascal
min:
86 fps, max:
158 fps
140.5 [X] Nvidia Titan X (Pascal) 1.3
AMD Ryzen 9 7900X 4.7GHz
Titan X Pascal
140.6 [X] Nvidia Titan X (Pascal) 1.3
AMD Ryzen 9 7950X 4.5GHz
Titan X Pascal
~ 135 fps
+ Compare
- Hide Comparison
Intel UHD Graphics (Elkhart Lake 16 EU)
...
NVIDIA GeForce RTX 2080 Super Mobile
AMD Radeon RX 6650 XT
NVIDIA GeForce RTX 3060 Ti
...
91 [X] Intel Xeon E5-2680 v4 2.4GHz
Titan X Pascal
min:
26 fps, max:
147 fps
104.7 [X] Nvidia Titan X (Pascal) 1.3
AMD Ryzen 9 7950X 4.5GHz
Titan X Pascal
105.6 [X] Nvidia Titan X (Pascal) 1.3
AMD Ryzen 9 7900X 4.7GHz
Titan X Pascal
~ 100 fps
+ Compare
- Hide Comparison
...
NVIDIA GeForce RTX 2080 (Desktop)
AMD Radeon RX 6650 XT
NVIDIA GeForce RTX 2080 Super Mobile
NVIDIA GeForce RTX 3060 Ti
...
...
NVIDIA GeForce RTX 2060 Super (Desktop)
NVIDIA GeForce GTX 1660 Super (Desktop)
AMD Radeon RX 6650 XT
NVIDIA GeForce RTX 3060 Ti
NVIDIA GeForce RTX 2080 Super Mobile
...
43.4 [X] Nvidia Titan X (Pascal) 1.3
AMD Ryzen 9 7950X 4.5GHz
Titan X Pascal
43.5 [X] Intel Xeon E5-2680 v4 2.4GHz
Titan X Pascal
min:
26 fps, max:
61 fps
44.3 [X] Nvidia Titan X (Pascal) 1.3
AMD Ryzen 9 7900X 4.7GHz
Titan X Pascal
~ 44 fps
+ Compare
- Hide Comparison
...
NVIDIA GeForce RTX 2080 (Desktop)
NVIDIA GeForce RTX 2080 Super Mobile
NVIDIA GeForce RTX 3060 Ti
AMD Radeon RX 6700 XT
...
» With all tested laptops playable in detail settings high.
...
AMD Radeon RX 570 (Desktop)
AMD Radeon RX 5700 XT (Desktop)
NVIDIA GeForce GTX 1080 (Desktop)
NVIDIA GeForce GTX 1060 (Desktop)
AMD Radeon RX 480 (Desktop)
AMD Radeon RX 580 (Desktop)
NVIDIA GeForce RTX 2060 Super (Desktop)
NVIDIA GeForce GTX 1070 SLI (Desktop)
...
NVIDIA GeForce RTX 2060 (Desktop)
AMD Radeon RX 580 (Laptop)
AMD Radeon VII
NVIDIA GeForce RTX 2080 (Desktop)
AMD Radeon RX 480 (Desktop)
AMD Radeon RX 5700 XT (Desktop)
AMD Radeon RX 570 (Desktop)
NVIDIA GeForce GTX 1060 (Desktop)
NVIDIA GeForce GTX 1660 Ti (Desktop)
...
...
NVIDIA GeForce RTX 2080 (Desktop)
NVIDIA GeForce RTX 2060 Super (Desktop)
NVIDIA GeForce GTX 1070 SLI (Desktop)
NVIDIA Titan RTX
AMD Radeon RX 5700 XT (Desktop)
NVIDIA GeForce GTX 1080 Mobile
NVIDIA GeForce GTX 1080 (Desktop)
Intel Iris Plus Graphics G4 (Ice Lake 48 EU)
...
AMD Radeon RX 5700 XT (Desktop)
NVIDIA GeForce GTX 1080 Mobile
NVIDIA GeForce GTX 1080 (Desktop)
NVIDIA GeForce RTX 2060 Super (Desktop)
NVIDIA GeForce RTX 2080 (Desktop)
...
NVIDIA GeForce GTX 1080 (Desktop)
NVIDIA GeForce RTX 2070 Super Mobile
NVIDIA GeForce RTX 2060 Super (Desktop)
NVIDIA GeForce RTX 2080 Super Mobile
NVIDIA GeForce RTX 2080 (Desktop)
NVIDIA Titan RTX
» With all tested laptops playable in detail settings ultra.
...
NVIDIA GeForce GTX 1070 SLI (Desktop)
NVIDIA GeForce GTX 1080 Mobile
NVIDIA GeForce GTX 1080 (Desktop)
NVIDIA GeForce GTX 1060 (Desktop)
AMD Radeon RX Vega 64
AMD Radeon RX 580 (Desktop)
...
NVIDIA GeForce GTX 1080 Mobile
NVIDIA GeForce GTX 1070 SLI (Desktop)
AMD Radeon RX Vega 64
NVIDIA GeForce GTX 1080 (Desktop)
...
NVIDIA GeForce GTX 1070 SLI (Desktop)
AMD Radeon RX Vega 64
NVIDIA GeForce GTX 1080 Mobile
NVIDIA GeForce GTX 1080 (Desktop)
...
AMD Radeon RX Vega 64
NVIDIA GeForce GTX 1080 Mobile
NVIDIA GeForce GTX 1070 SLI (Desktop)
NVIDIA GeForce GTX 1080 (Desktop)
...
AMD Radeon RX Vega 64
NVIDIA GeForce GTX 1080 Mobile
NVIDIA GeForce GTX 1080 (Desktop)
NVIDIA GeForce GTX 1070 SLI (Desktop)
» With all tested laptops playable in detail settings ultra.
...
AMD Radeon RX 560 (Laptop)
NVIDIA GeForce GTX 950M
AMD Radeon RX 560X (Laptop)
NVIDIA GeForce GTX 960M
AMD Radeon RX 580 (Laptop)
NVIDIA GeForce GTX 1050 Ti Mobile
AMD Radeon RX Vega 64
AMD Radeon RX 580 (Desktop)
NVIDIA Titan RTX
NVIDIA GeForce GTX 1070 SLI (Desktop)
...
NVIDIA GeForce GTX 1060 (Desktop)
...
AMD Radeon RX 580 (Desktop)
AMD Radeon RX 580 (Laptop)
AMD Radeon RX Vega 64
NVIDIA GeForce GTX 1060 (Desktop)
NVIDIA GeForce GTX 1070 SLI (Desktop)
NVIDIA Titan RTX
...
...
AMD Radeon RX 580 (Laptop)
AMD Radeon RX 580 (Desktop)
NVIDIA GeForce GTX 1060 (Desktop)
AMD Radeon RX Vega 64
NVIDIA GeForce GTX 1070 SLI (Desktop)
NVIDIA Titan RTX
...
AMD Radeon RX Vega 8 (Ryzen 2000/3000)
...
NVIDIA GeForce GTX 970
AMD Radeon R9 Fury
AMD Radeon RX 480 (Desktop)
AMD Radeon RX 580 (Desktop)
NVIDIA GeForce GTX 1060 (Desktop)
AMD Radeon RX Vega 64
NVIDIA GeForce GTX 1070 SLI (Desktop)
...
...
AMD Radeon RX Vega 64
NVIDIA GeForce GTX 1080 Mobile
NVIDIA GeForce GTX 1080 (Desktop)
NVIDIA Titan RTX
» With all tested laptops playable in detail settings ultra.
...
NVIDIA GeForce GTX 1060 (Desktop)
NVIDIA GeForce GTX 1070 SLI (Desktop)
NVIDIA GeForce GTX 1080 Mobile
AMD Radeon RX 580 (Desktop)
NVIDIA GeForce GTX 1080 (Desktop)
...
NVIDIA GeForce GTX 1060 (Desktop)
NVIDIA GeForce GTX 1070 SLI (Desktop)
AMD Radeon RX 480 (Desktop)
AMD Radeon RX 580 (Desktop)
NVIDIA GeForce GTX 1080 Mobile
NVIDIA GeForce GTX 1080 (Desktop)
...
NVIDIA GeForce GTX 1070 SLI (Desktop)
AMD Radeon RX 480 (Desktop)
AMD Radeon RX 580 (Desktop)
NVIDIA GeForce GTX 1080 Mobile
NVIDIA GeForce GTX 1080 (Desktop)
...
NVIDIA GeForce GTX 1060 (Desktop)
AMD Radeon RX 480 (Desktop)
NVIDIA GeForce GTX 1070 SLI (Desktop)
AMD Radeon RX 580 (Desktop)
NVIDIA GeForce GTX 1080 Mobile
NVIDIA GeForce GTX 1080 (Desktop)
...
AMD Radeon RX 480 (Desktop)
AMD Radeon RX 580 (Desktop)
NVIDIA GeForce GTX 1070 SLI (Desktop)
NVIDIA GeForce GTX 1080 Mobile
NVIDIA GeForce GTX 1080 (Desktop)
» With all tested laptops playable in detail settings ultra.
...
NVIDIA GeForce GTX 1080 Mobile
NVIDIA GeForce GTX 1080 (Desktop)
NVIDIA GeForce GTX 1060 (Desktop)
NVIDIA GeForce GTX 1660 Ti (Desktop)
NVIDIA GeForce RTX 2060 (Desktop)
NVIDIA GeForce RTX 2080 (Desktop)
NVIDIA Titan RTX
...
...
NVIDIA GeForce GTX 1060 (Desktop)
NVIDIA GeForce GTX 1080 Mobile
NVIDIA GeForce GTX 1660 Super (Desktop)
NVIDIA GeForce GTX 1660 Ti (Desktop)
NVIDIA GeForce GTX 1080 (Desktop)
NVIDIA GeForce RTX 2060 (Desktop)
NVIDIA GeForce RTX 2060 Super (Desktop)
NVIDIA Titan RTX
NVIDIA GeForce RTX 2080 (Desktop)
...
...
NVIDIA GeForce GTX 1660 Super (Desktop)
NVIDIA GeForce GTX 1660 Ti (Desktop)
NVIDIA GeForce GTX 1080 (Desktop)
NVIDIA GeForce RTX 2060 (Desktop)
NVIDIA GeForce GTX 1080 Mobile
NVIDIA GeForce RTX 2060 Super (Desktop)
NVIDIA GeForce RTX 2080 (Desktop)
NVIDIA Titan RTX
...
...
NVIDIA GeForce GTX 1080 (Desktop)
NVIDIA GeForce RTX 2060 (Desktop)
NVIDIA GeForce GTX 1080 Mobile
NVIDIA GeForce RTX 2060 Super (Desktop)
NVIDIA GeForce RTX 2080 (Desktop)
NVIDIA Titan RTX
...
...
NVIDIA GeForce RTX 2060 (Desktop)
NVIDIA GeForce RTX 2060 Super (Desktop)
AMD Radeon VII
NVIDIA GeForce RTX 2080 (Desktop)
NVIDIA Titan RTX
» With all tested laptops playable in detail settings ultra.
...
NVIDIA GeForce GTX 1050 Ti Mobile
NVIDIA GeForce GTX 1050 Ti Max-Q
NVIDIA GeForce GTX 1070 SLI (Desktop)
NVIDIA GeForce RTX 2060 (Desktop)
AMD Radeon RX 5700 (Desktop)
AMD Radeon RX 580 (Desktop)
NVIDIA GeForce GTX 1080 Mobile
AMD Radeon RX 570 (Desktop)
AMD Radeon RX 5700 XT (Desktop)
...
...
AMD Radeon RX 570 (Desktop)
AMD Radeon RX 580 (Desktop)
NVIDIA GeForce GTX 1070 SLI (Desktop)
NVIDIA GeForce GTX 1060 (Desktop)
NVIDIA GeForce RTX 2060 (Desktop)
AMD Radeon VII
AMD Radeon RX 5700 (Desktop)
AMD Radeon RX Vega 56
NVIDIA GeForce GTX 1080 Mobile
NVIDIA GeForce GTX 1660 Ti (Desktop)
...
...
AMD Radeon RX 580 (Desktop)
NVIDIA GeForce GTX 1060 (Desktop)
NVIDIA GeForce GTX 1070 SLI (Desktop)
AMD Radeon RX Vega 56
AMD Radeon VII
AMD Radeon RX 5700 (Desktop)
NVIDIA GeForce GTX 1660 Ti (Desktop)
NVIDIA GeForce RTX 2060 (Desktop)
AMD Radeon RX 5700 XT (Desktop)
...
...
AMD Radeon VII
NVIDIA GeForce GTX 1660 Ti (Desktop)
AMD Radeon RX Vega 56
NVIDIA GeForce GTX 1080 (Desktop)
NVIDIA GeForce GTX 1070 SLI (Desktop)
AMD Radeon RX 5700 (Desktop)
NVIDIA GeForce GTX 1080 Mobile
AMD Radeon RX 5700 XT (Desktop)
NVIDIA GeForce RTX 2060 Super (Desktop)
NVIDIA Titan RTX
...
...
NVIDIA GeForce GTX 1080 Mobile
NVIDIA GeForce GTX 1660 Ti (Desktop)
NVIDIA GeForce GTX 1080 (Desktop)
AMD Radeon RX Vega 56
AMD Radeon RX 5700 (Desktop)
NVIDIA GeForce RTX 2060 (Desktop)
AMD Radeon VII
NVIDIA GeForce RTX 2060 Super (Desktop)
AMD Radeon RX 5700 XT (Desktop)
NVIDIA GeForce GTX 1070 SLI (Desktop)
NVIDIA GeForce RTX 2080 (Desktop)
...
NVIDIA Titan RTX
» With all tested laptops playable in detail settings ultra.
...
AMD Radeon RX 580 (Laptop)
AMD Radeon RX 580 (Desktop)
NVIDIA GeForce GTX 1070 SLI (Desktop)
NVIDIA GeForce GTX 1080 Mobile
NVIDIA GeForce GTX 1080 (Desktop)
NVIDIA GeForce GTX 1060 (Desktop)
...
NVIDIA GeForce GTX 1070 SLI (Desktop)
NVIDIA GeForce GTX 1080 Mobile
NVIDIA GeForce GTX 1080 (Desktop)
...
NVIDIA GeForce GTX 1070 SLI (Desktop)
NVIDIA GeForce GTX 1080 (Desktop)
NVIDIA GeForce GTX 1080 Mobile
...
NVIDIA GeForce GTX 1070 SLI (Desktop)
NVIDIA GeForce GTX 1080 Mobile
NVIDIA GeForce GTX 1080 (Desktop)
» With all tested laptops playable in detail settings ultra.
...
NVIDIA GeForce GTX 1080 Mobile
NVIDIA GeForce GTX 1060 (Desktop)
NVIDIA GeForce GTX 1070 SLI (Desktop)
NVIDIA GeForce GTX 1080 (Desktop)
...
AMD Radeon RX 580 (Desktop)
NVIDIA GeForce GTX 1080 Mobile
NVIDIA GeForce GTX 1070 SLI (Desktop)
NVIDIA GeForce GTX 1080 (Desktop)
...
AMD Radeon RX 580 (Desktop)
NVIDIA GeForce GTX 1070 SLI (Desktop)
NVIDIA GeForce GTX 1080 Mobile
NVIDIA GeForce GTX 1080 (Desktop)
...
AMD Radeon RX 580 (Desktop)
NVIDIA GeForce GTX 1070 SLI (Desktop)
NVIDIA GeForce GTX 1080 (Desktop)
NVIDIA GeForce GTX 1080 Mobile
NVIDIA GeForce GTX 1050 Ti Mobile
...
NVIDIA GeForce GTX 1060 (Desktop)
AMD Radeon RX 580 (Desktop)
NVIDIA GeForce GTX 1070 SLI (Desktop)
NVIDIA GeForce GTX 1080 Mobile
NVIDIA GeForce GTX 1080 (Desktop)
» With all tested laptops playable in detail settings ultra.
...
NVIDIA GeForce GTX 1050 Ti Max-Q
NVIDIA GeForce GTX 1050 Ti Mobile
NVIDIA GeForce GTX 1070 SLI (Desktop)
NVIDIA Quadro RTX 5000 Max-Q
NVIDIA Quadro P2000
AMD Radeon RX 580 (Laptop)
NVIDIA GeForce GTX 1080 Mobile
AMD Radeon RX 580 (Desktop)
AMD Radeon RX Vega M GH
AMD Radeon RX 480 (Desktop)
...
NVIDIA Quadro P5200
...
AMD Radeon RX 580 (Desktop)
NVIDIA GeForce GTX 1070 SLI (Desktop)
AMD Radeon RX 480 (Desktop)
NVIDIA GeForce GTX 1060 (Desktop)
NVIDIA Quadro RTX 5000 Max-Q
NVIDIA GeForce GTX 1080 Mobile
...
...
NVIDIA Quadro RTX 5000 Max-Q
NVIDIA Quadro P5200
NVIDIA GeForce GTX 1080 (Desktop)
NVIDIA GeForce GTX 1080 Mobile
...
NVIDIA Quadro P5200
NVIDIA Quadro RTX 5000 Max-Q
NVIDIA GeForce GTX 1080 (Desktop)
NVIDIA GeForce GTX 1080 Mobile
...
NVIDIA Quadro RTX 5000 Max-Q
NVIDIA GeForce GTX 1080 Mobile
NVIDIA GeForce GTX 1080 (Desktop)
NVIDIA GeForce GTX 1070 SLI (Desktop)
» With all tested laptops playable in detail settings ultra.
...
AMD Radeon RX 580 (Laptop)
NVIDIA GeForce GTX 1050 Max-Q
NVIDIA GeForce GTX 1050 Ti Mobile
NVIDIA GeForce GTX 1070 SLI (Desktop)
AMD Radeon RX 580 (Desktop)
NVIDIA GeForce GTX 1060 (Desktop)
NVIDIA Titan RTX
NVIDIA GeForce GTX 1080 (Desktop)
...
NVIDIA GeForce GTX 1070 SLI (Desktop)
NVIDIA GeForce GTX 1060 (Desktop)
AMD Radeon RX 580 (Desktop)
NVIDIA GeForce GTX 1080 (Desktop)
NVIDIA Titan RTX
...
NVIDIA GeForce GTX 1050 Ti Mobile
AMD Radeon RX 580 (Laptop)
NVIDIA GeForce GTX 1060 (Desktop)
NVIDIA GeForce GTX 1070 SLI (Desktop)
AMD Radeon RX 580 (Desktop)
NVIDIA GeForce GTX 1080 (Desktop)
NVIDIA Titan RTX
NVIDIA GeForce GTX 1080 Mobile
...
...
AMD Radeon RX 580 (Laptop)
NVIDIA GeForce GTX 1060 (Desktop)
NVIDIA GeForce GTX 1070 SLI (Desktop)
AMD Radeon RX 580 (Desktop)
NVIDIA GeForce GTX 1080 (Desktop)
NVIDIA Titan RTX
NVIDIA GeForce GTX 1080 Mobile
...
NVIDIA Titan RTX
...
AMD Radeon RX 580 (Desktop)
NVIDIA GeForce GTX 1070 SLI (Desktop)
NVIDIA GeForce GTX 1080 (Desktop)
NVIDIA GeForce GTX 1080 Mobile
NVIDIA Titan RTX
» With all tested laptops playable in detail settings ultra.
Intel HD Graphics (Haswell)
...
AMD Radeon RX 560X (Laptop)
NVIDIA Quadro P2000
AMD Radeon RX 580 (Laptop)
NVIDIA GeForce GTX 1050 Ti Mobile
NVIDIA Quadro P4000 Max-Q
AMD Radeon RX 580 (Desktop)
NVIDIA GeForce GTX 1080 Mobile
NVIDIA GeForce GTX 1070 SLI (Desktop)
NVIDIA GeForce GTX 1060 (Desktop)
NVIDIA GeForce GTX 1080 (Desktop)
...
...
NVIDIA GeForce GTX 1070 SLI (Desktop)
NVIDIA GeForce GTX 1080 Mobile
NVIDIA GeForce GTX 1080 (Desktop)
...
NVIDIA GeForce GTX 1080 Mobile
NVIDIA GeForce GTX 1080 (Desktop)
NVIDIA GeForce GTX 1070 SLI (Desktop)
...
NVIDIA GeForce GTX 1080 Mobile
NVIDIA GeForce GTX 1080 (Desktop)
NVIDIA GeForce GTX 1070 SLI (Desktop)
...
NVIDIA GeForce GTX 1060 (Desktop)
NVIDIA GeForce GTX 1080 Mobile
NVIDIA GeForce GTX 1080 (Desktop)
NVIDIA GeForce GTX 1070 SLI (Desktop)
» With all tested laptops playable in detail settings ultra.
Intel HD Graphics (Haswell)
...
NVIDIA Quadro P2000
NVIDIA GeForce GTX 1050 Ti Mobile
NVIDIA Quadro P4000 Max-Q
AMD Radeon RX 580 (Desktop)
AMD Radeon RX Vega 64
AMD Radeon RX Vega M GH
NVIDIA GeForce GTX 1070 SLI (Desktop)
NVIDIA GeForce GTX 1060 (Desktop)
NVIDIA Titan RTX
NVIDIA GeForce GTX 1080 (Desktop)
...
NVIDIA GeForce GTX 1050 Ti Mobile
AMD Radeon RX 580 (Laptop)
AMD Radeon RX Vega M GH
NVIDIA Quadro P4000 Max-Q
NVIDIA GeForce GTX 1060 (Desktop)
NVIDIA GeForce GTX 1080 (Desktop)
AMD Radeon RX 580 (Desktop)
AMD Radeon RX Vega 64
NVIDIA Titan RTX
NVIDIA GeForce GTX 1070 SLI (Desktop)
...
AMD Radeon RX 580 (Laptop)
NVIDIA Quadro P4000 Max-Q
NVIDIA GeForce GTX 1080 (Desktop)
NVIDIA GeForce GTX 1060 (Desktop)
NVIDIA GeForce GTX 1080 Mobile
NVIDIA Titan RTX
AMD Radeon RX 580 (Desktop)
AMD Radeon RX Vega 64
...
NVIDIA GeForce GTX 1070 SLI (Desktop)
...
NVIDIA GeForce GTX 1060 (Desktop)
AMD Radeon RX 580 (Desktop)
NVIDIA GeForce GTX 1080 (Desktop)
NVIDIA GeForce GTX 1080 Mobile
NVIDIA GeForce GTX 1070 SLI (Desktop)
AMD Radeon RX Vega 64
NVIDIA Titan RTX
...
AMD Radeon RX 580 (Desktop)
NVIDIA GeForce GTX 1080 Mobile
NVIDIA GeForce GTX 1080 (Desktop)
AMD Radeon RX Vega 64
NVIDIA GeForce GTX 1070 SLI (Desktop)
NVIDIA Titan RTX
» With all tested laptops playable in detail settings ultra.
...
NVIDIA GeForce GTX 1060 (Desktop)
AMD Radeon RX 580 (Desktop)
NVIDIA GeForce GTX 1050 Ti Mobile
NVIDIA GeForce GTX 1080 (Desktop)
AMD Radeon RX 570 (Desktop)
AMD Radeon VII
AMD Radeon RX Vega 56
NVIDIA GeForce RTX 2060 Super (Desktop)
NVIDIA GeForce RTX 2060 (Desktop)
AMD Radeon RX 5700 (Desktop)
...
NVIDIA GeForce GTX 1660 Super (Desktop)
...
AMD Radeon RX 580 (Desktop)
NVIDIA GeForce GTX 1060 (Desktop)
AMD Radeon RX 570 (Desktop)
NVIDIA GeForce GTX 1080 (Desktop)
NVIDIA GeForce RTX 2060 Super (Desktop)
AMD Radeon RX 5700 (Desktop)
AMD Radeon RX Vega 56
...
...
AMD Radeon RX 570 (Desktop)
NVIDIA GeForce GTX 1080 Mobile
AMD Radeon RX Vega 56
NVIDIA GeForce GTX 1660 Super (Desktop)
NVIDIA GeForce RTX 2060 Super (Desktop)
AMD Radeon RX 5700 (Desktop)
NVIDIA GeForce GTX 1660 Ti (Desktop)
...
...
NVIDIA GeForce GTX 1080 Mobile
NVIDIA GeForce GTX 1080 (Desktop)
NVIDIA GeForce GTX 1660 Super (Desktop)
AMD Radeon RX Vega 56
NVIDIA GeForce RTX 2060 (Desktop)
NVIDIA GeForce RTX 2060 Super (Desktop)
NVIDIA GeForce GTX 1660 Ti (Desktop)
NVIDIA Titan RTX
...
...
NVIDIA GeForce GTX 1080 Mobile
NVIDIA GeForce GTX 1080 (Desktop)
NVIDIA GeForce GTX 1660 Super (Desktop)
NVIDIA GeForce GTX 1660 Ti (Desktop)
AMD Radeon RX Vega 56
NVIDIA GeForce RTX 2060 (Desktop)
NVIDIA GeForce RTX 2060 Super (Desktop)
AMD Radeon RX 5700 XT (Desktop)
AMD Radeon VII
...
NVIDIA Titan RTX
» With all tested laptops playable in detail settings ultra.
...
Intel Iris Plus Graphics G7 (Ice Lake 64 EU)
Intel HD Graphics 5600
AMD Radeon RX 580 (Laptop)
AMD Radeon Pro 555
AMD Radeon RX 580 (Desktop)
NVIDIA GeForce GTX 1050 Ti Max-Q
NVIDIA GeForce GTX 1050 Max-Q
...
AMD Radeon Pro 560X
...
AMD Radeon RX 560X (Laptop)
Intel HD Graphics 5600
Intel Iris Plus Graphics 640
Intel HD Graphics 630
AMD Radeon RX 580 (Laptop)
NVIDIA GeForce GTX 1050 Ti Max-Q
AMD Radeon RX 580 (Desktop)
NVIDIA GeForce GTX 1050 Max-Q
...
AMD Radeon Pro 560X
...
AMD Radeon RX 560X (Laptop)
Intel HD Graphics 630
AMD Radeon RX 580 (Laptop)
NVIDIA GeForce GTX 1050 Ti Max-Q
NVIDIA GeForce GTX 1050 Max-Q
AMD Radeon RX 580 (Desktop)
...
AMD Radeon Pro 560X
...
AMD Radeon RX 560X (Laptop)
NVIDIA GeForce GTX 950M
AMD Radeon Pro 555
AMD Radeon RX 580 (Laptop)
NVIDIA GeForce GTX 1080 Mobile
NVIDIA GeForce GTX 1050 Ti Mobile
NVIDIA GeForce GTX 1050 Ti Max-Q
NVIDIA GeForce GTX 1050 Max-Q
AMD Radeon RX 580 (Desktop)
NVIDIA GeForce GTX 470
...
AMD Radeon R7 370
...
AMD Radeon Pro 560X
NVIDIA GeForce GTX 1050 Max-Q
NVIDIA GeForce GTX 1050 Ti Max-Q
AMD Radeon R7 370
NVIDIA GeForce GTX 1050 Ti Mobile
AMD Radeon Pro 555
AMD Radeon RX 580 (Desktop)
AMD Radeon RX 480 (Desktop)
NVIDIA GeForce GTX 1080 (Desktop)
» With all tested laptops playable in detail settings ultra.
Intel HD Graphics (Bay Trail)
...
AMD Radeon RX 580 (Desktop)
NVIDIA GeForce RTX 2060 Super (Desktop)
NVIDIA GeForce GTX 1660 Ti (Desktop)
NVIDIA GeForce RTX 2060 (Desktop)
NVIDIA GeForce RTX 2080 (Desktop)
AMD Radeon RX 570 (Desktop)
NVIDIA Titan RTX
NVIDIA GeForce GTX 1060 (Desktop)
AMD Radeon RX Vega 56
AMD Radeon VII
NVIDIA GeForce GTX 1080 (Desktop)
...
...
NVIDIA GeForce GTX 1660 Ti (Desktop)
NVIDIA GeForce GTX 1080 (Desktop)
NVIDIA GeForce RTX 2080 (Desktop)
AMD Radeon RX Vega 56
NVIDIA Titan RTX
AMD Radeon VII
...
AMD Radeon VII
...
AMD Radeon RX Vega 56
NVIDIA GeForce RTX 2060 Super (Desktop)
NVIDIA GeForce RTX 2060 (Desktop)
NVIDIA GeForce RTX 2080 (Desktop)
NVIDIA Titan RTX
AMD Radeon VII
...
AMD Radeon VII
...
AMD Radeon RX Vega 56
NVIDIA GeForce RTX 2060 (Desktop)
NVIDIA GeForce RTX 2060 Super (Desktop)
AMD Radeon VII
NVIDIA GeForce RTX 2080 (Desktop)
NVIDIA Titan RTX
...
NVIDIA GeForce GTX 1080 Mobile
AMD Radeon RX Vega 56
NVIDIA GeForce GTX 1080 (Desktop)
NVIDIA GeForce RTX 2060 (Desktop)
NVIDIA GeForce RTX 2060 Super (Desktop)
AMD Radeon VII
NVIDIA GeForce RTX 2080 (Desktop)
NVIDIA Titan RTX
...
NVIDIA Titan RTX
» With all tested laptops playable in detail settings ultra.
Intel HD Graphics (Bay Trail)
...
NVIDIA Quadro P2000
NVIDIA GeForce GTX 1660 (Desktop)
NVIDIA GeForce GTX 1050 Ti Max-Q
AMD Radeon RX 580 (Desktop)
...
...
NVIDIA GeForce GTX 1060 (Desktop)
NVIDIA GeForce GTX 1660 Super (Desktop)
NVIDIA GeForce GTX 1660 (Desktop)
...
...
AMD Radeon RX 5700 XT (Desktop)
NVIDIA GeForce RTX 2080 (Desktop)
NVIDIA Titan RTX
...
NVIDIA Quadro P5200
NVIDIA GeForce GTX 1660 Super (Desktop)
NVIDIA GeForce GTX 1080 (Desktop)
NVIDIA GeForce GTX 1080 Mobile
NVIDIA GeForce RTX 2060 (Desktop)
AMD Radeon RX 5700 (Desktop)
NVIDIA GeForce RTX 2060 Super (Desktop)
...
» With all tested laptops playable in detail settings high.
...
NVIDIA Quadro P2000 Max-Q
AMD Radeon R7 370
NVIDIA Quadro P4000 Max-Q
AMD Radeon RX 580 (Desktop)
NVIDIA GeForce GTX 1050 Ti Max-Q
NVIDIA GeForce GTX 1080 (Desktop)
NVIDIA GeForce GTX 1060 (Desktop)
NVIDIA Quadro P620
NVIDIA Quadro P5200
...
AMD Radeon RX 480 (Desktop)
AMD Radeon RX 580 (Desktop)
NVIDIA GeForce GTX 1060 (Desktop)
NVIDIA GeForce GTX 1080 (Desktop)
NVIDIA Quadro P5200
...
NVIDIA GeForce GTX 1080 Mobile
NVIDIA Quadro P5200
AMD Radeon R5 (Bristol Ridge)
...
NVIDIA GeForce GTX 1080 Mobile
NVIDIA Quadro P5200
...
NVIDIA Quadro P5200
NVIDIA GeForce GTX 1080 Mobile
NVIDIA GeForce GTX 1080 (Desktop)
» With all tested laptops playable in detail settings ultra.
...
AMD Radeon RX 560X (Laptop)
NVIDIA GeForce GTX 960M
NVIDIA GeForce GTX 1050 Ti Mobile
AMD Radeon RX 580 (Laptop)
NVIDIA GeForce GTX 1080 Mobile
AMD Radeon R7 370
AMD Radeon RX 480 (Desktop)
NVIDIA GeForce GTX 1060 (Desktop)
...
...
NVIDIA GeForce GTX 1050 Ti Mobile
AMD Radeon RX 560X (Laptop)
NVIDIA Quadro P4000
NVIDIA GeForce GTX 1060 (Desktop)
AMD Radeon RX 580 (Laptop)
AMD Radeon RX 480 (Desktop)
NVIDIA GeForce GTX 1080 Mobile
NVIDIA GeForce GTX 1080 (Desktop)
...
AMD Radeon RX 560X (Laptop)
AMD Radeon RX 480 (Desktop)
NVIDIA Quadro P4000
AMD Radeon RX 580 (Laptop)
NVIDIA GeForce GTX 1080 (Desktop)
NVIDIA GeForce GTX 1080 Mobile
...
AMD Radeon RX 480 (Desktop)
AMD Radeon RX 580 (Laptop)
NVIDIA Quadro P4000
NVIDIA GeForce GTX 1080 (Desktop)
NVIDIA GeForce GTX 1080 Mobile
...
NVIDIA GeForce GTX 1080 Mobile
...
NVIDIA GeForce GTX 1060 (Desktop)
AMD Radeon RX 480 (Desktop)
NVIDIA GeForce GTX 1080 (Desktop)
» With all tested laptops playable in detail settings ultra.
...
NVIDIA GeForce GTX 960M
AMD Radeon Pro 555
NVIDIA GeForce GTX 1050 Ti Mobile
AMD Radeon R7 370
AMD Radeon RX 580 (Desktop)
NVIDIA GeForce GTX 1060 (Desktop)
...
NVIDIA GeForce GTX 1080 (Desktop)
...
NVIDIA GeForce GTX 1050 Ti Mobile
NVIDIA GeForce GTX 1060 (Desktop)
AMD Radeon RX 580 (Desktop)
NVIDIA GeForce GTX 1080 (Desktop)
...
NVIDIA GeForce GTX 970
AMD Radeon R9 Fury
NVIDIA GeForce GTX 1060 (Desktop)
AMD Radeon RX 480 (Desktop)
AMD Radeon RX 580 (Desktop)
NVIDIA GeForce GTX 1080 (Desktop)
...
AMD Radeon R9 Fury
AMD Radeon RX 480 (Desktop)
NVIDIA GeForce GTX 1060 (Desktop)
AMD Radeon RX 580 (Desktop)
NVIDIA GeForce GTX 1080 Mobile
NVIDIA GeForce GTX 1080 (Desktop)
...
AMD Radeon RX 480 (Desktop)
AMD Radeon RX 580 (Desktop)
AMD Radeon R9 Fury
NVIDIA GeForce GTX 1080 (Desktop)
» With all tested laptops playable in detail settings ultra.
...
NVIDIA GeForce GTX 1060 (Desktop)
NVIDIA GeForce RTX 2060 Super (Desktop)
NVIDIA GeForce GTX 1070 SLI (Desktop)
NVIDIA GeForce GTX 1660 Ti (Desktop)
NVIDIA GeForce GTX 1660 Super (Desktop)
NVIDIA GeForce GTX 1080 (Desktop)
...
NVIDIA Titan RTX
NVIDIA GeForce RTX 2060 Super (Desktop)
NVIDIA GeForce GTX 1080 (Desktop)
NVIDIA GeForce GTX 1070 SLI (Desktop)
NVIDIA GeForce RTX 2080 (Desktop)
...
...
NVIDIA GeForce GTX 1080 Mobile
NVIDIA GeForce RTX 2060 Super (Desktop)
NVIDIA GeForce GTX 1070 SLI (Desktop)
NVIDIA GeForce GTX 1080 (Desktop)
NVIDIA Titan RTX
NVIDIA GeForce RTX 2080 (Desktop)
...
...
NVIDIA Quadro RTX 5000 Max-Q
NVIDIA GeForce GTX 1080 Mobile
AMD Radeon RX 5700 (Desktop)
NVIDIA GeForce RTX 2060 Super (Desktop)
NVIDIA GeForce GTX 1080 (Desktop)
AMD Radeon RX 5700 XT (Desktop)
NVIDIA GeForce GTX 1070 SLI (Desktop)
NVIDIA GeForce RTX 2080 (Desktop)
NVIDIA Titan RTX
...
NVIDIA Quadro RTX 5000 Max-Q
NVIDIA GeForce GTX 1080 Mobile
AMD Radeon VII
NVIDIA GeForce GTX 1080 (Desktop)
AMD Radeon RX 5700 (Desktop)
NVIDIA GeForce RTX 2060 Super (Desktop)
AMD Radeon RX 5700 XT (Desktop)
NVIDIA GeForce RTX 2080 (Desktop)
NVIDIA GeForce GTX 1070 SLI (Desktop)
...
NVIDIA Titan RTX
» With all tested laptops playable in detail settings ultra.
...
NVIDIA Quadro P3200
AMD Radeon RX 570 (Desktop)
NVIDIA Quadro RTX 5000 Max-Q
NVIDIA GeForce RTX 2060 (Desktop)
NVIDIA GeForce GTX 1080 Mobile
AMD Radeon RX Vega 64
NVIDIA Titan RTX
AMD Radeon RX 480 (Desktop)
AMD Radeon RX 5700 (Desktop)
NVIDIA GeForce GTX 1060 (Desktop)
...
...
AMD Radeon RX 5700 (Desktop)
NVIDIA GeForce GTX 1080 Mobile
NVIDIA GeForce GTX 1080 (Desktop)
AMD Radeon RX 5700 XT (Desktop)
NVIDIA GeForce RTX 2080 (Desktop)
NVIDIA Titan RTX
...
AMD Radeon RX 5700 (Desktop)
NVIDIA GeForce GTX 1080 (Desktop)
AMD Radeon RX 5700 XT (Desktop)
NVIDIA GeForce RTX 2080 (Desktop)
NVIDIA Titan RTX
...
NVIDIA GeForce GTX 1070 SLI (Desktop)
AMD Radeon RX 5700 XT (Desktop)
NVIDIA GeForce RTX 2080 (Desktop)
NVIDIA Titan RTX
...
AMD Radeon RX 5700 XT (Desktop)
AMD Radeon VII
NVIDIA GeForce RTX 2080 (Desktop)
NVIDIA GeForce GTX 1070 SLI (Desktop)
NVIDIA Titan RTX
» With all tested laptops playable in detail settings ultra.
...
NVIDIA GeForce GTX 1050 Ti Mobile
NVIDIA GeForce GTX 1070 SLI (Desktop)
AMD Radeon RX 580 (Laptop)
NVIDIA Quadro P4000 Max-Q
AMD Radeon RX 580 (Desktop)
NVIDIA GeForce GTX 1060 (Desktop)
NVIDIA GeForce GTX 1080 Mobile
NVIDIA GeForce GTX 1080 (Desktop)
...
NVIDIA GeForce GTX 1080 (Desktop)
NVIDIA GeForce GTX 1080 Mobile
...
NVIDIA GeForce GTX 1070 SLI (Desktop)
NVIDIA GeForce GTX 1080 (Desktop)
NVIDIA GeForce GTX 1080 Mobile
...
NVIDIA GeForce GTX 1070 SLI (Desktop)
NVIDIA GeForce GTX 1080 (Desktop)
NVIDIA GeForce GTX 1080 Mobile
...
NVIDIA GeForce GTX 1070 SLI (Desktop)
NVIDIA GeForce GTX 1080 (Desktop)
NVIDIA Quadro P4000 Max-Q
NVIDIA GeForce GTX 1080 Mobile
» With all tested laptops playable in detail settings ultra.
...
AMD Radeon VII
AMD Radeon RX Vega 56
AMD Radeon RX 570 (Desktop)
NVIDIA GeForce GTX 1070 SLI (Desktop)
NVIDIA GeForce RTX 2060 (Desktop)
NVIDIA Titan RTX
NVIDIA GeForce GTX 1660 Ti (Desktop)
NVIDIA GeForce RTX 2080 (Desktop)
NVIDIA GeForce GTX 1060 (Desktop)
NVIDIA GeForce RTX 2060 Super (Desktop)
...
...
AMD Radeon RX Vega 56
AMD Radeon RX 480 (Desktop)
NVIDIA GeForce GTX 1070 SLI (Desktop)
NVIDIA GeForce GTX 1660 Ti (Desktop)
NVIDIA Titan RTX
NVIDIA GeForce RTX 2060 (Desktop)
NVIDIA GeForce GTX 1060 (Desktop)
NVIDIA GeForce RTX 2060 Super (Desktop)
NVIDIA GeForce RTX 2080 (Desktop)
...
AMD Radeon RX Vega 8 (Ryzen 2000/3000)
...
NVIDIA GeForce RTX 2060 (Desktop)
NVIDIA GeForce RTX 2060 Super (Desktop)
NVIDIA GeForce GTX 1070 SLI (Desktop)
NVIDIA GeForce GTX 1080 Mobile
NVIDIA GeForce GTX 1080 (Desktop)
NVIDIA Titan RTX
NVIDIA GeForce RTX 2080 (Desktop)
AMD Radeon RX Vega 8 (Ryzen 2000/3000)
...
NVIDIA GeForce GTX 1080 (Desktop)
NVIDIA GeForce RTX 2060 Super (Desktop)
NVIDIA GeForce GTX 1080 Mobile
NVIDIA GeForce RTX 2080 (Desktop)
NVIDIA GeForce GTX 1070 SLI (Desktop)
NVIDIA Titan RTX
...
...
AMD Radeon RX Vega 64
NVIDIA GeForce RTX 2060 (Desktop)
AMD Radeon VII
NVIDIA GeForce GTX 1080 Mobile
NVIDIA GeForce RTX 2060 Super (Desktop)
NVIDIA GeForce GTX 1080 (Desktop)
NVIDIA GeForce RTX 2080 (Desktop)
NVIDIA GeForce GTX 1070 SLI (Desktop)
NVIDIA Titan RTX
» With all tested laptops playable in detail settings ultra.
...
AMD Radeon RX 580 (Laptop)
NVIDIA GeForce GTX 1050 Ti Mobile
AMD Radeon RX 580 (Desktop)
NVIDIA GeForce GTX 1060 (Desktop)
NVIDIA GeForce GTX 970
NVIDIA GeForce GTX 1070 SLI (Desktop)
AMD Radeon RX 570 (Desktop)
NVIDIA GeForce GTX 1660 Ti (Desktop)
...
NVIDIA GeForce GTX 1080 (Desktop)
...
NVIDIA GeForce GTX 1050 Ti Mobile
AMD Radeon RX 580 (Laptop)
AMD Radeon RX 580 (Desktop)
NVIDIA GeForce GTX 1060 (Desktop)
NVIDIA GeForce GTX 970
NVIDIA GeForce GTX 1070 SLI (Desktop)
...
NVIDIA Titan RTX
...
NVIDIA GeForce GTX 1060 (Desktop)
AMD Radeon RX 480 (Desktop)
AMD Radeon RX 570 (Desktop)
NVIDIA GeForce GTX 1080 (Desktop)
NVIDIA GeForce GTX 1070 SLI (Desktop)
...
NVIDIA Titan RTX
AMD Radeon RX Vega 8 (Ryzen 2000/3000)
...
AMD Radeon RX 580 (Desktop)
AMD Radeon RX 570 (Desktop)
NVIDIA GeForce GTX 1070 SLI (Desktop)
NVIDIA GeForce GTX 1080 (Desktop)
NVIDIA GeForce GTX 1080 Mobile
...
...
NVIDIA GeForce GTX 1660 Ti (Desktop)
NVIDIA GeForce GTX 1080 (Desktop)
NVIDIA GeForce GTX 1080 Mobile
NVIDIA GeForce RTX 2060 Super (Desktop)
NVIDIA GeForce GTX 1070 SLI (Desktop)
NVIDIA Titan RTX
» With all tested laptops playable in detail settings ultra.
...
AMD Radeon RX 580 (Laptop)
NVIDIA GeForce GTX 1050 Ti Mobile
AMD Radeon RX 580 (Desktop)
NVIDIA GeForce GTX 1060 (Desktop)
...
AMD Radeon RX 580 (Desktop)
NVIDIA GeForce GTX 1060 (Desktop)
...
AMD Radeon R9 Fury
AMD Radeon RX 580 (Desktop)
NVIDIA GeForce GTX 1060 (Desktop)
NVIDIA GeForce GTX 1080 Mobile
...
...
AMD Radeon RX 580 (Desktop)
NVIDIA GeForce GTX 1080 (Desktop)
...
NVIDIA GeForce GTX 1080 Mobile
NVIDIA GeForce GTX 1080 (Desktop)
» With all tested laptops playable in detail settings ultra.
...
NVIDIA GeForce GTX 1050 Ti Mobile
...
NVIDIA GeForce GTX 1050 Ti Mobile
AMD Radeon HD 8970M
AMD Radeon HD 8970M Crossfire
AMD Radeon RX 580 (Laptop)
...
NVIDIA GeForce GTX 1060 (Desktop)
NVIDIA GeForce GTX 1080 Mobile
...
AMD Radeon R9 Fury
NVIDIA GeForce GTX 1080 Mobile
NVIDIA GeForce GTX 1080 (Desktop)
...
...
NVIDIA GeForce GTX 1080 Mobile
AMD Radeon R9 Fury
NVIDIA GeForce GTX 1080 (Desktop)
» With all tested laptops playable in detail settings ultra.
...
NVIDIA GeForce GTX 860M
NVIDIA GeForce GTX 950M
AMD Radeon HD 8970M Crossfire
AMD Radeon HD 8970M
NVIDIA GeForce GTX 960M
AMD Radeon Pro 460
NVIDIA GeForce GTX 1060 (Desktop)
NVIDIA Quadro P2000
...
NVIDIA GeForce GTX 950M
AMD Radeon HD 8970M
NVIDIA GeForce GTX 960M
NVIDIA GeForce GTX 1060 (Desktop)
NVIDIA Quadro P2000
Intel HD Graphics (Haswell)
...
AMD Radeon HD 8970M
AMD Radeon HD 8970M Crossfire
NVIDIA GeForce GTX 1050 Ti Mobile
NVIDIA GeForce GTX 1050 Ti Max-Q
AMD Radeon RX 580 (Desktop)
NVIDIA Quadro P2000
NVIDIA GeForce GTX 1060 (Desktop)
...
AMD Radeon RX 580 (Desktop)
NVIDIA GeForce GTX 1050 Ti Max-Q
NVIDIA Quadro P2000
NVIDIA GeForce GTX 1050 Ti Mobile
NVIDIA GeForce GTX 1060 (Desktop)
...
NVIDIA GeForce GTX 1060 (Desktop)
AMD Radeon R9 Fury
NVIDIA GeForce GTX 1080 (Desktop)
...
NVIDIA Titan X Pascal
» With all tested laptops playable in detail settings ultra.
AMD Radeon R4 (Stoney Ridge)
...
NVIDIA GeForce GTX 1050 Max-Q
AMD Radeon HD 8970M
NVIDIA Quadro P3200
AMD Radeon RX 580 (Desktop)
NVIDIA GeForce GTX 1060 (Desktop)
NVIDIA GeForce RTX 2060 (Desktop)
NVIDIA GeForce GTX 1070 SLI (Desktop)
AMD Radeon VII
AMD Radeon RX Vega 64
AMD Radeon RX 570 (Desktop)
...
NVIDIA GeForce GTX 1080 (Desktop)
...
NVIDIA Quadro P3200
AMD Radeon RX 580 (Desktop)
NVIDIA GeForce RTX 2060 (Desktop)
NVIDIA GeForce GTX 1070 SLI (Desktop)
NVIDIA GeForce GTX 1060 (Desktop)
AMD Radeon VII
NVIDIA GeForce RTX 2060 Super (Desktop)
NVIDIA GeForce RTX 2080 (Desktop)
...
...
AMD Radeon RX 580 (Desktop)
NVIDIA GeForce GTX 1660 Ti (Desktop)
NVIDIA GeForce RTX 2060 (Desktop)
NVIDIA GeForce GTX 1070 SLI (Desktop)
AMD Radeon RX Vega 56
NVIDIA GeForce GTX 1080 Mobile
AMD Radeon VII
AMD Radeon RX Vega 64
...
...
AMD Radeon R9 Fury
NVIDIA GeForce GTX 1660 Ti (Desktop)
NVIDIA GeForce RTX 2060 (Desktop)
AMD Radeon RX Vega 56
NVIDIA GeForce GTX 1080 Mobile
AMD Radeon VII
NVIDIA GeForce GTX 1070 SLI (Desktop)
AMD Radeon RX Vega 64
...
...
NVIDIA GeForce GTX 1080 (Desktop)
AMD Radeon VII
NVIDIA GeForce RTX 2080 (Desktop)
NVIDIA Titan RTX
» With all tested laptops playable in detail settings ultra.
...
AMD Radeon Pro WX 3100
NVIDIA Quadro P4000 Max-Q
Apple M1 7-Core GPU
NVIDIA GeForce GTX 960M
NVIDIA GeForce GTX 1060 (Desktop)
NVIDIA GeForce GTX 1080 (Desktop)
NVIDIA GeForce GTX 1050 Ti Mobile
AMD Radeon RX 580 (Laptop)
AMD Radeon RX 560X (Laptop)
...
...
AMD Radeon Pro WX 3100
NVIDIA Quadro P4000
NVIDIA GeForce GTX 960M
NVIDIA Quadro P1000
Apple M1 Pro 14-Core GPU
NVIDIA GeForce GTX 1080 (Desktop)
NVIDIA GeForce GTX 1060 (Desktop)
NVIDIA Quadro P4000 Max-Q
...
...
NVIDIA GeForce GTX 1050 Ti Mobile
NVIDIA Quadro P2000
NVIDIA GeForce GTX 1050 Ti Max-Q
NVIDIA Quadro P4000 Max-Q
NVIDIA GeForce GTX 1080 (Desktop)
NVIDIA GeForce GTX 1060 (Desktop)
AMD Radeon RX 580 (Laptop)
AMD Radeon RX 480 (Desktop)
...
...
NVIDIA GeForce GTX 1050 Ti Mobile
Apple M1 Pro 16-Core GPU
NVIDIA Quadro P2000
NVIDIA Quadro P4000 Max-Q
AMD Radeon RX 580 (Laptop)
NVIDIA GeForce GTX 1060 (Desktop)
NVIDIA GeForce GTX 1080 (Desktop)
NVIDIA GeForce GTX 970
AMD Radeon RX 480 (Desktop)
...
...
NVIDIA Quadro P4000 Max-Q
NVIDIA GeForce GTX 970
AMD Radeon RX 480 (Desktop)
AMD Radeon R9 Fury
NVIDIA GeForce GTX 1060 (Desktop)
NVIDIA GeForce GTX 1080 (Desktop)
» With all tested laptops playable in detail settings ultra.
...
AMD Radeon RX 580 (Laptop)
AMD Radeon R7 370
NVIDIA GeForce GTX 1050 Ti Mobile
AMD Radeon RX Vega M GH
NVIDIA Quadro P4000 Max-Q
NVIDIA GeForce GTX 1060 (Desktop)
...
AMD Radeon RX 480 (Desktop)
NVIDIA GeForce GTX 970
NVIDIA GeForce GTX 1060 (Desktop)
NVIDIA Quadro P4000 Max-Q
...
AMD Radeon R9 Fury
NVIDIA Quadro P4000 Max-Q
NVIDIA GeForce GTX 1080 (Desktop)
NVIDIA GeForce GTX 1080 Mobile
...
AMD Radeon R9 Fury
NVIDIA GeForce GTX 1080 (Desktop)
NVIDIA GeForce GTX 1080 Mobile
» With all tested laptops playable in detail settings high.
...
AMD Radeon RX 580 (Laptop)
AMD Radeon HD 8970M
AMD Radeon Pro 460
AMD Radeon RX 580 (Desktop)
NVIDIA Titan RTX
AMD Radeon RX 480 (Desktop)
NVIDIA GeForce GTX 1060 (Desktop)
...
AMD Radeon HD 8970M
AMD Radeon RX 580 (Laptop)
AMD Radeon RX 580 (Desktop)
NVIDIA GeForce GTX 1060 (Desktop)
NVIDIA Titan RTX
AMD Radeon RX 480 (Desktop)
...
AMD Radeon RX 580 (Desktop)
NVIDIA GeForce GTX 1060 (Desktop)
AMD Radeon RX 480 (Desktop)
NVIDIA GeForce GTX 1080 Mobile
NVIDIA Titan RTX
...
NVIDIA GeForce GTX 1060 (Desktop)
AMD Radeon RX 580 (Desktop)
AMD Radeon RX 480 (Desktop)
NVIDIA GeForce GTX 1080 Mobile
NVIDIA GeForce GTX 1080 (Desktop)
NVIDIA Titan RTX
...
AMD Radeon R9 Fury
NVIDIA GeForce GTX 1080 Mobile
NVIDIA GeForce GTX 1080 (Desktop)
NVIDIA Titan RTX
» With all tested laptops playable in detail settings ultra.
...
AMD Radeon VII
NVIDIA Quadro P4000 Max-Q
AMD Radeon RX 570 (Desktop)
AMD Radeon RX Vega 56
NVIDIA GeForce GTX 1060 (Desktop)
NVIDIA GeForce RTX 2060 Super (Desktop)
NVIDIA GeForce GTX 1660 Ti (Desktop)
NVIDIA GeForce RTX 2060 (Desktop)
NVIDIA GeForce RTX 2080 (Desktop)
NVIDIA Titan RTX
...
...
NVIDIA Quadro P4000 Max-Q
AMD Radeon RX 570 (Desktop)
AMD Radeon RX Vega 64
NVIDIA GeForce GTX 1080 Mobile
AMD Radeon VII
AMD Radeon RX Vega 56
NVIDIA GeForce RTX 2060 Super (Desktop)
NVIDIA GeForce GTX 1660 Ti (Desktop)
NVIDIA GeForce RTX 2060 (Desktop)
NVIDIA GeForce RTX 2080 (Desktop)
NVIDIA Titan RTX
...
...
NVIDIA GeForce GTX 1660 Ti (Desktop)
NVIDIA GeForce GTX 1080 Mobile
AMD Radeon RX Vega 56
AMD Radeon RX Vega 64
NVIDIA GeForce RTX 2060 (Desktop)
NVIDIA GeForce RTX 2060 Super (Desktop)
AMD Radeon VII
NVIDIA GeForce RTX 2080 (Desktop)
NVIDIA Titan RTX
...
NVIDIA GeForce GTX 1080 (Desktop)
NVIDIA GeForce GTX 1080 Mobile
NVIDIA GeForce RTX 2060 Super (Desktop)
NVIDIA GeForce GTX 1070 SLI (Desktop)
AMD Radeon VII
NVIDIA GeForce RTX 2060 (Desktop)
NVIDIA GeForce RTX 2080 (Desktop)
...
...
AMD Radeon RX Vega 56
NVIDIA GeForce GTX 1080 (Desktop)
AMD Radeon RX Vega 64
NVIDIA GeForce GTX 1080 Mobile
NVIDIA GeForce RTX 2060 (Desktop)
NVIDIA GeForce RTX 2060 Super (Desktop)
AMD Radeon VII
NVIDIA GeForce GTX 1070 SLI (Desktop)
NVIDIA GeForce RTX 2080 (Desktop)
...
NVIDIA Titan RTX
» With all tested laptops playable in detail settings ultra.
...
NVIDIA GeForce GTX 1060 (Desktop)
...
AMD Radeon HD 8970M
NVIDIA GeForce GTX 1060 (Desktop)
...
AMD Radeon RX 480 (Desktop)
AMD Radeon R9 Fury
NVIDIA GeForce GTX 1060 (Desktop)
NVIDIA GeForce GTX 1080 (Desktop)
...
AMD Radeon RX 480 (Desktop)
NVIDIA GeForce GTX 1060 (Desktop)
AMD Radeon R9 Fury
NVIDIA GeForce GTX 1080 (Desktop)
NVIDIA GeForce GTX 1080 Mobile
...
AMD Radeon RX 480 (Desktop)
NVIDIA GeForce GTX 1060 (Desktop)
AMD Radeon R9 Fury
NVIDIA GeForce GTX 1080 (Desktop)
» With all tested laptops playable in detail settings ultra.
Additional Benchmarks
Medium 4x AF Off AA 1920x1080
120.3 [X] Intel Xeon E5-2680 v4 2.4GHz
Titan X Pascal
min:
81 fps, max:
145 fps
...
AMD Radeon R7 370
NVIDIA GeForce GTX 950
NVIDIA GeForce GTX 970
NVIDIA GeForce GTX 960
NVIDIA GeForce GTX 1080 (Desktop)
NVIDIA GeForce GTX 1060 (Desktop)
NVIDIA GeForce GTX 980 (Laptop)
...
NVIDIA GeForce GTX 950
NVIDIA GeForce GTX 960
AMD Radeon RX 480 (Desktop)
NVIDIA GeForce GTX 970
NVIDIA GeForce GTX 1060 (Desktop)
NVIDIA GeForce GTX 980 (Laptop)
NVIDIA GeForce GTX 1080 (Desktop)
...
NVIDIA GeForce GTX 1080 Mobile
NVIDIA GeForce GTX 1080 (Desktop)
...
NVIDIA GeForce GTX 1080 Mobile
NVIDIA GeForce GTX 1080 (Desktop)
...
NVIDIA GeForce GTX 1080 Mobile
NVIDIA GeForce GTX 1080 (Desktop)
» With all tested laptops playable in detail settings ultra.
Additional Benchmarks
Medium Preset 4xAF 1920x1080
142.2 [X] Intel Xeon E5-2680 v4 2.4GHz
Titan X Pascal
min:
114 fps, max:
174 fps
...
AMD Radeon RX 570 (Desktop)
AMD Radeon RX 5700 (Desktop)
NVIDIA GeForce GTX 980 (Laptop)
NVIDIA Titan RTX
AMD Radeon RX 580 (Desktop)
NVIDIA GeForce GTX 1660 Ti (Desktop)
NVIDIA Quadro P5200
AMD Radeon RX Vega 56
NVIDIA GeForce RTX 2060 Super (Desktop)
AMD Radeon RX 5700 XT (Desktop)
...
...
NVIDIA GeForce GTX 1660 Ti (Desktop)
AMD Radeon RX 580 (Desktop)
NVIDIA GeForce GTX 980 (Laptop)
NVIDIA Titan RTX
NVIDIA GeForce GTX 1060 (Desktop)
NVIDIA Quadro P5200
AMD Radeon RX Vega 56
NVIDIA GeForce RTX 2060 Super (Desktop)
NVIDIA GeForce RTX 2080 (Desktop)
...
...
AMD Radeon VII
AMD Radeon R9 Nano
AMD Radeon R9 Fury
NVIDIA Quadro P5200
NVIDIA GeForce RTX 2060 (Desktop)
NVIDIA GeForce GTX 1080 (Desktop)
NVIDIA GeForce GTX 1080 Mobile
...
AMD Radeon R5 (Bristol Ridge)
...
NVIDIA GeForce GTX 1080 (Desktop)
NVIDIA Quadro P5200
NVIDIA GeForce GTX 1080 Mobile
AMD Radeon RX 5700 (Desktop)
NVIDIA GeForce RTX 2080 (Desktop)
NVIDIA GeForce RTX 2060 Super (Desktop)
AMD Radeon RX 5700 XT (Desktop)
...
NVIDIA Titan RTX
...
AMD Radeon RX 5700 (Desktop)
NVIDIA GeForce RTX 2080 (Desktop)
AMD Radeon RX 5700 XT (Desktop)
NVIDIA Titan RTX
» With all tested laptops playable in detail settings ultra.
Additional Benchmarks
Medium (Render Scale 100 %) 2xAF FXAA 1920x1080
299.6 [X] Intel Xeon E5-2680 v4 2.4GHz
Titan X Pascal
min:
290 fps, max:
301 fps
...
NVIDIA GeForce GTX 1050 Ti Mobile
NVIDIA Quadro P4000
NVIDIA Quadro P4000 Max-Q
NVIDIA GeForce GTX 960
NVIDIA Titan RTX
AMD Radeon R9 Fury
NVIDIA GeForce GTX 1660 Ti (Desktop)
NVIDIA GeForce RTX 2060 (Desktop)
NVIDIA GeForce RTX 2080 (Desktop)
...
NVIDIA GeForce GTX 980 (Laptop)
...
NVIDIA GeForce GTX 1050 Ti Mobile
AMD Radeon RX 570 (Desktop)
NVIDIA Quadro P4000
NVIDIA Quadro P4000 Max-Q
NVIDIA GeForce GTX 960
AMD Radeon R9 Fury
NVIDIA Titan RTX
NVIDIA GeForce RTX 2060 (Desktop)
...
NVIDIA GeForce GTX 980 (Laptop)
...
NVIDIA Quadro P4000 Max-Q
NVIDIA GeForce GTX 1060 (Desktop)
NVIDIA GeForce GTX 970
NVIDIA GeForce GTX 980 (Laptop)
NVIDIA Titan RTX
NVIDIA GeForce GTX 1660 Ti (Desktop)
...
...
NVIDIA GeForce GTX 970
NVIDIA GeForce GTX 1060 (Desktop)
NVIDIA GeForce GTX 980 (Laptop)
...
...
NVIDIA GeForce GTX 1080 (Desktop)
NVIDIA GeForce GTX 1080 Mobile
NVIDIA GeForce RTX 2060 (Desktop)
NVIDIA GeForce RTX 2060 Super (Desktop)
NVIDIA GeForce RTX 2080 (Desktop)
NVIDIA Titan RTX
» With all tested laptops playable in detail settings ultra.
Additional Benchmarks
Medium Preset 1920x1080
136.1 [X] Intel Xeon E5-2680 v4 2.4GHz
Titan X Pascal
min:
99 fps, max:
181 fps
...
NVIDIA Quadro P2000
NVIDIA Quadro P4000 Max-Q
AMD Radeon RX Vega M GH
NVIDIA GeForce GTX 970
AMD Radeon R9 Nano
NVIDIA Quadro RTX 5000 Max-Q
NVIDIA Quadro P5200
AMD Radeon R5 (Bristol Ridge)
...
NVIDIA GeForce GTX 1080 (Desktop)
AMD Radeon R9 Nano
AMD Radeon R9 Fury
NVIDIA Quadro RTX 5000 Max-Q
NVIDIA Quadro P5200
AMD Radeon RX Vega 6 (Ryzen 2000/3000)
...
AMD Radeon R9 Nano
AMD Radeon R9 Fury
NVIDIA GeForce GTX 1080 (Desktop)
NVIDIA Quadro RTX 5000 Max-Q
NVIDIA Quadro P5200
...
AMD Radeon R9 Nano
AMD Radeon R9 Fury
NVIDIA GeForce GTX 1080 (Desktop)
NVIDIA Quadro RTX 5000 Max-Q
NVIDIA Quadro P5200
NVIDIA GeForce GTX 1080 Mobile
» With all tested laptops playable in detail settings high.
...
NVIDIA GeForce GTX 950
NVIDIA GeForce GTX 960
NVIDIA GeForce GTX 1080 (Desktop)
NVIDIA GeForce GTX 1060 (Desktop)
NVIDIA GeForce GTX 980 (Laptop)
...
NVIDIA GeForce GTX 950
NVIDIA GeForce GTX 960
NVIDIA GeForce GTX 1060 (Desktop)
NVIDIA GeForce GTX 980 (Laptop)
NVIDIA GeForce GTX 1080 (Desktop)
...
NVIDIA GeForce GTX 960
AMD Radeon RX 480 (Desktop)
AMD Radeon R9 Fury
NVIDIA GeForce GTX 1080 Mobile
NVIDIA GeForce GTX 1060 (Desktop)
NVIDIA GeForce GTX 980 (Laptop)
NVIDIA GeForce GTX 1080 (Desktop)
...
AMD Radeon R9 Fury
AMD Radeon RX 480 (Desktop)
NVIDIA GeForce GTX 970
AMD Radeon R9 Nano
NVIDIA GeForce GTX 1080 Mobile
NVIDIA GeForce GTX 980 (Laptop)
NVIDIA GeForce GTX 1060 (Desktop)
NVIDIA GeForce GTX 1080 (Desktop)
...
AMD Radeon R9 Fury
NVIDIA GeForce GTX 980 (Laptop)
NVIDIA GeForce GTX 1080 Mobile
NVIDIA GeForce GTX 1080 (Desktop)
» With all tested laptops playable in detail settings ultra.
...
NVIDIA GeForce GTX 970
NVIDIA GeForce GTX 960
AMD Radeon Pro 455
NVIDIA GeForce GTX 950
NVIDIA Quadro P2000
NVIDIA GeForce GTX 1060 (Desktop)
NVIDIA GeForce GTX 980 (Laptop)
...
NVIDIA GeForce GTX 970
NVIDIA GeForce GTX 960
NVIDIA GeForce GTX 950
NVIDIA Quadro P2000
NVIDIA GeForce GTX 1060 (Desktop)
NVIDIA GeForce GTX 980 (Laptop)
...
NVIDIA GeForce GTX 970
NVIDIA GeForce GTX 1060 (Desktop)
NVIDIA GeForce GTX 980 (Laptop)
AMD Radeon RX 480 (Desktop)
NVIDIA GeForce GTX 1080 Mobile
...
NVIDIA GeForce GTX 1060 (Desktop)
AMD Radeon RX 480 (Desktop)
AMD Radeon R9 Fury
NVIDIA GeForce GTX 980 (Laptop)
AMD Radeon R9 Nano
NVIDIA GeForce GTX 1080 Mobile
NVIDIA GeForce GTX 1080 (Desktop)
...
AMD Radeon R9 Nano
AMD Radeon R9 Fury
NVIDIA GeForce GTX 1080 Mobile
NVIDIA GeForce GTX 1080 (Desktop)
» With all tested laptops playable in detail settings ultra.
...
NVIDIA GeForce GTX 970
AMD Radeon RX 580 (Desktop)
NVIDIA GeForce GTX 1070 SLI (Desktop)
AMD Radeon VII
AMD Radeon RX 570 (Desktop)
NVIDIA Quadro P3200
AMD Radeon RX Vega 64
AMD Radeon RX Vega 56
NVIDIA GeForce GTX 1060 (Desktop)
NVIDIA GeForce GTX 980 (Laptop)
NVIDIA GeForce GTX 1080 Mobile
...
...
AMD Radeon VII
AMD Radeon RX Vega 56
NVIDIA GeForce GTX 1660 Ti (Desktop)
NVIDIA GeForce GTX 1080 Mobile
NVIDIA GeForce RTX 2060 (Desktop)
NVIDIA GeForce RTX 2060 Super (Desktop)
NVIDIA GeForce RTX 2080 (Desktop)
NVIDIA Titan RTX
...
NVIDIA GeForce RTX 2060 Super (Desktop)
NVIDIA GeForce GTX 1080 Mobile
NVIDIA GeForce GTX 1070 SLI (Desktop)
AMD Radeon RX 5700 (Desktop)
NVIDIA GeForce RTX 2080 (Desktop)
AMD Radeon RX 5700 XT (Desktop)
NVIDIA Titan RTX
...
NVIDIA GeForce GTX 1080 Mobile
NVIDIA GeForce RTX 2060 Super (Desktop)
AMD Radeon RX 5700 (Desktop)
NVIDIA GeForce GTX 1070 SLI (Desktop)
AMD Radeon RX 5700 XT (Desktop)
NVIDIA GeForce RTX 2080 (Desktop)
NVIDIA Titan RTX
...
AMD Radeon RX Vega 56
AMD Radeon RX Vega 64
NVIDIA GeForce RTX 2060 (Desktop)
NVIDIA GeForce GTX 1080 Mobile
NVIDIA GeForce GTX 1080 (Desktop)
NVIDIA GeForce RTX 2060 Super (Desktop)
AMD Radeon RX 5700 (Desktop)
AMD Radeon VII
AMD Radeon RX 5700 XT (Desktop)
...
NVIDIA Titan RTX
» With all tested laptops playable in detail settings ultra.
Additional Benchmarks
Medium Preset 4xAF 1920x1080
189.8 [X] Intel Xeon E5-2680 v4 2.4GHz
Titan X Pascal
Low Preset 1xAF 1920x1080
255.5 [X] Intel Xeon E5-2680 v4 2.4GHz
Titan X Pascal
Ultra Preset 16xAF 3840x2160
52.8 [X] Intel Xeon E5-2680 v4 2.4GHz
Titan X Pascal
...
AMD Radeon Pro 555
AMD Radeon RX 580 (Laptop)
AMD Radeon HD 8970M
AMD Radeon RX Vega 64
NVIDIA GeForce GTX 950
AMD Radeon RX 580 (Desktop)
NVIDIA GeForce GTX 970
NVIDIA GeForce GTX 960
...
NVIDIA GeForce GTX 1080 Mobile
...
NVIDIA GeForce GTX 1070 SLI (Desktop)
AMD Radeon RX 580 (Laptop)
NVIDIA GeForce GTX 1060 (Desktop)
AMD Radeon RX 480 (Desktop)
AMD Radeon RX 570 (Desktop)
AMD Radeon RX Vega 64
NVIDIA GeForce GTX 970
AMD Radeon R9 Fury
...
NVIDIA GeForce GTX 1080 (Desktop)
...
AMD Radeon RX 580 (Laptop)
NVIDIA GeForce GTX 970
AMD Radeon RX 580 (Desktop)
NVIDIA GeForce GTX 1060 (Desktop)
AMD Radeon RX 480 (Desktop)
AMD Radeon RX 570 (Desktop)
AMD Radeon RX Vega 64
AMD Radeon R9 Fury
...
...
NVIDIA GeForce GTX 980 (Laptop)
AMD Radeon R9 Fury
NVIDIA GeForce GTX 1060 (Desktop)
AMD Radeon R9 Nano
AMD Radeon RX Vega 64
NVIDIA GeForce GTX 1660 Super (Desktop)
NVIDIA GeForce GTX 1660 Ti (Desktop)
NVIDIA Titan RTX
AMD Radeon RX 5700 XT (Desktop)
...
...
AMD Radeon RX Vega 64
NVIDIA GeForce GTX 1080 Mobile
NVIDIA GeForce GTX 1080 (Desktop)
NVIDIA GeForce RTX 2060 (Desktop)
AMD Radeon RX 5700 (Desktop)
NVIDIA GeForce RTX 2060 Super (Desktop)
AMD Radeon RX 5700 XT (Desktop)
NVIDIA GeForce GTX 1070 SLI (Desktop)
AMD Radeon VII
NVIDIA GeForce RTX 2080 (Desktop)
NVIDIA Titan RTX
» With all tested laptops playable in detail settings ultra.
Additional Benchmarks
Low Preset 1920x1080
98 [X] Intel Xeon E5-2680 v4 2.4GHz
Titan X Pascal
min:
74 fps, max:
117 fps
...
NVIDIA GeForce GTX 970
AMD Radeon HD 8970M
AMD Radeon Pro 460
NVIDIA GeForce GTX 960
AMD Radeon R9 Fury
AMD Radeon HD 8970M Crossfire
AMD Radeon R7 370
NVIDIA GeForce GTX 950
NVIDIA GeForce GTX 1080 (Desktop)
NVIDIA GeForce GTX 1060 (Desktop)
NVIDIA GeForce GTX 980 (Laptop)
...
NVIDIA GeForce GTX 960
AMD Radeon RX 580 (Laptop)
AMD Radeon HD 8970M Crossfire
NVIDIA GeForce GTX 970
AMD Radeon R9 Fury
NVIDIA GeForce GTX 1060 (Desktop)
NVIDIA GeForce GTX 980 (Laptop)
NVIDIA GeForce GTX 1080 (Desktop)
...
AMD Radeon RX 480 (Desktop)
NVIDIA GeForce GTX 970
NVIDIA GeForce GTX 1060 (Desktop)
AMD Radeon R9 Fury
NVIDIA GeForce GTX 980 (Laptop)
NVIDIA GeForce GTX 1080 (Desktop)
NVIDIA GeForce GTX 1080 Mobile
...
AMD Radeon R9 Fury
AMD Radeon R9 Nano
AMD Radeon HD 8970M Crossfire
NVIDIA GeForce GTX 1080 (Desktop)
NVIDIA GeForce GTX 1080 Mobile
...
NVIDIA GeForce GTX 980 (Laptop)
AMD Radeon R9 Nano
AMD Radeon R9 Fury
NVIDIA GeForce GTX 1080 (Desktop)
NVIDIA GeForce GTX 1080 Mobile
» With all tested laptops playable in detail settings ultra.
Additional Benchmarks
Low Preset TrilinearAF 1920x1080
98.2 [X] Intel Xeon E5-2680 v4 2.4GHz
Titan X Pascal
min:
75 fps, max:
146 fps
...
AMD Radeon RX Vega 64
NVIDIA Titan RTX
NVIDIA GeForce RTX 2080 (Desktop)
NVIDIA Quadro RTX 5000 Max-Q
NVIDIA GeForce RTX 2060 Super (Desktop)
NVIDIA Quadro P5200
NVIDIA GeForce GTX 1660 Super (Desktop)
AMD Radeon RX 5700 XT (Desktop)
...
...
NVIDIA GeForce RTX 2060 Super (Desktop)
NVIDIA GeForce GTX 1080 (Desktop)
NVIDIA GeForce RTX 2080 (Desktop)
NVIDIA Quadro P5200
NVIDIA GeForce RTX 3060
...
Intel HD Graphics (Haswell)
...
NVIDIA GeForce GTX 1080 Mobile
NVIDIA Quadro RTX 5000 Max-Q
NVIDIA GeForce RTX 2060 (Desktop)
NVIDIA GeForce GTX 1070 SLI (Desktop)
NVIDIA GeForce RTX 3060
NVIDIA GeForce RTX 2060 Super (Desktop)
AMD Radeon RX 6650 XT
...
Intel HD Graphics (Haswell)
...
NVIDIA GeForce RTX 2060 (Desktop)
NVIDIA GeForce GTX 1080 Mobile
NVIDIA GeForce RTX 2060 Super (Desktop)
NVIDIA GeForce RTX 3060
AMD Radeon RX 6650 XT
NVIDIA GeForce GTX 1070 SLI (Desktop)
AMD Radeon RX 6700 XT
NVIDIA GeForce RTX 2080 (Desktop)
...
...
AMD Radeon RX 6650 XT
AMD Radeon VII
NVIDIA GeForce RTX 3060
AMD Radeon RX 6700 XT
NVIDIA GeForce GTX 1070 SLI (Desktop)
NVIDIA GeForce RTX 2080 (Desktop)
AMD Radeon RX 6750 XT
...
» With all tested laptops playable in detail settings ultra.
...
NVIDIA GeForce GTX 980 (Laptop)
AMD Radeon RX Vega 64
NVIDIA GeForce RTX 2060 Super (Desktop)
...
AMD Radeon RX Vega 64
NVIDIA GeForce RTX 2060 (Desktop)
AMD Radeon R9 Fury
NVIDIA GeForce RTX 2060 Super (Desktop)
...
NVIDIA GeForce RTX 2060 (Desktop)
AMD Radeon RX Vega 64
AMD Radeon RX 5700 (Desktop)
NVIDIA GeForce RTX 2080 (Desktop)
AMD Radeon RX 5700 XT (Desktop)
NVIDIA GeForce RTX 2060 Super (Desktop)
NVIDIA Titan RTX
...
AMD Radeon RX Vega 56
NVIDIA GeForce GTX 1080 Mobile
NVIDIA GeForce GTX 1080 (Desktop)
AMD Radeon RX Vega 64
NVIDIA GeForce RTX 2060 (Desktop)
AMD Radeon RX 5700 (Desktop)
NVIDIA GeForce RTX 2060 Super (Desktop)
AMD Radeon RX 5700 XT (Desktop)
NVIDIA GeForce RTX 2080 (Desktop)
NVIDIA Titan RTX
...
NVIDIA GeForce GTX 1080 (Desktop)
NVIDIA GeForce GTX 1660 Ti (Desktop)
NVIDIA Quadro RTX 5000 Max-Q
AMD Radeon RX Vega 56
AMD Radeon VII
NVIDIA GeForce RTX 2060 (Desktop)
AMD Radeon RX 5700 (Desktop)
NVIDIA GeForce RTX 2060 Super (Desktop)
AMD Radeon RX 5700 XT (Desktop)
NVIDIA GeForce RTX 2080 (Desktop)
...
NVIDIA Titan RTX
» With all tested laptops playable in detail settings ultra.
Additional Benchmarks
Ultra Preset 16xAF TAA 3840x2160
88.7 [X] Intel Xeon E5-2680 v4 2.4GHz
Titan X Pascal
min:
45.7 fps, max:
146.1 fps
...
NVIDIA GeForce GTX 950
NVIDIA Quadro P4000 Max-Q
NVIDIA GeForce GTX 1080 (Desktop)
NVIDIA GeForce GTX 1060 (Desktop)
NVIDIA GeForce GTX 980 (Laptop)
...
NVIDIA GeForce GTX 960
NVIDIA GeForce GTX 950
NVIDIA GeForce GTX 970
NVIDIA Quadro P4000 Max-Q
NVIDIA GeForce GTX 1060 (Desktop)
NVIDIA GeForce GTX 980 (Laptop)
NVIDIA GeForce GTX 1080 (Desktop)
...
NVIDIA Quadro P4000 Max-Q
NVIDIA GeForce GTX 1060 (Desktop)
NVIDIA GeForce GTX 980 (Laptop)
NVIDIA GeForce GTX 1080 Mobile
NVIDIA GeForce GTX 1080 (Desktop)
...
NVIDIA GeForce GTX 1060 (Desktop)
NVIDIA GeForce GTX 980 (Laptop)
NVIDIA GeForce GTX 1080 Mobile
NVIDIA GeForce GTX 1080 (Desktop)
...
AMD Radeon R9 Fury
AMD Radeon R9 Nano
NVIDIA GeForce GTX 980 (Laptop)
NVIDIA GeForce GTX 1080 Mobile
NVIDIA GeForce GTX 1080 (Desktop)
» With all tested laptops playable in detail settings ultra.
Intel HD Graphics (Cherry Trail)
...
AMD Radeon R9 M390
AMD Radeon R9 Fury
AMD Radeon R7 370
AMD Radeon RX 580 (Laptop)
NVIDIA GeForce GTX 960
NVIDIA GeForce GTX 950
...
NVIDIA GeForce GTX 980 (Laptop)
Intel HD Graphics (Cherry Trail)
...
NVIDIA GeForce GTX 960
AMD Radeon R9 Fury
AMD Radeon RX 580 (Laptop)
NVIDIA GeForce GTX 970
NVIDIA GeForce GTX 980 (Laptop)
NVIDIA GeForce GTX 1080 (Desktop)
NVIDIA GeForce GTX 1060 (Desktop)
...
NVIDIA GeForce GTX 1080 (Desktop)
...
NVIDIA GeForce GTX 1060 (Desktop)
NVIDIA GeForce GTX 980 (Laptop)
AMD Radeon R9 Fury
NVIDIA GeForce GTX 1080 Mobile
NVIDIA GeForce GTX 1080 (Desktop)
...
...
AMD Radeon R9 Nano
AMD Radeon R9 Fury
NVIDIA GeForce GTX 1080 Mobile
NVIDIA GeForce GTX 1080 (Desktop)
...
AMD Radeon R9 Nano
AMD Radeon R9 Fury
NVIDIA GeForce GTX 1080 Mobile
NVIDIA GeForce GTX 1080 (Desktop)
» With all tested laptops playable in detail settings ultra.
...
AMD Radeon R9 Fury
NVIDIA GeForce GTX 960
NVIDIA GeForce GTX 950
NVIDIA GeForce GTX 980 (Laptop)
NVIDIA GeForce GTX 1060 (Desktop)
...
NVIDIA GeForce GTX 970
AMD Radeon R9 Fury
NVIDIA GeForce GTX 980 (Laptop)
NVIDIA GeForce GTX 1060 (Desktop)
...
NVIDIA GeForce GTX 980 (Laptop)
NVIDIA GeForce GTX 1060 (Desktop)
NVIDIA GeForce GTX 1080 Mobile
...
NVIDIA GeForce GTX 1080 Mobile
NVIDIA GeForce GTX 1080 (Desktop)
...
AMD Radeon R9 Fury
NVIDIA GeForce GTX 1080 Mobile
NVIDIA GeForce GTX 1080 (Desktop)
» With all tested laptops playable in detail settings ultra.
...
NVIDIA GeForce GTX 950
NVIDIA GeForce GTX 960
AMD Radeon RX Vega M GH
NVIDIA GeForce GTX 980 (Laptop)
NVIDIA GeForce GTX 1060 (Desktop)
NVIDIA Quadro P5200
...
NVIDIA GeForce GTX 960
NVIDIA GeForce GTX 970
NVIDIA Quadro P4000 Max-Q
NVIDIA GeForce GTX 1060 (Desktop)
NVIDIA GeForce GTX 980 (Laptop)
NVIDIA Quadro P5200
...
NVIDIA GeForce GTX 970
NVIDIA Quadro P4000 Max-Q
NVIDIA GeForce GTX 1060 (Desktop)
NVIDIA GeForce GTX 980 (Laptop)
NVIDIA GeForce GTX 1080 Mobile
NVIDIA GeForce GTX 1080 (Desktop)
...
...
AMD Radeon R9 Nano
AMD Radeon R9 Fury
NVIDIA GeForce GTX 1080 (Desktop)
NVIDIA GeForce GTX 1080 Mobile
...
AMD Radeon R9 Nano
AMD Radeon R9 Fury
NVIDIA Quadro P5200
NVIDIA GeForce GTX 1080 Mobile
NVIDIA GeForce GTX 1080 (Desktop)
» With all tested laptops playable in detail settings ultra.
Intel HD Graphics (Cherry Trail)
...
NVIDIA GeForce GTX 950M
AMD Radeon Pro 455
AMD Radeon Pro 450
AMD Radeon RX 580 (Laptop)
AMD Radeon R9 M390
AMD Radeon HD 8970M
NVIDIA GeForce GTX 960M
AMD Radeon R7 370
AMD Radeon Pro 460
NVIDIA Quadro M1000M
...
NVIDIA Quadro M5000M
Intel HD Graphics (Cherry Trail)
...
AMD FirePro W7170M
AMD Radeon RX 580 (Laptop)
NVIDIA Quadro M3000M
NVIDIA GeForce GTX 960
NVIDIA GeForce GTX 970
NVIDIA GeForce GTX 1060 (Desktop)
AMD Radeon R9 Fury
NVIDIA GeForce GTX 980 (Laptop)
...
NVIDIA Quadro M5000M
...
AMD Radeon R9 Fury
NVIDIA Quadro M5000M
NVIDIA GeForce GTX 970
NVIDIA GeForce GTX 980 (Laptop)
NVIDIA GeForce GTX 1060 (Desktop)
NVIDIA GeForce GTX 1080 Mobile
NVIDIA GeForce GTX 1080 (Desktop)
...
AMD Radeon R9 Fury
NVIDIA Quadro M5000M
NVIDIA GeForce GTX 1080 Mobile
NVIDIA GeForce GTX 1080 (Desktop)
...
NVIDIA GeForce GTX 980 (Laptop)
NVIDIA GeForce GTX 1060 (Desktop)
NVIDIA GeForce GTX 1080 Mobile
NVIDIA GeForce GTX 1080 (Desktop)
» With all tested laptops playable in detail settings ultra.
...
NVIDIA GeForce GTX 950
NVIDIA GeForce GTX 980 (Laptop)
NVIDIA GeForce GTX 1080 (Desktop)
NVIDIA GeForce GTX 1060 (Desktop)
...
NVIDIA GeForce GTX 950
NVIDIA GeForce GTX 980 (Laptop)
NVIDIA GeForce GTX 1060 (Desktop)
...
AMD Radeon RX 480 (Desktop)
AMD Radeon R9 Fury
NVIDIA GeForce GTX 970
NVIDIA GeForce GTX 980 (Laptop)
NVIDIA GeForce GTX 1080 Mobile
NVIDIA GeForce GTX 1060 (Desktop)
Intel Iris Pro Graphics 5200
...
NVIDIA GeForce GTX 1060 (Desktop)
AMD Radeon R9 Fury
NVIDIA GeForce GTX 1080 Mobile
NVIDIA GeForce GTX 1080 (Desktop)
» With all tested laptops playable in detail settings ultra.
Intel HD Graphics (Bay Trail)
...
AMD Radeon RX 580 (Laptop)
NVIDIA GeForce GTX 960M
NVIDIA GeForce GTX 1050 Ti Mobile
AMD Radeon HD 8970M
NVIDIA GeForce GTX 1050 Ti Max-Q
NVIDIA GeForce GTX 1050 Max-Q
NVIDIA GeForce GTX 1080 Mobile
NVIDIA GeForce GTX 960
...
NVIDIA GeForce GTX 1080 (Desktop)
...
NVIDIA GeForce 945M
AMD Radeon RX 580 (Laptop)
NVIDIA GeForce GTX 960M
NVIDIA GeForce GTX 1050 Max-Q
NVIDIA GeForce GTX 1050 Ti Mobile
NVIDIA GeForce GTX 1050 Ti Max-Q
AMD Radeon HD 8970M
NVIDIA GeForce GTX 960
NVIDIA GeForce GTX 1080 Mobile
...
NVIDIA GeForce GTX 1080 (Desktop)
...
NVIDIA GeForce GTX 960M
AMD Radeon RX 580 (Laptop)
AMD Radeon HD 8970M
NVIDIA GeForce GTX 1050 Max-Q
NVIDIA GeForce GTX 1050 Ti Max-Q
NVIDIA GeForce GTX 1050 Ti Mobile
NVIDIA GeForce GTX 960
NVIDIA GeForce GTX 1080 Mobile
...
NVIDIA GeForce GTX 1080 (Desktop)
...
AMD Radeon RX 580 (Laptop)
NVIDIA GeForce GTX 1050 Ti Max-Q
NVIDIA GeForce GTX 1050 Ti Mobile
NVIDIA GeForce GTX 960
NVIDIA GeForce GTX 1080 Mobile
AMD Radeon R9 Fury
...
...
NVIDIA GeForce GTX 970
AMD Radeon R9 Nano
AMD Radeon R9 Fury
NVIDIA GeForce GTX 1080 (Desktop)
» With all tested laptops playable in detail settings ultra.
295.8 [X] Nvidia Titan X (Pascal) AMD Ryzen 9 7900X 4.7GHz
Titan X Pascal
min:
225.3 fps, max:
-1 fps
303.7 [X] Nvidia Titan X (Pascal) AMD Ryzen 9 7950X 4.5GHz
Titan X Pascal
min:
248.7 fps, max:
-1 fps
~ 300 fps
+ Compare
- Hide Comparison
...
NVIDIA GeForce RTX 3070 Ti
245.1 [X] Nvidia Titan X (Pascal) AMD Ryzen 9 7900X 4.7GHz
Titan X Pascal
min:
211 fps, max:
-1 fps
272.2 [X] Nvidia Titan X (Pascal) AMD Ryzen 9 7950X 4.5GHz
Titan X Pascal
min:
232.8 fps, max:
-1 fps
~ 259 fps
+ Compare
- Hide Comparison
...
NVIDIA GeForce GTX 1650 Super (Desktop)
AMD Radeon RX 5600 XT (Desktop)
NVIDIA GeForce RTX 3070 Ti
241.2 [X] Nvidia Titan X (Pascal) AMD Ryzen 9 7900X 4.7GHz
Titan X Pascal
min:
198.6 fps, max:
-1 fps
263 [X] Nvidia Titan X (Pascal) AMD Ryzen 9 7950X 4.5GHz
Titan X Pascal
min:
223.2 fps, max:
-1 fps
~ 252 fps
+ Compare
- Hide Comparison
...
NVIDIA GeForce RTX 3070 Ti
224.1 [X] Nvidia Titan X (Pascal) AMD Ryzen 9 7900X 4.7GHz
Titan X Pascal
min:
188.7 fps, max:
-1 fps
240.6 [X] Nvidia Titan X (Pascal) AMD Ryzen 9 7950X 4.5GHz
Titan X Pascal
min:
204.9 fps, max:
-1 fps
~ 232 fps
+ Compare
- Hide Comparison
...
NVIDIA GeForce RTX 3070 Ti
159 [X] Nvidia Titan X (Pascal) AMD Ryzen 9 7900X 4.7GHz
Titan X Pascal
min:
132.9 fps, max:
-1 fps
160.5 [X] Nvidia Titan X (Pascal) AMD Ryzen 9 7950X 4.5GHz
Titan X Pascal
min:
137.8 fps, max:
-1 fps
~ 160 fps
+ Compare
- Hide Comparison
...
NVIDIA Titan RTX
NVIDIA GeForce RTX 3070 Ti
...
» With all tested laptops playable in detail settings ultra.
269.8 [X] Intel Xeon E5-2680 v4 2.4GHz
Titan X Pascal
min:
234 fps, max:
312 fps
451 [X] Nvidia Titan X (Pascal) AMD Ryzen 9 7900X 4.7GHz
Titan X Pascal
min:
55.9 fps, P0.1:
143.5 fps, P1:
307 fps, max:
1082 fps
483 [X] Nvidia Titan X (Pascal) AMD Ryzen 9 7950X 4.5GHz
Titan X Pascal
min:
96.9 fps, P0.1:
296 fps, P1:
396 fps, max:
1318 fps
~ 401 fps
+ Compare
- Hide Comparison
+ 📈 Graph
- 📈 Hide Graph
0 100 200 300 400 500 600 700 800 Tooltip : Ø462 (419.52-801)
: Ø488 (459.969-563.6)
...
AMD Radeon RX 5700 (Desktop)
AMD Radeon RX 5600 XT (Desktop)
AMD Radeon RX 5700 XT (Desktop)
NVIDIA GeForce RTX 2060 Super (Desktop)
NVIDIA GeForce RTX 3060 Ti
NVIDIA GeForce RTX 2080 Super Mobile
...
225.6 [X] Intel Xeon E5-2680 v4 2.4GHz
Titan X Pascal
min:
199 fps, max:
276 fps
299 [X] Nvidia Titan X (Pascal) AMD Ryzen 9 7900X 4.7GHz
Titan X Pascal
min:
67.7 fps, P0.1:
142.9 fps, P1:
226 fps, max:
823 fps
319 [X] Nvidia Titan X (Pascal) AMD Ryzen 9 7950X 4.5GHz
Titan X Pascal
min:
93.4 fps, P0.1:
223 fps, P1:
268 fps, max:
801 fps
~ 281 fps
+ Compare
- Hide Comparison
+ 📈 Graph
- 📈 Hide Graph
0 100 200 300 400 500 Tooltip : Ø302 (273.642-341.4)
: Ø329 (291.163-560)
...
NVIDIA GeForce RTX 2080 (Desktop)
AMD Radeon RX 5700 (Desktop)
NVIDIA GeForce RTX 2060 Super (Desktop)
NVIDIA GeForce RTX 2080 Super Mobile
AMD Radeon RX 5700 XT (Desktop)
...
159.7 [X] Intel Xeon E5-2680 v4 2.4GHz
Titan X Pascal
min:
135 fps, max:
186 fps
183.9 [X] Nvidia Titan X (Pascal) AMD Ryzen 9 7900X 4.7GHz
Titan X Pascal
min:
36.7 fps, P0.1:
95.8 fps, P1:
148.4 fps, max:
485 fps
199.3 [X] Nvidia Titan X (Pascal) AMD Ryzen 9 7950X 4.5GHz
Titan X Pascal
min:
66 fps, P0.1:
136.9 fps, P1:
169.7 fps, max:
608 fps
~ 181 fps
+ Compare
- Hide Comparison
+ 📈 Graph
- 📈 Hide Graph
0 100 200 300 400 500 600 700 800 900 1000 1100 1200 1300 1400 1500 1600 1700 1800 1900 2000 2100 2200 2300 2400 2500 2600 2700 2800 2900 3000 3100 Tooltip : Ø286 (163.44-3102)
: Ø202 (180.66-231.1)
Intel HD Graphics (Haswell)
...
NVIDIA GeForce RTX 2080 (Desktop)
AMD Radeon RX 6650 XT
NVIDIA GeForce RTX 3060 Ti
...
89.5 [X] Intel Xeon E5-2680 v4 2.4GHz
Titan X Pascal
min:
77 fps, max:
105 fps
94.5 [X] Nvidia Titan X (Pascal) AMD Ryzen 9 7900X 4.7GHz
Titan X Pascal
min:
49.2 fps, P0.1:
64.4 fps, P1:
75.5 fps, max:
294 fps
102.1 [X] Nvidia Titan X (Pascal) AMD Ryzen 9 7950X 4.5GHz
Titan X Pascal
min:
66.6 fps, P0.1:
74.4 fps, P1:
86.4 fps, max:
261 fps
~ 95 fps
+ Compare
- Hide Comparison
+ 📈 Graph
- 📈 Hide Graph
0 100 200 300 400 500 Tooltip : Ø99.9 (82.349-203.3)
: Ø113.6 (91.29-556)
...
AMD Radeon RX 5700 XT (Desktop)
NVIDIA GeForce RTX 3060 Ti
...
68.1 [X] Intel Xeon E5-2680 v4 2.4GHz
Titan X Pascal
min:
59 fps, max:
77 fps
68.1 [X] Nvidia Titan X (Pascal) AMD Ryzen 9 7900X 4.7GHz
Titan X Pascal
min:
35.5 fps, P0.1:
53.7 fps, P1:
59.1 fps, max:
439 fps
70.8 [X] Nvidia Titan X (Pascal) AMD Ryzen 9 7950X 4.5GHz
Titan X Pascal
min:
45.3 fps, P0.1:
53.2 fps, P1:
62.7 fps, max:
123.1 fps
~ 69 fps
+ Compare
- Hide Comparison
+ 📈 Graph
- 📈 Hide Graph
0 100 200 Tooltip : Ø73.4 (62.034-200.7)
: Ø74.7 (64.27-108.1)
...
AMD Radeon RX 6700 XT
NVIDIA GeForce RTX 3060
...
» With all tested laptops playable in detail settings ultra.
Additional Benchmarks
Ultra Graphics & Postprocessing (HBAO+) 3840x2160
48.3 [X] Nvidia Titan X (Pascal) AMD Ryzen 9 7950X 4.5GHz
Titan X Pascal
min:
39 fps, P0.1:
40.2 fps, P1:
42.7 fps, max:
66.7 fps
Medium Graphics & Postprocessing 1920x1080
223 [X] Nvidia Titan X (Pascal) AMD Ryzen 9 7950X 4.5GHz
Titan X Pascal
min:
97.9 fps, P0.1:
156.3 fps, P1:
188 fps, max:
747 fps
...
NVIDIA GeForce GTX 960M
NVIDIA Quadro K2100M
AMD Radeon R9 M295X
NVIDIA GeForce 945M
NVIDIA Quadro M2000M
NVIDIA Quadro M1000M
NVIDIA Quadro K3100M
AMD FirePro W7170M
NVIDIA GeForce GTX 860M
...
Intel HD Graphics (Braswell)
...
NVIDIA Quadro P2000 Max-Q
NVIDIA GeForce GTX 970
NVIDIA Quadro K5100M
AMD Radeon R7 370
NVIDIA GeForce GTX 950
NVIDIA GeForce GTX 980 (Laptop)
NVIDIA Quadro M5000M
...
NVIDIA GeForce GTX 1060 (Desktop)
...
NVIDIA Quadro P2000 Max-Q
AMD Radeon R7 370
AMD FirePro W7170M
NVIDIA Quadro M3000M
NVIDIA GeForce GTX 1050 Ti Mobile
NVIDIA GeForce GTX 950
NVIDIA GeForce GTX 970
...
...
NVIDIA Quadro M5000M
AMD Radeon RX 480 (Desktop)
NVIDIA GeForce GTX 970
AMD Radeon R9 Fury
NVIDIA GeForce GTX 980 (Laptop)
AMD Radeon R9 Nano
NVIDIA GeForce GTX 1060 (Desktop)
...
...
AMD Radeon R9 Fury
NVIDIA GeForce GTX 980 (Laptop)
NVIDIA GeForce GTX 1060 (Desktop)
NVIDIA GeForce GTX 1080 Mobile
NVIDIA GeForce GTX 1080 (Desktop)
AMD Radeon R9 Nano
NVIDIA GeForce GTX 970
...
» With all tested laptops playable in detail settings ultra.
168.5 [X] Intel Xeon E5-2680 v4 2.4GHz
Titan X Pascal
min:
4.6 fps, max:
276.6 fps
187.4 [X] Nvidia Titan X (Pascal) AMD Ryzen 9 7900X 4.7GHz
Titan X Pascal
min:
7.02 fps, P1:
200 fps, max:
673 fps
187.8 [X] Nvidia Titan X (Pascal) AMD Ryzen 9 7950X 4.5GHz
Titan X Pascal
min:
7.74 fps, P1:
200 fps, max:
703 fps
~ 181 fps
+ Compare
- Hide Comparison
...
NVIDIA GeForce RTX 3060 Ti
NVIDIA GeForce RTX 3060
NVIDIA GeForce RTX 2060 Super (Desktop)
AMD Radeon RX 5700 XT (Desktop)
NVIDIA T600
NVIDIA GeForce RTX 2070 Super Max-Q
NVIDIA GeForce RTX 2070 Super Mobile
...
161.9 [X] Intel Xeon E5-2680 v4 2.4GHz
Titan X Pascal
min:
5.4 fps, max:
261.2 fps
187.2 [X] Nvidia Titan X (Pascal) AMD Ryzen 9 7900X 4.7GHz
Titan X Pascal
min:
7.66 fps, P1:
200 fps, max:
400 fps
187.6 [X] Nvidia Titan X (Pascal) AMD Ryzen 9 7950X 4.5GHz
Titan X Pascal
min:
5.96 fps, P1:
200 fps, max:
623 fps
~ 179 fps
+ Compare
- Hide Comparison
...
NVIDIA GeForce RTX 2070 Super Mobile
NVIDIA GeForce RTX 2060 Super (Desktop)
AMD Radeon RX 5700 XT (Desktop)
AMD Radeon RX 5700 (Desktop)
NVIDIA GeForce RTX 2080 Super Mobile
NVIDIA Titan RTX
...
136.3 [X] Intel Xeon E5-2680 v4 2.4GHz
Titan X Pascal
min:
26.4 fps, max:
241.5 fps
186.1 [X] Nvidia Titan X (Pascal) AMD Ryzen 9 7900X 4.7GHz
Titan X Pascal
min:
4.52 fps, P1:
166.7 fps, max:
546 fps
187.6 [X] Nvidia Titan X (Pascal) AMD Ryzen 9 7950X 4.5GHz
Titan X Pascal
min:
6.32 fps, P1:
200 fps, max:
540 fps
~ 170 fps
+ Compare
- Hide Comparison
...
NVIDIA GeForce RTX 3060
AMD Radeon RX 5700 (Desktop)
AMD Radeon RX 5600 XT (Desktop)
NVIDIA GeForce RTX 2060 Super (Desktop)
AMD Radeon RX 5700 XT (Desktop)
NVIDIA GeForce GTX 1660 Super (Desktop)
NVIDIA GeForce RTX 2080 Super Mobile
...
112.5 [X] Intel Xeon E5-2680 v4 2.4GHz
Titan X Pascal
min:
5.6 fps, max:
194.8 fps
134.5 [X] Nvidia Titan X (Pascal) AMD Ryzen 9 7900X 4.7GHz
Titan X Pascal
min:
9.11 fps, P1:
90.9 fps, max:
274 fps
137.7 [X] Nvidia Titan X (Pascal) AMD Ryzen 9 7950X 4.5GHz
Titan X Pascal
min:
6.26 fps, P1:
90.9 fps, max:
260 fps
~ 128 fps
+ Compare
- Hide Comparison
...
NVIDIA Titan RTX
NVIDIA GeForce RTX 2080 (Desktop)
AMD Radeon RX 6700 XT
AMD Radeon RX 6750 XT
...
101.9 [X] Nvidia Titan X (Pascal) AMD Ryzen 9 7900X 4.7GHz
Titan X Pascal
min:
48.4 fps, P1:
71.4 fps, max:
207 fps
103.5 [X] Nvidia Titan X (Pascal) AMD Ryzen 9 7950X 4.5GHz
Titan X Pascal
min:
6.62 fps, P1:
71.4 fps, max:
279 fps
~ 103 fps
+ Compare
- Hide Comparison
...
NVIDIA RTX A6000
AMD Radeon RX 6700 XT
AMD Radeon RX 6750 XT
NVIDIA Titan RTX
...
95.5 [X] Intel Xeon E5-2680 v4 2.4GHz
Titan X Pascal
min:
37.9 fps, max:
174.5 fps
98.5 [X] Nvidia Titan X (Pascal) AMD Ryzen 9 7900X 4.7GHz
Titan X Pascal
min:
7.19 fps, P1:
76.9 fps, max:
380 fps
100.1 [X] Nvidia Titan X (Pascal) AMD Ryzen 9 7950X 4.5GHz
Titan X Pascal
min:
14 fps, P1:
76.9 fps, max:
253 fps
~ 98 fps
+ Compare
- Hide Comparison
...
NVIDIA GeForce RTX 2080 Super Mobile
AMD Radeon RX 6700 XT
AMD Radeon RX 6750 XT
NVIDIA GeForce RTX 2080 (Desktop)
...
» With all tested laptops playable in detail settings ultra.
Additional Benchmarks
Highest Settings possible 16xAF 4xMSAA + FXAA 3840x2160
51.7 [X] Nvidia Titan X (Pascal) AMD Ryzen 9 7900X 4.7GHz
Titan X Pascal
min:
6.34 fps, P1:
40 fps, max:
205 fps
52.4 [X] Nvidia Titan X (Pascal) AMD Ryzen 9 7950X 4.5GHz
Titan X Pascal
min:
6.25 fps, P1:
40 fps, max:
213 fps
Normal/Off 4xAF 1920x1080
187.1 [X] Nvidia Titan X (Pascal) AMD Ryzen 9 7900X 4.7GHz
Titan X Pascal
min:
4.73 fps, P1:
166.7 fps, max:
589 fps
187.7 [X] Nvidia Titan X (Pascal) AMD Ryzen 9 7950X 4.5GHz
Titan X Pascal
min:
7.63 fps, P1:
200 fps, max:
613 fps
Lowest Settings possible 1920x1080
187.5 [X] Nvidia Titan X (Pascal) AMD Ryzen 9 7900X 4.7GHz
Titan X Pascal
min:
9.35 fps, P1:
200 fps, max:
542 fps
187.8 [X] Nvidia Titan X (Pascal) AMD Ryzen 9 7950X 4.5GHz
Titan X Pascal
min:
5.74 fps, P1:
200 fps, max:
737 fps
...
AMD Radeon R9 M295X
Intel HD Graphics 510
Intel Iris Plus Graphics G7 (Ice Lake 64 EU)
NVIDIA GeForce GTX 960
NVIDIA Quadro K5100M
NVIDIA GeForce GTX 980 (Laptop)
AMD Radeon HD 8970M
AMD Radeon RX 580 (Desktop)
Intel Iris Graphics 550
NVIDIA GeForce GTX 960M
NVIDIA GeForce GTX 970
NVIDIA GeForce 945M
...
Intel HD Graphics (Bay Trail)
...
AMD Radeon HD 8970M
NVIDIA GeForce GTX 960
NVIDIA GeForce GTX 980 (Laptop)
AMD Radeon R7 370
NVIDIA GeForce GTX 970
AMD Radeon RX 580 (Desktop)
NVIDIA GeForce GTX 1060 (Desktop)
...
AMD Radeon R7 370
NVIDIA GeForce GTX 980 (Laptop)
NVIDIA GeForce GTX 970
AMD Radeon RX 580 (Desktop)
NVIDIA GeForce GTX 1060 (Desktop)
NVIDIA GeForce GTX 1080 Mobile
...
NVIDIA GeForce GTX 980 (Laptop)
NVIDIA GeForce GTX 970
NVIDIA GeForce GTX 1080 Mobile
NVIDIA GeForce GTX 1060 (Desktop)
AMD Radeon RX 580 (Desktop)
» With all tested laptops playable in detail settings ultra.
Intel HD Graphics (Bay Trail)
...
AMD Radeon RX Vega 64
NVIDIA GeForce GTX 960
AMD Radeon RX Vega 56
AMD Radeon VII
NVIDIA GeForce RTX 2060 (Desktop)
NVIDIA GeForce GTX 950
NVIDIA GeForce GTX 970
NVIDIA GeForce RTX 2080 (Desktop)
AMD Radeon RX 570 (Desktop)
NVIDIA GeForce GTX 980 (Laptop)
...
NVIDIA Titan RTX
...
AMD Radeon RX 580 (Desktop)
NVIDIA GeForce GTX 960
AMD Radeon RX Vega 64
AMD Radeon RX 570 (Desktop)
NVIDIA GeForce RTX 2060 (Desktop)
NVIDIA GeForce GTX 970
AMD Radeon VII
NVIDIA GeForce GTX 980 (Laptop)
NVIDIA GeForce GTX 1660 Ti (Desktop)
...
NVIDIA Titan RTX
...
AMD Radeon RX 570 (Desktop)
NVIDIA GeForce GTX 970
AMD Radeon RX Vega 64
NVIDIA GeForce RTX 2060 Super (Desktop)
AMD Radeon VII
NVIDIA GeForce RTX 2060 (Desktop)
NVIDIA Titan RTX
NVIDIA GeForce GTX 1660 Ti (Desktop)
AMD Radeon RX Vega 56
NVIDIA GeForce GTX 1080 (Desktop)
...
NVIDIA Titan RTX
...
NVIDIA GeForce RTX 2060 (Desktop)
NVIDIA GeForce GTX 1080 Mobile
NVIDIA GeForce GTX 1080 (Desktop)
AMD Radeon VII
NVIDIA GeForce RTX 2060 Super (Desktop)
NVIDIA Titan RTX
NVIDIA GeForce RTX 2080 (Desktop)
...
NVIDIA Titan RTX
Intel Iris Pro Graphics 5200
...
NVIDIA GeForce RTX 2060 Super (Desktop)
NVIDIA GeForce GTX 1080 (Desktop)
NVIDIA GeForce GTX 1080 Mobile
NVIDIA GeForce RTX 2080 (Desktop)
NVIDIA Titan RTX
» With all tested laptops playable in detail settings ultra.
...
NVIDIA Quadro P2000 Max-Q
NVIDIA GeForce GTX 1080 Mobile
NVIDIA Quadro P4000 Max-Q
NVIDIA GeForce GTX 950
NVIDIA Quadro M5000M
NVIDIA GeForce GTX 970
AMD Radeon R7 370
...
...
AMD Radeon R9 Fury
NVIDIA Quadro M3000M
NVIDIA GeForce GTX 950
NVIDIA GeForce GTX 1080 Mobile
AMD Radeon R7 370
NVIDIA Quadro M5000M
NVIDIA GeForce GTX 970
NVIDIA GeForce GTX 980 (Laptop)
...
...
AMD Radeon R9 Fury
NVIDIA GeForce GTX 1080 Mobile
NVIDIA GeForce GTX 970
NVIDIA GeForce GTX 980 (Laptop)
AMD Radeon RX 480 (Desktop)
NVIDIA Quadro P5200
...
NVIDIA GeForce GTX 980 (Laptop)
AMD Radeon R9 Nano
NVIDIA GeForce GTX 1080 (Desktop)
NVIDIA Quadro P5200
NVIDIA GeForce GTX 1080 Mobile
...
» With all tested laptops playable in detail settings ultra.
...
NVIDIA GeForce GTX 765M SLI
NVIDIA Quadro M2000M
AMD Radeon R9 M390
NVIDIA GeForce GTX 780M
AMD FirePro W7170M
NVIDIA Quadro P600
NVIDIA Quadro M3000M
AMD Radeon Pro 455
AMD FirePro M6100
...
Intel HD Graphics (Bay Trail)
...
NVIDIA GeForce GTX 1050 Ti Mobile
NVIDIA Quadro P2000 Max-Q
NVIDIA Quadro M4000M
NVIDIA GeForce GTX 1050 Max-Q
NVIDIA GeForce GTX 1050 Ti Max-Q
NVIDIA GeForce GTX 960
AMD Radeon RX 580 (Desktop)
NVIDIA Quadro P2000
NVIDIA GeForce GTX 1060 (Desktop)
NVIDIA Quadro P4000 Max-Q
...
Intel HD Graphics (Bay Trail)
...
NVIDIA Quadro M4000M
NVIDIA GeForce GTX 1050 Ti Max-Q
NVIDIA Quadro P2000
NVIDIA GeForce GTX 960
NVIDIA Quadro P4000 Max-Q
AMD Radeon RX 580 (Desktop)
NVIDIA GeForce GTX 1060 (Desktop)
...
Intel HD Graphics (Bay Trail)
...
NVIDIA GeForce GTX 1660 Super (Desktop)
NVIDIA GeForce GTX 1080 (Desktop)
AMD Radeon RX Vega 64
NVIDIA GeForce RTX 2070 Super Max-Q
NVIDIA GeForce GTX 1080 Mobile
NVIDIA Quadro RTX 5000 Max-Q
NVIDIA GeForce RTX 2070 Super Mobile
NVIDIA GeForce RTX 2060 Super (Desktop)
...
» With all tested laptops playable in detail settings ultra.
 Deutsch
 English
 Español
 Français
 Italiano
 Nederlands
 Polski
 Português
 Русский
 Türkçe
 Svenska
 Chinese
 Magyar