 Deutsch
 English
 Español
 Français
 Italiano
 Nederlands
 Polski
 Português
 Русский
 Türkçe
 Svenska
 Chinese
 Magyar
联想 ThinkPad X1 Carbon 20FB-005XUS 笔记本电脑简短评测


| |||||||||||||||||||||||||
Brightness Distribution: 89 %
Center on Battery: 321.7 cd/m²
Contrast: 1094:1 (Black: 0.294 cd/m²)
ΔE Color 3.96 | 0.5-29.43 Ø5
ΔE Greyscale 3.15 | 0.57-98 Ø5.3
82.7% sRGB (Argyll 1.6.3 3D)
53.8% AdobeRGB 1998 (Argyll 1.6.3 3D)
60.3% AdobeRGB 1998 (Argyll 2.2.0 3D)
83.1% sRGB (Argyll 2.2.0 3D)
58.9% Display P3 (Argyll 2.2.0 3D)
Gamma: 2.34
| Lenovo ThinkPad X1 Carbon 20FB-005XUS 14.00, 1920x1080 | Lenovo ThinkPad X1 Carbon 20FB003RGE 14.00, 2560x1440 | Lenovo ThinkPad T460s-20FA003GGE 14.00, 2560x1440 | Lenovo Thinkpad X1 Yoga 20FQ-000QUS 14.00, 2560x1440 | HP ProBook 440 G3 14.00, 1920x1080 | |
|---|---|---|---|---|---|
| Display | 13% | 17% | 16% | -31% | |
| Display P3 Coverage | 58.9 | 66.7 13% | 68.7 17% | 68.1 16% | 39.6 -33% |
| sRGB Coverage | 83.1 | 94.7 14% | 98.1 18% | 97.2 17% | 59.1 -29% |
| AdobeRGB 1998 Coverage | 60.3 | 68.4 13% | 70.4 17% | 70.2 16% | 40.94 -32% |
| Response Times | 10% | 10% | 5% | 2% | |
| Response Time Grey 50% / Grey 80% * | 47.2 ? | 44 ? 7% | 35.6 ? 25% | 38 ? 19% | 46 ? 3% |
| Response Time Black / White * | 27.6 ? | 24 ? 13% | 29.2 ? -6% | 30.4 ? -10% | 27.6 ? -0% |
| PWM Frequency | 220 ? | 220 ? | 219 ? | ||
| Screen | 2% | -15% | -27% | -62% | |
| Brightness middle | 321.7 | 272 -15% | 257 -20% | 284.7 -12% | 246 -24% |
| Brightness | 301 | 268 -11% | 248 -18% | 272 -10% | 215 -29% |
| Brightness Distribution | 89 | 95 7% | 94 6% | 89 0% | 84 -6% |
| Black Level * | 0.294 | 0.32 -9% | 0.26 12% | 0.383 -30% | 0.5 -70% |
| Contrast | 1094 | 850 -22% | 988 -10% | 743 -32% | 492 -55% |
| Colorchecker dE 2000 * | 3.96 | 2.61 34% | 4.59 -16% | 5.24 -32% | 8.6 -117% |
| Colorchecker dE 2000 max. * | 6.69 | 6.43 4% | 9.72 -45% | 11.22 -68% | |
| Greyscale dE 2000 * | 3.15 | 3.31 -5% | 6.38 -103% | 7.32 -132% | 9.36 -197% |
| Gamma | 2.34 94% | 2.35 94% | 2.51 88% | 2.22 99% | 2.39 92% |
| CCT | 7082 92% | 6360 102% | 6238 104% | 6277 104% | 11226 58% |
| Color Space (Percent of AdobeRGB 1998) | 53.8 | 63 17% | 65 21% | 70.17 30% | 37.8 -30% |
| Color Space (Percent of sRGB) | 82.7 | 95 15% | 98 19% | 94.68 14% | 59.1 -29% |
| Total Average (Program / Settings) | 8% /
5% | 4% /
-6% | -2% /
-14% | -30% /
-46% |
* ... smaller is better
Display Response Times
| ↔ Response Time Black to White | ||
|---|---|---|
| 27.6 ms ... rise ↗ and fall ↘ combined | ↗ 4.4 ms rise | 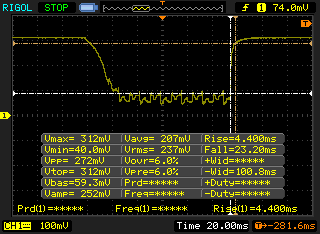 |
| ↘ 23.2 ms fall | ||
| The screen shows relatively slow response rates in our tests and may be too slow for gamers. In comparison, all tested devices range from 0.1 (minimum) to 240 (maximum) ms. » 66 % of all devices are better. This means that the measured response time is worse than the average of all tested devices (21.5 ms). | ||
| ↔ Response Time 50% Grey to 80% Grey | ||
| 47.2 ms ... rise ↗ and fall ↘ combined | ↗ 18.8 ms rise | 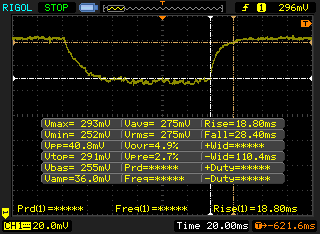 |
| ↘ 28.4 ms fall | ||
| The screen shows slow response rates in our tests and will be unsatisfactory for gamers. In comparison, all tested devices range from 0.2 (minimum) to 636 (maximum) ms. » 79 % of all devices are better. This means that the measured response time is worse than the average of all tested devices (33.7 ms). | ||
Screen Flickering / PWM (Pulse-Width Modulation)
| Screen flickering / PWM not detected | 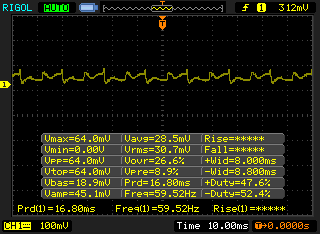 | ||
In comparison: 53 % of all tested devices do not use PWM to dim the display. If PWM was detected, an average of 17900 (minimum: 5 - maximum: 3846000) Hz was measured. | |||
| Cinebench R15 | |
| CPU Single 64Bit (sort by value) | |
| Lenovo ThinkPad X1 Carbon 20FB-005XUS | |
| Lenovo ThinkPad X1 Carbon 20FB003RGE | |
| Asus GL552VW-DK725T | |
| HP ProBook 430 G3 P4N86EA | |
| Lenovo IdeaPad Z40-59422614 | |
| Toshiba Tecra A50-C1510W10 | |
| CPU Multi 64Bit (sort by value) | |
| Lenovo ThinkPad X1 Carbon 20FB-005XUS | |
| Lenovo ThinkPad X1 Carbon 20FB003RGE | |
| Asus GL552VW-DK725T | |
| HP ProBook 430 G3 P4N86EA | |
| Lenovo IdeaPad Z40-59422614 | |
| Toshiba Tecra A50-C1510W10 | |
| Cinebench R11.5 | |
| CPU Single 64Bit (sort by value) | |
| Lenovo ThinkPad X1 Carbon 20FB-005XUS | |
| Lenovo ThinkPad X1 Carbon 20FB003RGE | |
| Asus GL552VW-DK725T | |
| HP ProBook 430 G3 P4N86EA | |
| Lenovo IdeaPad Z40-59422614 | |
| Toshiba Tecra A50-C1510W10 | |
| CPU Multi 64Bit (sort by value) | |
| Lenovo ThinkPad X1 Carbon 20FB-005XUS | |
| Lenovo ThinkPad X1 Carbon 20FB003RGE | |
| Asus GL552VW-DK725T | |
| HP ProBook 430 G3 P4N86EA | |
| Lenovo IdeaPad Z40-59422614 | |
| Toshiba Tecra A50-C1510W10 | |
| Cinebench R10 | |
| Rendering Multiple CPUs 32Bit (sort by value) | |
| Lenovo ThinkPad X1 Carbon 20FB-005XUS | |
| Lenovo ThinkPad X1 Carbon 20FB003RGE | |
| Asus GL552VW-DK725T | |
| HP ProBook 430 G3 P4N86EA | |
| Lenovo IdeaPad Z40-59422614 | |
| Toshiba Tecra A50-C1510W10 | |
| Rendering Single 32Bit (sort by value) | |
| Lenovo ThinkPad X1 Carbon 20FB-005XUS | |
| Lenovo ThinkPad X1 Carbon 20FB003RGE | |
| Asus GL552VW-DK725T | |
| HP ProBook 430 G3 P4N86EA | |
| Lenovo IdeaPad Z40-59422614 | |
| Toshiba Tecra A50-C1510W10 | |
| wPrime 2.10 - 1024m (sort by value) | |
| Lenovo ThinkPad X1 Carbon 20FB-005XUS | |
| Asus GL552VW-DK725T | |
| HP ProBook 430 G3 P4N86EA | |
| Lenovo IdeaPad Z40-59422614 | |
| Toshiba Tecra A50-C1510W10 | |
| Super Pi Mod 1.5 XS 32M - 32M (sort by value) | |
| Lenovo ThinkPad X1 Carbon 20FB-005XUS | |
| Lenovo ThinkPad X1 Carbon 20FB003RGE | |
| Asus GL552VW-DK725T | |
| HP ProBook 430 G3 P4N86EA | |
| Lenovo IdeaPad Z40-59422614 | |
| Toshiba Tecra A50-C1510W10 | |
| 3DMark 11 - 1280x720 Performance Physics (sort by value) | |
| Lenovo ThinkPad X1 Carbon 20FB-005XUS | |
| Lenovo ThinkPad X1 Carbon 20FB003RGE | |
| Asus GL552VW-DK725T | |
| HP ProBook 430 G3 P4N86EA | |
| Lenovo IdeaPad Z40-59422614 | |
| Toshiba Tecra A50-C1510W10 | |
* ... smaller is better
| PCMark 8 Home Score Accelerated v2 | 3237 points | |
| PCMark 8 Creative Score Accelerated v2 | 3989 points | |
| PCMark 8 Work Score Accelerated v2 | 3944 points | |
Help | ||
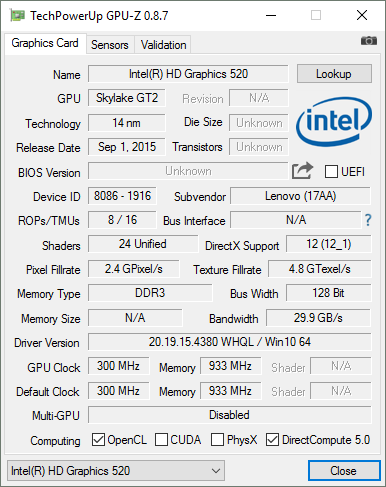
| Lenovo ThinkPad X1 Carbon 20FB-005XUS HD Graphics 520, 6300U, Samsung SM951 MZVPV256 m.2 | HP EliteBook 840 G3 T8X41EA HD Graphics 520, 6600U, Samsung SSD 850 EVO 500GB | Lenovo ThinkPad T460s-20FA003GGE HD Graphics 520, 6600U, Samsung SSD SM951a 512GB M.2 PCIe 3.0 x4 NVMe (MZVKV512) | Lenovo Thinkpad X1 Yoga 20FQ-000QUS HD Graphics 520, 6500U, Samsung SSD PM871 MZNLN512HCJH | Dell Latitude 14 7000 Series E7470 HD Graphics 520, 6600U, Samsung SSD PM851 M.2 2280 256GB | |
|---|---|---|---|---|---|
| AS SSD | -31% | 20% | -45% | -57% | |
| Copy Game MB/s | 598 | 791 32% | 236.4 -60% | ||
| Copy Program MB/s | 354.9 | 421.9 19% | 196.5 -45% | ||
| Copy ISO MB/s | 709 | 1135 60% | 258.4 -64% | ||
| Score Total | 1976 | 1125 -43% | 2439 23% | 1068 -46% | 913 -54% |
| Score Write | 552 | 436 -21% | 621 13% | 382 -31% | 283 -49% |
| Score Read | 960 | 447 -53% | 1218 27% | 449 -53% | 417 -57% |
| Access Time Write * | 0.036 | 0.034 6% | 0.033 8% | 0.046 -28% | 0.04 -11% |
| Access Time Read * | 0.043 | 0.053 -23% | 0.041 5% | 0.058 -35% | 0.113 -163% |
| 4K-64 Write | 338.3 | 290.8 -14% | 366 8% | 261.9 -23% | 170 -50% |
| 4K-64 Read | 731 | 355.9 -51% | 968 32% | 369.1 -50% | 336.1 -54% |
| 4K Write | 103.7 | 98.6 -5% | 114.4 10% | 75.7 -27% | 85.1 -18% |
| 4K Read | 43.72 | 41.29 -6% | 45.41 4% | 30.35 -31% | 30.91 -29% |
| Seq Write | 1099 | 464 -58% | 1407 28% | 447.5 -59% | 283.7 -74% |
| Seq Read | 1851 | 498.6 -73% | 2039 10% | 490.1 -74% | 495.5 -73% |
* ... smaller is better

| 3DMark 11 | |
| 1280x720 Performance (sort by value) | |
| Lenovo ThinkPad X1 Carbon 20FB-005XUS | |
| Lenovo ThinkPad X1 Carbon 20FB003RGE | |
| Lenovo Yoga 500-14ISK | |
| Apple MacBook 12 (Early 2016) 1.1 GHz | |
| Toshiba Tecra Z50 A-12K | |
| Acer Aspire ES1-521-87DN | |
| 1280x720 Performance GPU (sort by value) | |
| Lenovo ThinkPad X1 Carbon 20FB-005XUS | |
| Lenovo ThinkPad X1 Carbon 20FB003RGE | |
| Lenovo Yoga 500-14ISK | |
| Apple MacBook 12 (Early 2016) 1.1 GHz | |
| Toshiba Tecra Z50 A-12K | |
| Acer Aspire ES1-521-87DN | |
| 3DMark 11 Performance | 1396 points | |
| 3DMark Ice Storm Standard Score | 57713 points | |
| 3DMark Cloud Gate Standard Score | 5659 points | |
| 3DMark Fire Strike Score | 772 points | |
Help | ||
| low | med. | high | ultra | |
| BioShock Infinite (2013) | 47.6 | 27.1 | 24.8 | 6.6 |
| Lenovo ThinkPad X1 Carbon 20FB-005XUS HD Graphics 520, 6300U, Samsung SM951 MZVPV256 m.2 | Lenovo ThinkPad X1 Carbon 20FB003RGE HD Graphics 520, 6500U, Samsung SSD PM871 MZNLN256HCHP | HP EliteBook 840 G3 T9X59ET#ABD HD Graphics 520, 6500U, Samsung SSD PM851 256 GB MZNTE256HMHP | Lenovo ThinkPad T460s-20FA003GGE HD Graphics 520, 6600U, Samsung SSD SM951a 512GB M.2 PCIe 3.0 x4 NVMe (MZVKV512) | Lenovo Thinkpad X1 Yoga 20FQ-000QUS HD Graphics 520, 6500U, Samsung SSD PM871 MZNLN512HCJH | Dell Latitude 14 7000 Series E7470 HD Graphics 520, 6600U, Samsung SSD PM851 M.2 2280 256GB | |
|---|---|---|---|---|---|---|
| Noise | -2% | -9% | -1% | 0% | -2% | |
| off / environment * | 28.8 | 29.1 -1% | 31.2 -8% | 29.2 -1% | 28.8 -0% | 31.2 -8% |
| Idle Minimum * | 28.8 | 29.1 -1% | 31.2 -8% | 29.2 -1% | 28.8 -0% | 31.2 -8% |
| Idle Average * | 28.9 | 29.1 -1% | 32.1 -11% | 29.2 -1% | 28.8 -0% | 31.2 -8% |
| Idle Maximum * | 28.9 | 29.1 -1% | 33.1 -15% | 29.2 -1% | 28.8 -0% | 31.2 -8% |
| Load Average * | 35 | 35.6 -2% | 36.2 -3% | 33.7 4% | 35.2 -1% | 31.9 9% |
| Load Maximum * | 35.8 | 38.1 -6% | 37.8 -6% | 38.5 -8% | 35.2 2% | 31.9 11% |
* ... smaller is better
Noise Level
| Idle |
| 28.8 / 28.9 / 28.9 dB(A) |
| Load |
| 35 / 35.8 dB(A) |
 | ||
30 dB silent 40 dB(A) audible 50 dB(A) loud |
||
min: | ||
(±) The maximum temperature on the upper side is 40 °C / 104 F, compared to the average of 34.2 °C / 94 F, ranging from 21.2 to 62.5 °C for the class Office.
(±) The bottom heats up to a maximum of 42.8 °C / 109 F, compared to the average of 36.7 °C / 98 F
(+) In idle usage, the average temperature for the upper side is 24.2 °C / 76 F, compared to the device average of 29.5 °C / 85 F.
(+) The palmrests and touchpad are cooler than skin temperature with a maximum of 24.6 °C / 76.3 F and are therefore cool to the touch.
(+) The average temperature of the palmrest area of similar devices was 27.7 °C / 81.9 F (+3.1 °C / 5.6 F).
| Lenovo ThinkPad X1 Carbon 20FB-005XUS HD Graphics 520, 6300U, Samsung SM951 MZVPV256 m.2 | Lenovo ThinkPad X1 Carbon 20FB003RGE HD Graphics 520, 6500U, Samsung SSD PM871 MZNLN256HCHP | HP EliteBook 840 G3 T9X59ET#ABD HD Graphics 520, 6500U, Samsung SSD PM851 256 GB MZNTE256HMHP | Lenovo ThinkPad T460s-20FA003GGE HD Graphics 520, 6600U, Samsung SSD SM951a 512GB M.2 PCIe 3.0 x4 NVMe (MZVKV512) | Lenovo Thinkpad X1 Yoga 20FQ-000QUS HD Graphics 520, 6500U, Samsung SSD PM871 MZNLN512HCJH | Dell Latitude 14 7000 Series E7470 HD Graphics 520, 6600U, Samsung SSD PM851 M.2 2280 256GB | |
|---|---|---|---|---|---|---|
| Power Consumption | 4% | 15% | -2% | -19% | -2% | |
| Idle Minimum * | 7.6 | 3.8 50% | 3.8 50% | 3.8 50% | 6.82 10% | 5.1 33% |
| Idle Average * | 9 | 7.1 21% | 6.3 30% | 7.1 21% | 8.21 9% | 8.5 6% |
| Idle Maximum * | 9.6 | 7.7 20% | 6.8 29% | 7.8 19% | 17.55 -83% | 10.1 -5% |
| Load Average * | 24.5 | 30.2 -23% | 34.4 -40% | 36.3 -48% | 28.81 -18% | 35.2 -44% |
| Load Maximum * | 30.3 | 44.7 -48% | 28.3 7% | 46 -52% | 34.07 -12% | 31 -2% |
* ... smaller is better
| Off / Standby | |
| Idle | |
| Load |
|
| Lenovo ThinkPad X1 Carbon 20FB-005XUS 52 Wh | Lenovo ThinkPad X1 Carbon 20FB003RGE 52 Wh | HP EliteBook 840 G3 T9X59ET#ABD 46 Wh | Lenovo ThinkPad T460s-20FA003GGE 49 Wh | Lenovo Thinkpad X1 Yoga 20FQ-000QUS 52 Wh | |
|---|---|---|---|---|---|
| Battery Runtime | 6% | 20% | -20% | 1% | |
| Reader / Idle | 776 | 942 21% | 1020 31% | 833 7% | 922 19% |
| WiFi v1.3 | 411 | 429 4% | 453 10% | 340 -17% | 356 -13% |
| Load | 123 | 115 -7% | 146 19% | 62 -50% | 120 -2% |
Pros
Cons
由于竞争机型如MacBook Air或XPS 13的优异表现,联想ThinkPad X1 Carbon系列延续强势表现的压力也越来越大。它的最新机型在我们最近的评测中表现更进一步,而手机移动网络的选项也一定会吸引很多感兴趣的用户。
而它的酷睿i5全高清型号相比酷睿i7WQHD机型会在电池续航和发热量上表现更出色吗?它的电池续航相比售价更高的型号并没有太大的改变,不过机身表面温度相比更低,但最多也不会超过2摄氏度。这些小区别意味着如果用户需要更强的性能,更准确的色彩和更高的分辨率的话,可以选择高端型号而不用担心牺牲续航时间。
酷睿i5机型的性能比我们预想更低,特别是单核性能的表现。可能最值得一提的是全高清屏幕没有采用闪烁亮度控制,而WQHD机型则有闪烁。因此,对屏幕闪烁敏感的用户可以考虑放弃更高性能选择全高清屏幕的机型。
注:本文是基于完整评测的缩减版本,阅读完整的英文评测,请点击这里。
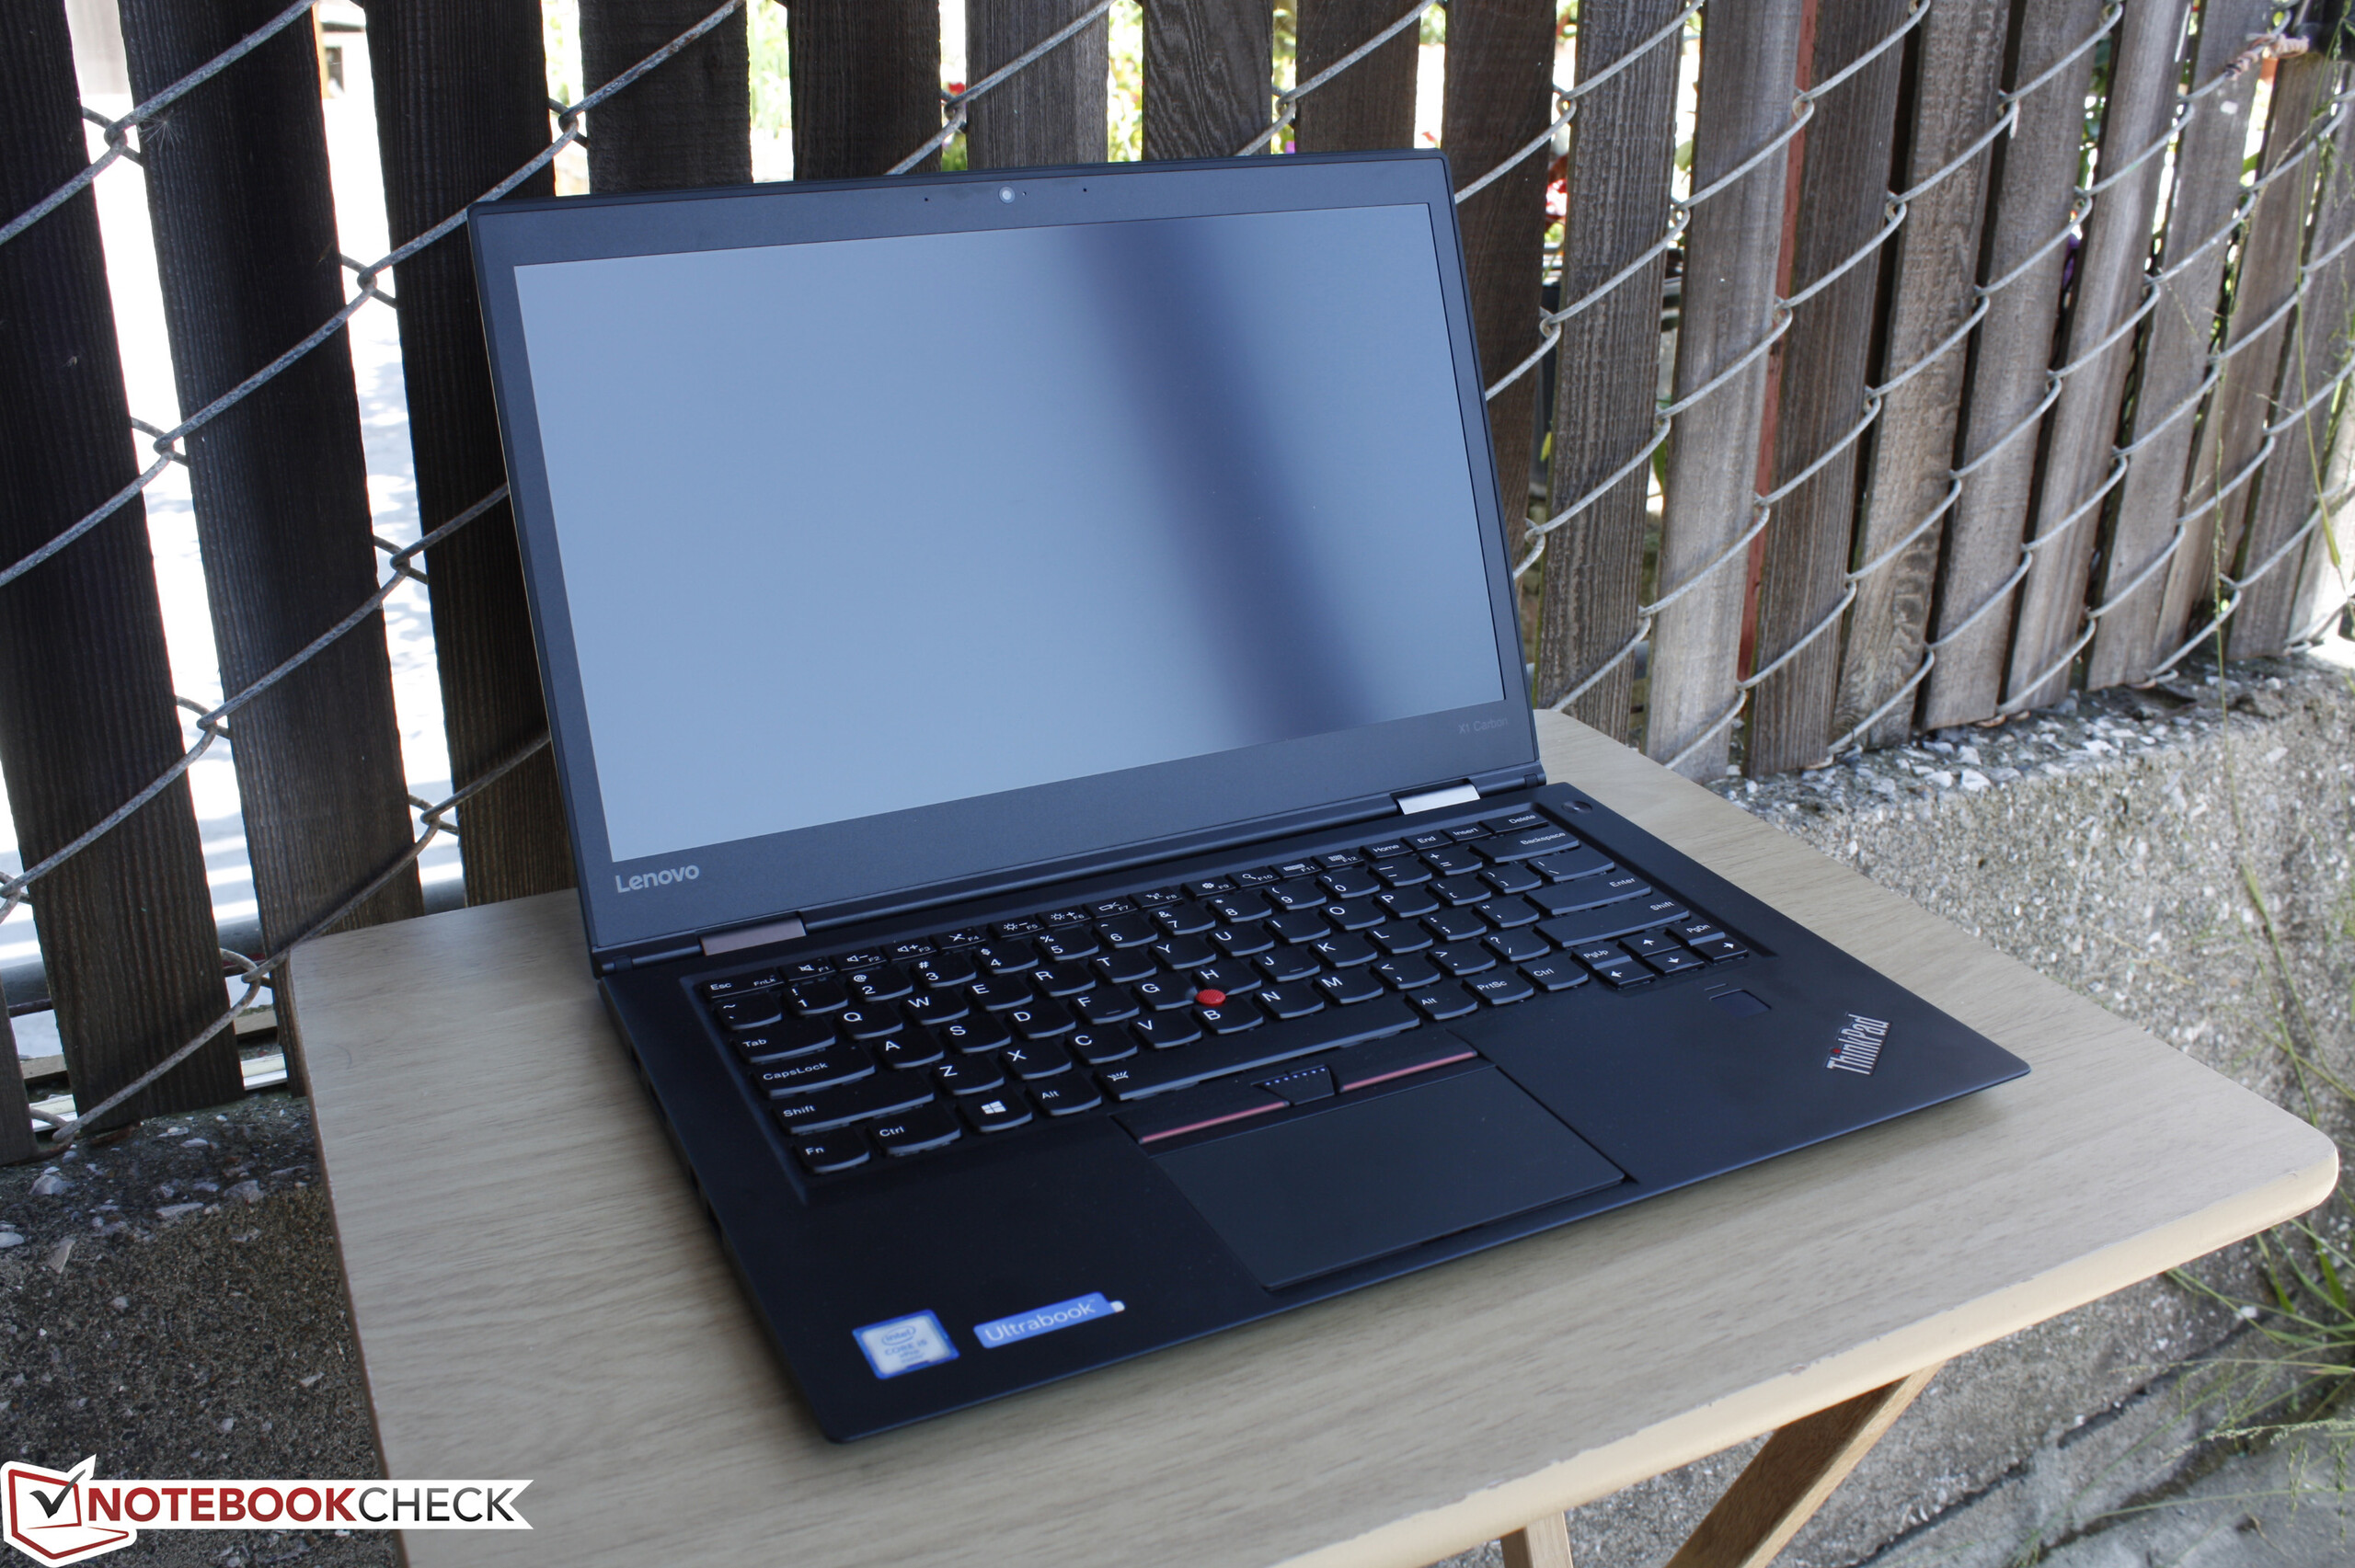
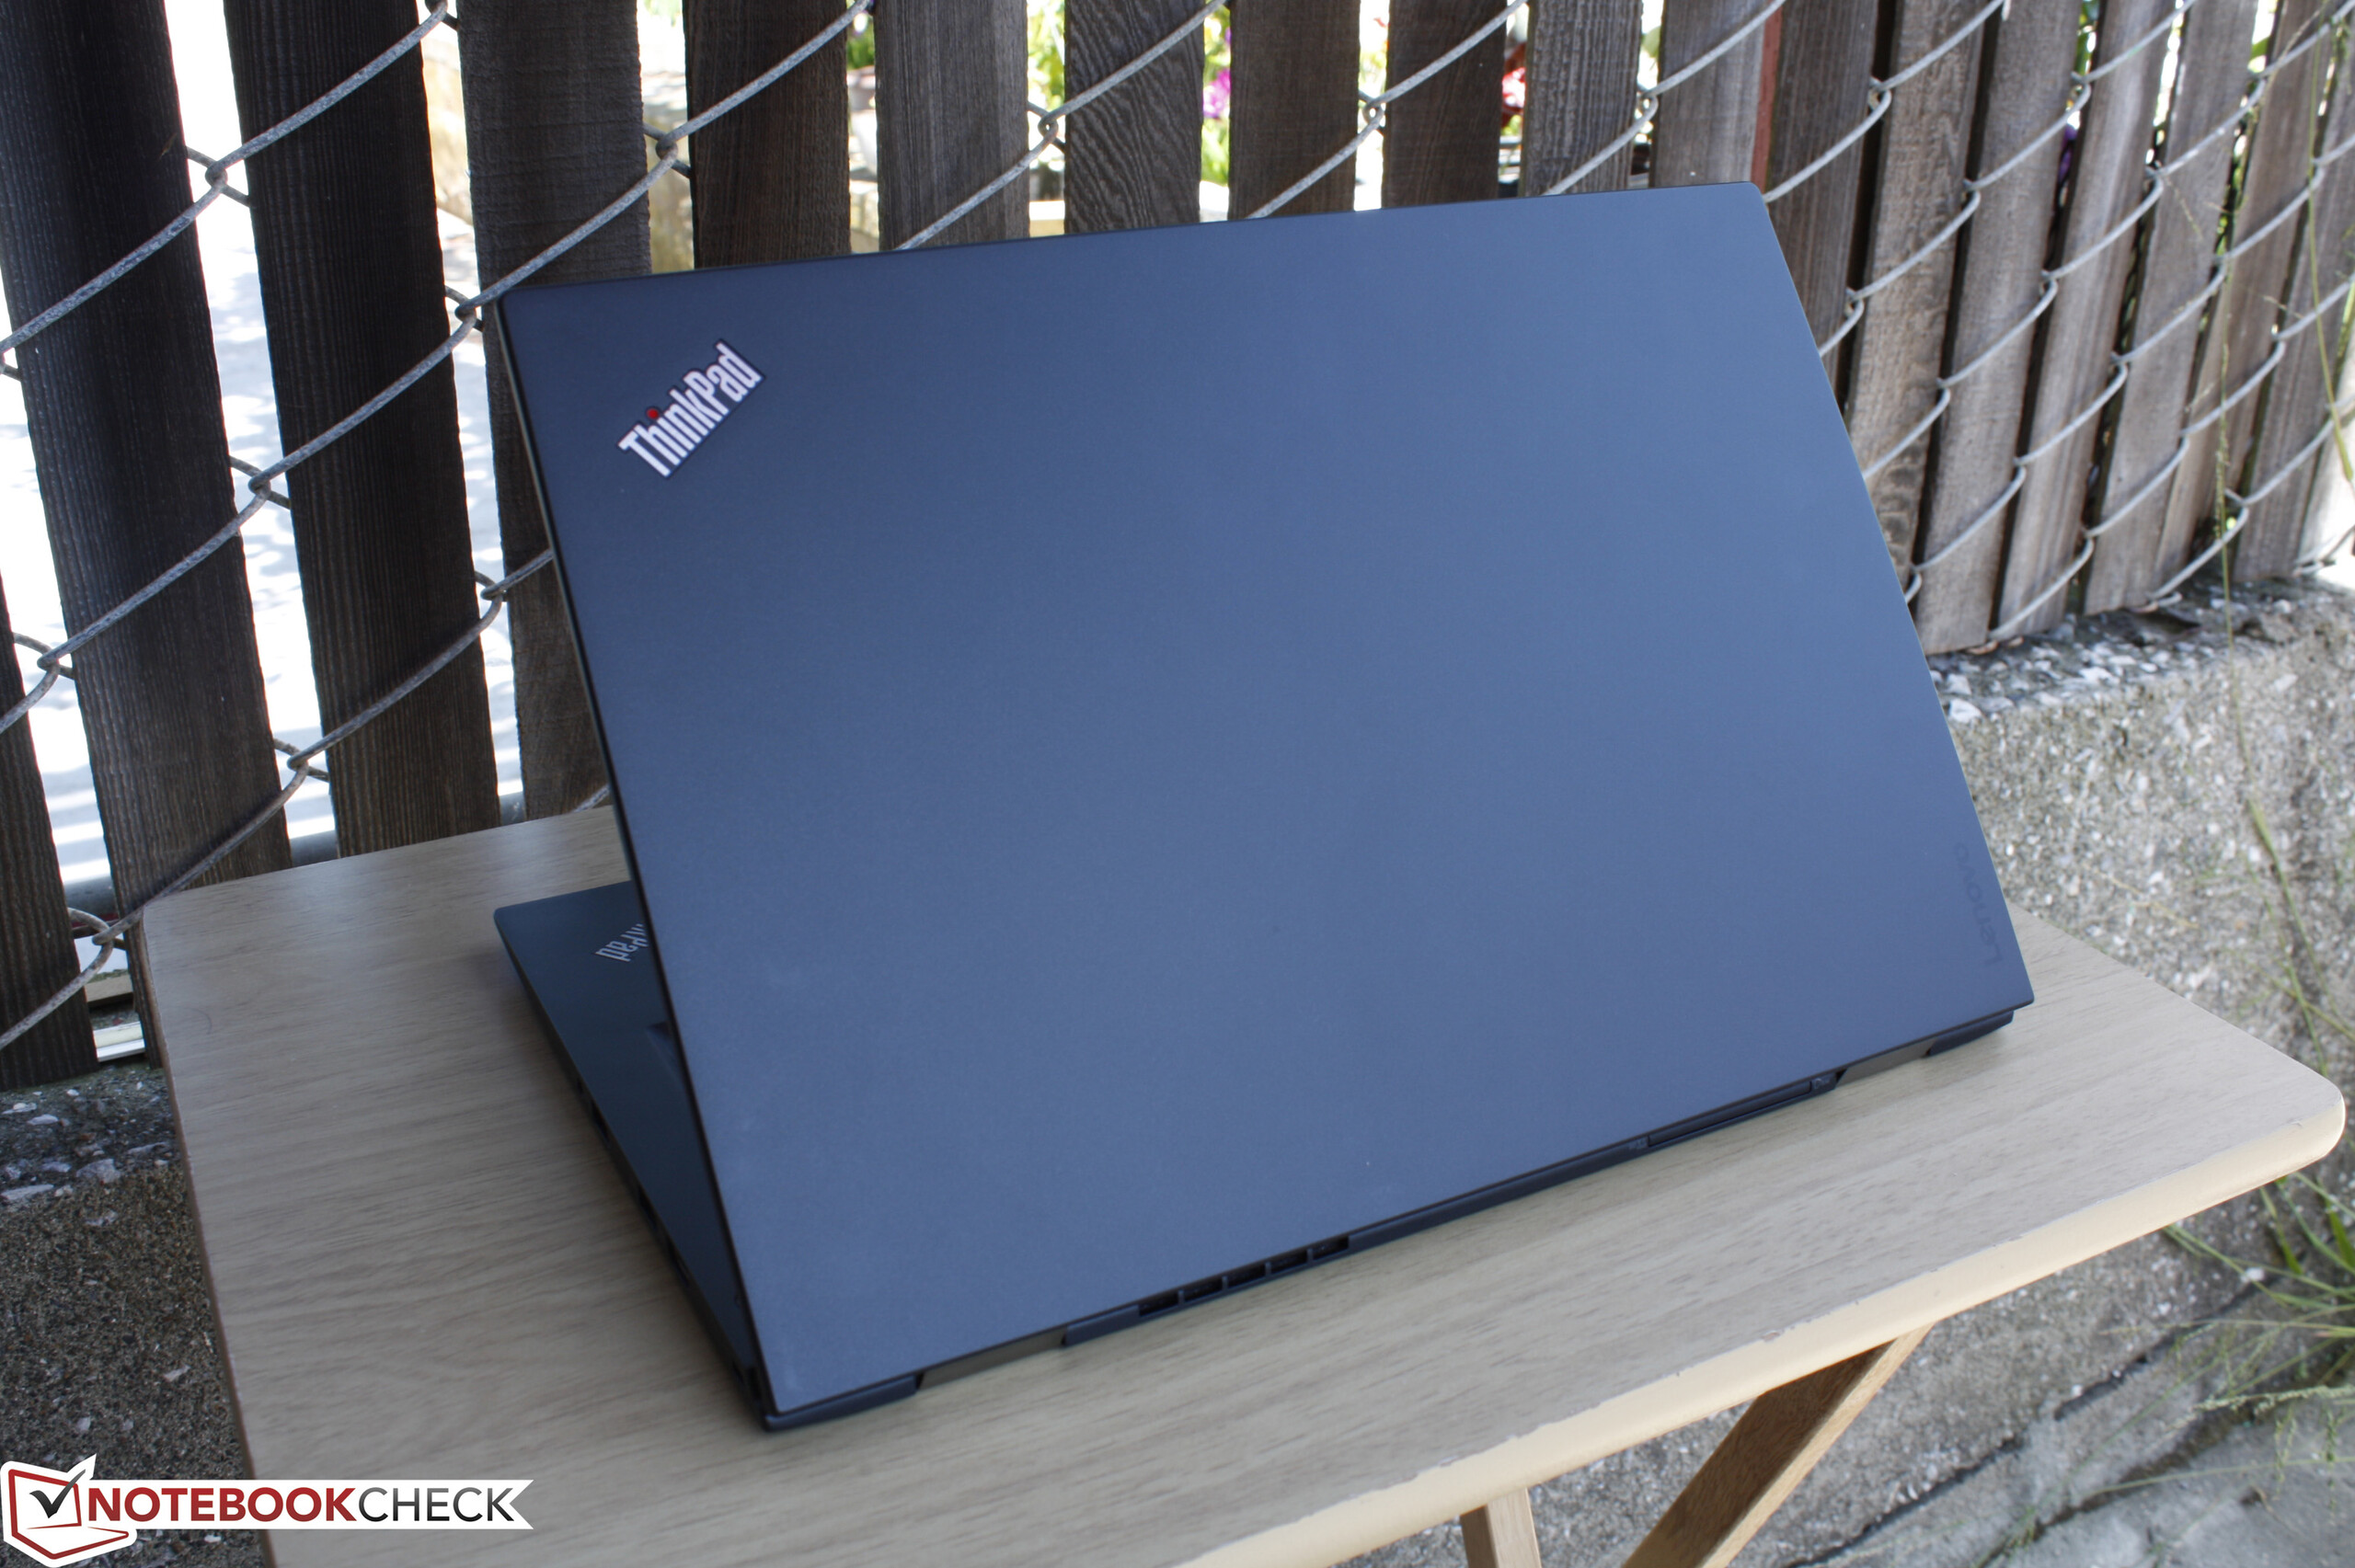
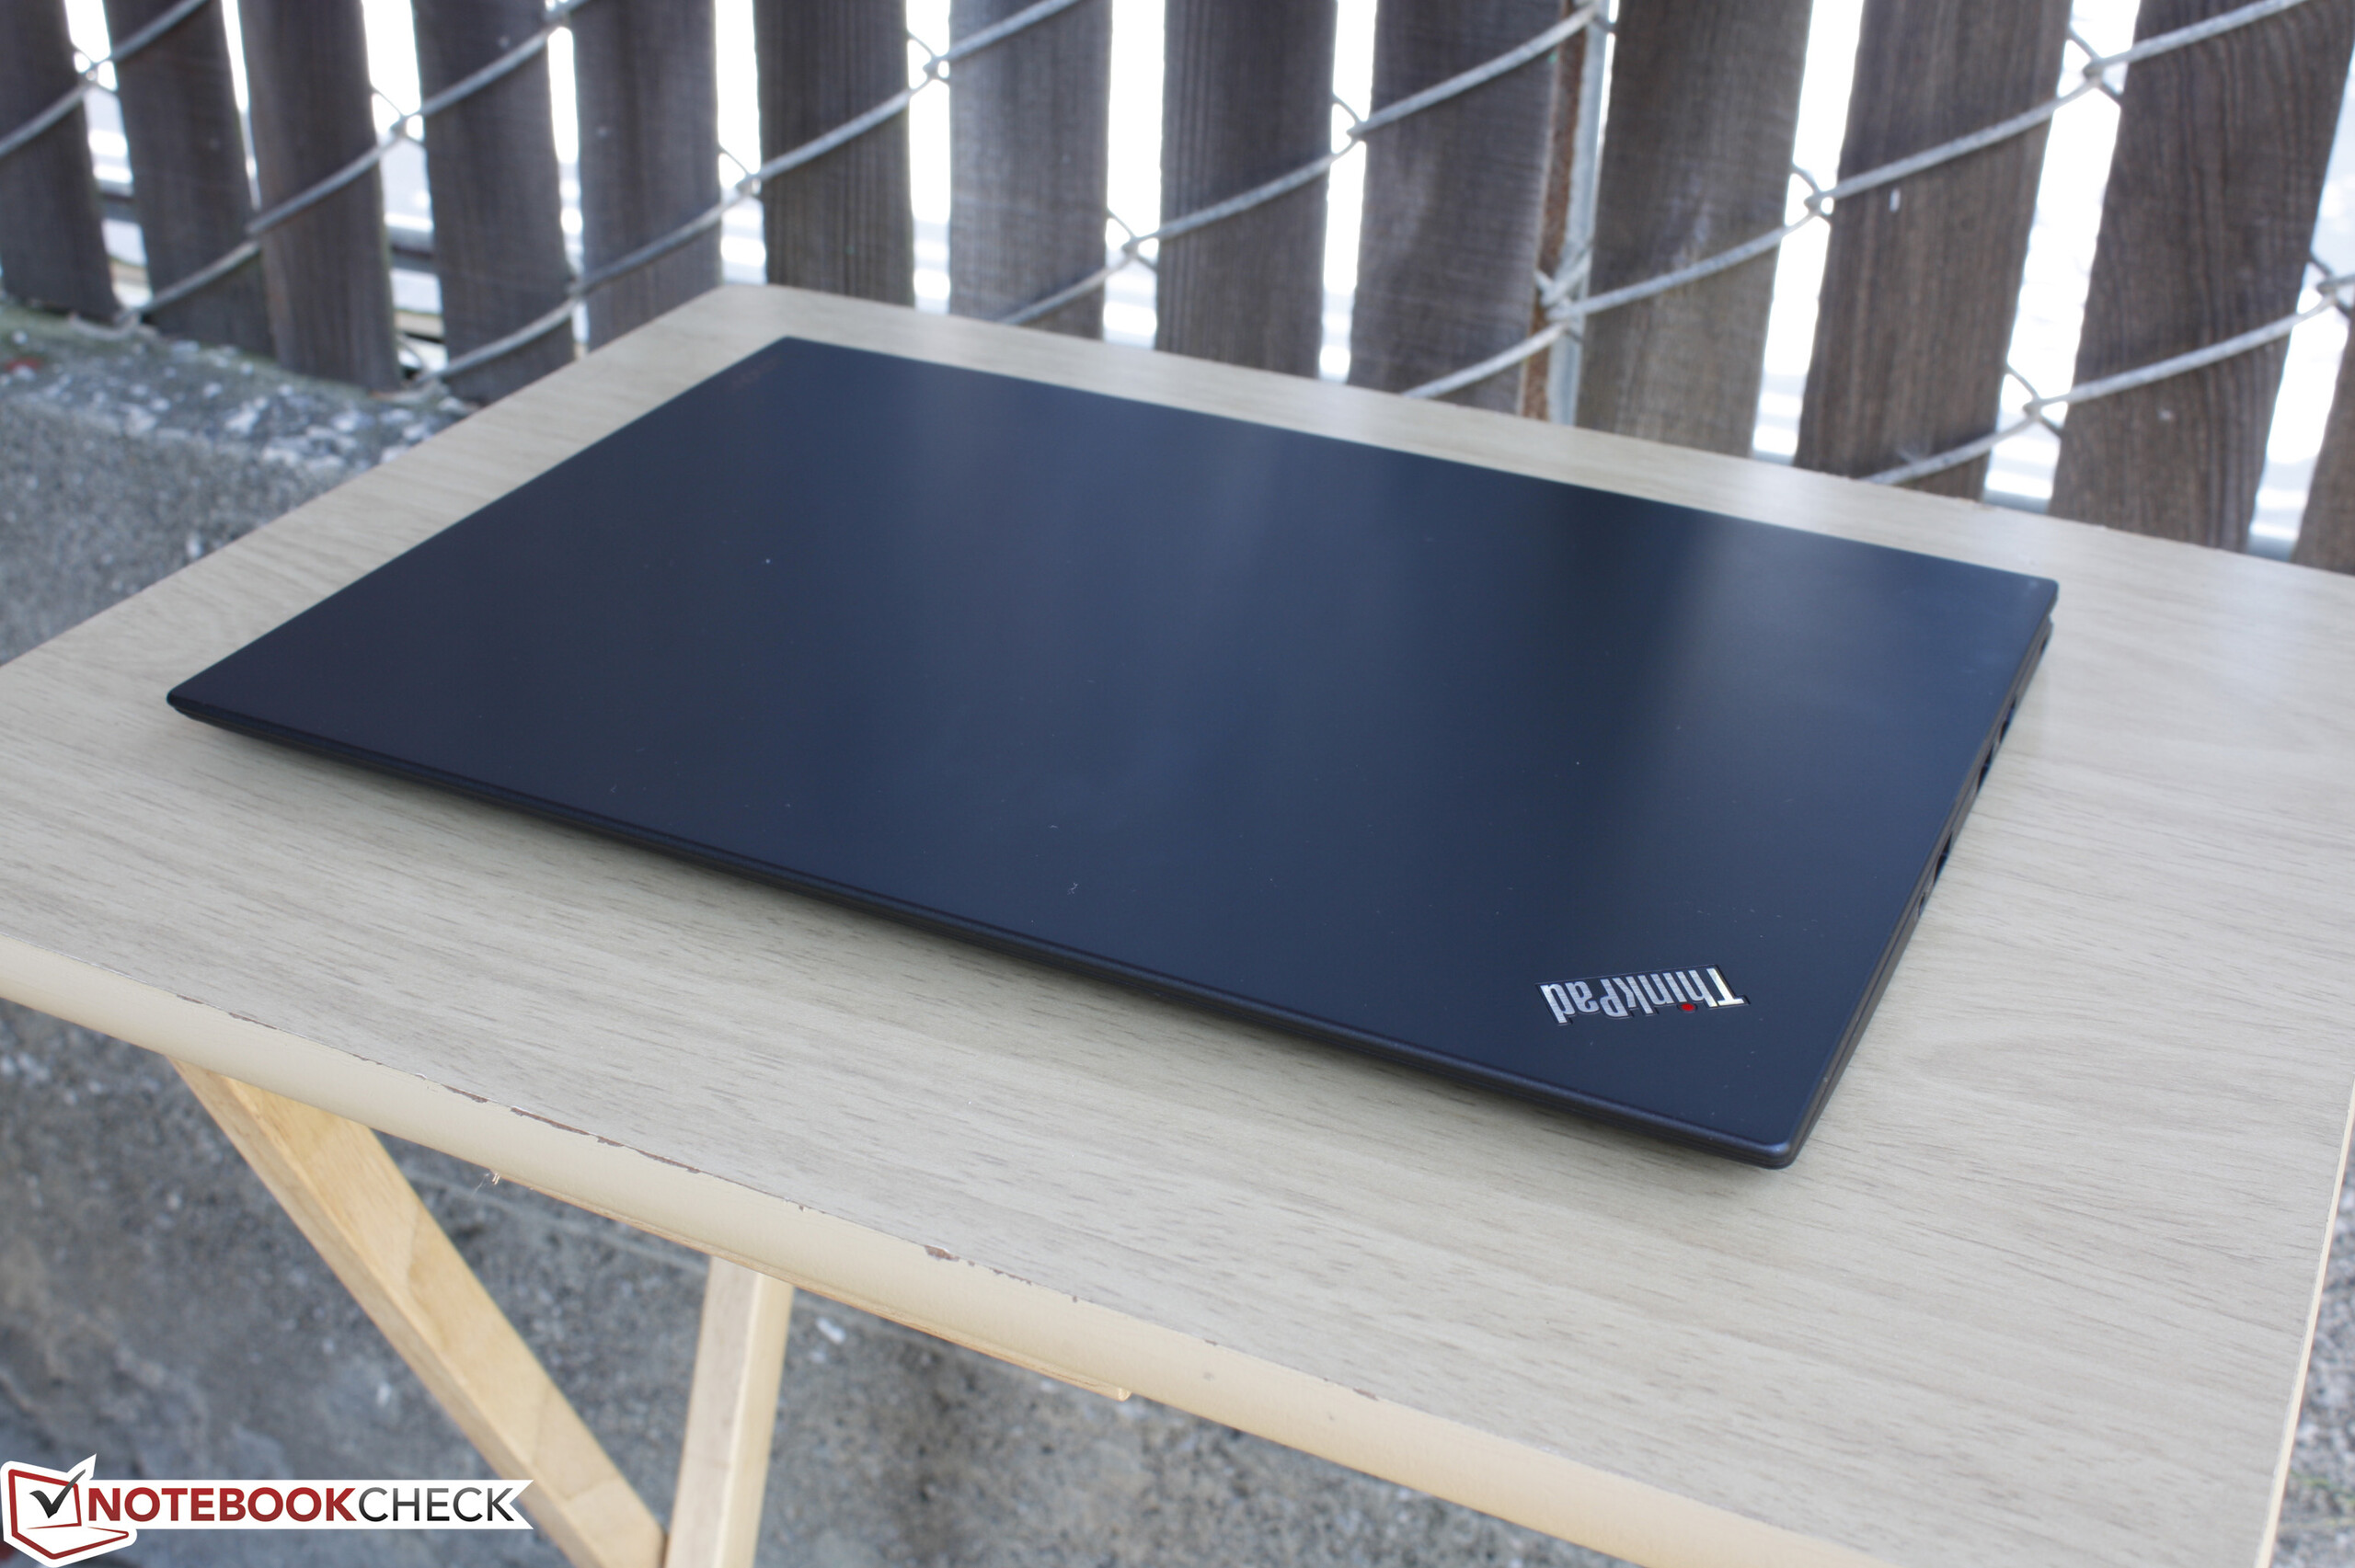
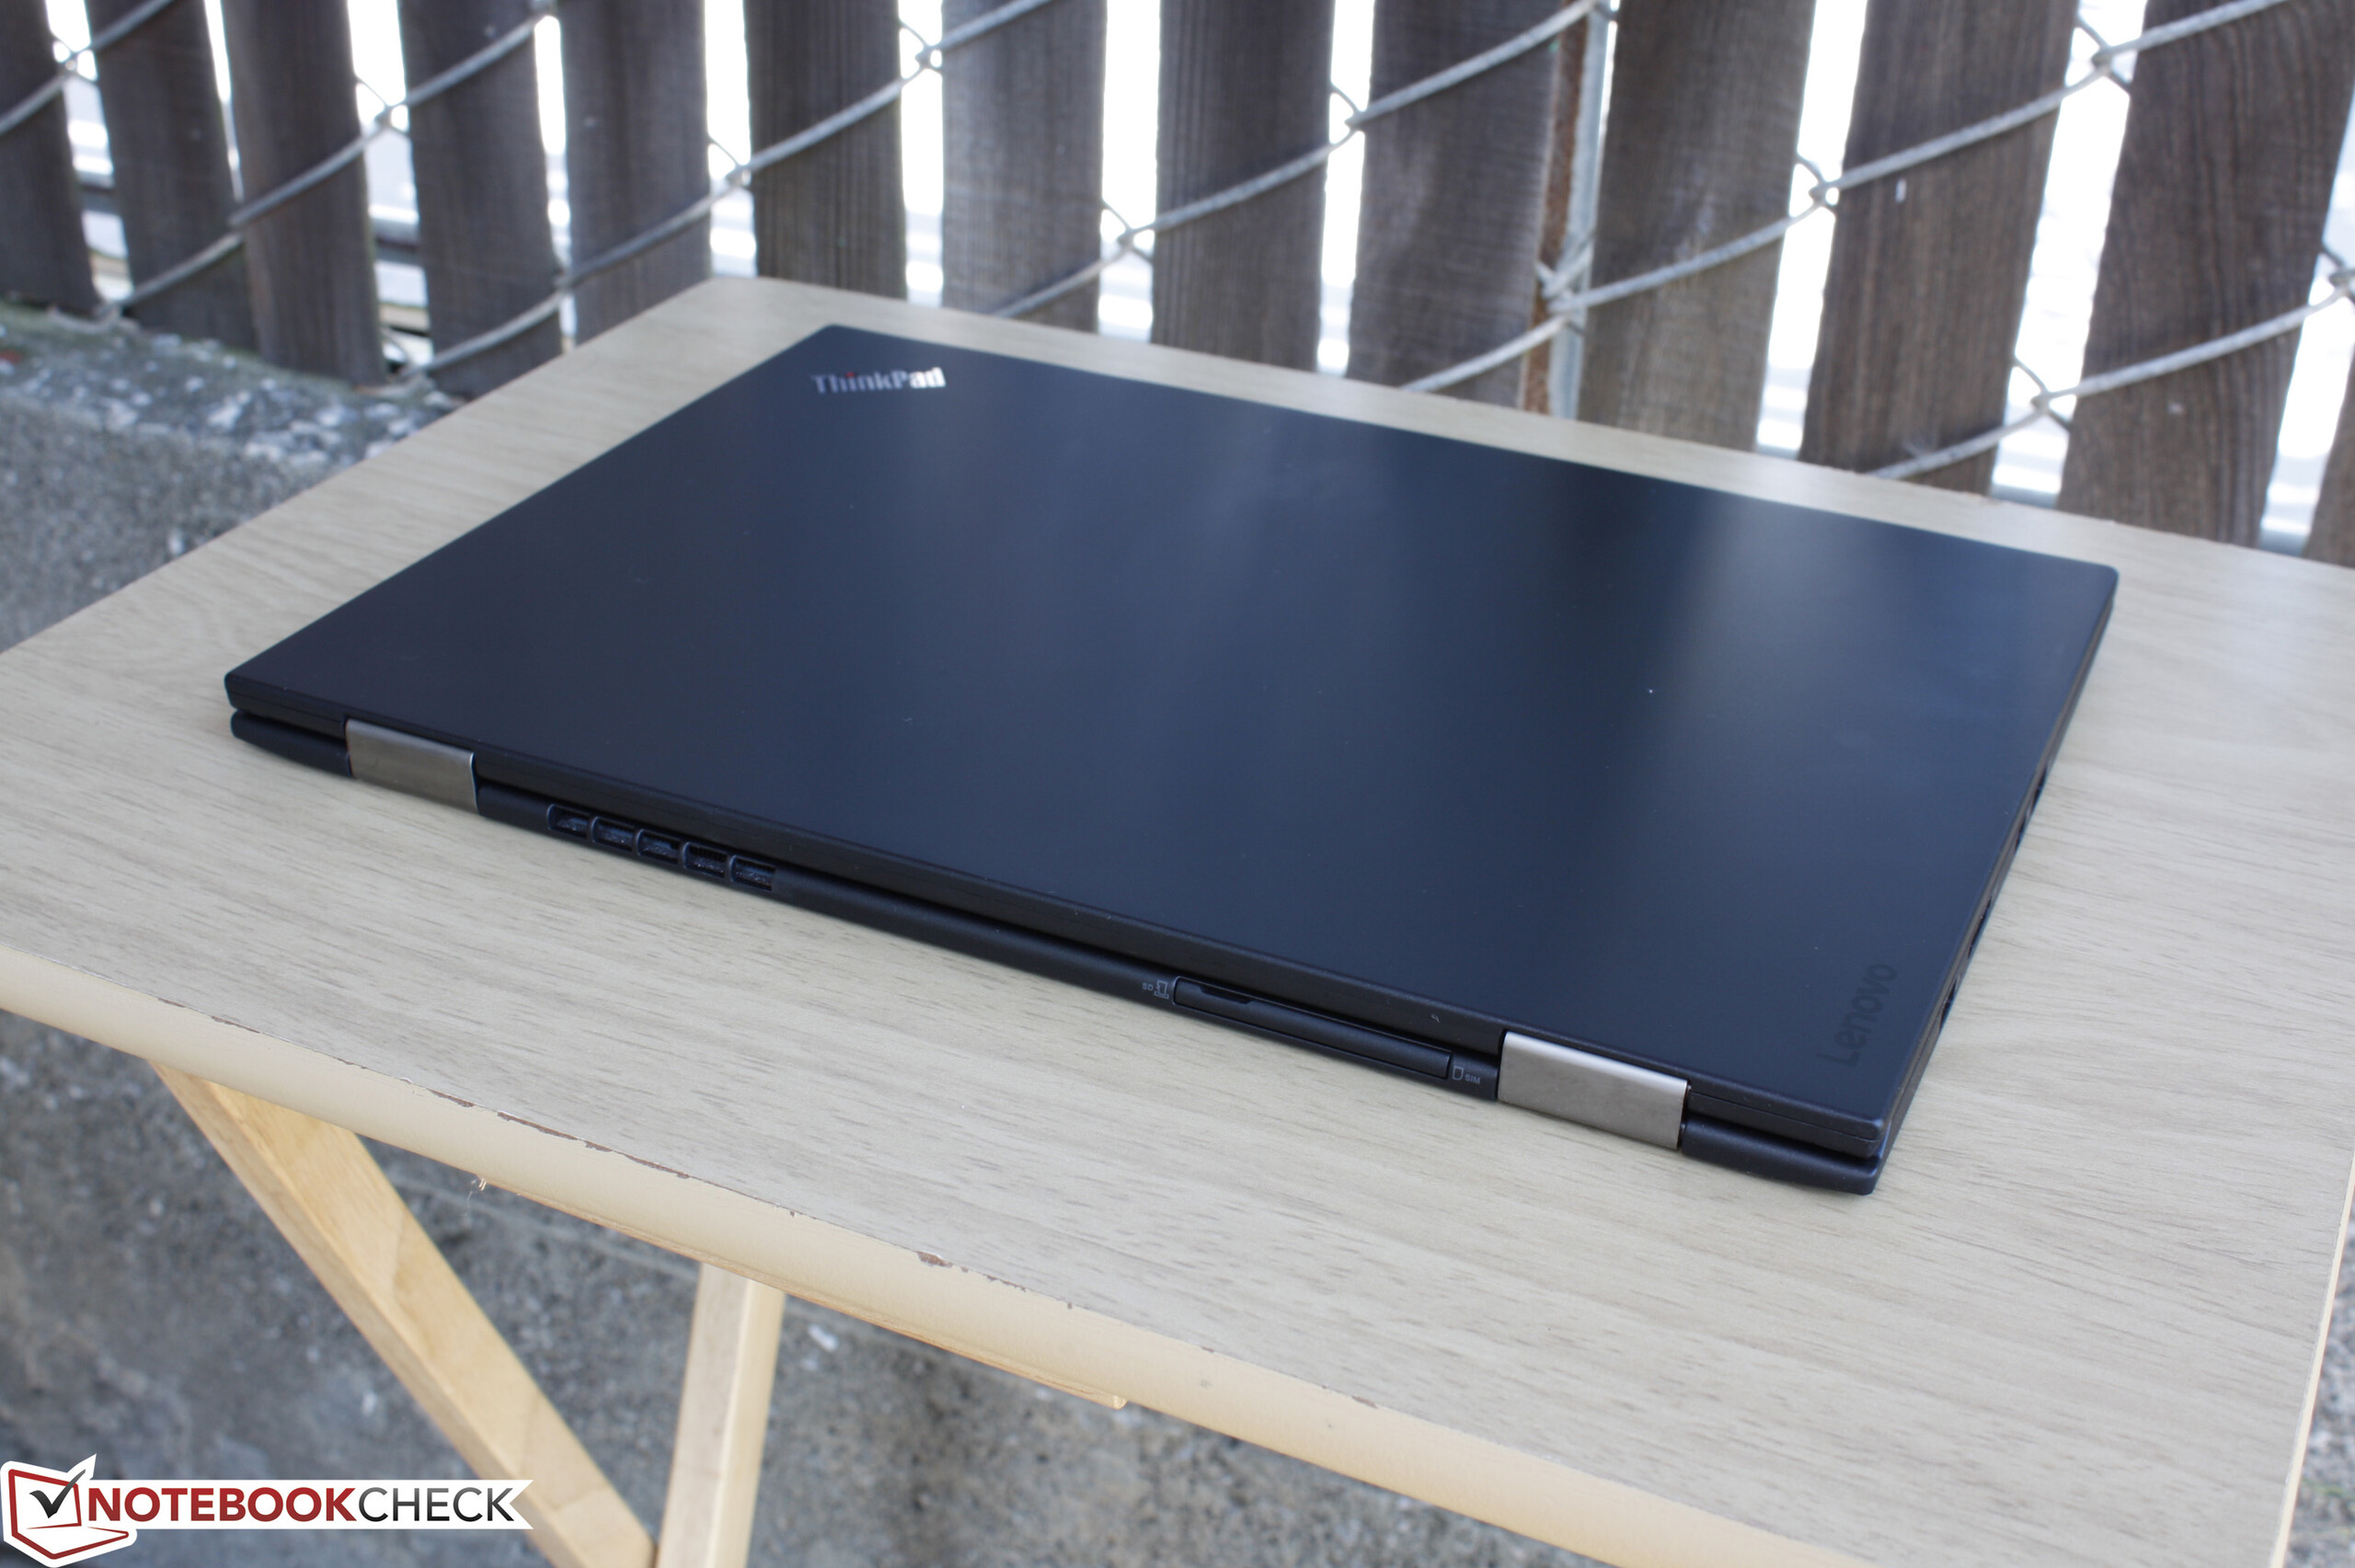
Lenovo ThinkPad X1 Carbon 20FB-005XUS
-
05/13/2016 v5.1(old)
Allen Ngo
Pricecompare
