 Deutsch
 English
 Español
 Français
 Italiano
 Nederlands
 Polski
 Português
 Русский
 Türkçe
 Svenska
 Chinese
 Magyar
联想 ThinkPad X1 Carbon 2016 (Core i7, WQHD) 超极本简短评测
| |||||||||||||||||||||||||
Brightness Distribution: 95 %
Center on Battery: 273 cd/m²
Contrast: 850:1 (Black: 0.32 cd/m²)
ΔE Color 2.61 | 0.5-29.43 Ø5
ΔE Greyscale 3.31 | 0.57-98 Ø5.3
95% sRGB (Argyll 1.6.3 3D)
63% AdobeRGB 1998 (Argyll 1.6.3 3D)
68.4% AdobeRGB 1998 (Argyll 2.2.0 3D)
94.7% sRGB (Argyll 2.2.0 3D)
66.7% Display P3 (Argyll 2.2.0 3D)
Gamma: 2.35
| Lenovo ThinkPad X1 Carbon 20FB003RGE 2.560 x 1.440 IPS-Panel | Lenovo ThinkPad T460s-20FA003GGE 2.560 x 1.440 IPS-Panel | Dell Latitude 14 7000 Series E7470 2.560 x 1.440 IPS-Panel | Lenovo ThinkPad X1 Carbon 2015 2.560 x 1.440 IPS-Panel | HP EliteBook Folio 1040 G3 2.560 x 1.440 IPS-Panel | |
|---|---|---|---|---|---|
| Display | 3% | 1% | -20% | 2% | |
| Display P3 Coverage | 66.7 | 68.7 3% | 67.2 1% | 52.4 -21% | 67.9 2% |
| sRGB Coverage | 94.7 | 98.1 4% | 95.9 1% | 77.4 -18% | 96.8 2% |
| AdobeRGB 1998 Coverage | 68.4 | 70.4 3% | 69.3 1% | 54 -21% | 70 2% |
| Response Times | -1% | -11% | -8% | ||
| Response Time Grey 50% / Grey 80% * | 44 ? | 35.6 ? 19% | 48 ? -9% | 46.4 ? -5% | |
| Response Time Black / White * | 24 ? | 29.2 ? -22% | 27 ? -13% | 26.4 ? -10% | |
| PWM Frequency | 220 ? | 220 ? 0% | |||
| Screen | -19% | 9% | -17% | -9% | |
| Brightness middle | 272 | 257 -6% | 380 40% | 252.3 -7% | 327 20% |
| Brightness | 268 | 248 -7% | 354 32% | 246 -8% | 316 18% |
| Brightness Distribution | 95 | 94 -1% | 81 -15% | 95 0% | 87 -8% |
| Black Level * | 0.32 | 0.26 19% | 0.26 19% | 0.426 -33% | 0.35 -9% |
| Contrast | 850 | 988 16% | 1462 72% | 592 -30% | 934 10% |
| Colorchecker dE 2000 * | 2.61 | 4.59 -76% | 3.11 -19% | 3.8 -46% | 4.39 -68% |
| Colorchecker dE 2000 max. * | 6.43 | 9.72 -51% | 6.73 -5% | 7.27 -13% | |
| Greyscale dE 2000 * | 3.31 | 6.38 -93% | 4.35 -31% | 2.92 12% | 4.69 -42% |
| Gamma | 2.35 94% | 2.51 88% | 2.37 93% | 2.08 106% | 2.15 102% |
| CCT | 6360 102% | 6238 104% | 6771 96% | 6070 107% | 7101 92% |
| Color Space (Percent of AdobeRGB 1998) | 63 | 65 3% | 62 -2% | 50.41 -20% | 62.52 -1% |
| Color Space (Percent of sRGB) | 95 | 98 3% | 96 1% | 96.71 2% | |
| Total Average (Program / Settings) | -6% /
-12% | -0% /
5% | -19% /
-17% | -5% /
-7% |
* ... smaller is better
Display Response Times
| ↔ Response Time Black to White | ||
|---|---|---|
| 24 ms ... rise ↗ and fall ↘ combined | ↗ 5.2 ms rise | 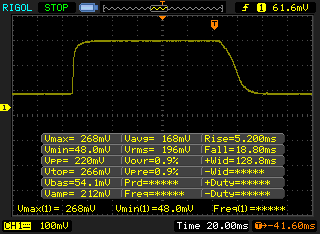 |
| ↘ 18.8 ms fall | ||
| The screen shows good response rates in our tests, but may be too slow for competitive gamers. In comparison, all tested devices range from 0.1 (minimum) to 240 (maximum) ms. » 48 % of all devices are better. This means that the measured response time is worse than the average of all tested devices (21.5 ms). | ||
| ↔ Response Time 50% Grey to 80% Grey | ||
| 44 ms ... rise ↗ and fall ↘ combined | ↗ 17 ms rise | 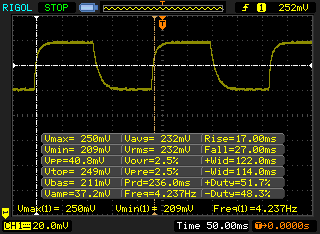 |
| ↘ 27 ms fall | ||
| The screen shows slow response rates in our tests and will be unsatisfactory for gamers. In comparison, all tested devices range from 0.2 (minimum) to 636 (maximum) ms. » 69 % of all devices are better. This means that the measured response time is worse than the average of all tested devices (33.7 ms). | ||
Screen Flickering / PWM (Pulse-Width Modulation)
| Screen flickering / PWM detected | 220 Hz | ≤ 90 % brightness setting | 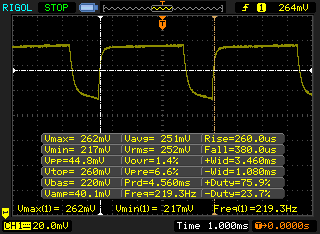 |
The display backlight flickers at 220 Hz (worst case, e.g., utilizing PWM) Flickering detected at a brightness setting of 90 % and below. There should be no flickering or PWM above this brightness setting. The frequency of 220 Hz is relatively low, so sensitive users will likely notice flickering and experience eyestrain at the stated brightness setting and below. In comparison: 53 % of all tested devices do not use PWM to dim the display. If PWM was detected, an average of 17909 (minimum: 5 - maximum: 3846000) Hz was measured. | |||
| Cinebench R15 | |
| CPU Single 64Bit | |
| Dell Latitude 14 7000 Series E7470 | |
| Lenovo ThinkPad T460s-20FA003GGE | |
| Lenovo ThinkPad X1 Carbon 20FB003RGE | |
| HP EliteBook Folio 1040 G3 | |
| Lenovo ThinkPad X1 Carbon 2015 | |
| Lenovo ThinkPad T460s-20F9003SGE | |
| CPU Multi 64Bit | |
| Lenovo ThinkPad T460s-20FA003GGE | |
| Dell Latitude 14 7000 Series E7470 | |
| Lenovo ThinkPad X1 Carbon 20FB003RGE | |
| HP EliteBook Folio 1040 G3 | |
| Lenovo ThinkPad T460s-20F9003SGE | |
| Lenovo ThinkPad X1 Carbon 2015 | |
| Cinebench R11.5 | |
| CPU Single 64Bit | |
| Dell Latitude 14 7000 Series E7470 | |
| Lenovo ThinkPad T460s-20FA003GGE | |
| Lenovo ThinkPad X1 Carbon 20FB003RGE | |
| Lenovo ThinkPad X1 Carbon 2015 | |
| Lenovo ThinkPad T460s-20F9003SGE | |
| CPU Multi 64Bit | |
| Lenovo ThinkPad T460s-20FA003GGE | |
| Dell Latitude 14 7000 Series E7470 | |
| Lenovo ThinkPad X1 Carbon 20FB003RGE | |
| Lenovo ThinkPad T460s-20F9003SGE | |
| Lenovo ThinkPad X1 Carbon 2015 | |
| X264 HD Benchmark 4.0 | |
| Pass 1 | |
| Lenovo ThinkPad T460s-20FA003GGE | |
| Lenovo ThinkPad X1 Carbon 20FB003RGE | |
| Pass 2 | |
| Lenovo ThinkPad T460s-20FA003GGE | |
| Lenovo ThinkPad X1 Carbon 20FB003RGE | |
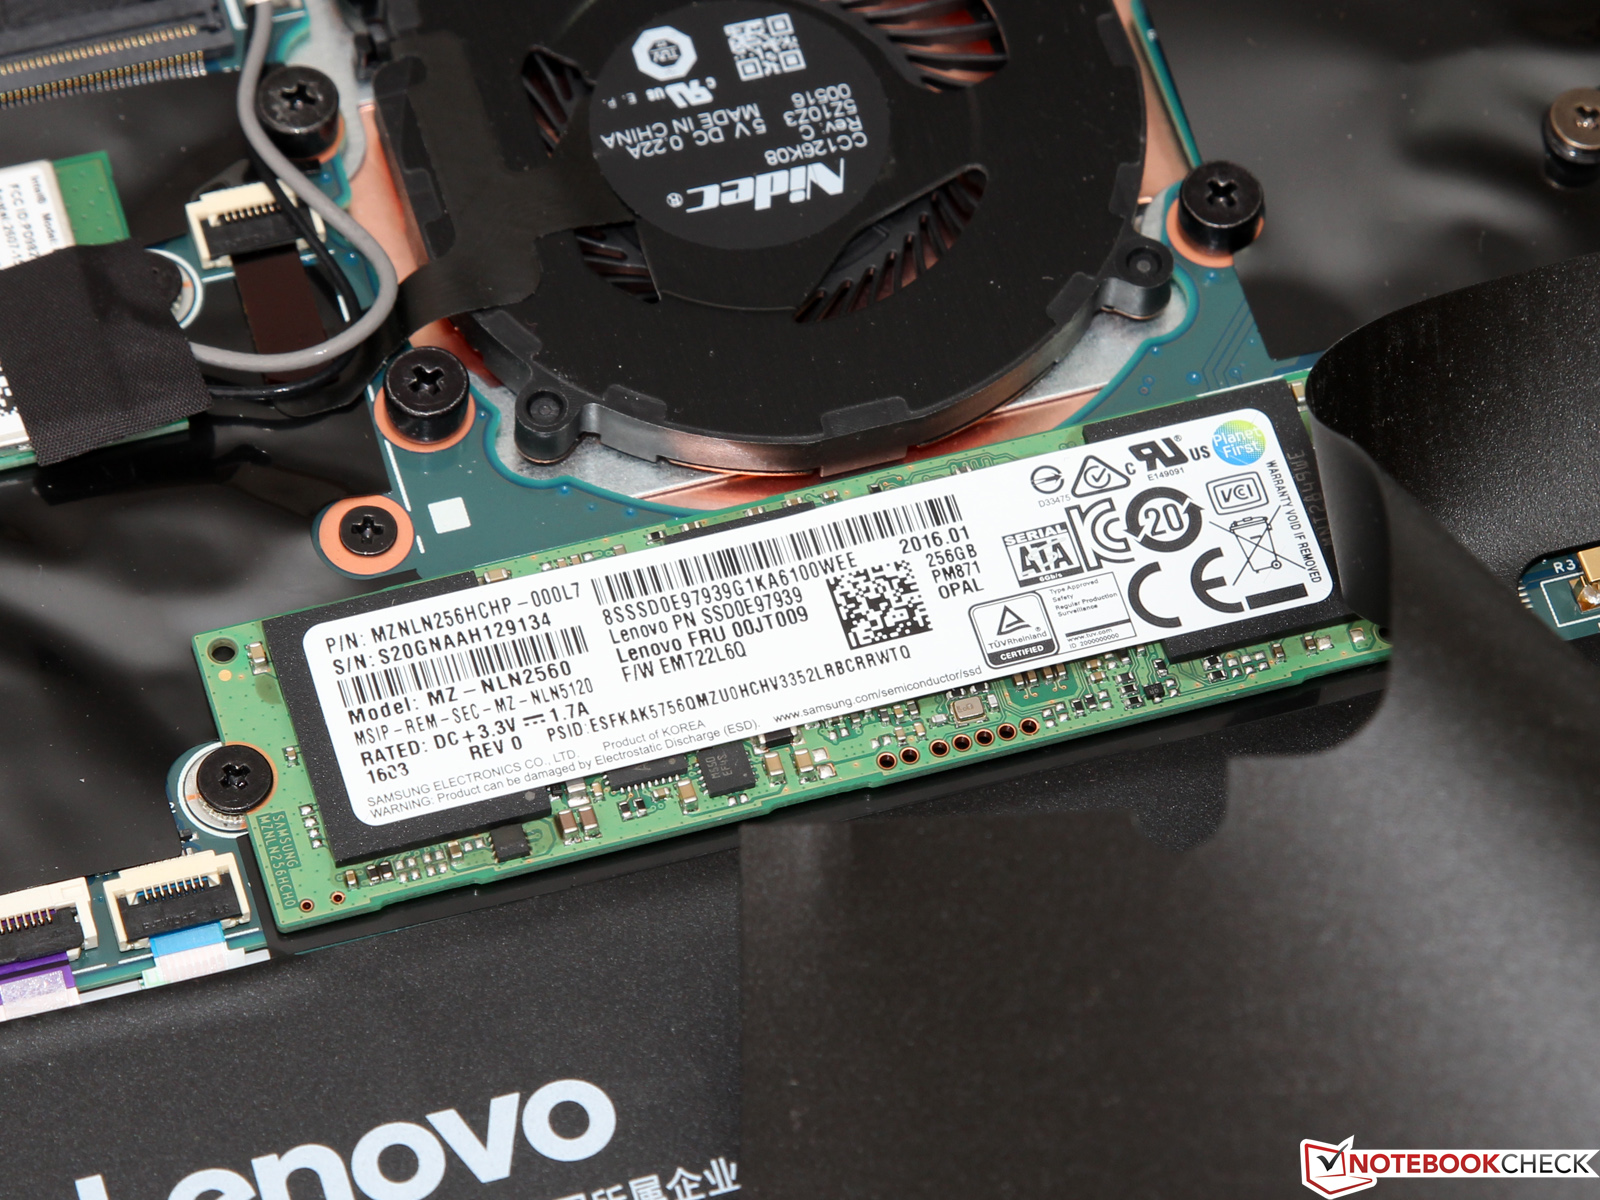
| Lenovo ThinkPad X1 Carbon 20FB003RGE Samsung SSD PM871 MZNLN256HCHP | Lenovo ThinkPad T460s-20FA003GGE Samsung SSD SM951a 512GB M.2 PCIe 3.0 x4 NVMe (MZVKV512) | Lenovo ThinkPad X1 Carbon 2015 Samsung SSD SM951 512 GB MZHPV512HDGL | Lenovo ThinkPad X1 Carbon 2015 Samsung SSD PM851 256 GB MZNTE256HMHP | HP EliteBook Folio 1040 G3 Samsung SM951 MZVPV256HDGL m.2 PCI-e | |
|---|---|---|---|---|---|
| AS SSD | 166% | 105% | -4% | 190% | |
| Seq Read | 499.1 | 2039 309% | 1339 168% | 512 3% | 1839 268% |
| Seq Write | 294 | 1407 379% | 1209 311% | 235.7 -20% | 1190 305% |
| 4K Read | 30.43 | 45.41 49% | 39.9 31% | 32.41 7% | 47.72 57% |
| 4K Write | 74.6 | 114.4 53% | 91.3 22% | 89.9 21% | 126.6 70% |
| 4K-64 Read | 370.4 | 968 161% | 510 38% | 355 -4% | 1858 402% |
| 4K-64 Write | 253.4 | 366 44% | 402.2 59% | 170.3 -33% | 344.3 36% |

| PCMark 8 | |
| Home Score Accelerated v2 | |
| Lenovo ThinkPad T460s-20FA003GGE | |
| Lenovo ThinkPad X1 Carbon 20FB003RGE | |
| HP EliteBook Folio 1040 G3 | |
| Lenovo ThinkPad X1 Carbon 2015 | |
| Lenovo ThinkPad X1 Carbon 2015 | |
| Creative Score Accelerated v2 | |
| Lenovo ThinkPad T460s-20FA003GGE | |
| Lenovo ThinkPad X1 Carbon 20FB003RGE | |
| HP EliteBook Folio 1040 G3 | |
| Lenovo ThinkPad X1 Carbon 2015 | |
| Work Score Accelerated v2 | |
| Lenovo ThinkPad T460s-20FA003GGE | |
| Lenovo ThinkPad X1 Carbon 20FB003RGE | |
| HP EliteBook Folio 1040 G3 | |
| Lenovo ThinkPad X1 Carbon 2015 | |
| PCMark 7 - Score | |
| Lenovo ThinkPad X1 Carbon 20FB003RGE | |
| Lenovo ThinkPad X1 Carbon 2015 | |
| Lenovo ThinkPad T460s-20FA003GGE | |
| Lenovo ThinkPad X1 Carbon 2015 | |
| PCMark 7 Score | 5350 points | |
| PCMark 8 Home Score Accelerated v2 | 3385 points | |
| PCMark 8 Creative Score Accelerated v2 | 4150 points | |
| PCMark 8 Work Score Accelerated v2 | 4342 points | |
Help | ||
| 3DMark 11 - 1280x720 Performance GPU | |
| Microsoft Surface Pro 4 Core i7 | |
| Lenovo ThinkPad T450s-20BWS1UT00 | |
| Lenovo ThinkPad T460s-20FA003GGE | |
| Lenovo ThinkPad X1 Carbon 20FB003RGE | |
| HP EliteBook Folio 1040 G3 | |
| Lenovo ThinkPad T460s-20F9003SGE | |
| Lenovo ThinkPad X1 Carbon 2015 | |
| 3DMark - 1920x1080 Fire Strike Graphics | |
| Lenovo ThinkPad T450s-20BWS1UT00 | |
| Microsoft Surface Pro 4 Core i7 | |
| Lenovo ThinkPad X1 Carbon 20FB003RGE | |
| Lenovo ThinkPad T460s-20FA003GGE | |
| HP EliteBook Folio 1040 G3 | |
| Lenovo ThinkPad X1 Carbon 2015 | |
| Lenovo ThinkPad T460s-20F9003SGE | |
| 3DMark 06 Standard Score | 9532 points | |
| 3DMark 11 Performance | 1553 points | |
| 3DMark Ice Storm Standard Score | 52800 points | |
| 3DMark Cloud Gate Standard Score | 5978 points | |
| 3DMark Fire Strike Score | 892 points | |
Help | ||
| low | med. | high | ultra | |
| BioShock Infinite (2013) | 51 | 28.3 | 23.8 | 6.9 |
| Battlefield 4 (2013) | 42 | 29.9 | 19 | 5.9 |
| Dirt Rally (2015) | 101.4 | 26.7 | 13 |
| Lenovo ThinkPad X1 Carbon 20FB003RGE Intel Core i7-6500U, Intel HD Graphics 520 | HP EliteBook Folio 1040 G3 Intel Core i5-6300U, Intel HD Graphics 520 | Dell Latitude 14 7000 Series E7470 Intel Core i7-6600U, Intel HD Graphics 520 | Lenovo ThinkPad T460s-20FA003GGE Intel Core i7-6600U, Intel HD Graphics 520 | Lenovo ThinkPad X1 Carbon 2015 Intel Core i5-5300U, Intel HD Graphics 5500 | |
|---|---|---|---|---|---|
| Noise | 2% | -0% | 1% | 4% | |
| off / environment * | 29.1 | 29.1 -0% | 31.2 -7% | 29.2 -0% | |
| Idle Minimum * | 29.1 | 29.1 -0% | 31.2 -7% | 29.2 -0% | 28.5 2% |
| Idle Average * | 29.1 | 29.1 -0% | 31.2 -7% | 29.2 -0% | 28.6 2% |
| Idle Maximum * | 29.1 | 29.1 -0% | 31.2 -7% | 29.2 -0% | 28.8 1% |
| Load Average * | 35.6 | 32.6 8% | 31.9 10% | 33.7 5% | 30.7 14% |
| Load Maximum * | 38.1 | 37.8 1% | 31.9 16% | 38.5 -1% | 36.9 3% |
* ... smaller is better
Noise Level
| Idle |
| 29.1 / 29.1 / 29.1 dB(A) |
| Load |
| 35.6 / 38.1 dB(A) |
 | ||
30 dB silent 40 dB(A) audible 50 dB(A) loud |
||
min: | ||
(±) The maximum temperature on the upper side is 43.2 °C / 110 F, compared to the average of 34.2 °C / 94 F, ranging from 21.2 to 62.5 °C for the class Office.
(±) The bottom heats up to a maximum of 45 °C / 113 F, compared to the average of 36.7 °C / 98 F
(+) In idle usage, the average temperature for the upper side is 27.1 °C / 81 F, compared to the device average of 29.5 °C / 85 F.
(+) The palmrests and touchpad are cooler than skin temperature with a maximum of 26.6 °C / 79.9 F and are therefore cool to the touch.
(±) The average temperature of the palmrest area of similar devices was 27.7 °C / 81.9 F (+1.1 °C / 2 F).
| Off / Standby | |
| Idle | |
| Load |
|
| Lenovo ThinkPad X1 Carbon 20FB003RGE 52 Wh | Lenovo ThinkPad T460s-20FA003GGE 49 Wh | Lenovo ThinkPad X1 Carbon 2015 50 Wh | HP EliteBook Folio 1040 G3 45.6 Wh | Dell Latitude 14 7000 Series E7470 55 Wh | |
|---|---|---|---|---|---|
| Battery Runtime | -25% | -2% | -23% | -11% | |
| Reader / Idle | 942 | 833 -12% | 984 4% | 530 -44% | |
| H.264 | 510 | 397 -22% | 339 -34% | ||
| WiFi v1.3 | 429 | 340 -21% | 285 -34% | 309 -28% | 346 -19% |
| Load | 115 | 62 -46% | 141 23% | 131 14% | 112 -3% |
| WiFi | 401 |
Pros
Cons
E460,L460,T460,T460p,T460s现在是X1 Carbon:联想似乎希望将每一个角落都用一个ThinkPad机型来填满。我们并不希望评价这是否必要或者合理——不过它确实有利于我们根据用途选择最适合的设备。
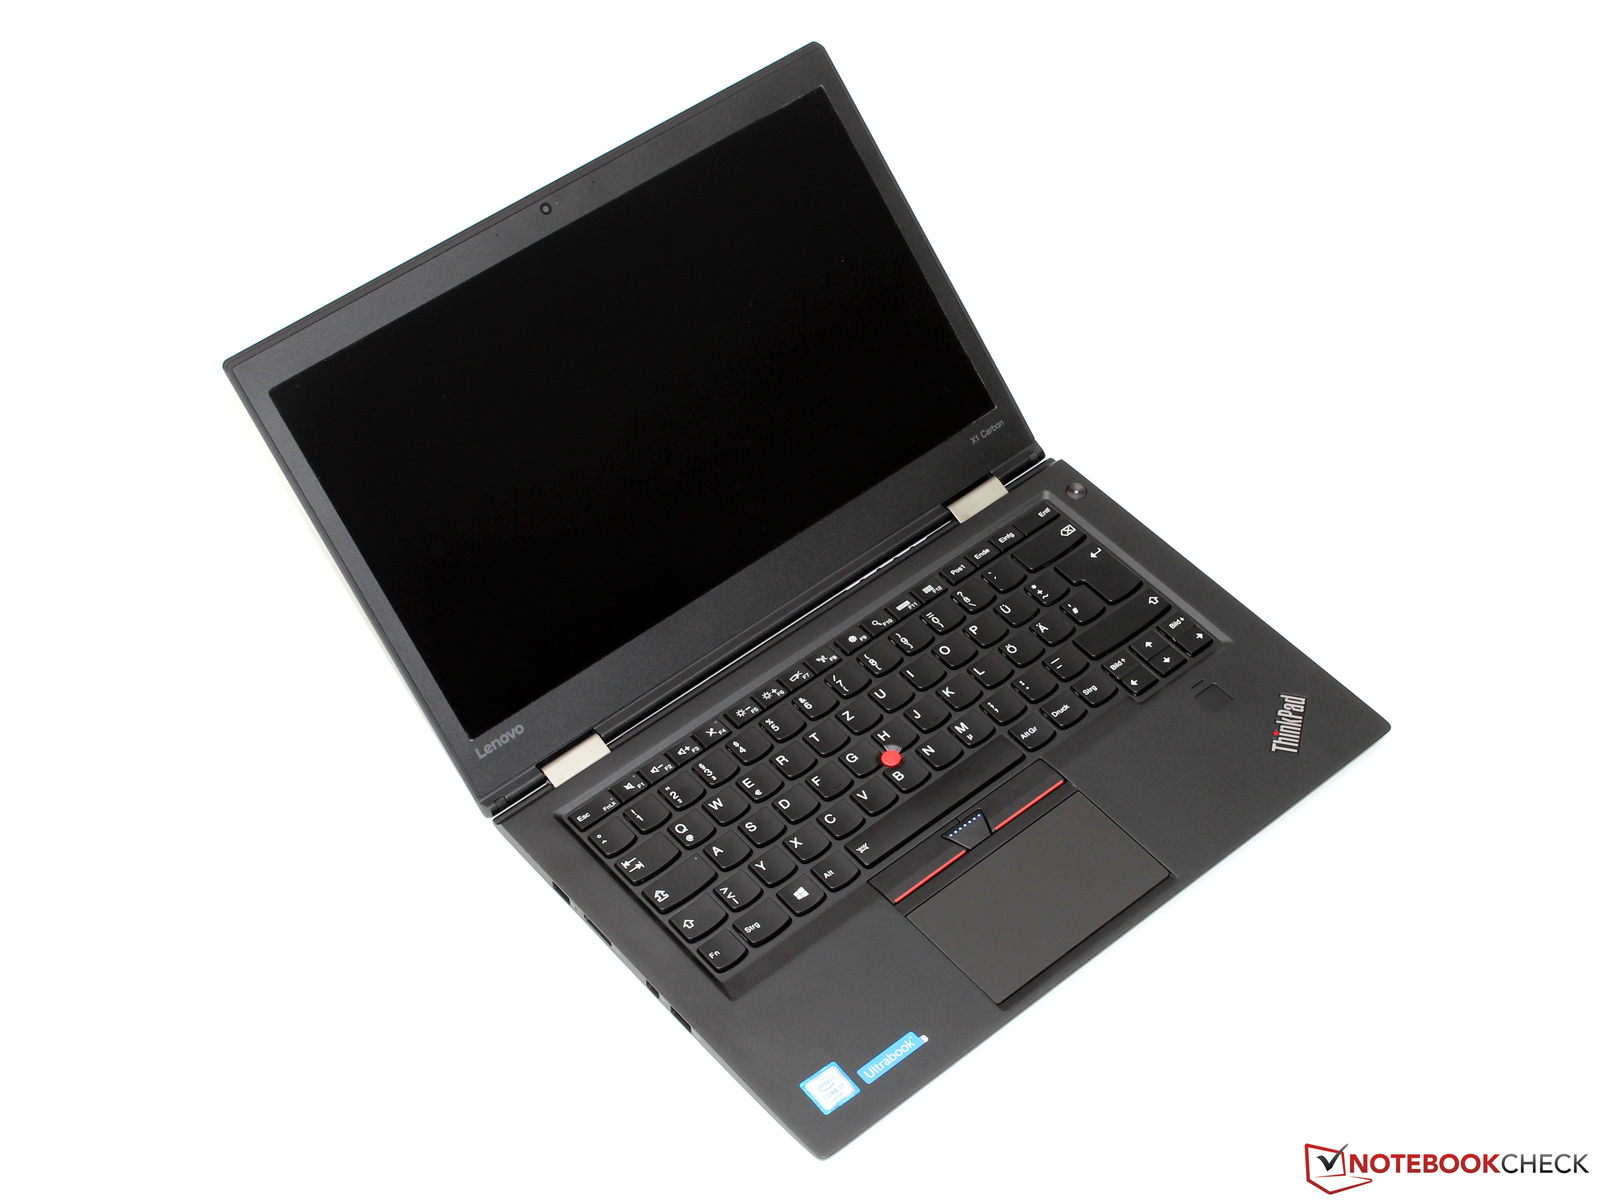
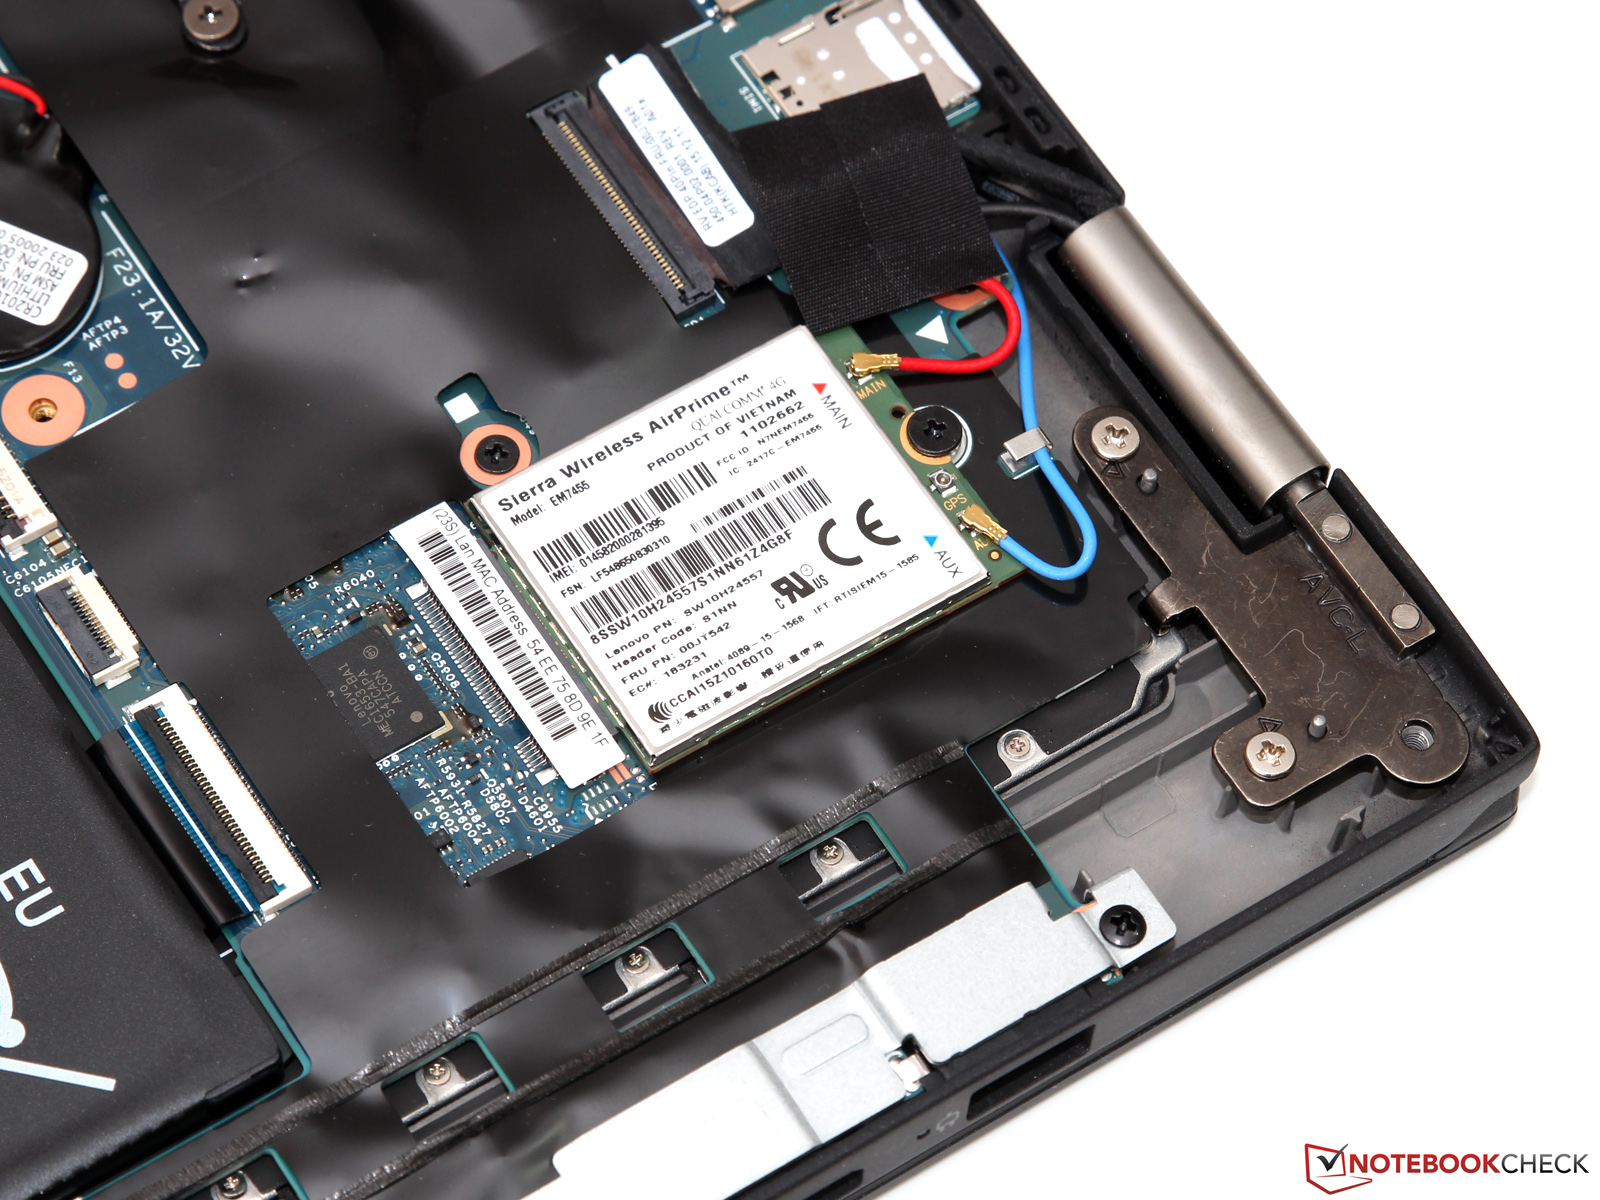
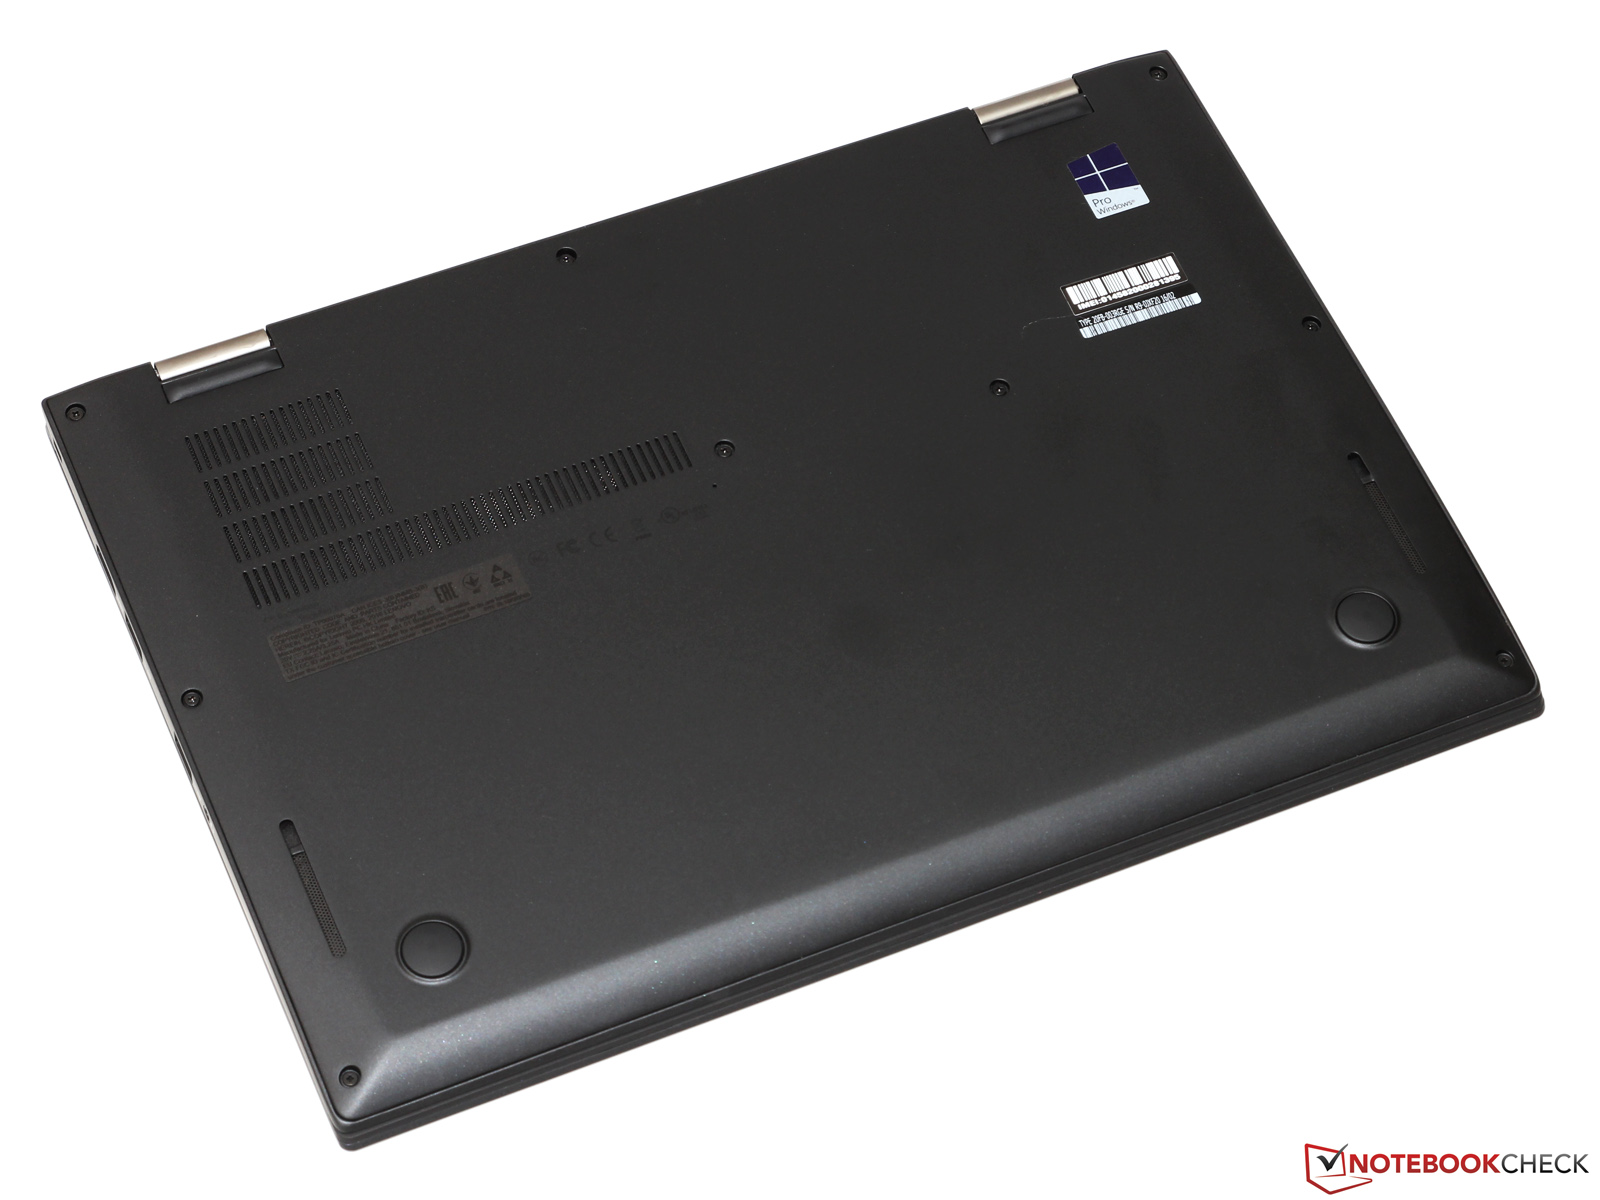
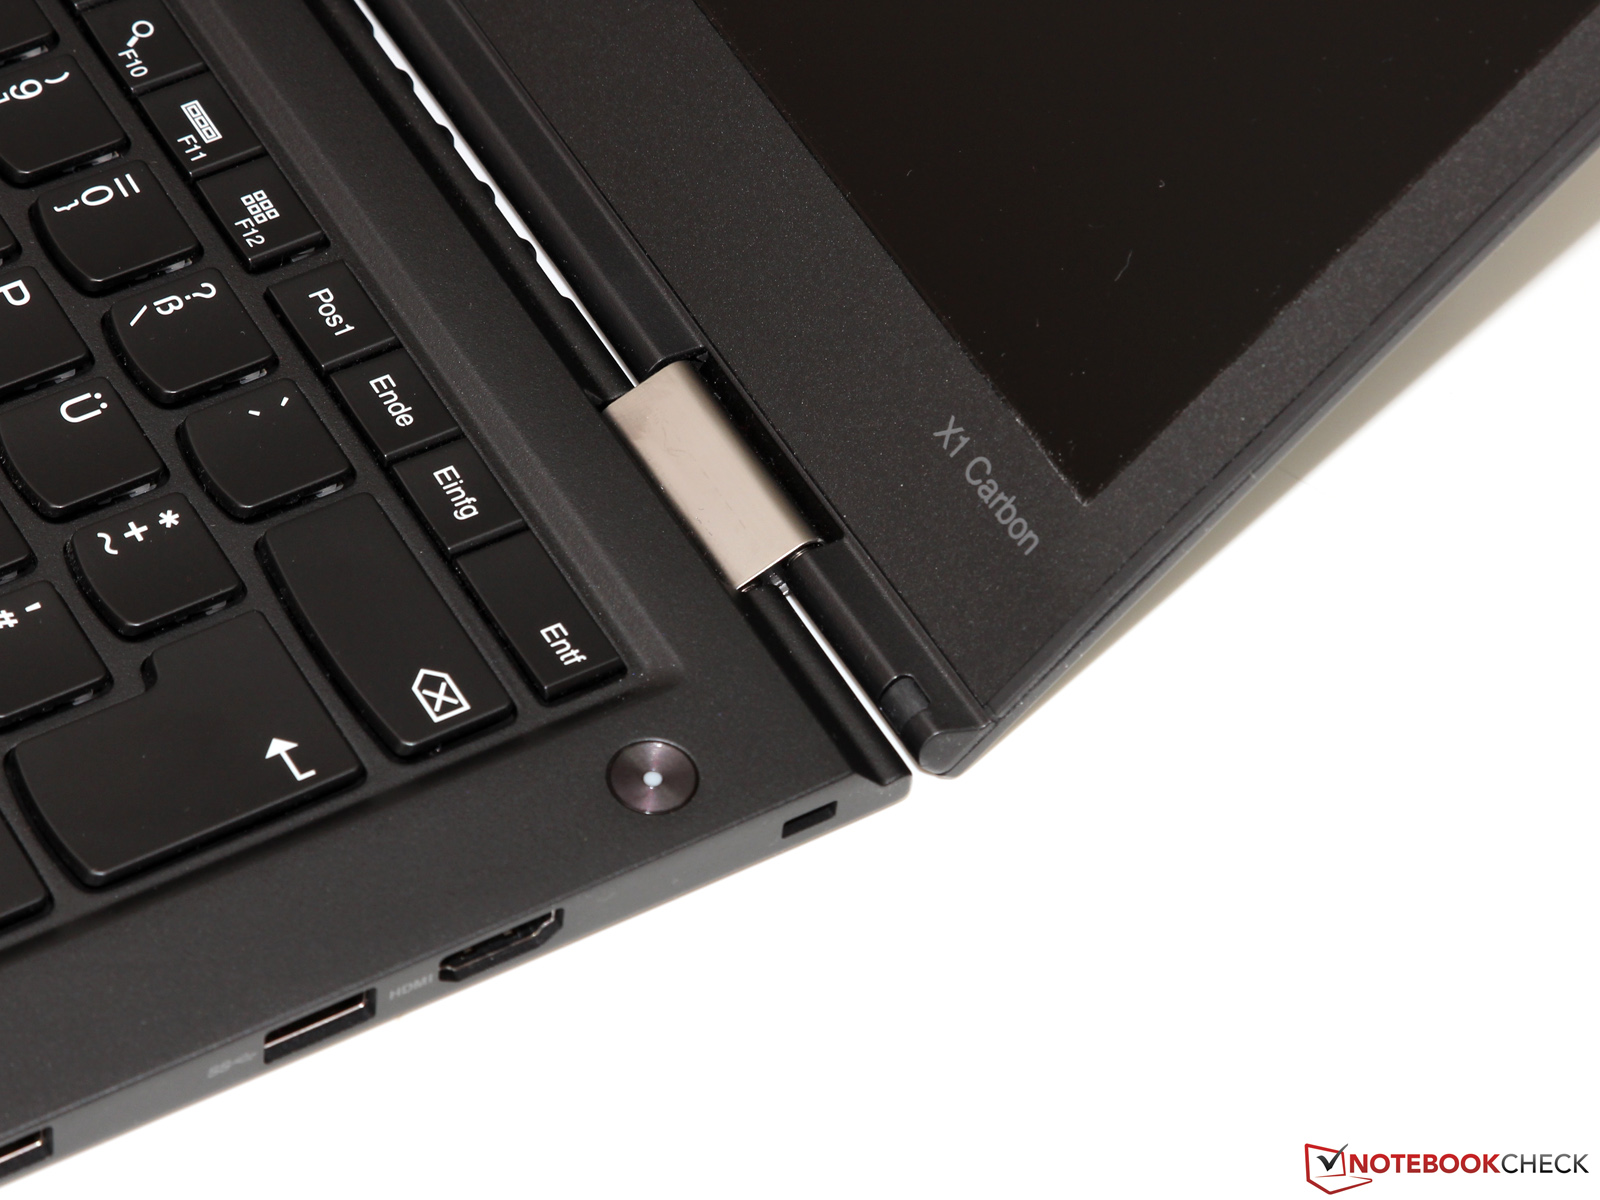
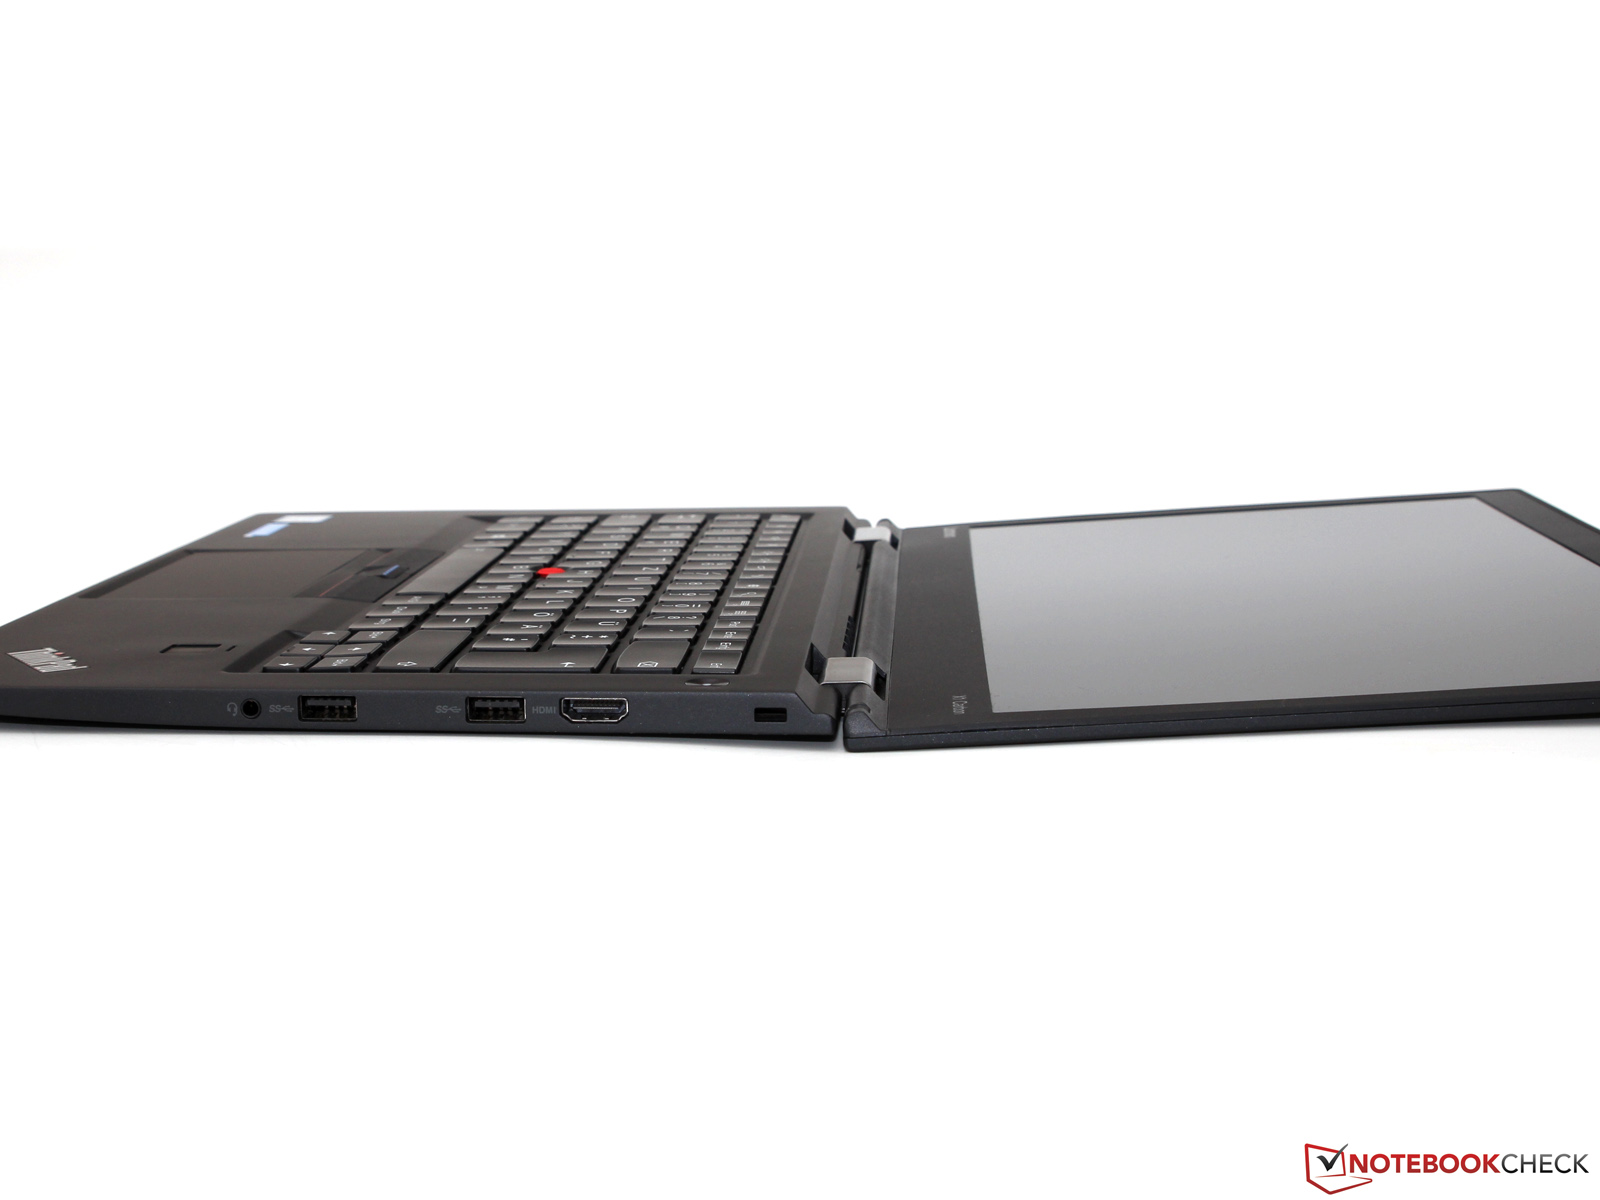
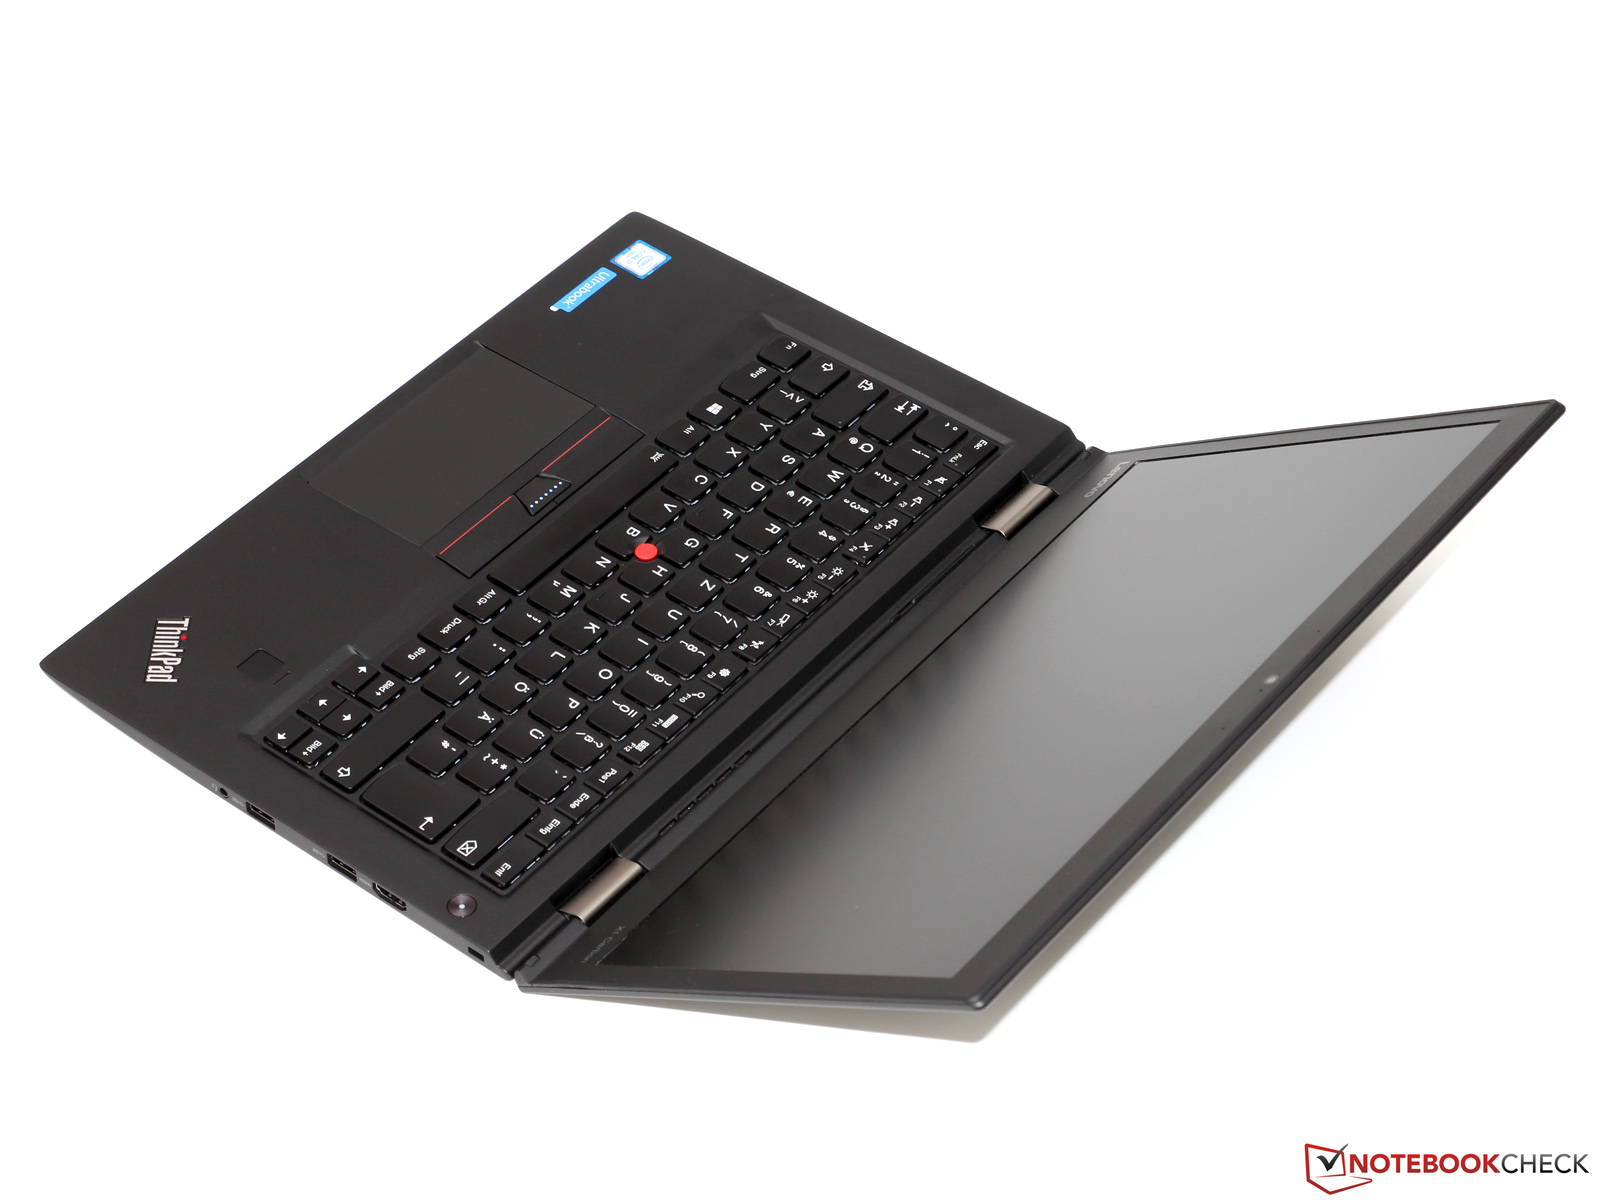
X1 Carbon的超高便携性是它的最大优势。
仅1.2千克的极致轻盈,让你现在可以带着ThinkPad走上每一天的商务旅行而不需电源。尽管设计轻薄,用户却在性能、连接性、散热噪音上不需要做任何妥协。除此之外,联想还为它搭配了绚丽而高对比的WQHD屏幕,不过它的亮度如果能更高就更好了。
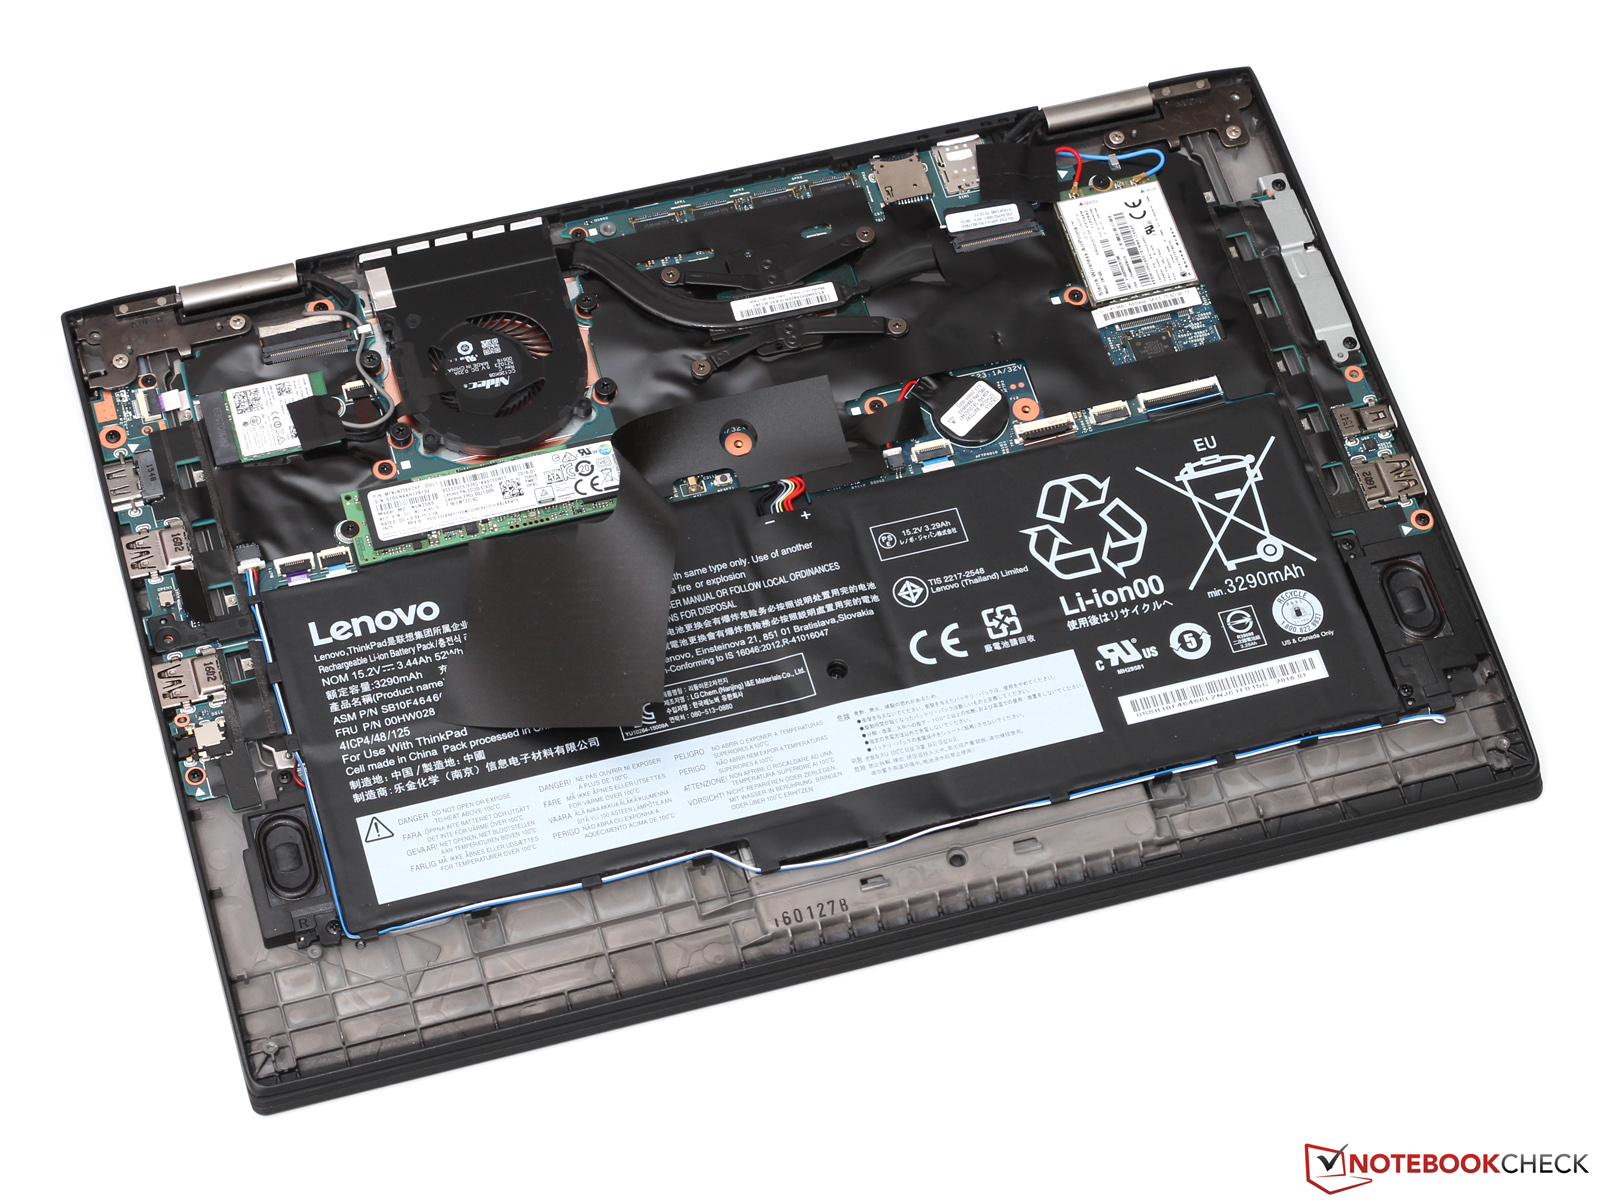
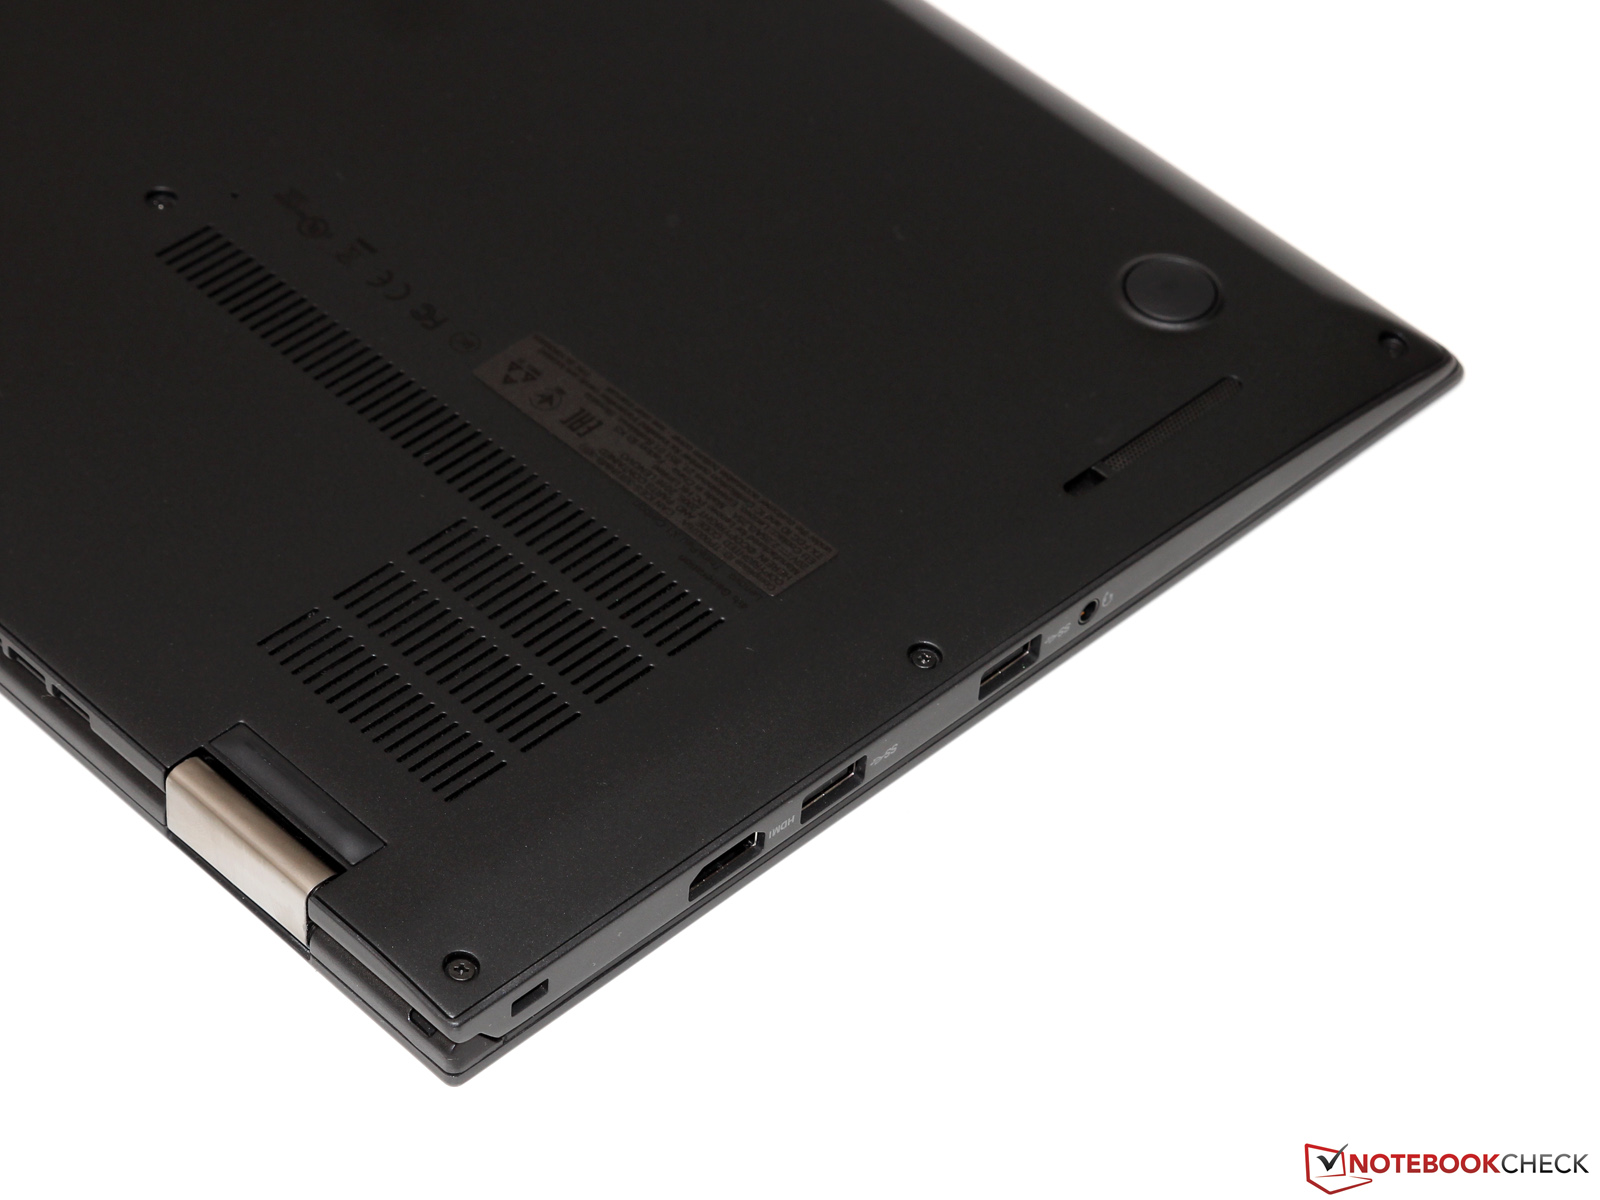
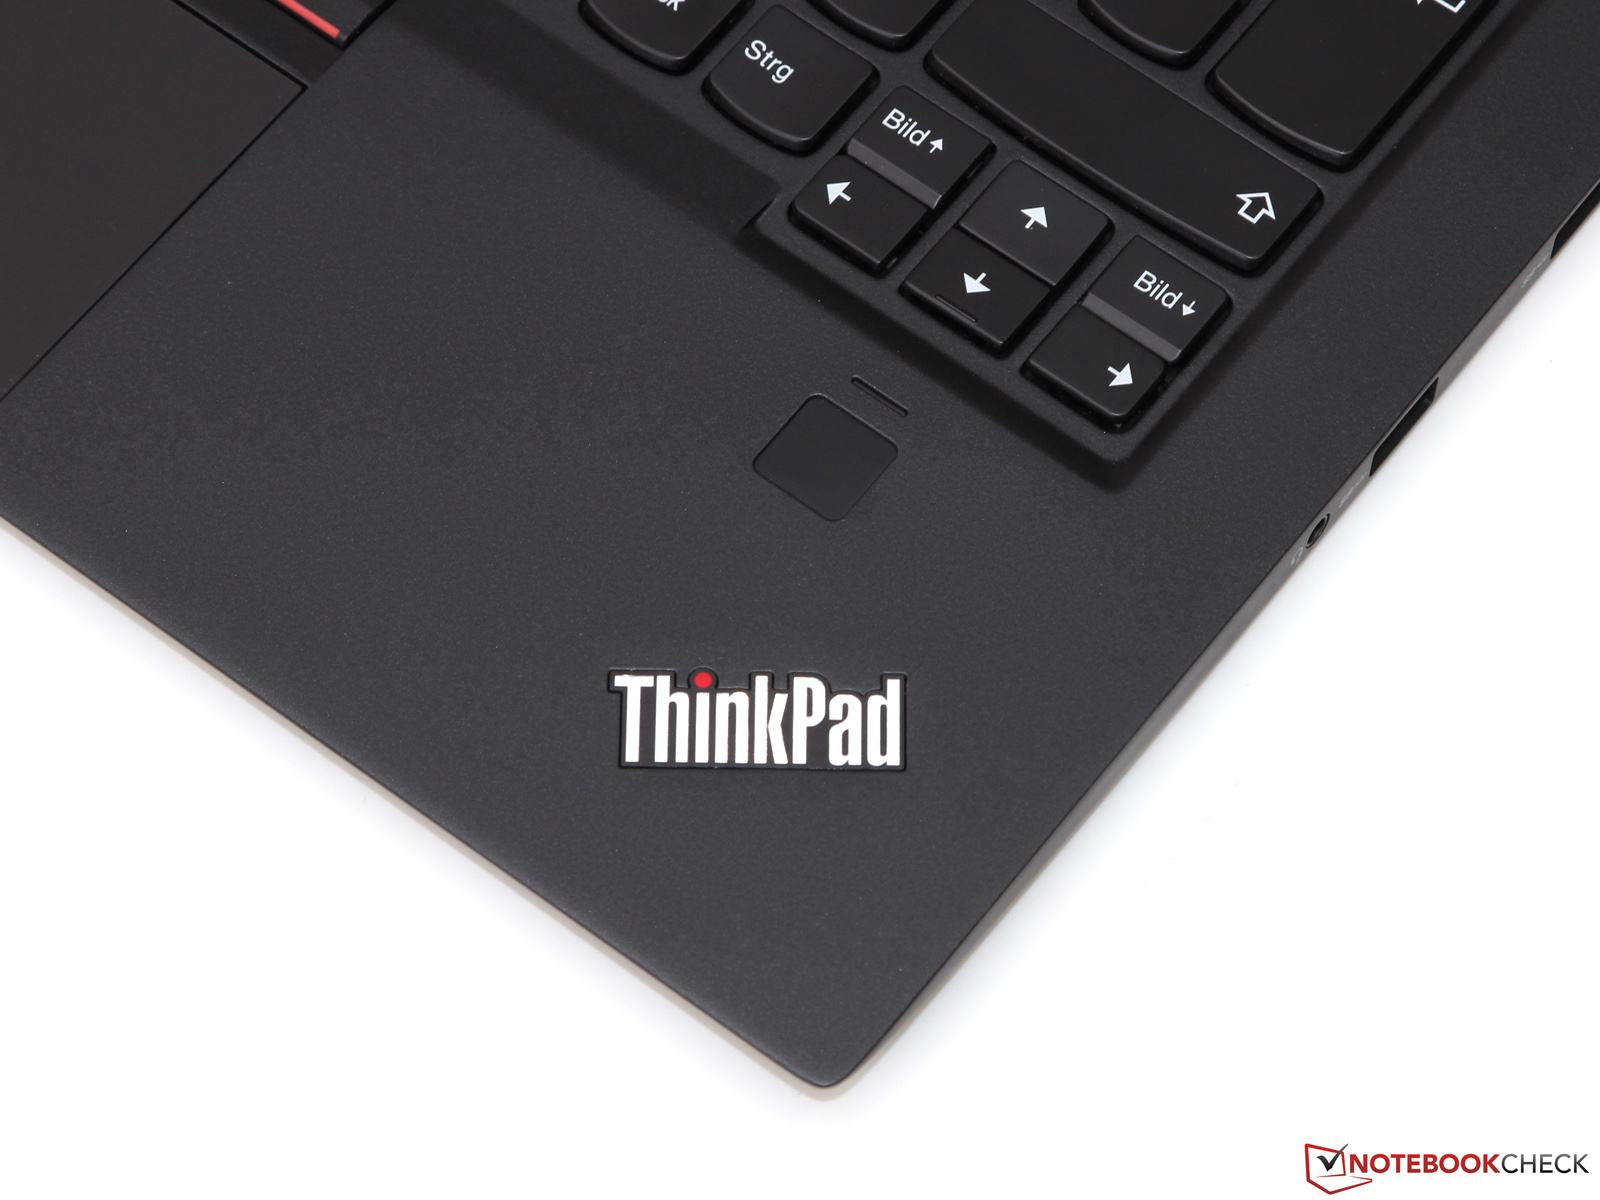
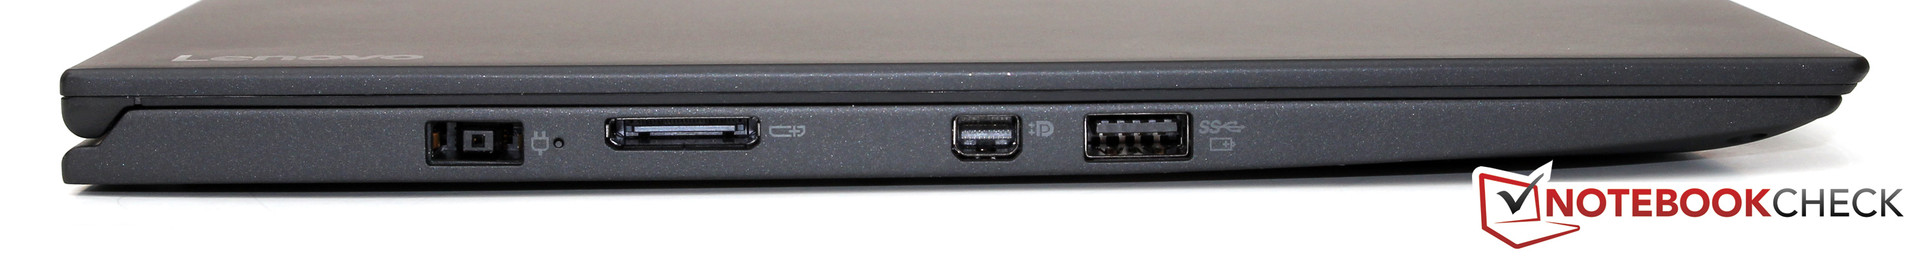
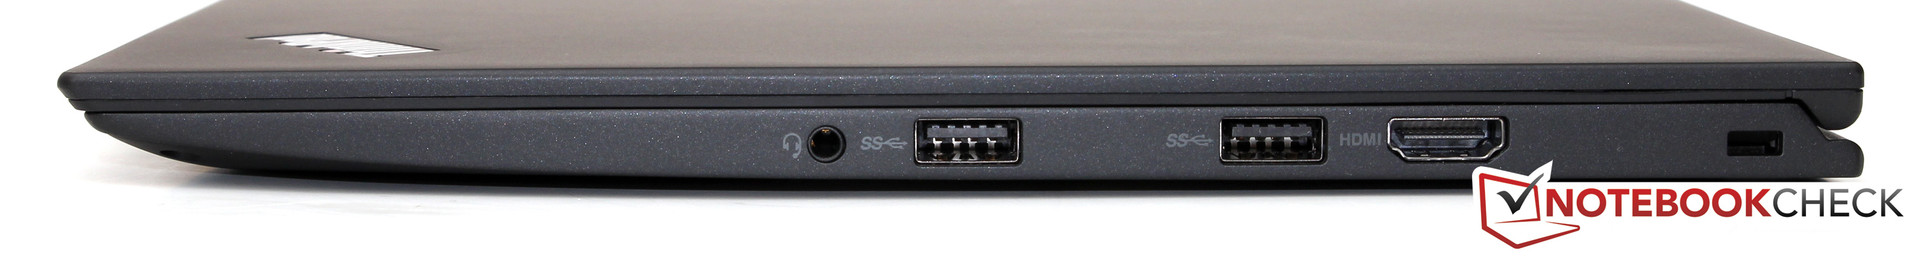
但是,T460s也有胜过X1 Carbon的地方。更大的机身让你可以得到更舒适的键盘,可升级空间和更多接口(内置以太网口,SmartCard,SD读卡器)和由更好散热带来的更高性能。另外,T460s的售价更合理,当然也不算便宜。考虑到各个方面,我们倾向于推荐T系列——不过,决定权还是在用户手里。
注:本文是基于完整评测的缩减版本,阅读完整的英文评测,请点击这里。
Lenovo ThinkPad X1 Carbon 20FB003RGE
-
04/18/2016 v5.1(old)
Till Schönborn