 Deutsch
 English
 Español
 Français
 Italiano
 Nederlands
 Polski
 Português
 Русский
 Türkçe
 Svenska
 Chinese
 Magyar
联想 ThinkPad P70-20ER000XUS 工作站简短评测
| |||||||||||||||||||||||||
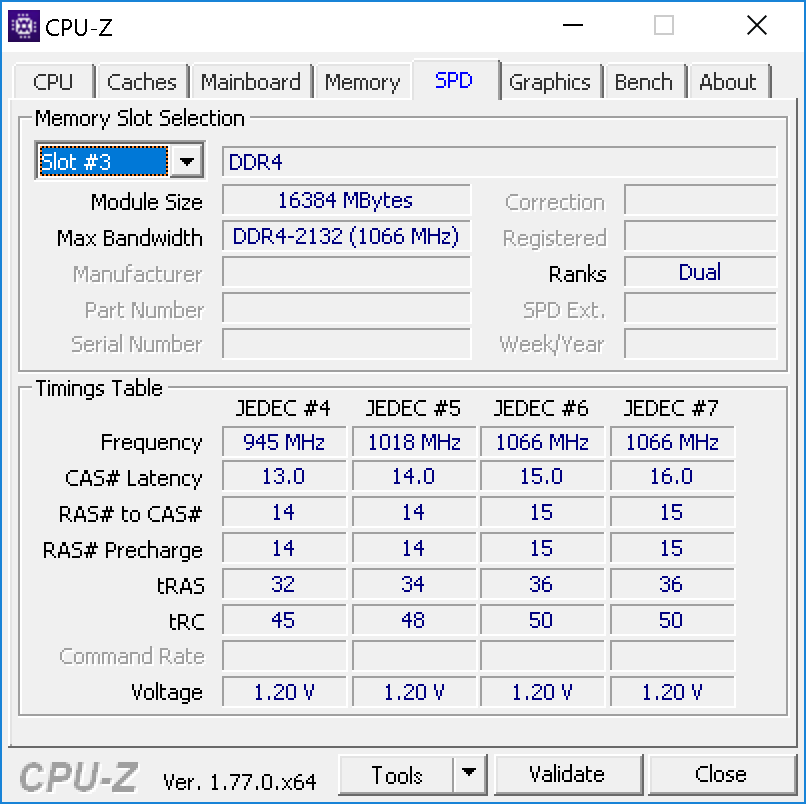
Brightness Distribution: 86 %
Center on Battery: 332 cd/m²
Contrast: 836:1 (Black: 0.397 cd/m²)
ΔE Color 3.15 | 0.5-29.43 Ø5
ΔE Greyscale 3.72 | 0.57-98 Ø5.3
100% sRGB (Argyll 1.6.3 3D)
74.3% AdobeRGB 1998 (Argyll 1.6.3 3D)
Gamma: 1.86
| Lenovo ThinkPad P70-20ER000XUS Panasonic VVX17P051J00 / LEN4123, IPS, 17.30, 3840x2160 | HP ZBook 17 G3 TZV66eA SDC3854, IPS, 17.30, 1920x1080 | Dell Precision 7710 SDC8151, VHN17_173HL, IPS LED, 17.30, 1920x1080 | Lenovo ThinkPad P70 LEN4123, IPS, 17.30, 3840x2160 | MSI WT72-6QM LG Philips LP173WF4-SPF1, IPS, 17.30, 1920x1080 | |
|---|---|---|---|---|---|
| Display | |||||
| Display P3 Coverage | 67.3 | 66.6 | 90.8 | 67.3 | |
| sRGB Coverage | 95.9 | 96.9 | 100 | 85.4 | |
| AdobeRGB 1998 Coverage | 69 | 68.6 | 85.4 | 62.5 | |
| Response Times | -20% | -29% | -8% | -26% | |
| Response Time Grey 50% / Grey 80% * | 34.8 ? | 50.4 ? -45% | 50 ? -44% | 44 ? -26% | 42 ? -21% |
| Response Time Black / White * | 26.8 ? | 28.4 ? -6% | 36 ? -34% | 27.6 ? -3% | 26 ? 3% |
| PWM Frequency | 219.3 ? | 200 ? -9% | 198 ? -10% | 228 ? 4% | 86 ? -61% |
| Screen | 11% | 1% | -6% | -22% | |
| Brightness middle | 332 | 252 -24% | 332 0% | 365 10% | 303 -9% |
| Brightness | 317 | 243 -23% | 307 -3% | 341 8% | 298 -6% |
| Brightness Distribution | 86 | 86 0% | 83 -3% | 85 -1% | 94 9% |
| Black Level * | 0.397 | 0.21 47% | 0.33 17% | 0.4 -1% | 0.46 -16% |
| Contrast | 836 | 1200 44% | 1006 20% | 913 9% | 659 -21% |
| Colorchecker dE 2000 * | 3.15 | 2.2 30% | 3 5% | 3.8 -21% | 5.77 -83% |
| Colorchecker dE 2000 max. * | 5.55 | 3.8 32% | |||
| Greyscale dE 2000 * | 3.72 | 2.7 27% | 4 -8% | 6.09 -64% | 4.87 -31% |
| Gamma | 1.86 118% | 2.28 96% | 2 110% | 2.3 96% | 1.99 111% |
| CCT | 6103 107% | 6686 97% | 7089 92% | 6332 103% | 7363 88% |
| Color Space (Percent of AdobeRGB 1998) | 74.3 | 62 -17% | 62 -17% | 76.01 2% | 56.04 -25% |
| Color Space (Percent of sRGB) | 100 | 96 -4% | 97 -3% | 99.97 0% | 85.27 -15% |
| Total Average (Program / Settings) | -5% /
4% | -14% /
-7% | -7% /
-7% | -24% /
-23% |
* ... smaller is better
Display Response Times
| ↔ Response Time Black to White | ||
|---|---|---|
| 26.8 ms ... rise ↗ and fall ↘ combined | ↗ 4 ms rise | 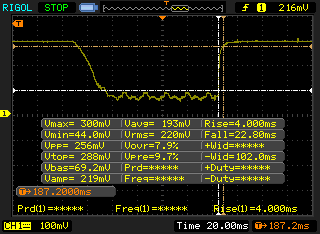 |
| ↘ 22.8 ms fall | ||
| The screen shows relatively slow response rates in our tests and may be too slow for gamers. In comparison, all tested devices range from 0.1 (minimum) to 240 (maximum) ms. » 62 % of all devices are better. This means that the measured response time is worse than the average of all tested devices (21.5 ms). | ||
| ↔ Response Time 50% Grey to 80% Grey | ||
| 34.8 ms ... rise ↗ and fall ↘ combined | ↗ 15.2 ms rise | 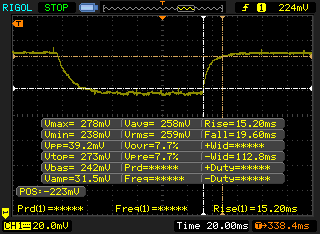 |
| ↘ 19.6 ms fall | ||
| The screen shows slow response rates in our tests and will be unsatisfactory for gamers. In comparison, all tested devices range from 0.2 (minimum) to 636 (maximum) ms. » 42 % of all devices are better. This means that the measured response time is similar to the average of all tested devices (33.7 ms). | ||
Screen Flickering / PWM (Pulse-Width Modulation)
| Screen flickering / PWM detected | 219.3 Hz | ≤ 99 % brightness setting | 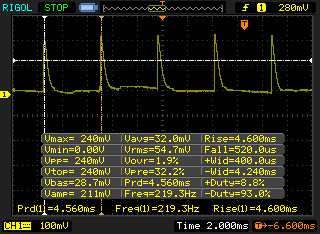 |
The display backlight flickers at 219.3 Hz (worst case, e.g., utilizing PWM) Flickering detected at a brightness setting of 99 % and below. There should be no flickering or PWM above this brightness setting. The frequency of 219.3 Hz is relatively low, so sensitive users will likely notice flickering and experience eyestrain at the stated brightness setting and below. In comparison: 53 % of all tested devices do not use PWM to dim the display. If PWM was detected, an average of 17915 (minimum: 5 - maximum: 3846000) Hz was measured. | |||
| wPrime 2.10 - 1024m | |
| Lenovo ThinkPad P70-20ER000XUS | |
| Lenovo ThinkPad P70 | |
| Dell Precision 7710 | |
| Super Pi Mod 1.5 XS 32M - 32M | |
| Lenovo ThinkPad P70 | |
| Lenovo ThinkPad P70-20ER000XUS | |
| MSI WT72-6QM | |
| Dell Precision 7710 | |
* ... smaller is better
| PCMark 8 | |
| Home Score Accelerated v2 | |
| Dell Precision 7710 | |
| MSI WT72-6QM | |
| HP ZBook 17 G3 TZV66eA | |
| Lenovo ThinkPad P70-20ER000XUS | |
| Lenovo ThinkPad P70 | |
| Work Score Accelerated v2 | |
| MSI WT72-6QM | |
| Dell Precision 7710 | |
| HP ZBook 17 G3 TZV66eA | |
| Lenovo ThinkPad P70 | |
| Lenovo ThinkPad P70-20ER000XUS | |
| Creative Score Accelerated v2 | |
| Lenovo ThinkPad P70-20ER000XUS | |
| Dell Precision 7710 | |
| HP ZBook 17 G3 TZV66eA | |
| PCMark 8 Home Score Accelerated v2 | 4062 points | |
| PCMark 8 Creative Score Accelerated v2 | 6007 points | |
| PCMark 8 Work Score Accelerated v2 | 4307 points | |
Help | ||
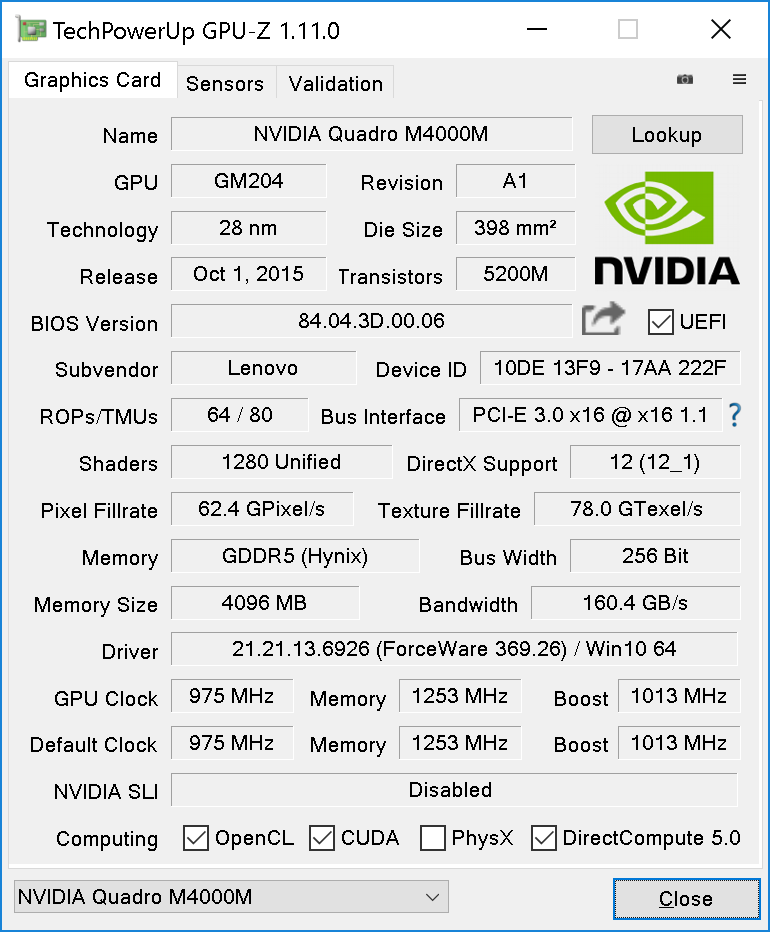
| Lenovo ThinkPad P70-20ER000XUS Quadro M4000M, E3-1505M v5, Samsung SSD SM951a 512GB M.2 PCIe 3.0 x4 NVMe (MZVKV512) | HP ZBook 17 G3 TZV66eA Quadro M3000M, E3-1535M v5, Samsung SM951 MZVPV256HDGL m.2 PCI-e | Dell Precision 7710 FirePro W7170M, E3-1535M v5, Samsung SM951 MZVPV256HDGL m.2 PCI-e | Lenovo ThinkPad P70 Quadro M3000M, 6820HQ, Samsung SSD PM871 MZNLN512HCJH | MSI WT72-6QM Quadro M5000M, E3-1505M v5, Toshiba NVMe THNSN5256GPU7 | |
|---|---|---|---|---|---|
| AS SSD | -11% | -10% | -60% | -19% | |
| Seq Read | 2104 | 1596 -24% | 1886 -10% | 477.8 -77% | 2638 25% |
| Seq Write | 1458 | 703 -52% | 626 -57% | 458.1 -69% | 810 -44% |
| 4K Read | 48.38 | 51.1 6% | 51 5% | 22.61 -53% | 37.5 -22% |
| 4K Write | 131.9 | 148.2 12% | 179 36% | 82.7 -37% | 96.4 -27% |
| 4K-64 Read | 1082 | 1037 -4% | 1064 -2% | 341.7 -68% | 935 -14% |
| 4K-64 Write | 349.3 | 230.4 -34% | 275 -21% | 255.5 -27% | 473.5 36% |
| Access Time Read * | 0.047 | 0.041 13% | 0.069 -47% | 0.069 -47% | 0.092 -96% |
| Access Time Write * | 0.026 | 0.025 4% | 0.022 15% | 0.056 -115% | 0.04 -54% |
| Score Read | 1341 | 1248 -7% | 1304 -3% | 412 -69% | 1237 -8% |
| Score Write | 627 | 449 -28% | 517 -18% | 384 -39% | 651 4% |
| Score Total | 2630 | 2302 -12% | 2435 -7% | 1012 -62% | 2433 -7% |
* ... smaller is better

| 3DMark 11 | |
| 1280x720 Performance GPU | |
| MSI WT72-6QM | |
| Lenovo ThinkPad P70-20ER000XUS | |
| Dell Precision 7710 | |
| HP ZBook 17 G3 TZV66eA | |
| Lenovo ThinkPad P70 | |
| 1280x720 Performance Combined | |
| MSI WT72-6QM | |
| HP ZBook 17 G3 TZV66eA | |
| Lenovo ThinkPad P70 | |
| Dell Precision 7710 | |
| Lenovo ThinkPad P70-20ER000XUS | |
| 3DMark | |
| 1280x720 Cloud Gate Standard Graphics | |
| MSI WT72-6QM | |
| HP ZBook 17 G3 TZV66eA | |
| Lenovo ThinkPad P70-20ER000XUS | |
| Dell Precision 7710 | |
| Lenovo ThinkPad P70 | |
| 1920x1080 Fire Strike Graphics | |
| MSI WT72-6QM | |
| Lenovo ThinkPad P70-20ER000XUS | |
| Dell Precision 7710 | |
| HP ZBook 17 G3 TZV66eA | |
| Lenovo ThinkPad P70 | |
| 1920x1080 Ice Storm Extreme Graphics | |
| MSI WT72-6QM | |
| Lenovo ThinkPad P70-20ER000XUS | |
| 3DMark 11 Performance | 9549 points | |
| 3DMark Ice Storm Standard Score | 121354 points | |
| 3DMark Cloud Gate Standard Score | 21920 points | |
| 3DMark Fire Strike Score | 6937 points | |
| 3DMark Fire Strike Extreme Score | 3694 points | |
Help | ||
| BioShock Infinite | |
| 1366x768 Medium Preset (sort by value) | |
| Lenovo ThinkPad P70-20ER000XUS | |
| HP ZBook 17 G3 TZV66eA | |
| Dell Precision 7710 | |
| Lenovo ThinkPad P70 | |
| 1366x768 High Preset (sort by value) | |
| Lenovo ThinkPad P70-20ER000XUS | |
| HP ZBook 17 G3 TZV66eA | |
| Dell Precision 7710 | |
| Lenovo ThinkPad P70 | |
| 1920x1080 Ultra Preset, DX11 (DDOF) (sort by value) | |
| Lenovo ThinkPad P70-20ER000XUS | |
| HP ZBook 17 G3 TZV66eA | |
| Dell Precision 7710 | |
| Lenovo ThinkPad P70 | |
| Rise of the Tomb Raider | |
| 1366x768 Medium Preset AF:2x (sort by value) | |
| Lenovo ThinkPad P70-20ER000XUS | |
| HP ZBook 17 G3 TZV66eA | |
| 1920x1080 High Preset AA:FX AF:4x (sort by value) | |
| Lenovo ThinkPad P70-20ER000XUS | |
| HP ZBook 17 G3 TZV66eA | |
| 1920x1080 Very High Preset AA:FX AF:16x (sort by value) | |
| Lenovo ThinkPad P70-20ER000XUS | |
| HP ZBook 17 G3 TZV66eA | |
| 3840x2160 High Preset AA:FX AF:4x (sort by value) | |
| Lenovo ThinkPad P70-20ER000XUS | |
| low | med. | high | ultra | 4K | |
| BioShock Infinite (2013) | 196 | 181 | 85 | ||
| Rise of the Tomb Raider (2016) | 90 | 55 | 48 | 20 |
Noise Level
| Idle |
| 28.8 / 28.8 / 28.8 dB(A) |
| Load |
| 40.5 / 45.7 dB(A) |
 | ||
30 dB silent 40 dB(A) audible 50 dB(A) loud |
||
min: | ||
| Lenovo ThinkPad P70-20ER000XUS Quadro M4000M, E3-1505M v5, Samsung SSD SM951a 512GB M.2 PCIe 3.0 x4 NVMe (MZVKV512) | HP ZBook 17 G3 TZV66eA Quadro M3000M, E3-1535M v5, Samsung SM951 MZVPV256HDGL m.2 PCI-e | Dell Precision 7710 FirePro W7170M, E3-1535M v5, Samsung SM951 MZVPV256HDGL m.2 PCI-e | Lenovo ThinkPad P70 Quadro M3000M, 6820HQ, Samsung SSD PM871 MZNLN512HCJH | MSI WT72-6QM Quadro M5000M, E3-1505M v5, Toshiba NVMe THNSN5256GPU7 | |
|---|---|---|---|---|---|
| Noise | -7% | -4% | 1% | -6% | |
| off / environment * | 28.8 | 30 -4% | 30 -4% | 30 -4% | |
| Idle Minimum * | 28.8 | 30 -4% | 30 -4% | 30 -4% | 33.3 -16% |
| Idle Average * | 28.8 | 30 -4% | 30 -4% | 30 -4% | 33.4 -16% |
| Idle Maximum * | 28.8 | 30 -4% | 30 -4% | 30 -4% | 33.5 -16% |
| Load Average * | 40.5 | 48.9 -21% | 43.2 -7% | 36.5 10% | 38.8 4% |
| Load Maximum * | 45.7 | 48.9 -7% | 47.13 -3% | 40.8 11% | 40.2 12% |
* ... smaller is better
(-) The maximum temperature on the upper side is 52 °C / 126 F, compared to the average of 38.1 °C / 101 F, ranging from 22.2 to 69.8 °C for the class Workstation.
(-) The bottom heats up to a maximum of 51 °C / 124 F, compared to the average of 41.3 °C / 106 F
(±) In idle usage, the average temperature for the upper side is 33.9 °C / 93 F, compared to the device average of 32 °C / 90 F.
(+) The palmrests and touchpad are reaching skin temperature as a maximum (35.6 °C / 96.1 F) and are therefore not hot.
(-) The average temperature of the palmrest area of similar devices was 27.8 °C / 82 F (-7.8 °C / -14.1 F).
Lenovo ThinkPad P70-20ER000XUS audio analysis
(±) | speaker loudness is average but good (72.1 dB)
Bass 100 - 315 Hz
(±) | reduced bass - on average 12.9% lower than median
(±) | linearity of bass is average (14.5% delta to prev. frequency)
Mids 400 - 2000 Hz
(±) | higher mids - on average 5.1% higher than median
(+) | mids are linear (6.1% delta to prev. frequency)
Highs 2 - 16 kHz
(+) | balanced highs - only 4.6% away from median
(±) | linearity of highs is average (14.5% delta to prev. frequency)
Overall 100 - 16.000 Hz
(±) | linearity of overall sound is average (28.1% difference to median)
Compared to same class
» 92% of all tested devices in this class were better, 3% similar, 5% worse
» The best had a delta of 7%, average was 18%, worst was 35%
Compared to all devices tested
» 82% of all tested devices were better, 3% similar, 14% worse
» The best had a delta of 4%, average was 25%, worst was 134%
Apple MacBook 12 (Early 2016) 1.1 GHz audio analysis
(+) | speakers can play relatively loud (83.6 dB)
Bass 100 - 315 Hz
(±) | reduced bass - on average 11.3% lower than median
(±) | linearity of bass is average (14.2% delta to prev. frequency)
Mids 400 - 2000 Hz
(+) | balanced mids - only 2.4% away from median
(+) | mids are linear (5.5% delta to prev. frequency)
Highs 2 - 16 kHz
(+) | balanced highs - only 2% away from median
(+) | highs are linear (4.5% delta to prev. frequency)
Overall 100 - 16.000 Hz
(+) | overall sound is linear (10.2% difference to median)
Compared to same class
» 5% of all tested devices in this class were better, 2% similar, 93% worse
» The best had a delta of 5%, average was 19%, worst was 53%
Compared to all devices tested
» 3% of all tested devices were better, 1% similar, 96% worse
» The best had a delta of 4%, average was 25%, worst was 134%
| Off / Standby | |
| Idle | |
| Load |
|
| Lenovo ThinkPad P70-20ER000XUS E3-1505M v5, Quadro M4000M, Samsung SSD SM951a 512GB M.2 PCIe 3.0 x4 NVMe (MZVKV512), IPS, 3840x2160, 17.30 | HP ZBook 17 G3 TZV66eA E3-1535M v5, Quadro M3000M, Samsung SM951 MZVPV256HDGL m.2 PCI-e, IPS, 1920x1080, 17.30 | Dell Precision 7710 E3-1535M v5, FirePro W7170M, Samsung SM951 MZVPV256HDGL m.2 PCI-e, IPS LED, 1920x1080, 17.30 | Lenovo ThinkPad P70 6820HQ, Quadro M3000M, Samsung SSD PM871 MZNLN512HCJH, IPS, 3840x2160, 17.30 | MSI WT72-6QM E3-1505M v5, Quadro M5000M, Toshiba NVMe THNSN5256GPU7, IPS, 1920x1080, 17.30 | |
|---|---|---|---|---|---|
| Power Consumption | 39% | 19% | 32% | 0% | |
| Idle Minimum * | 22.8 | 6.7 71% | 6.04 74% | 12.1 47% | 24.8 -9% |
| Idle Average * | 29.7 | 12.5 58% | 15.2 49% | 19.7 34% | 29.7 -0% |
| Idle Maximum * | 31.1 | 13.2 58% | 42.3 -36% | 20.5 34% | 30.1 3% |
| Load Average * | 124.2 | 128.2 -3% | 112.8 9% | 94.3 24% | 105.2 15% |
| Load Maximum * | 177.4 | 158.9 10% | 182.2 -3% | 139.6 21% | 192.2 -8% |
* ... smaller is better
| Lenovo ThinkPad P70-20ER000XUS E3-1505M v5, Quadro M4000M, 96 Wh | HP ZBook 17 G3 TZV66eA E3-1535M v5, Quadro M3000M, 96 Wh | Dell Precision 7710 E3-1535M v5, FirePro W7170M, 72 Wh | Lenovo ThinkPad P70 6820HQ, Quadro M3000M, 96 Wh | MSI WT72-6QM E3-1505M v5, Quadro M5000M, Wh | |
|---|---|---|---|---|---|
| Battery Runtime | 130% | 106% | 57% | 38% | |
| Reader / Idle | 292 | 956 227% | 775 165% | 464 59% | 413 41% |
| WiFi v1.3 | 191 | 290 52% | 365 91% | 361 89% | 245 28% |
| Load | 52 | 110 112% | 85 63% | 64 23% | 76 46% |
Pros
Cons
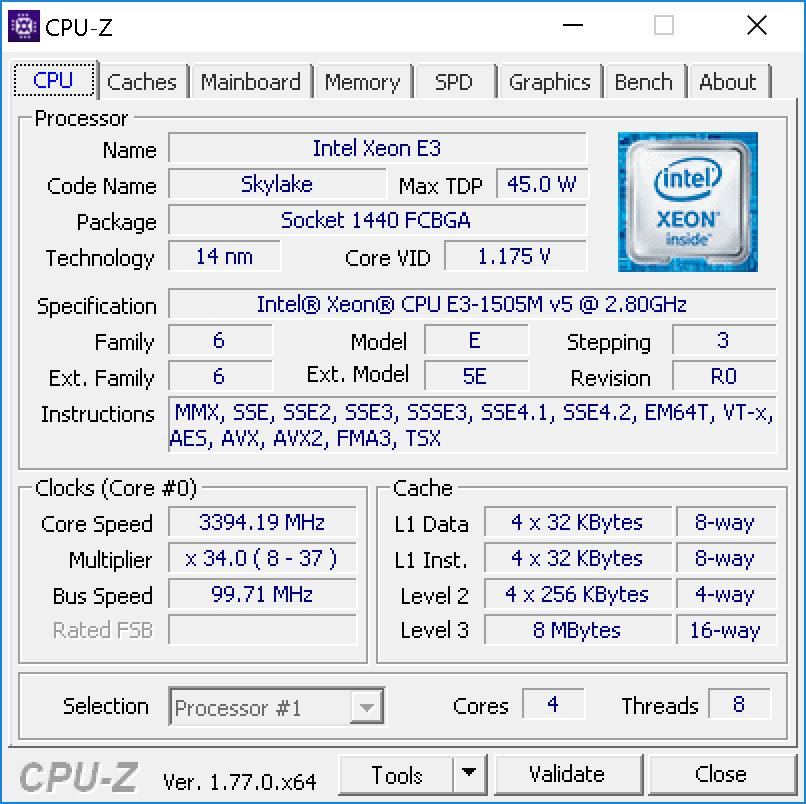
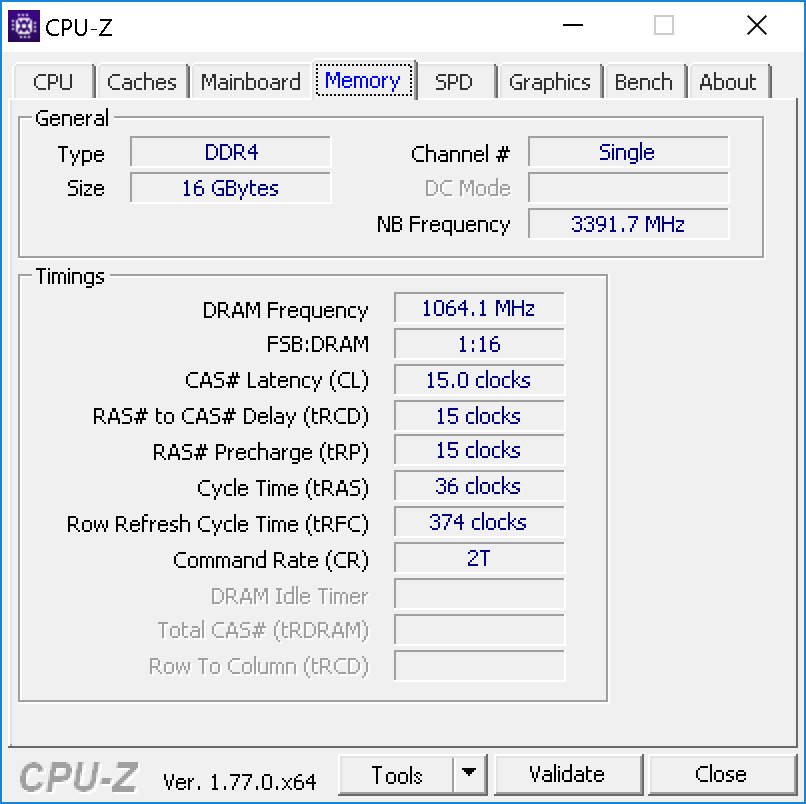
一台强劲的移动工作站需要很多因素的优化,不过说到底最重要的方面仍然是稳定性、处理器/显卡性能和硬盘速度。联想P70-20ER000XUS在这些方面都不甘示弱,凭借强劲的基准测试成绩和可靠运行证明了自己3849美元(约25883人民币)的价值。相比几个月前我们测试的上一代P70机型,它的NVMe固态硬盘带来了快速的响应,同时搭配性能更强(功耗也更高)的英伟达 Quadro M4000M显卡,Xeon处理器更换为则带来了对ECC内存的支持(预装16GB),从而改善了系统的稳定性。
和同类产品比较的话,它是否有优势呢?简单地说,是的——由于提供了独特的优势(也同时有一些劣势),它会更适合有相应需要的用户。尽管移动工作站通常被认为是无需妥协的设备,但实际并非如此,它们只是在性能上追求极致,而在其他方面也依然需要作出考量。如果你需要M4000M显卡,搭配ECC内存,也不需对电池续航做太多考虑的话,那么P70是价位合理的最优选择。
注:本文是基于完整评测的缩减版本,阅读完整的英文评测,请点击这里。
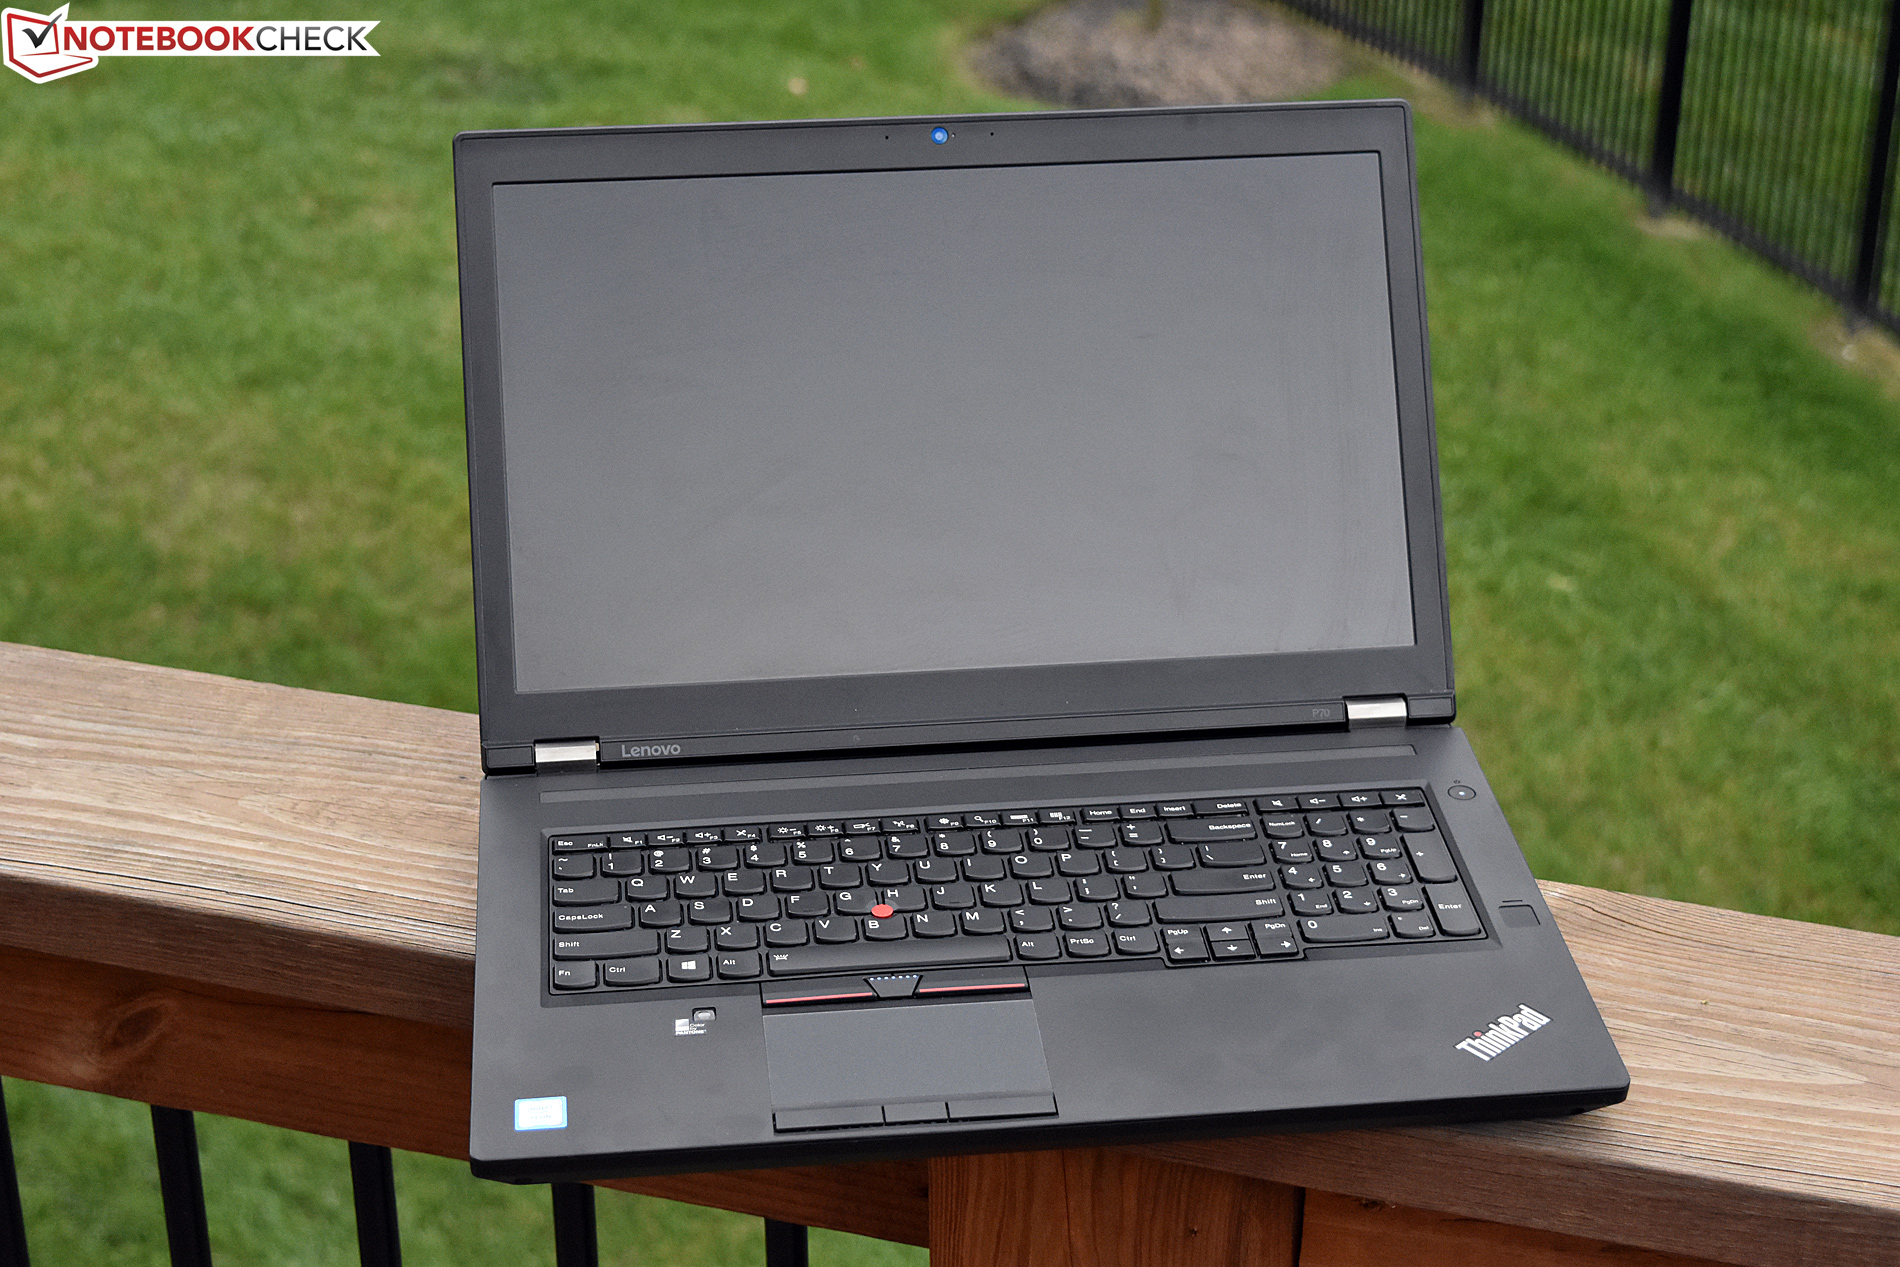
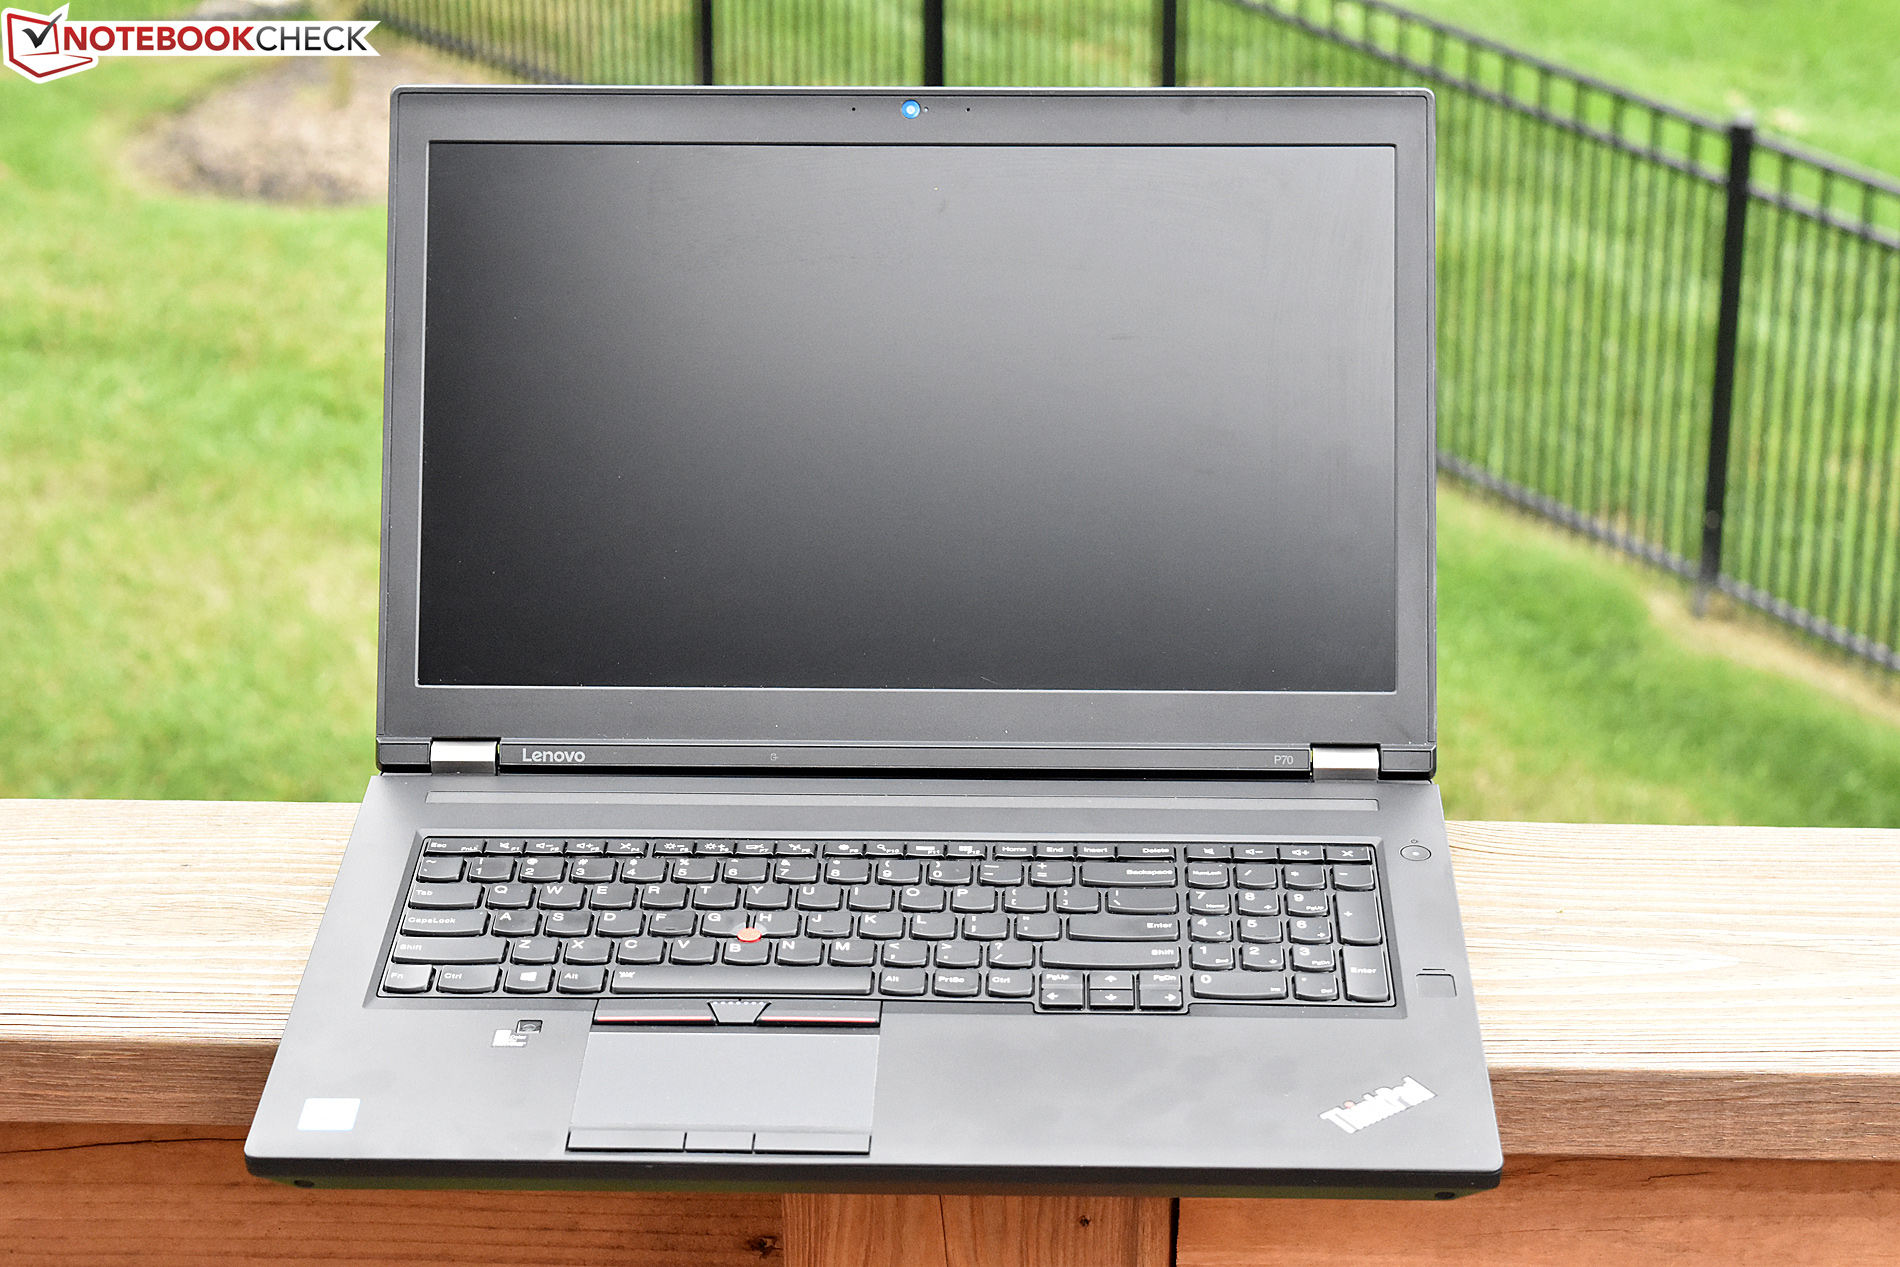
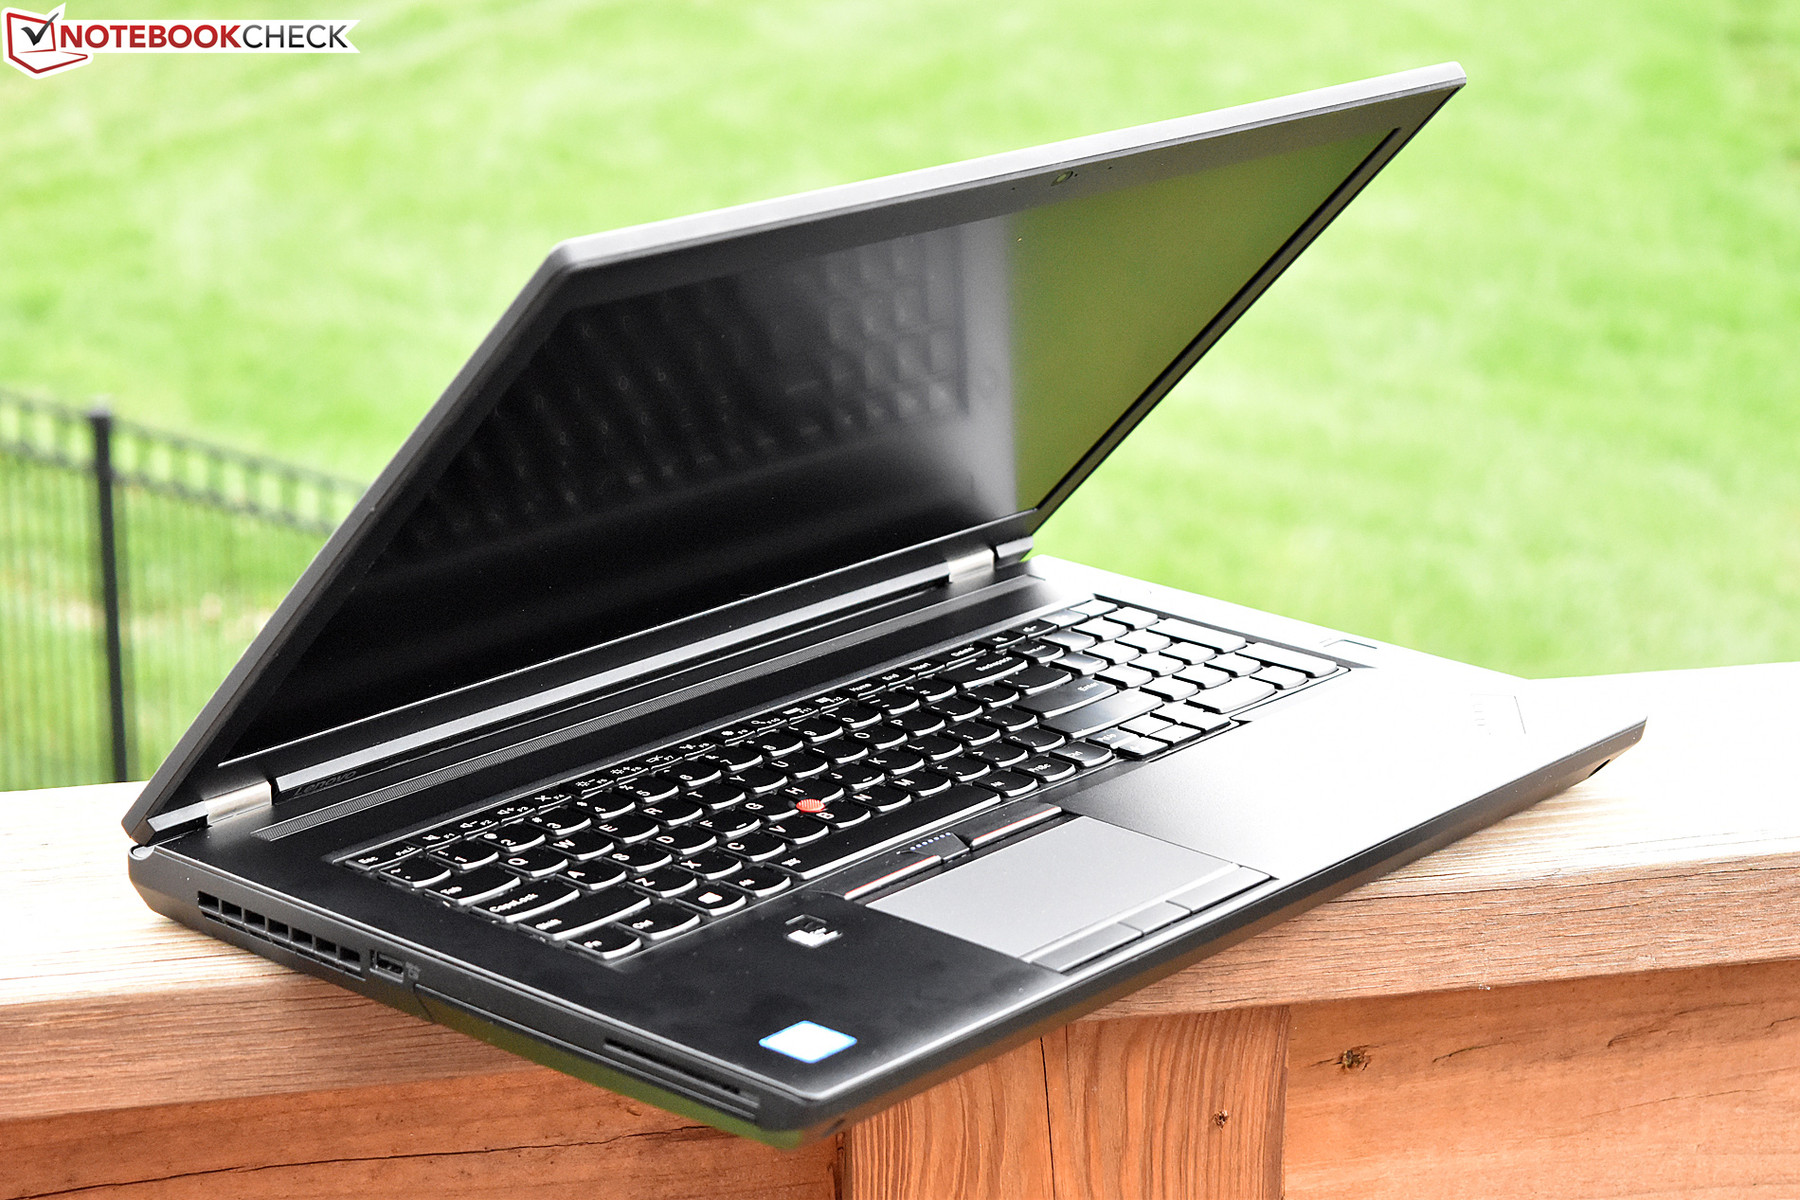
Lenovo ThinkPad P70-20ER000XUS
-
10/17/2016 v5.1(old)
Steve Schardein
Pricecompare
