 Deutsch
 English
 Español
 Français
 Italiano
 Nederlands
 Polski
 Português
 Русский
 Türkçe
 Svenska
 Chinese
 Magyar
宏碁 Spin 7 SP714-51-M09D 变形本简短评测
| Networking | |
| iperf Server (receive) TCP 1 m | |
| Apple MacBook Pro Retina 13 inch 2013-10 | |
| Lenovo Miix 510 Pro 80U10006GE (jseb) | |
| Asus Zenbook UX330UA-FC059T | |
| Asus Zenbook UX360UA-C4159T | |
| Acer Spin 7 SP714-51-M09D (jseb) | |
| Medion Akoya S3409-MD60234 (jseb) | |
| HP ProBook 655 G2 T9X09ET (jseb) | |
| iperf Client (transmit) TCP 1 m | |
| Acer Spin 7 SP714-51-M09D (jseb) | |
| Asus Zenbook UX360UA-C4159T | |
| Apple MacBook Pro Retina 13 inch 2013-10 (Hinum) | |
| Lenovo Miix 510 Pro 80U10006GE (jseb) | |
| Medion Akoya S3409-MD60234 (jseb) | |
| Asus Zenbook UX330UA-FC059T (jseb) | |
| HP ProBook 655 G2 T9X09ET (jseb) | |
| |||||||||||||||||||||||||
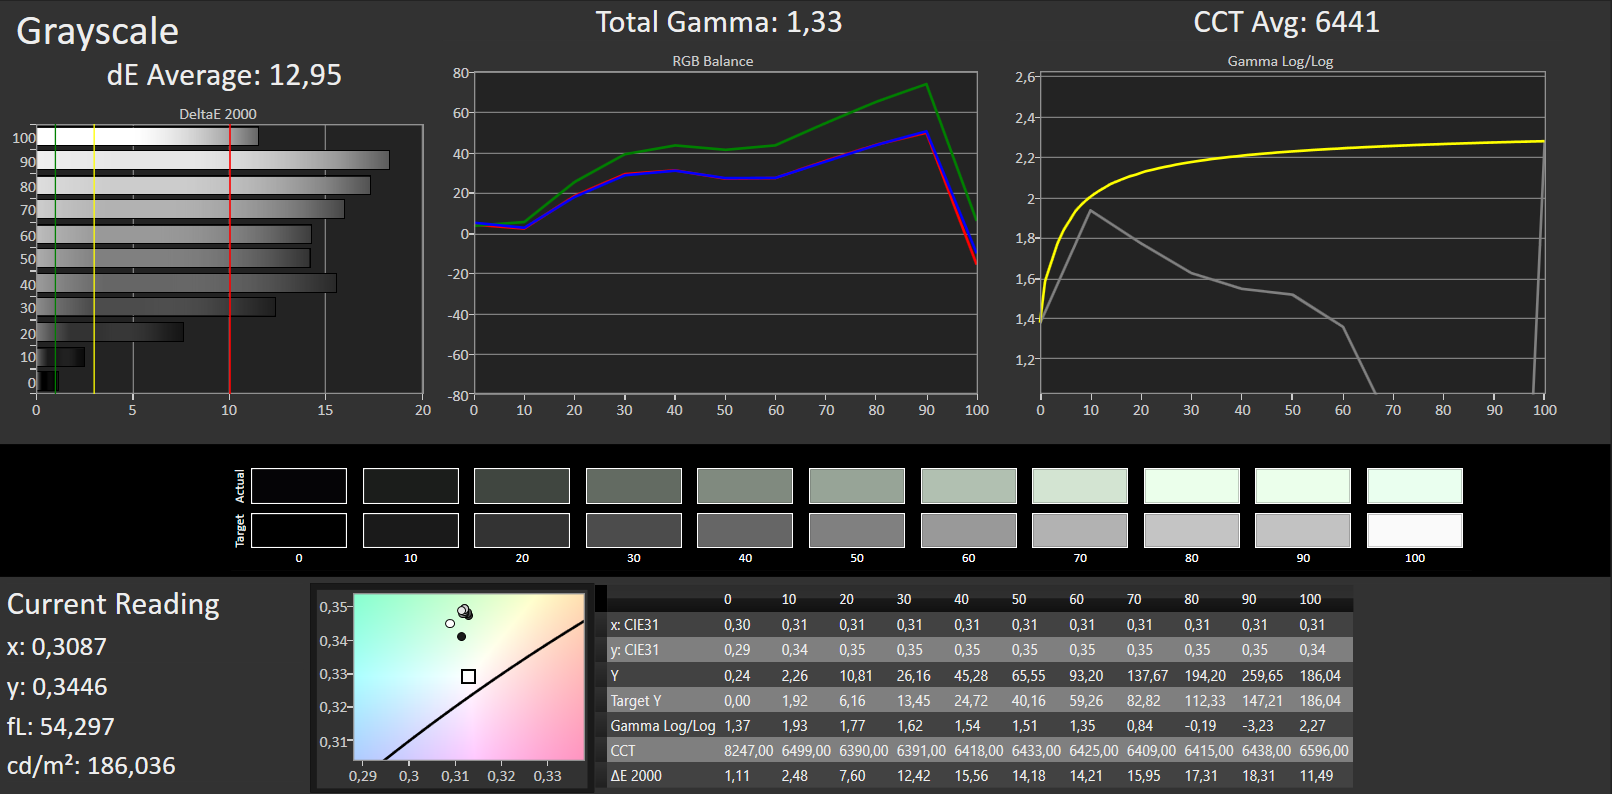
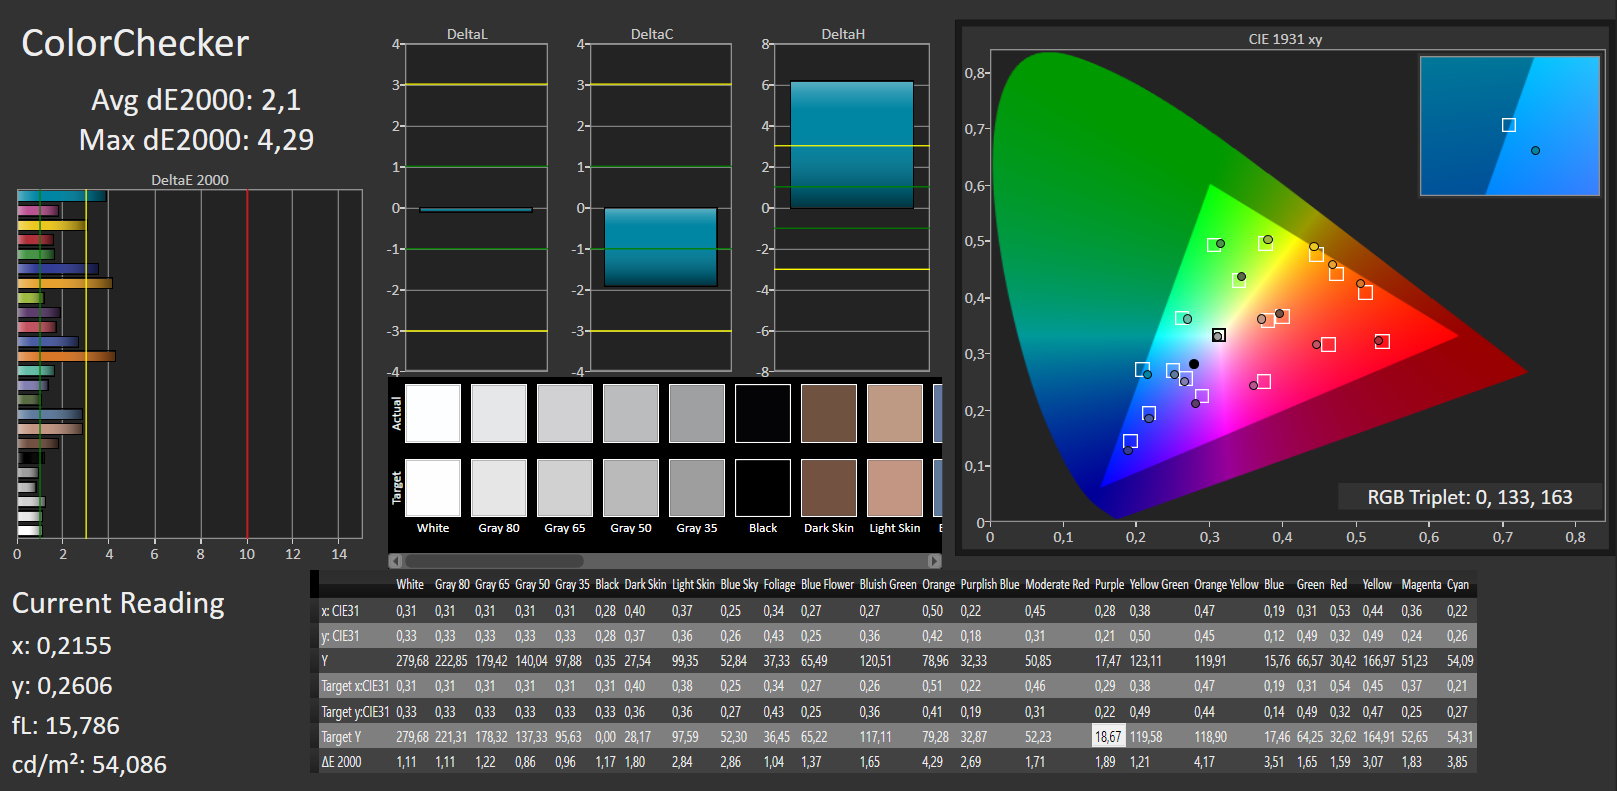
Brightness Distribution: 72 %
Center on Battery: 332 cd/m²
Contrast: 1323:1 (Black: 0.26 cd/m²)
ΔE Color 12.65 | 0.5-29.43 Ø5
ΔE Greyscale 12.95 | 0.57-98 Ø5.3
89% sRGB (Argyll 1.6.3 3D)
58% AdobeRGB 1998 (Argyll 1.6.3 3D)
62.9% AdobeRGB 1998 (Argyll 2.2.0 3D)
89.1% sRGB (Argyll 2.2.0 3D)
61.5% Display P3 (Argyll 2.2.0 3D)
Gamma: 1.33
| Acer Spin 7 SP714-51-M09D AUO B140HAN03.2 / AUO323D, , 1920x1080, 14.00 | Asus Zenbook UX360UA-C4159T AU Optronics AOU272D / B133HAN02.7, , 1920x1080, 13.30 | HP Spectre x360 13-w023dx Chi Mei CMN1367, , 1920x1080, 13.30 | Lenovo ThinkPad X1 Yoga-20FRS1VS00 Samsung ATNA40JU01-0, , 2560x1440, 14.00 | Acer Aspire Switch Alpha 12 SA5-271-56HM Panasonic VVX12T041N00, , 2160x1440, 12.00 | Lenovo Miix 510 Pro 80U10006GE Unknown, , 1920x1200, 12.20 | |
|---|---|---|---|---|---|---|
| Display | 5% | 4% | 7% | 4% | ||
| Display P3 Coverage | 61.5 | 64.8 5% | 65.4 6% | 65.5 7% | 64.5 5% | |
| sRGB Coverage | 89.1 | 93.1 4% | 90.4 1% | 96.1 8% | 92 3% | |
| AdobeRGB 1998 Coverage | 62.9 | 66 5% | 65.8 5% | 66.9 6% | 65.5 4% | |
| Response Times | 35% | 14% | 97% | 15% | 24% | |
| Response Time Grey 50% / Grey 80% * | 51 ? | 29 ? 43% | 33.2 ? 35% | 1 ? 98% | 20 ? 61% | 33 ? 35% |
| Response Time Black / White * | 26 ? | 19 ? 27% | 28 ? -8% | 1 ? 96% | 34 ? -31% | 23 ? 12% |
| PWM Frequency | 50 ? | 240 ? | 1000 ? | 125 ? | ||
| Screen | 18% | 10% | 32% | 11% | 6% | |
| Brightness middle | 344 | 344 0% | 334.6 -3% | 279 -19% | 345 0% | 327 -5% |
| Brightness | 292 | 326 12% | 319 9% | 277 -5% | 328 12% | 324 11% |
| Brightness Distribution | 72 | 86 19% | 90 25% | 91 26% | 91 26% | 88 22% |
| Black Level * | 0.26 | 0.27 -4% | 0.336 -29% | 0.38 -46% | 0.35 -35% | |
| Contrast | 1323 | 1274 -4% | 996 -25% | 908 -31% | 934 -29% | |
| Colorchecker dE 2000 * | 12.65 | 5.53 56% | 6.21 51% | 5.15 59% | 8.4 34% | 6.54 48% |
| Colorchecker dE 2000 max. * | 17.8 | 10.01 44% | 12 33% | 8.28 53% | 11.9 33% | 15.59 12% |
| Greyscale dE 2000 * | 12.95 | 6.67 48% | 7.71 40% | 5.44 58% | 4.3 67% | 9.52 26% |
| Gamma | 1.33 165% | 2.43 91% | 2.36 93% | 2.28 96% | 2.63 84% | 2.35 94% |
| CCT | 6441 101% | 7012 93% | 6458 101% | 5686 114% | 7368 88% | 8802 74% |
| Color Space (Percent of AdobeRGB 1998) | 58 | 60 3% | 58.6 1% | 98 69% | 62 7% | 59 2% |
| Color Space (Percent of sRGB) | 89 | 93 4% | 90 1% | 100 12% | 92 3% | |
| Total Average (Program / Settings) | 19% /
17% | 9% /
9% | 65% /
45% | 11% /
11% | 11% /
8% |
* ... smaller is better
Display Response Times
| ↔ Response Time Black to White | ||
|---|---|---|
| 26 ms ... rise ↗ and fall ↘ combined | ↗ 6 ms rise | |
| ↘ 20 ms fall | ||
| The screen shows relatively slow response rates in our tests and may be too slow for gamers. In comparison, all tested devices range from 0.1 (minimum) to 240 (maximum) ms. » 57 % of all devices are better. This means that the measured response time is worse than the average of all tested devices (21.5 ms). | ||
| ↔ Response Time 50% Grey to 80% Grey | ||
| 51 ms ... rise ↗ and fall ↘ combined | ↗ 13 ms rise | |
| ↘ 38 ms fall | ||
| The screen shows slow response rates in our tests and will be unsatisfactory for gamers. In comparison, all tested devices range from 0.2 (minimum) to 636 (maximum) ms. » 86 % of all devices are better. This means that the measured response time is worse than the average of all tested devices (33.7 ms). | ||
Screen Flickering / PWM (Pulse-Width Modulation)
| Screen flickering / PWM not detected | ||
In comparison: 53 % of all tested devices do not use PWM to dim the display. If PWM was detected, an average of 17924 (minimum: 5 - maximum: 3846000) Hz was measured. | ||
| Cinebench R15 | |
| CPU Single 64Bit | |
| Lenovo ThinkPad X1 Yoga-20FRS1VS00 | |
| HP Spectre x360 13-w023dx | |
| Asus Zenbook UX360UA-C4159T | |
| Lenovo Miix 510 Pro 80U10006GE | |
| Acer Aspire Switch Alpha 12 SA5-271-56HM | |
| Acer Spin 7 SP714-51-M09D | |
| Huawei MateBook m5-6Y54 | |
| HP Pavilion x2 12-b000ng | |
| CPU Multi 64Bit | |
| Asus Zenbook UX360UA-C4159T | |
| HP Spectre x360 13-w023dx | |
| Lenovo ThinkPad X1 Yoga-20FRS1VS00 | |
| Acer Aspire Switch Alpha 12 SA5-271-56HM | |
| Lenovo Miix 510 Pro 80U10006GE | |
| Huawei MateBook m5-6Y54 | |
| HP Pavilion x2 12-b000ng | |
| Acer Spin 7 SP714-51-M09D | |
| PCMark 8 | |
| Home Score Accelerated v2 | |
| HP Spectre x360 13-w023dx | |
| Lenovo ThinkPad X1 Yoga-20FRS1VS00 | |
| Asus Zenbook UX360UA-C4159T | |
| Acer Aspire Switch Alpha 12 SA5-271-56HM | |
| Lenovo Miix 510 Pro 80U10006GE | |
| Acer Spin 7 SP714-51-M09D | |
| Huawei MateBook m5-6Y54 | |
| Work Score Accelerated v2 | |
| HP Spectre x360 13-w023dx | |
| Lenovo ThinkPad X1 Yoga-20FRS1VS00 | |
| Asus Zenbook UX360UA-C4159T | |
| Lenovo Miix 510 Pro 80U10006GE | |
| Acer Spin 7 SP714-51-M09D | |
| Acer Aspire Switch Alpha 12 SA5-271-56HM | |
| Huawei MateBook m5-6Y54 | |
| PCMark 8 Home Score Accelerated v2 | 2979 points | |
| PCMark 8 Work Score Accelerated v2 | 4076 points | |
Help | ||
| Acer Spin 7 SP714-51-M09D Kingston RBUSNS4180S3256GG | Asus Zenbook UX360UA-C4159T SK Hynix Canvas SC300 512GB M.2 (HFS512G39MND) | HP Spectre x360 13-w023dx Samsung PM951 NVMe MZVLV512 | Acer Aspire Switch Alpha 12 SA5-271-56HM Kingston RBU-SNS8152S3256GG2 | Lenovo ThinkPad X1 Yoga-20FRS1VS00 Samsung SSD PM961 1TB M.2 PCIe 3.0 x4 NVMe (MZSLW1T0) | Dell XPS 13 9360 QHD+ i5 Toshiba NVMe THNSN5256GPUK | |
|---|---|---|---|---|---|---|
| CrystalDiskMark 3.0 | -5% | 73% | -17% | 84% | 59% | |
| Read Seq | 472.6 | 452.1 -4% | 1376 191% | 518 10% | 1510 220% | 1168 147% |
| Write Seq | 407.7 | 421.3 3% | 571 40% | 199.9 -51% | 1193 193% | 329 -19% |
| Read 512 | 309.5 | 288.6 -7% | 679 119% | 374.9 21% | 1015 228% | |
| Write 512 | 368.5 | 310.7 -16% | 571 55% | 201 -45% | 307 -17% | |
| Read 4k | 37.57 | 28.52 -24% | 42.66 14% | 29.3 -22% | 37 -2% | 33 -12% |
| Write 4k | 75.5 | 72.1 -5% | 137.9 83% | 76.8 2% | 126 67% | 132 75% |
| Read 4k QD32 | 324.8 | 389.6 20% | 535 65% | 272 -16% | 404 24% | 525 62% |
| Write 4k QD32 | 307.4 | 285.3 -7% | 361.2 18% | 197.1 -36% | 319 4% | 325 6% |

| 3DMark 11 - 1280x720 Performance GPU | |
| HP Spectre x360 13-w023dx | |
| Asus Zenbook UX360UA-C4159T | |
| Lenovo ThinkPad X1 Yoga-20FRS1VS00 | |
| Acer Aspire Switch Alpha 12 SA5-271-56HM | |
| Lenovo Miix 510 Pro 80U10006GE | |
| HP Pavilion x2 12-b000ng | |
| Acer Spin 7 SP714-51-M09D | |
| Huawei MateBook m5-6Y54 | |
| 3DMark | |
| 1280x720 Cloud Gate Standard Graphics | |
| HP Spectre x360 13-w023dx | |
| Asus Zenbook UX360UA-C4159T | |
| Lenovo ThinkPad X1 Yoga-20FRS1VS00 | |
| Acer Aspire Switch Alpha 12 SA5-271-56HM | |
| Lenovo Miix 510 Pro 80U10006GE | |
| HP Pavilion x2 12-b000ng | |
| Huawei MateBook m5-6Y54 | |
| Acer Spin 7 SP714-51-M09D | |
| 1920x1080 Fire Strike Graphics | |
| HP Spectre x360 13-w023dx | |
| Lenovo ThinkPad X1 Yoga-20FRS1VS00 | |
| HP Pavilion x2 12-b000ng | |
| 3DMark 06 1280x768 Score | 6524 points | |
| 3DMark Vantage P Result | 4123 points | |
| 3DMark 11 Performance | 1141 points | |
| 3DMark Ice Storm Standard Score | 37865 points | |
| 3DMark Cloud Gate Standard Score | 4050 points | |
Help | ||
| low | med. | high | ultra | |
| Hitman: Absolution (2012) | 21.9 | 14 | 7.6 | |
| Crysis 3 (2013) | 21 | 12.7 | ||
| Tomb Raider (2013) | 51.8 | 23.6 | 16 | |
| BioShock Infinite (2013) | 32 | 19.3 | 16.1 | |
| Battlefield 4 (2013) | 22.3 | 16 | 11 | |
| Thief (2014) | 13.9 | 9.2 | ||
| Middle-earth: Shadow of Mordor (2014) | 23.5 | 13.7 | 6.8 | |
| Alien: Isolation (2014) | 26.3 | 19 | 9.7 | |
| Dragon Age: Inquisition (2014) | 17.6 | 12.2 | ||
| Battlefield Hardline (2015) | 19.7 | 15.5 | ||
| Dirt Rally (2015) | 71.6 | 16.26 | ||
| Metal Gear Solid V (2015) | 23.4 | 20.8 | 7.6 | |
| Call of Duty: Black Ops 3 (2015) | 8 severe graphical problems (no menue) | |||
| Fallout 4 (2015) | 10.1 | |||
| Star Wars Battlefront (2015) | 19.8 | 11.5 | ||
| Rise of the Tomb Raider (2016) | 11 | |||
| Doom (2016) | 12.9 | 10.1 | ||
| Deus Ex Mankind Divided (2016) | 9.1 | |||
| FIFA 17 (2016) | 36 small graphical problems (slow down in game) | 29 small graphical problems (slow down in game) | ||
| Battlefield 1 (2016) | 13 | 9.1 |
(-) The maximum temperature on the upper side is 46.5 °C / 116 F, compared to the average of 35.9 °C / 97 F, ranging from 21.4 to 59 °C for the class Subnotebook.
(±) The bottom heats up to a maximum of 45 °C / 113 F, compared to the average of 39.4 °C / 103 F
(+) In idle usage, the average temperature for the upper side is 25.2 °C / 77 F, compared to the device average of 30.7 °C / 87 F.
(+) The palmrests and touchpad are cooler than skin temperature with a maximum of 27.6 °C / 81.7 F and are therefore cool to the touch.
(±) The average temperature of the palmrest area of similar devices was 28.3 °C / 82.9 F (+0.7 °C / 1.2 F).
Acer Spin 7 SP714-51-M09D audio analysis
(-) | not very loud speakers (66 dB)
Bass 100 - 315 Hz
(±) | reduced bass - on average 13.9% lower than median
(±) | linearity of bass is average (14.1% delta to prev. frequency)
Mids 400 - 2000 Hz
(±) | higher mids - on average 5.4% higher than median
(±) | linearity of mids is average (8.5% delta to prev. frequency)
Highs 2 - 16 kHz
(+) | balanced highs - only 1% away from median
(+) | highs are linear (5.1% delta to prev. frequency)
Overall 100 - 16.000 Hz
(±) | linearity of overall sound is average (17.6% difference to median)
Compared to same class
» 43% of all tested devices in this class were better, 8% similar, 49% worse
» The best had a delta of 5%, average was 19%, worst was 53%
Compared to all devices tested
» 29% of all tested devices were better, 8% similar, 63% worse
» The best had a delta of 4%, average was 25%, worst was 134%
Asus Zenbook UX360UA-C4159T audio analysis
(-) | not very loud speakers (66 dB)
Bass 100 - 315 Hz
(±) | reduced bass - on average 14.1% lower than median
(±) | linearity of bass is average (14.2% delta to prev. frequency)
Mids 400 - 2000 Hz
(+) | balanced mids - only 3.3% away from median
(±) | linearity of mids is average (7.2% delta to prev. frequency)
Highs 2 - 16 kHz
(+) | balanced highs - only 2.9% away from median
(+) | highs are linear (3.8% delta to prev. frequency)
Overall 100 - 16.000 Hz
(±) | linearity of overall sound is average (17.4% difference to median)
Compared to same class
» 26% of all tested devices in this class were better, 9% similar, 65% worse
» The best had a delta of 6%, average was 21%, worst was 57%
Compared to all devices tested
» 28% of all tested devices were better, 8% similar, 64% worse
» The best had a delta of 4%, average was 25%, worst was 134%
HP Spectre x360 13-w023dx audio analysis
(±) | speaker loudness is average but good (76.2 dB)
Bass 100 - 315 Hz
(-) | nearly no bass - on average 17% lower than median
(±) | linearity of bass is average (12.7% delta to prev. frequency)
Mids 400 - 2000 Hz
(+) | balanced mids - only 3.7% away from median
(+) | mids are linear (6.3% delta to prev. frequency)
Highs 2 - 16 kHz
(+) | balanced highs - only 2.4% away from median
(±) | linearity of highs is average (7.2% delta to prev. frequency)
Overall 100 - 16.000 Hz
(±) | linearity of overall sound is average (21.9% difference to median)
Compared to same class
» 58% of all tested devices in this class were better, 8% similar, 34% worse
» The best had a delta of 6%, average was 21%, worst was 57%
Compared to all devices tested
» 58% of all tested devices were better, 7% similar, 35% worse
» The best had a delta of 4%, average was 25%, worst was 134%
| Off / Standby | |
| Idle | |
| Load |
|
| Acer Spin 7 SP714-51-M09D i5-7Y54, HD Graphics 615, Kingston RBUSNS4180S3256GG, IPS, 1920x1080, 14.00 | Asus Zenbook UX360UA-C4159T 6500U, HD Graphics 520, SK Hynix Canvas SC300 512GB M.2 (HFS512G39MND), IPS, 1920x1080, 13.30 | HP Spectre x360 13-w023dx i7-7500U, HD Graphics 620, Samsung PM951 NVMe MZVLV512, IPS, 1920x1080, 13.30 | Lenovo ThinkPad X1 Yoga-20FRS1VS00 6600U, HD Graphics 520, Samsung SSD PM961 1TB M.2 PCIe 3.0 x4 NVMe (MZSLW1T0), OLED, 2560x1440, 14.00 | Acer Aspire Switch Alpha 12 SA5-271-56HM 6200U, HD Graphics 520, Kingston RBU-SNS8152S3256GG2, IPS, 2160x1440, 12.00 | Lenovo Miix 510 Pro 80U10006GE 6200U, HD Graphics 520, Samsung PM951 NVMe MZVLV256, IPS, 1920x1200, 12.20 | |
|---|---|---|---|---|---|---|
| Power Consumption | -29% | -24% | -49% | -36% | -33% | |
| Idle Minimum * | 4.3 | 6.9 -60% | 5.5 -28% | 4.7 -9% | 7.3 -70% | 4.2 2% |
| Idle Average * | 7.4 | 7.9 -7% | 6.7 9% | 8.6 -16% | 10 -35% | 11.5 -55% |
| Idle Maximum * | 8 | 8.3 -4% | 7.1 11% | 12.2 -53% | 10.15 -27% | 11.7 -46% |
| Load Average * | 22.1 | 30.1 -36% | 33.1 -50% | 29.7 -34% | 25.2 -14% | 31 -40% |
| Load Maximum * | 21.7 | 29.6 -36% | 35.2 -62% | 50.5 -133% | 29.3 -35% | 27.4 -26% |
* ... smaller is better
| Acer Spin 7 SP714-51-M09D i5-7Y54, HD Graphics 615, 42 Wh | Asus Zenbook UX360UA-C4159T 6500U, HD Graphics 520, 57 Wh | HP Spectre x360 13-w023dx i7-7500U, HD Graphics 620, 57.8 Wh | Lenovo ThinkPad X1 Yoga-20FRS1VS00 6600U, HD Graphics 520, 56 Wh | Acer Aspire Switch Alpha 12 SA5-271-56HM 6200U, HD Graphics 520, 37 Wh | Lenovo Miix 510 Pro 80U10006GE 6200U, HD Graphics 520, 50 Wh | |
|---|---|---|---|---|---|---|
| Battery Runtime | 36% | 27% | -9% | -21% | -19% | |
| Reader / Idle | 748 | 1165 56% | 1233 65% | 824 10% | 640 -14% | 696 -7% |
| WiFi v1.3 | 391 | 581 49% | 558 43% | 315 -19% | 321 -18% | 322 -18% |
| Load | 163 | 169 4% | 121 -26% | 132 -19% | 112 -31% | 111 -32% |
| H.264 | 520 | 468 |
Pros
Cons

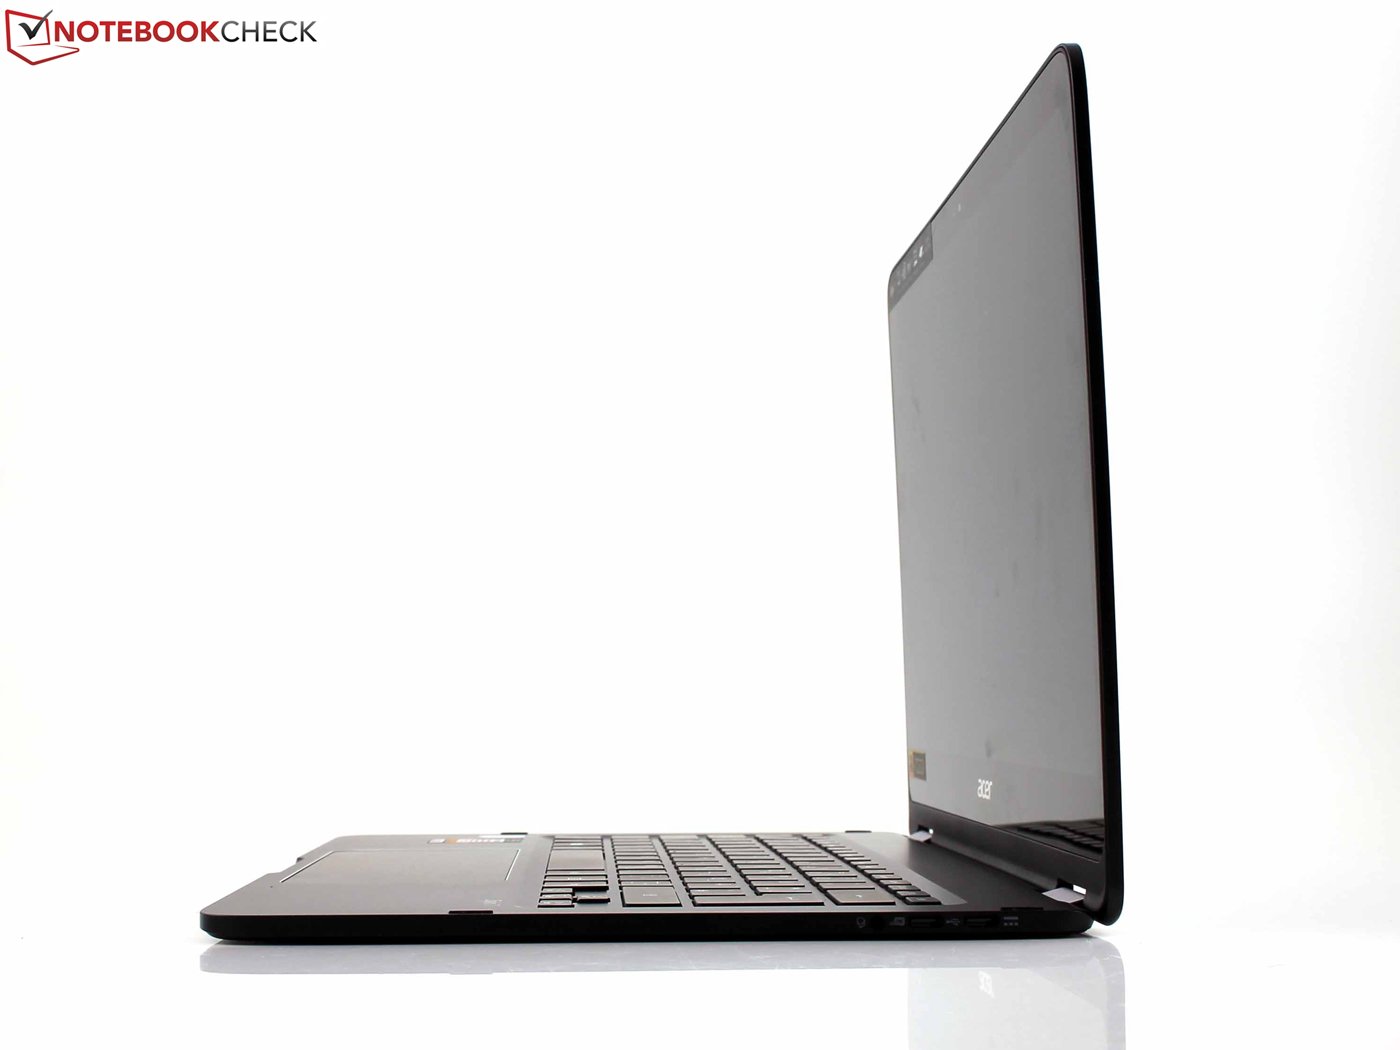
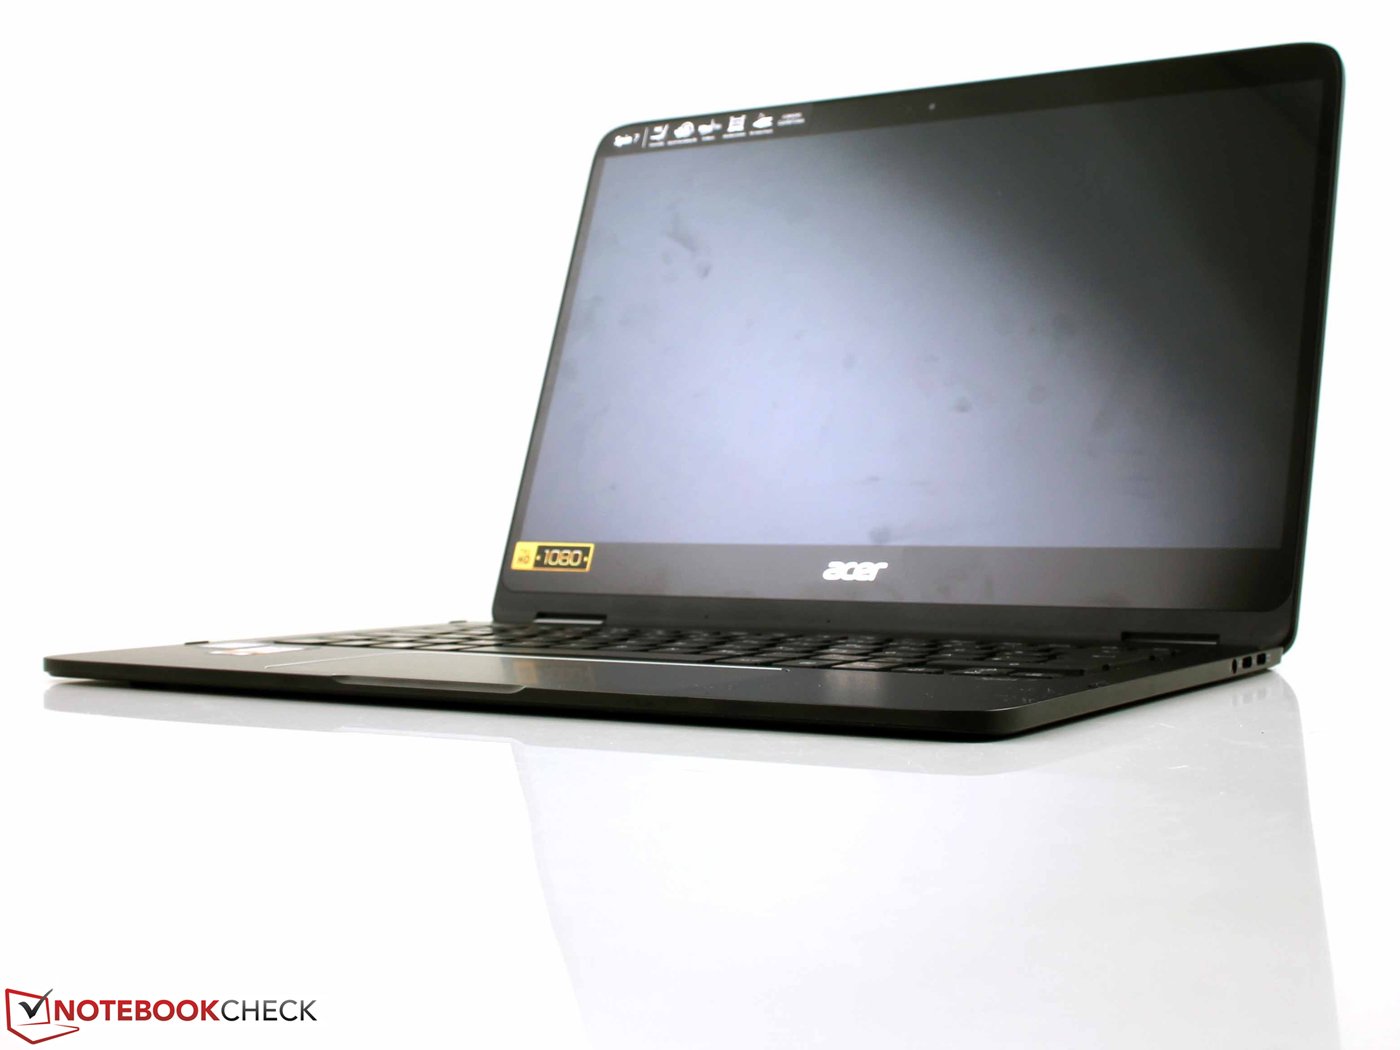
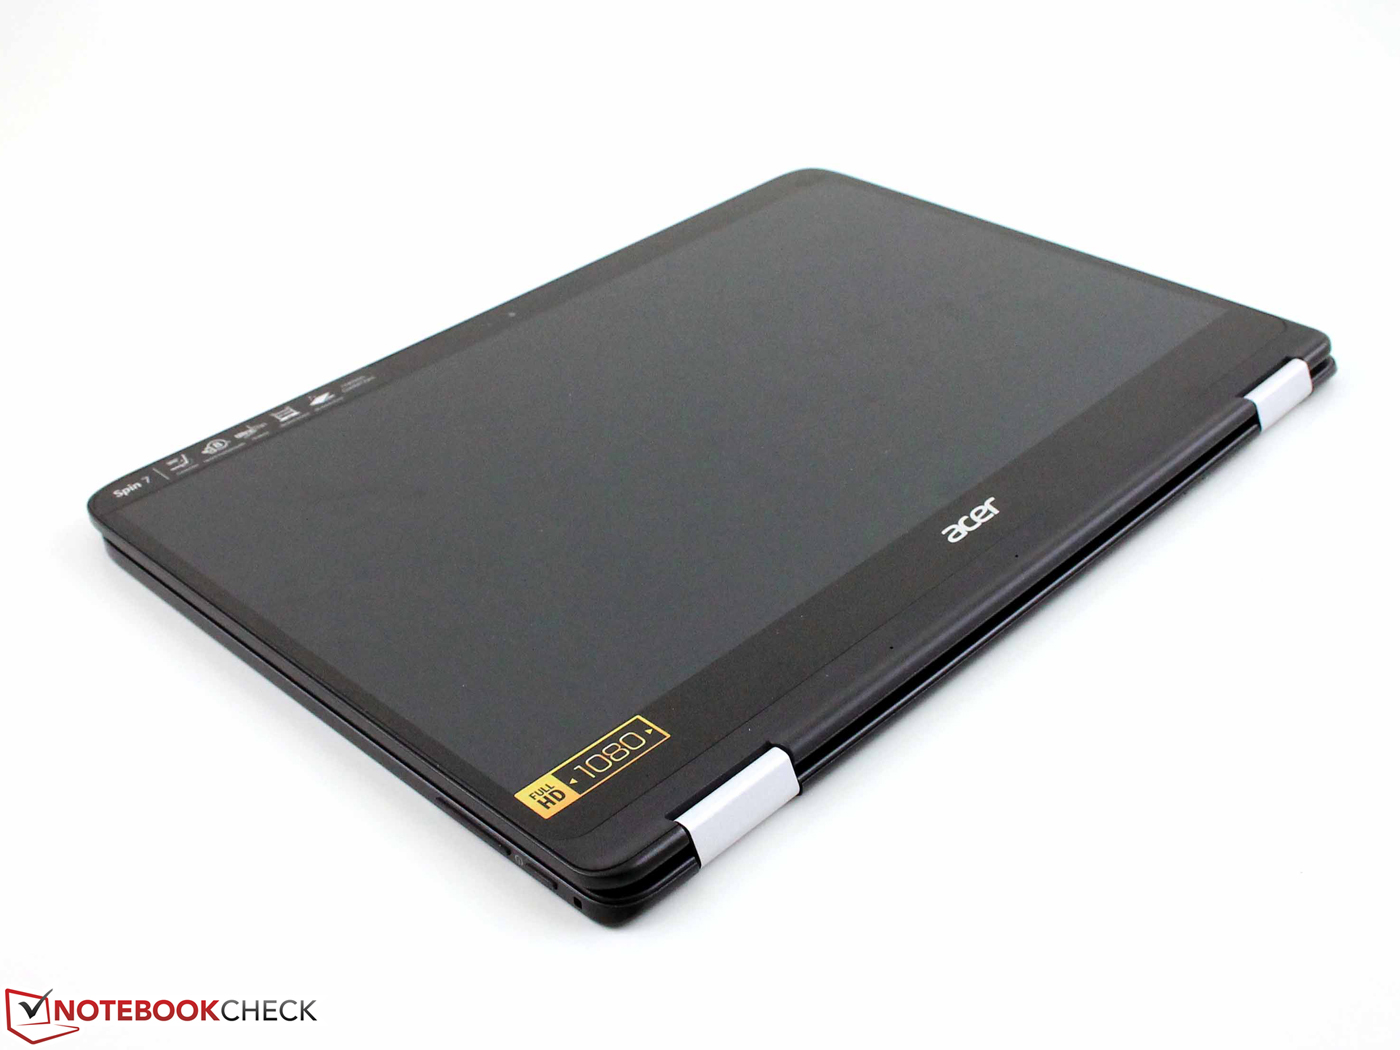
整体上,它是一台很有野心的机器,但在细节的处理上却不尽人意。宏碁 Spin 7 (不带有 "Aspire") 是全新的超薄360度变形本系列。我们所评测的14寸型号 SP714-51-M09D 有一些缺点,来自于它所配备的 Kaby Lake Y 系列 CPU(4.5W TDP),在应用性能上,其上一代 Skylake 处理器有时甚至会有更好的表现。我们对它紧凑而轻便的机身赞许有加,但出色的外观无法掩盖它过薄的底面以及整体外壳稳定性缺失所带来的影响。
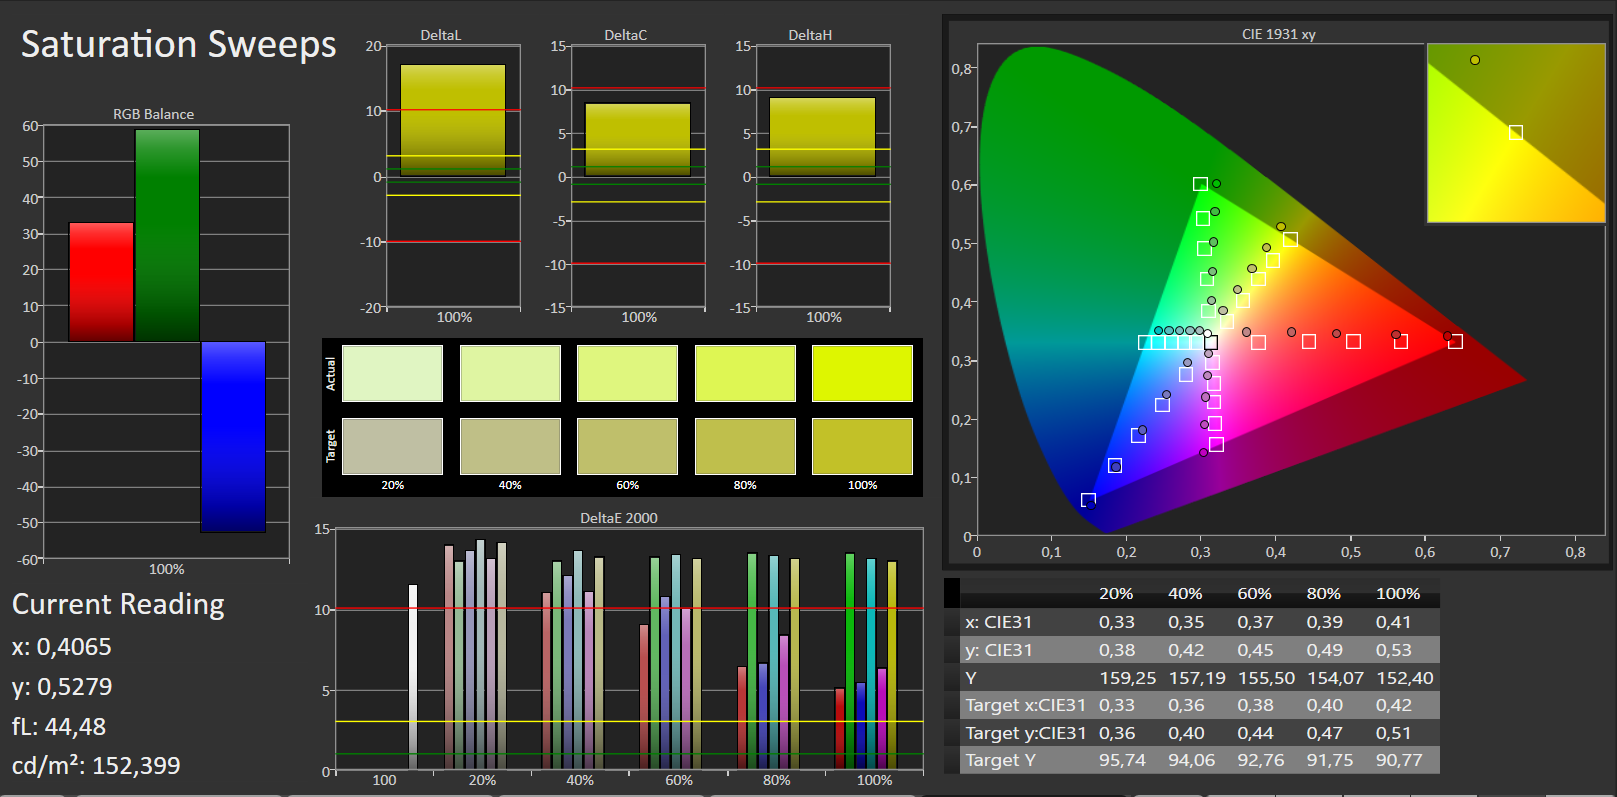
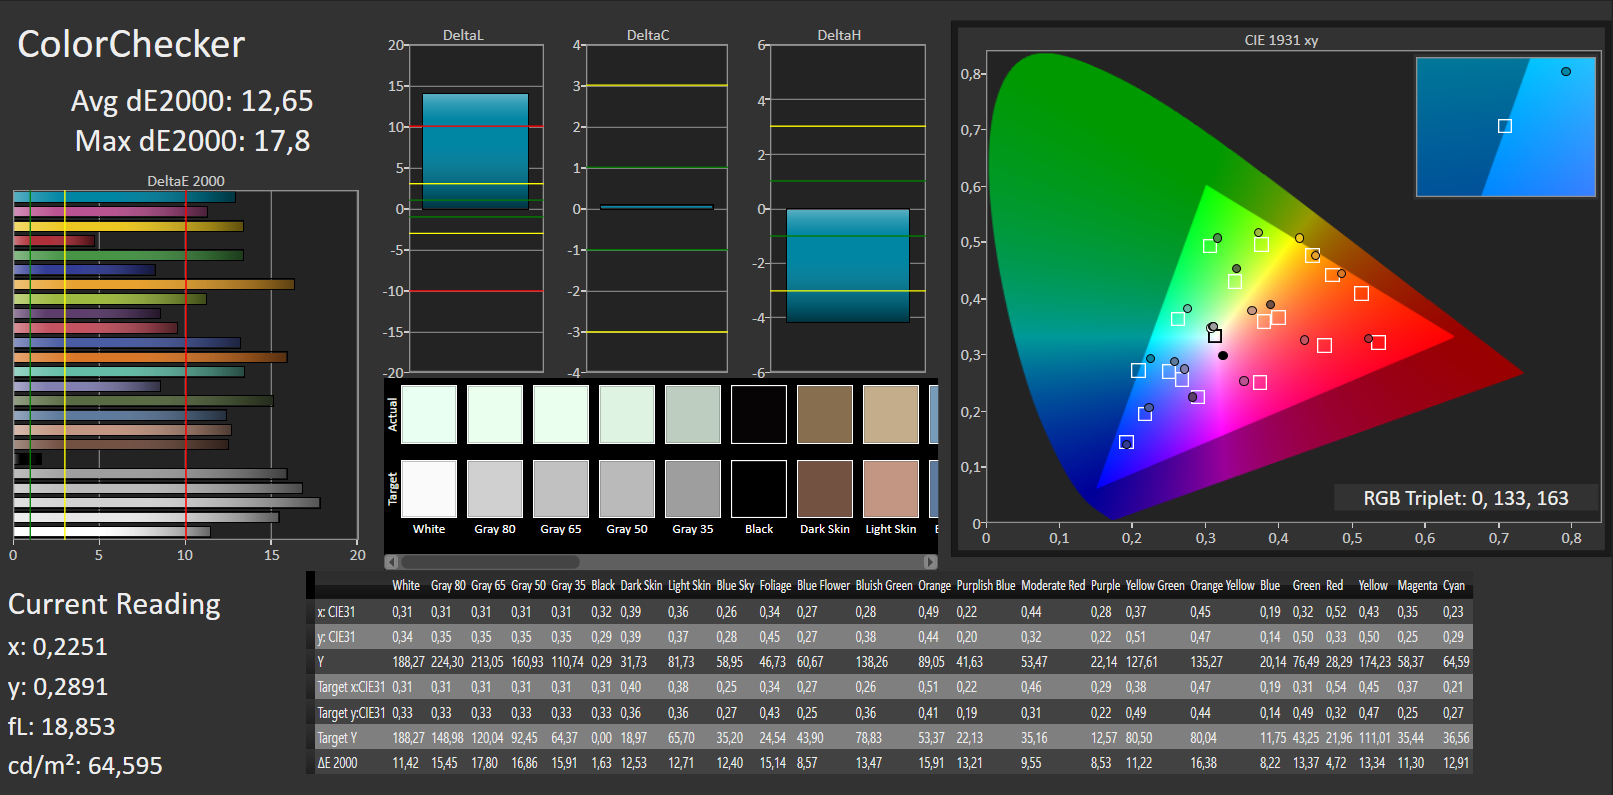
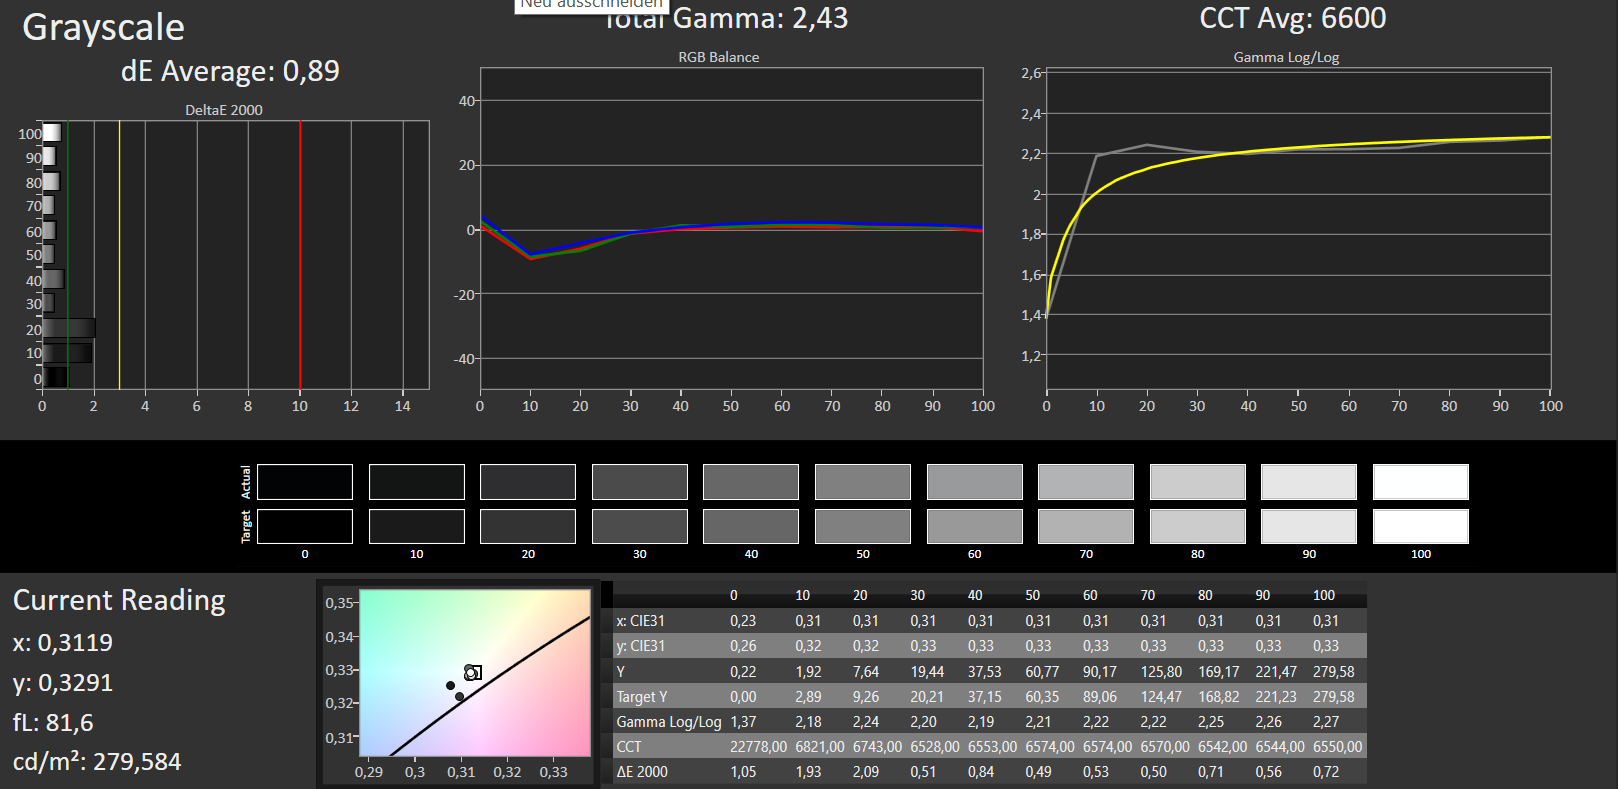
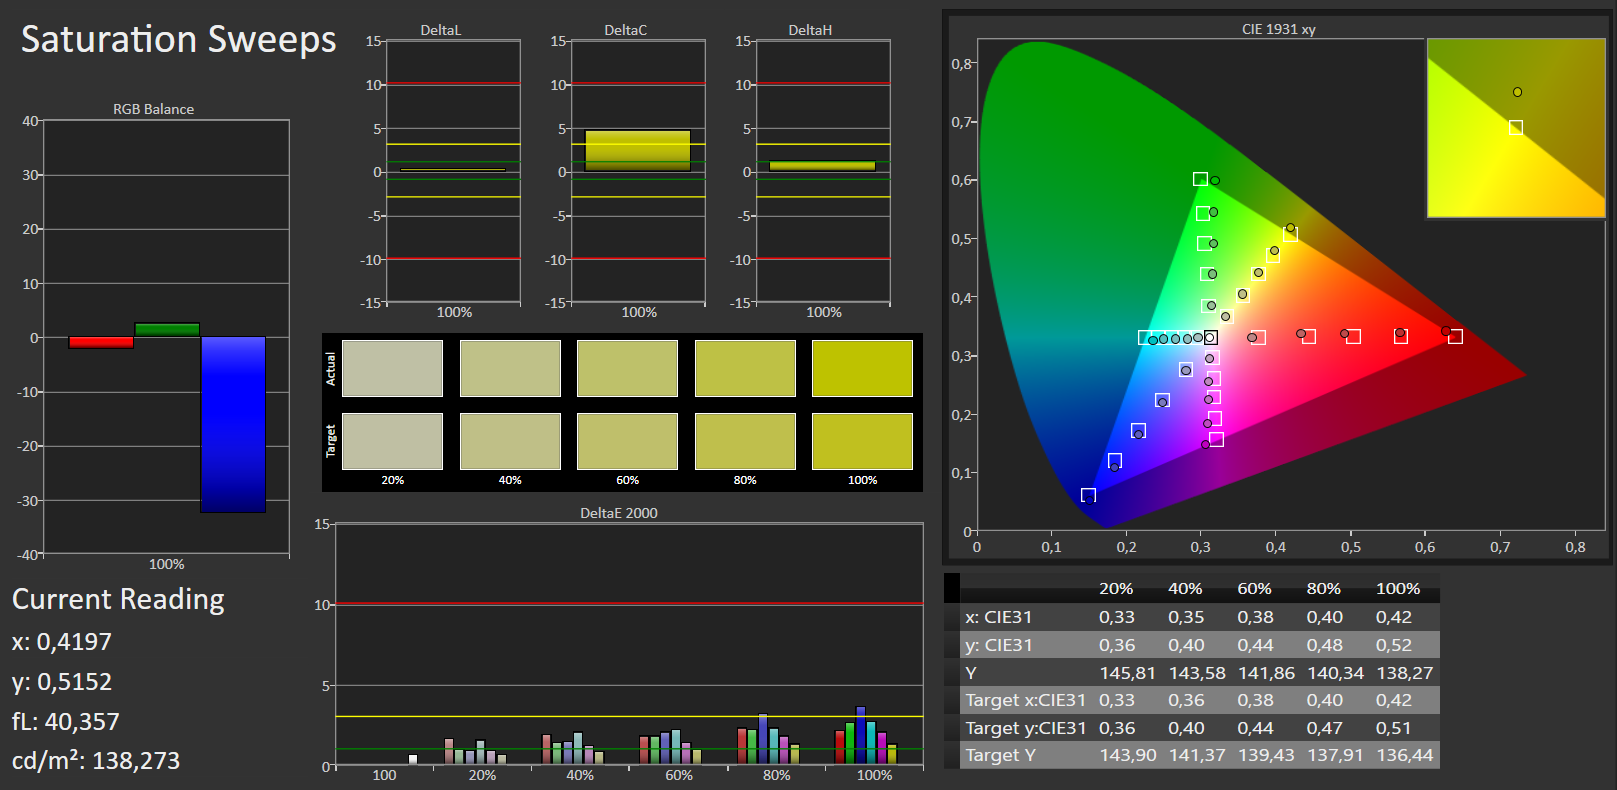
纤薄的机壳看起来很不错,但却缺失了一些稳定性。事实上,它的屏幕在经过校色之后是十分出色的,但在出厂状态却有较大的色差。
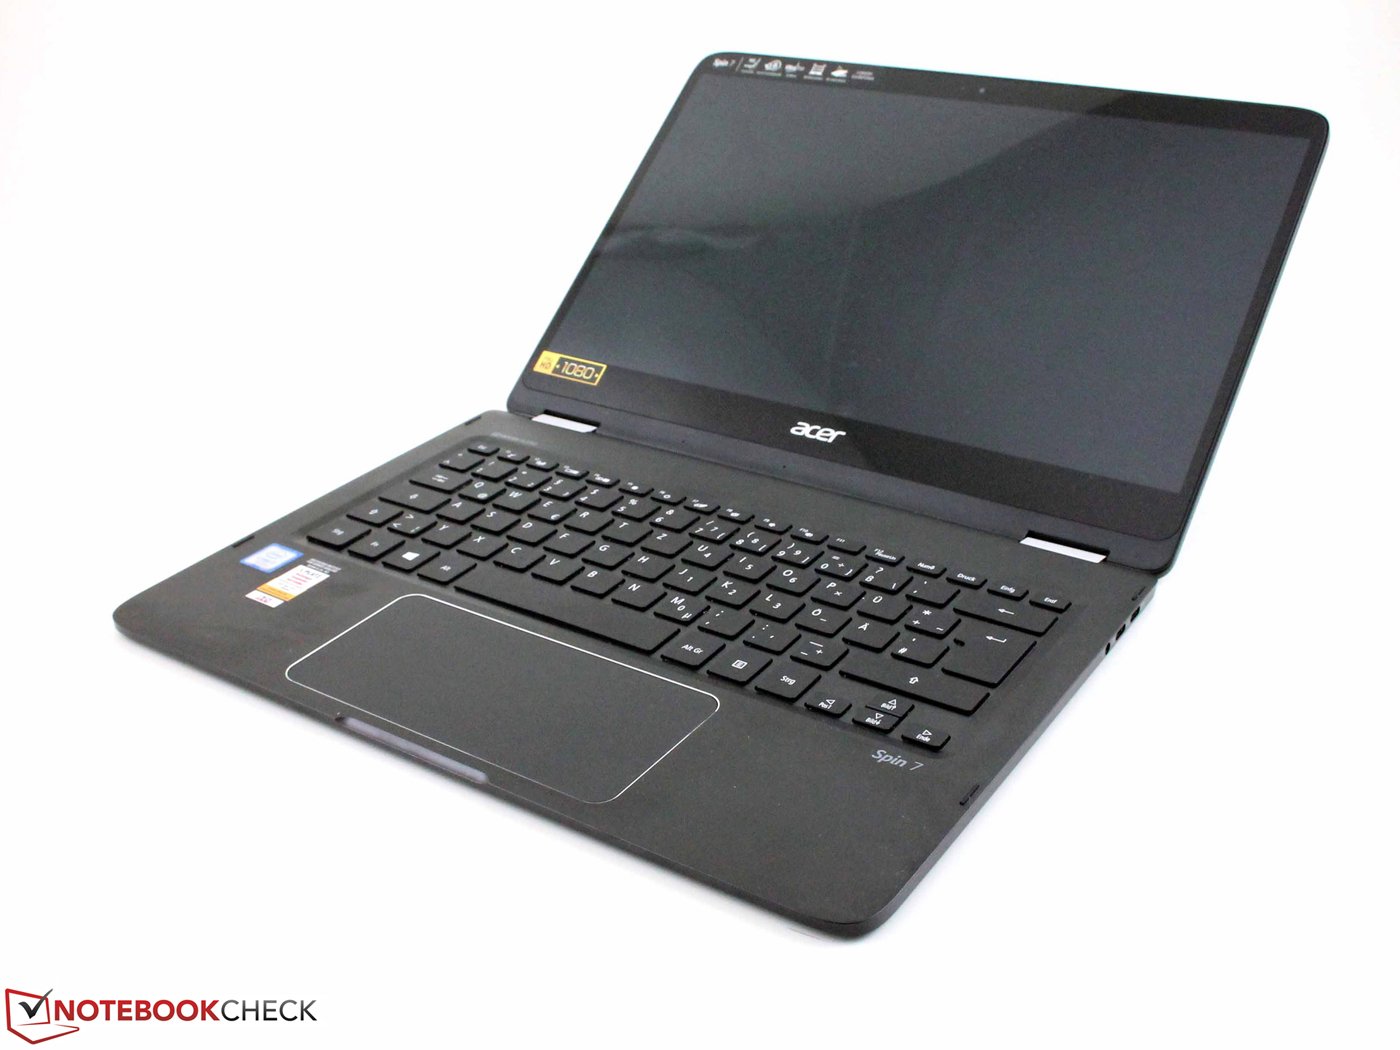
它优秀而较大的触摸板具有出色的反馈,但键盘不仅键程较短,且反馈有限。它的屏幕不仅有着高亮度而且还有有出色的对比度。但它的色彩准确度在经过处理前却不尽人意。的确色彩校准是可以解决这个问题,但多少消费者家里会有校色仪?你可以通过使用下面链接中的色彩文件来改善这个情况,尽管这样做比不上手动校色的效果。
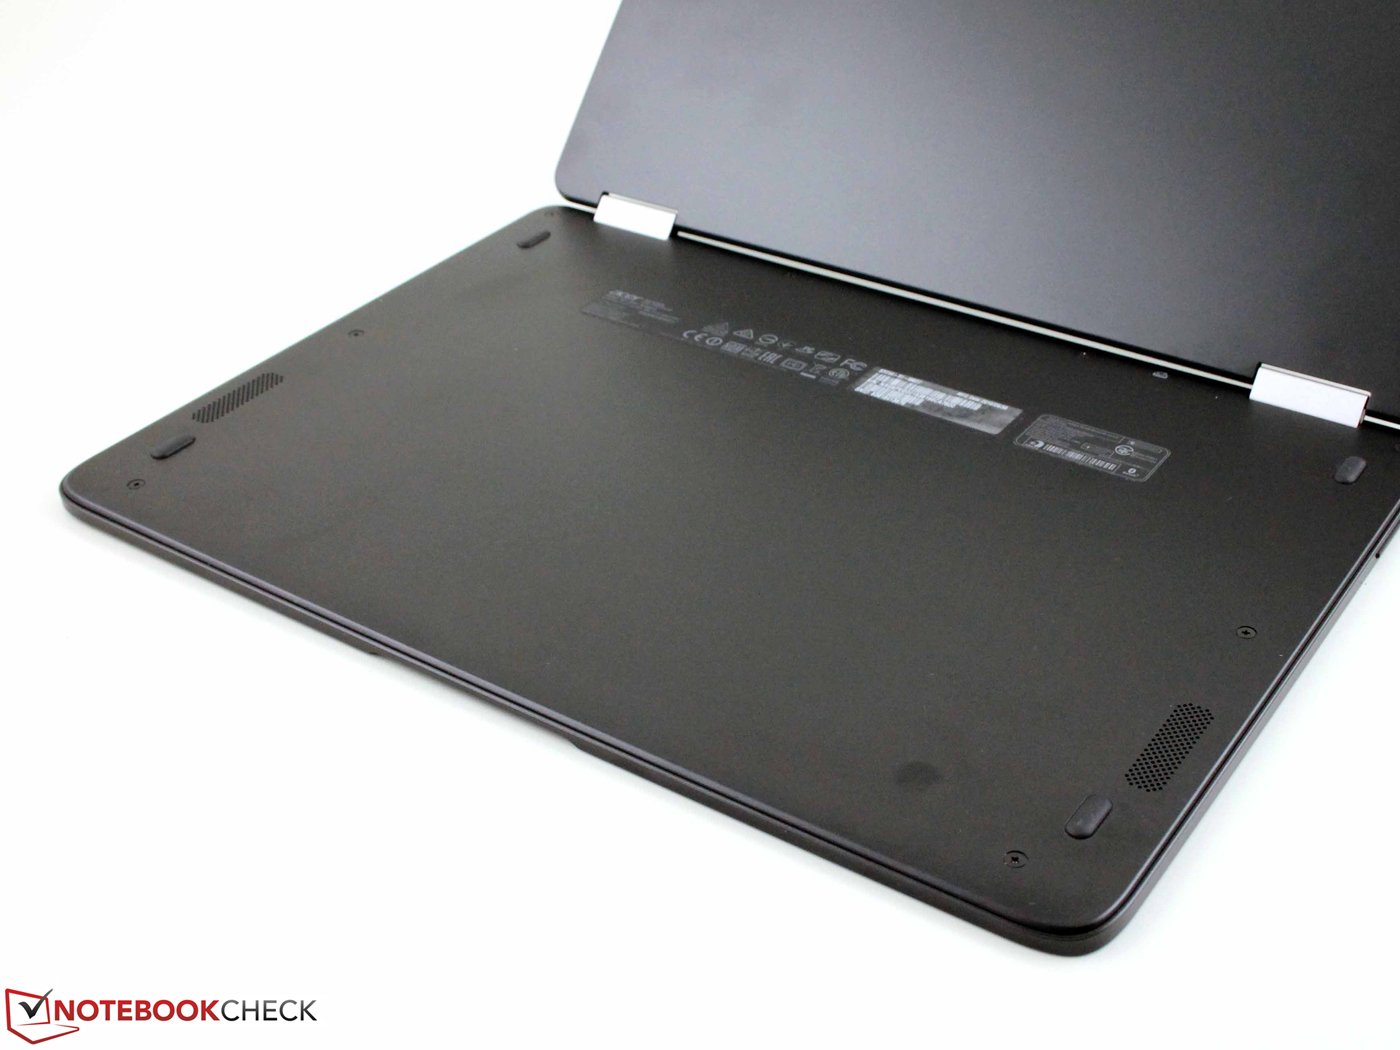
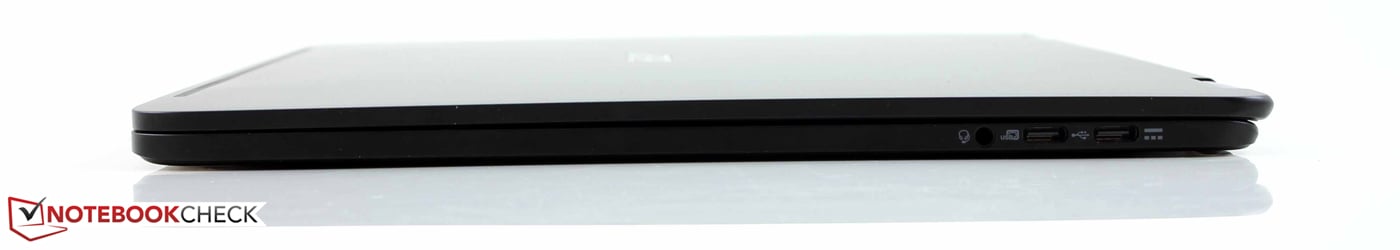
通过移除巨大的底壳就可以轻松地进行的维护操作,这一点是堪称模范的。剩下的只有糟糕的摄像头和音量较小的扬声器。
Kaby Lake ULV 处理器无法令我们完全满意;这款 Soc 经常出现在排名表的最底部,甚至不如上一代的Core m5处理器。
这台14英寸 SP714-51-M09D 变形本现在的售价高达1200欧元(约合1336美金)。它的竞争对手 ZenBook UX360UA-C4159T,带有512GB固态硬盘和性能更高的 i7-6500u 售价为1130欧元(约合1258美金),而且它有着更长的续航时间,更高的出场色彩准确度(当使用来自华硕的出场色彩文件时)。如果华硕能够解决转轴摇晃这个问题,那么华硕UX360UA 显然将会是更好的推荐项。
那么 惠普 Spectre x360 13 是不是更好的选择呢?带有 Kaby Lake 处理器的型号并不是在每个地方能购买到,但它的上一代起价已经高达1000欧元(约合1114美金)。这款型号带有更快的6200u处理器,256G固态硬盘和更好的键盘,而且续航时间能够与 Spin 7 相媲美。相比之下,除了维护性和无风扇外,宏碁 Spin 7 并没有很多的优势。它现在只是太贵了,合理价位应为1000欧元(约合1114美金)附近。
注:本文是基于完整评测的缩减版本,阅读完整的英文评测,请点击这里。
Acer Spin 7 SP714-51-M09D
-
10/24/2016 v5.1(old)
Sebastian Jentsch
Pricecompare
