 Deutsch
 English
 Español
 Français
 Italiano
 Nederlands
 Polski
 Português
 Русский
 Türkçe
 Svenska
 Chinese
 Magyar
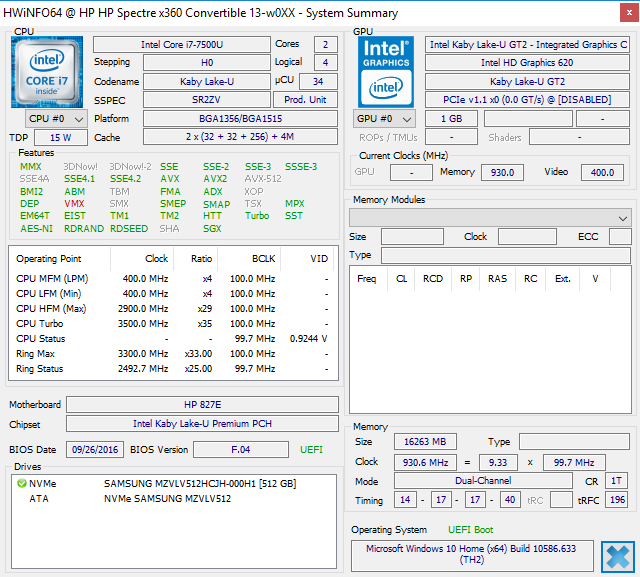
惠普 Spectre x360 13 w023dx 变形本简短评测
| Networking | |
| iperf Server (receive) TCP 1 m 512KB | |
| MSI GT72VR 6RD-063US | |
| HP Spectre x360 13-w023dx | |
| HP 250 G5 Y1V08UT | |
| iperf Client (transmit) TCP 1 m 512KB | |
| MSI GT72VR 6RD-063US | |
| HP Spectre x360 13-w023dx | |
| HP 250 G5 Y1V08UT | |
| |||||||||||||||||||||||||
Brightness Distribution: 90 %
Center on Battery: 334.6 cd/m²
Contrast: 996:1 (Black: 0.336 cd/m²)
ΔE Color 6.21 | 0.5-29.43 Ø5
ΔE Greyscale 7.71 | 0.57-98 Ø5.3
90% sRGB (Argyll 1.6.3 3D)
58.6% AdobeRGB 1998 (Argyll 1.6.3 3D)
65.8% AdobeRGB 1998 (Argyll 2.2.0 3D)
90.4% sRGB (Argyll 2.2.0 3D)
65.4% Display P3 (Argyll 2.2.0 3D)
Gamma: 2.36
| HP Spectre x360 13-w023dx Chi Mei CMN1367, IPS, 13.30, 1920x1080 | Dell XPS 13 9360 QHD+ i5 Sharp SHP144A, , 13.30, 3200x1800 | HP Spectre 13 IPS UWVA, 13.30, 1920x1080 | Lenovo Yoga 900-13ISK 80MK IPS, 13.30, 3200x1800 | Asus Zenbook UX360UA-C4159T AU Optronics AOU272D / B133HAN02.7, IPS, 13.30, 1920x1080 | Acer Aspire S 13 S5-371-71QZ AUO B133HAN04.1, IPS, 13.30, 1920x1080 | |
|---|---|---|---|---|---|---|
| Display | 0% | 3% | -2% | 1% | ||
| Display P3 Coverage | 65.4 | 64.6 -1% | 65.6 0% | 63.2 -3% | 64.8 -1% | |
| sRGB Coverage | 90.4 | 91.6 1% | 94.7 5% | 88.7 -2% | 93.1 3% | |
| AdobeRGB 1998 Coverage | 65.8 | 66.5 1% | 67.5 3% | 64.9 -1% | 66 0% | |
| Response Times | -2% | -36% | 2% | 23% | -29% | |
| Response Time Grey 50% / Grey 80% * | 33.2 ? | 31 ? 7% | 50.8 ? -53% | 38.8 ? -17% | 29 ? 13% | 50 ? -51% |
| Response Time Black / White * | 28 ? | 31.2 ? -11% | 33.2 ? -19% | 22.4 ? 20% | 19 ? 32% | 29.6 ? -6% |
| PWM Frequency | 1316 | 50 ? | ||||
| Screen | 22% | 27% | -11% | 10% | 10% | |
| Brightness middle | 334.6 | 444 33% | 300.5 -10% | 319.8 -4% | 344 3% | 375 12% |
| Brightness | 319 | 393 23% | 305 -4% | 302 -5% | 326 2% | 358 12% |
| Brightness Distribution | 90 | 82 -9% | 76 -16% | 88 -2% | 86 -4% | 87 -3% |
| Black Level * | 0.336 | 0.33 2% | 0.184 45% | 0.835 -149% | 0.27 20% | 0.39 -16% |
| Contrast | 996 | 1345 35% | 1633 64% | 383 -62% | 1274 28% | 962 -3% |
| Colorchecker dE 2000 * | 6.21 | 4 36% | 2.64 57% | 2.68 57% | 5.53 11% | 4.6 26% |
| Colorchecker dE 2000 max. * | 12 | 7.7 36% | 5.06 58% | 10.01 17% | 8.8 27% | |
| Greyscale dE 2000 * | 7.71 | 2.83 63% | 2.8 64% | 2.35 70% | 6.67 13% | 4 48% |
| Gamma | 2.36 93% | 2.05 107% | 2.16 102% | 2.09 105% | 2.43 91% | 2.34 94% |
| CCT | 6458 101% | 6963 93% | 6999 93% | 6975 93% | 7012 93% | 7304 89% |
| Color Space (Percent of AdobeRGB 1998) | 58.6 | 59.3 1% | 60.9 4% | 57 -3% | 60 2% | 57.9 -1% |
| Color Space (Percent of sRGB) | 90 | 91.4 2% | 94.3 5% | 88 -2% | 93 3% | 88.7 -1% |
| Total Average (Program / Settings) | 7% /
15% | -2% /
14% | -4% /
-7% | 11% /
9% | -10% /
4% |
* ... smaller is better
Display Response Times
| ↔ Response Time Black to White | ||
|---|---|---|
| 28 ms ... rise ↗ and fall ↘ combined | ↗ 5.6 ms rise | 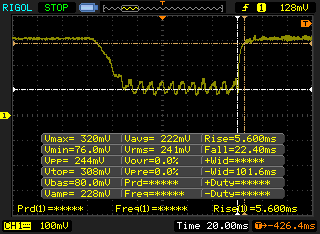 |
| ↘ 22.4 ms fall | ||
| The screen shows relatively slow response rates in our tests and may be too slow for gamers. In comparison, all tested devices range from 0.1 (minimum) to 240 (maximum) ms. » 67 % of all devices are better. This means that the measured response time is worse than the average of all tested devices (21.5 ms). | ||
| ↔ Response Time 50% Grey to 80% Grey | ||
| 33.2 ms ... rise ↗ and fall ↘ combined | ↗ 16 ms rise | 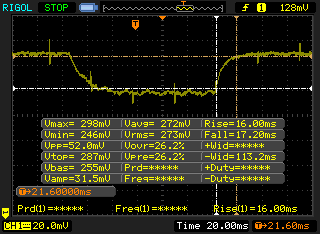 |
| ↘ 17.2 ms fall | ||
| The screen shows slow response rates in our tests and will be unsatisfactory for gamers. In comparison, all tested devices range from 0.2 (minimum) to 636 (maximum) ms. » 39 % of all devices are better. This means that the measured response time is similar to the average of all tested devices (33.7 ms). | ||
Screen Flickering / PWM (Pulse-Width Modulation)
| Screen flickering / PWM not detected | 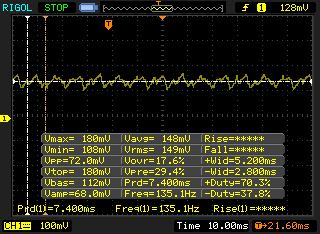 | ||
In comparison: 53 % of all tested devices do not use PWM to dim the display. If PWM was detected, an average of 17915 (minimum: 5 - maximum: 3846000) Hz was measured. | |||

| Cinebench R15 | |
| CPU Single 64Bit | |
| Toshiba Satellite S70-B-106 | |
| Toshiba Portege Z30t-B1320W10 | |
| Asus Zenbook UX510UW-CN044T | |
| Lenovo ThinkPad T440s 20AQ006BGE | |
| HP Spectre x360 13-w023dx | |
| Lenovo Ideapad 510-15ISK | |
| HP 250 G4 T6P08ES | |
| Lenovo IdeaPad Z40-59422614 | |
| CPU Multi 64Bit | |
| Toshiba Satellite S70-B-106 | |
| Asus Zenbook UX510UW-CN044T | |
| HP Spectre x360 13-w023dx | |
| Toshiba Portege Z30t-B1320W10 | |
| Lenovo Ideapad 510-15ISK | |
| Lenovo ThinkPad T440s 20AQ006BGE | |
| HP 250 G4 T6P08ES | |
| Lenovo IdeaPad Z40-59422614 | |
| Cinebench R11.5 | |
| CPU Single 64Bit | |
| HP Spectre x360 13-w023dx | |
| Toshiba Portege Z30t-B1320W10 | |
| Toshiba Satellite S70-B-106 | |
| Asus Zenbook UX510UW-CN044T | |
| Lenovo ThinkPad T440s 20AQ006BGE | |
| HP 250 G4 T6P08ES | |
| Lenovo IdeaPad Z40-59422614 | |
| CPU Multi 64Bit | |
| Toshiba Satellite S70-B-106 | |
| Asus Zenbook UX510UW-CN044T | |
| HP Spectre x360 13-w023dx | |
| Toshiba Portege Z30t-B1320W10 | |
| Lenovo ThinkPad T440s 20AQ006BGE | |
| HP 250 G4 T6P08ES | |
| Lenovo IdeaPad Z40-59422614 | |
| Cinebench R10 | |
| Rendering Multiple CPUs 32Bit | |
| HP Spectre x360 13-w023dx | |
| Asus Zenbook UX510UW-CN044T | |
| Toshiba Portege Z30t-B1320W10 | |
| Lenovo ThinkPad T440s 20AQ006BGE | |
| HP 250 G4 T6P08ES | |
| Lenovo IdeaPad Z40-59422614 | |
| Rendering Single 32Bit | |
| HP Spectre x360 13-w023dx | |
| Toshiba Portege Z30t-B1320W10 | |
| Asus Zenbook UX510UW-CN044T | |
| Lenovo ThinkPad T440s 20AQ006BGE | |
| HP 250 G4 T6P08ES | |
| Lenovo IdeaPad Z40-59422614 | |
| wPrime 2.10 - 1024m | |
| Lenovo IdeaPad Z40-59422614 | |
| HP Spectre x360 13-w023dx | |
| Toshiba Portege Z30t-B1320W10 | |
| Super Pi Mod 1.5 XS 32M - 32M | |
| Lenovo IdeaPad Z40-59422614 | |
| Toshiba Portege Z30t-B1320W10 | |
| HP Spectre x360 13-w023dx | |
* ... smaller is better
| PCMark 8 | |
| Home Score Accelerated v2 | |
| HP Spectre x360 13-w023dx | |
| HP Spectre 13 | |
| Asus Zenbook UX360UA-C4159T | |
| Lenovo Yoga 900-13ISK 80MK | |
| Dell XPS 13 9360 QHD+ i5 | |
| Work Score Accelerated v2 | |
| HP Spectre x360 13-w023dx | |
| HP Spectre 13 | |
| Asus Zenbook UX360UA-C4159T | |
| Lenovo Yoga 900-13ISK 80MK | |
| Creative Score Accelerated v2 | |
| HP Spectre x360 13-w023dx | |
| HP Spectre 13 | |
| Lenovo Yoga 900-13ISK 80MK | |
| PCMark 8 Home Score Accelerated v2 | 3795 points | |
| PCMark 8 Creative Score Accelerated v2 | 4699 points | |
| PCMark 8 Work Score Accelerated v2 | 4910 points | |
Help | ||
| HP Spectre x360 13-w023dx Samsung PM951 NVMe MZVLV512 | Dell XPS 13 9360 QHD+ i5 Toshiba NVMe THNSN5256GPUK | Lenovo Yoga 900-13ISK 80MK Samsung SSD PM871 MZNLN512HCJH | Asus Zenbook UX360UA-C4159T SK Hynix Canvas SC300 512GB M.2 (HFS512G39MND) | Acer Aspire S 13 S5-371-71QZ LiteOn CV1-8B512 | |
|---|---|---|---|---|---|
| CrystalDiskMark 3.0 | -12% | -38% | -41% | -41% | |
| Read Seq | 1376 | 1168 -15% | 514 -63% | 452.1 -67% | 502 -64% |
| Write Seq | 571 | 329 -42% | 459.5 -20% | 421.3 -26% | 418.9 -27% |
| Read 512 | 679 | 1015 49% | 413.4 -39% | 288.6 -57% | 341.3 -50% |
| Write 512 | 571 | 307 -46% | 424.5 -26% | 310.7 -46% | 389.7 -32% |
| Read 4k | 42.66 | 33 -23% | 36.34 -15% | 28.52 -33% | 29.69 -30% |
| Write 4k | 137.9 | 132 -4% | 100.1 -27% | 72.1 -48% | 86.8 -37% |
| Read 4k QD32 | 535 | 525 -2% | 313.8 -41% | 389.6 -27% | 301.3 -44% |
| Write 4k QD32 | 361.2 | 325 -10% | 96.8 -73% | 285.3 -21% | 211.2 -42% |

| 3DMark | |
| 1280x720 Cloud Gate Standard Graphics | |
| Acer Aspire E5-574-53YZ | |
| HP Spectre x360 13-w023dx | |
| Acer TravelMate P257-M-56AX | |
| HP ProBook 640 G2-T9X60ET | |
| HP EliteBook 840 G3 T8X41EA | |
| Toshiba Portege Z30t-B1320W10 | |
| Sony Vaio SVF14N13CXB | |
| 1920x1080 Fire Strike Graphics | |
| Acer Aspire E5-574-53YZ | |
| HP Spectre x360 13-w023dx | |
| HP ProBook 640 G2-T9X60ET | |
| HP EliteBook 840 G3 T8X41EA | |
| Toshiba Portege Z30t-B1320W10 | |
| Sony Vaio SVF14N13CXB | |
| 3DMark 11 | |
| 1280x720 Performance GPU | |
| Acer Aspire E5-574-53YZ | |
| HP Spectre x360 13-w023dx | |
| HP ProBook 640 G2-T9X60ET | |
| HP EliteBook 840 G3 T8X41EA | |
| Acer TravelMate P257-M-56AX | |
| Toshiba Portege Z30t-B1320W10 | |
| Sony Vaio SVF14N13CXB | |
| 1280x720 Performance Combined | |
| Acer Aspire E5-574-53YZ | |
| HP Spectre x360 13-w023dx | |
| Acer TravelMate P257-M-56AX | |
| HP EliteBook 840 G3 T8X41EA | |
| HP ProBook 640 G2-T9X60ET | |
| Toshiba Portege Z30t-B1320W10 | |
| Sony Vaio SVF14N13CXB | |
| 3DMark 11 Performance | 1715 points | |
| 3DMark Ice Storm Standard Score | 61863 points | |
| 3DMark Cloud Gate Standard Score | 6111 points | |
| 3DMark Fire Strike Score | 889 points | |
| 3DMark Fire Strike Extreme Score | 395 points | |
Help | ||
| BioShock Infinite | |
| 1280x720 Very Low Preset | |
| Acer TravelMate P278-MG-76L2 | |
| Acer Aspire E5-574-53YZ | |
| HP Spectre x360 13-w023dx | |
| Lenovo ThinkPad Yoga 12 20DK002EPB | |
| HP ProBook 650 G2 V1A44ET | |
| Samsung ATIV Book 9 2014 (NP930X5J-K02DE) | |
| Fujitsu Lifebook T904 | |
| 1366x768 Medium Preset | |
| Acer TravelMate P278-MG-76L2 | |
| Acer Aspire E5-574-53YZ | |
| HP Spectre x360 13-w023dx | |
| Lenovo ThinkPad Yoga 12 20DK002EPB | |
| HP ProBook 650 G2 V1A44ET | |
| Samsung ATIV Book 9 2014 (NP930X5J-K02DE) | |
| Fujitsu Lifebook T904 | |
| 1366x768 High Preset | |
| Acer TravelMate P278-MG-76L2 | |
| Acer Aspire E5-574-53YZ | |
| HP Spectre x360 13-w023dx | |
| Lenovo ThinkPad Yoga 12 20DK002EPB | |
| HP ProBook 650 G2 V1A44ET | |
| low | med. | high | ultra | |
| BioShock Infinite (2013) | 53.5 | 30.6 | 26.1 | 8.3 |
| Metro: Last Light (2013) | 27.9 | 23.6 | 15 | 7.2 |
| Rise of the Tomb Raider (2016) | 20.8 | 12.6 | ||
| Overwatch (2016) | 48 | 34.1 | 19.9 |
Noise Level
| Idle |
| 29.1 / 29.1 / 31.2 dB(A) |
| Load |
| 37.3 / 39.6 dB(A) |
 | ||
30 dB silent 40 dB(A) audible 50 dB(A) loud |
||
min: | ||
| HP Spectre x360 13-w023dx HD Graphics 620, i7-7500U, Samsung PM951 NVMe MZVLV512 | Dell XPS 13 9360 QHD+ i5 HD Graphics 620, i5-7200U, Toshiba NVMe THNSN5256GPUK | HP Spectre 13 HD Graphics 520, 6500U, Samsung PM951 NVMe MZVLV256 | Lenovo Yoga 900-13ISK 80MK HD Graphics 520, 6500U, Samsung SSD PM871 MZNLN512HCJH | Asus Zenbook UX360UA-C4159T HD Graphics 520, 6500U, SK Hynix Canvas SC300 512GB M.2 (HFS512G39MND) | Acer Aspire S 13 S5-371-71QZ HD Graphics 520, 6500U, LiteOn CV1-8B512 | |
|---|---|---|---|---|---|---|
| Noise | 0% | -2% | 3% | -2% | -1% | |
| off / environment * | 29.1 | 30.3 -4% | 28.5 2% | 30.5 -5% | 31.2 -7% | |
| Idle Minimum * | 29.1 | 30.6 -5% | 28.5 2% | 29.7 -2% | 30.5 -5% | 31.2 -7% |
| Idle Average * | 29.1 | 30.6 -5% | 30.9 -6% | 29.8 -2% | 32.1 -10% | 31.2 -7% |
| Idle Maximum * | 31.2 | 32.2 -3% | 31.6 -1% | 30 4% | 32.3 -4% | 31.5 -1% |
| Load Average * | 37.3 | 32.2 14% | 38.8 -4% | 32 14% | 36.1 3% | 35.7 4% |
| Load Maximum * | 39.6 | 38.5 3% | 41.4 -5% | 38.5 3% | 36.1 9% | 35.8 10% |
* ... smaller is better
(-) The maximum temperature on the upper side is 48.2 °C / 119 F, compared to the average of 35.3 °C / 96 F, ranging from 19.6 to 55.7 °C for the class Convertible.
(-) The bottom heats up to a maximum of 46 °C / 115 F, compared to the average of 36.8 °C / 98 F
(+) In idle usage, the average temperature for the upper side is 22.4 °C / 72 F, compared to the device average of 30.2 °C / 86 F.
(+) The palmrests and touchpad are reaching skin temperature as a maximum (33 °C / 91.4 F) and are therefore not hot.
(-) The average temperature of the palmrest area of similar devices was 28.1 °C / 82.6 F (-4.9 °C / -8.8 F).
HP Spectre x360 13-w023dx audio analysis
(±) | speaker loudness is average but good (76.2 dB)
Bass 100 - 315 Hz
(-) | nearly no bass - on average 17% lower than median
(±) | linearity of bass is average (12.7% delta to prev. frequency)
Mids 400 - 2000 Hz
(+) | balanced mids - only 3.7% away from median
(+) | mids are linear (6.3% delta to prev. frequency)
Highs 2 - 16 kHz
(+) | balanced highs - only 2.4% away from median
(±) | linearity of highs is average (7.2% delta to prev. frequency)
Overall 100 - 16.000 Hz
(±) | linearity of overall sound is average (21.9% difference to median)
Compared to same class
» 58% of all tested devices in this class were better, 8% similar, 34% worse
» The best had a delta of 6%, average was 21%, worst was 57%
Compared to all devices tested
» 58% of all tested devices were better, 7% similar, 35% worse
» The best had a delta of 4%, average was 25%, worst was 134%
Apple MacBook 12 (Early 2016) 1.1 GHz audio analysis
(+) | speakers can play relatively loud (83.6 dB)
Bass 100 - 315 Hz
(±) | reduced bass - on average 11.3% lower than median
(±) | linearity of bass is average (14.2% delta to prev. frequency)
Mids 400 - 2000 Hz
(+) | balanced mids - only 2.4% away from median
(+) | mids are linear (5.5% delta to prev. frequency)
Highs 2 - 16 kHz
(+) | balanced highs - only 2% away from median
(+) | highs are linear (4.5% delta to prev. frequency)
Overall 100 - 16.000 Hz
(+) | overall sound is linear (10.2% difference to median)
Compared to same class
» 5% of all tested devices in this class were better, 2% similar, 93% worse
» The best had a delta of 5%, average was 19%, worst was 53%
Compared to all devices tested
» 3% of all tested devices were better, 1% similar, 96% worse
» The best had a delta of 4%, average was 25%, worst was 134%
| Off / Standby | |
| Idle | |
| Load |
|
| HP Spectre x360 13-w023dx i7-7500U, HD Graphics 620, Samsung PM951 NVMe MZVLV512, IPS, 1920x1080, 13.30 | Dell XPS 13 9360 QHD+ i5 i5-7200U, HD Graphics 620, Toshiba NVMe THNSN5256GPUK, , 3200x1800, 13.30 | HP Spectre 13 6500U, HD Graphics 520, Samsung PM951 NVMe MZVLV256, IPS UWVA, 1920x1080, 13.30 | Asus Zenbook UX360UA-C4159T 6500U, HD Graphics 520, SK Hynix Canvas SC300 512GB M.2 (HFS512G39MND), IPS, 1920x1080, 13.30 | Acer Aspire S 13 S5-371-71QZ 6500U, HD Graphics 520, LiteOn CV1-8B512, IPS, 1920x1080, 13.30 | |
|---|---|---|---|---|---|
| Power Consumption | 13% | -37% | -7% | 6% | |
| Idle Minimum * | 5.5 | 3.7 33% | 8.6 -56% | 6.9 -25% | 4.1 25% |
| Idle Average * | 6.7 | 6.1 9% | 11 -64% | 7.9 -18% | 6.7 -0% |
| Idle Maximum * | 7.1 | 6.5 8% | 11.3 -59% | 8.3 -17% | 7.4 -4% |
| Load Average * | 33.1 | 29.5 11% | 33.8 -2% | 30.1 9% | 32.4 2% |
| Load Maximum * | 35.2 | 33 6% | 36.2 -3% | 29.6 16% | 32.4 8% |
* ... smaller is better
| HP Spectre x360 13-w023dx i7-7500U, HD Graphics 620, 57.8 Wh | Dell XPS 13 9360 QHD+ i5 i5-7200U, HD Graphics 620, 60 Wh | HP Spectre 13 6500U, HD Graphics 520, 38 Wh | Lenovo Yoga 900-13ISK 80MK 6500U, HD Graphics 520, 66 Wh | Asus Zenbook UX360UA-C4159T 6500U, HD Graphics 520, 57 Wh | Acer Aspire S 13 S5-371-71QZ 6500U, HD Graphics 520, 45 Wh | |
|---|---|---|---|---|---|---|
| Battery Runtime | 4% | -39% | -18% | 13% | -17% | |
| Reader / Idle | 1233 | 715 -42% | 844 -32% | 1165 -6% | 1028 -17% | |
| WiFi v1.3 | 558 | 526 -6% | 338 -39% | 403 -28% | 581 4% | 472 -15% |
| Load | 121 | 137 13% | 78 -36% | 128 6% | 169 40% | 99 -18% |
Pros
Cons
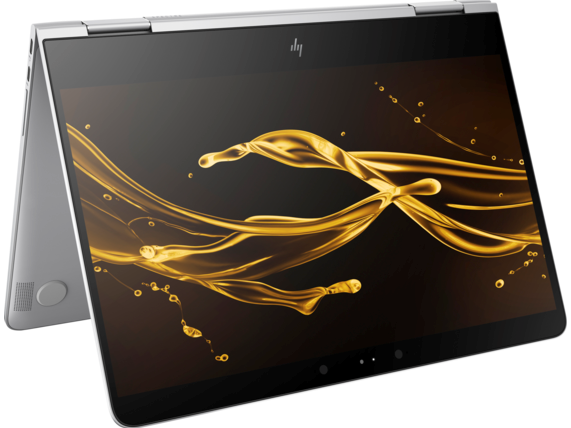
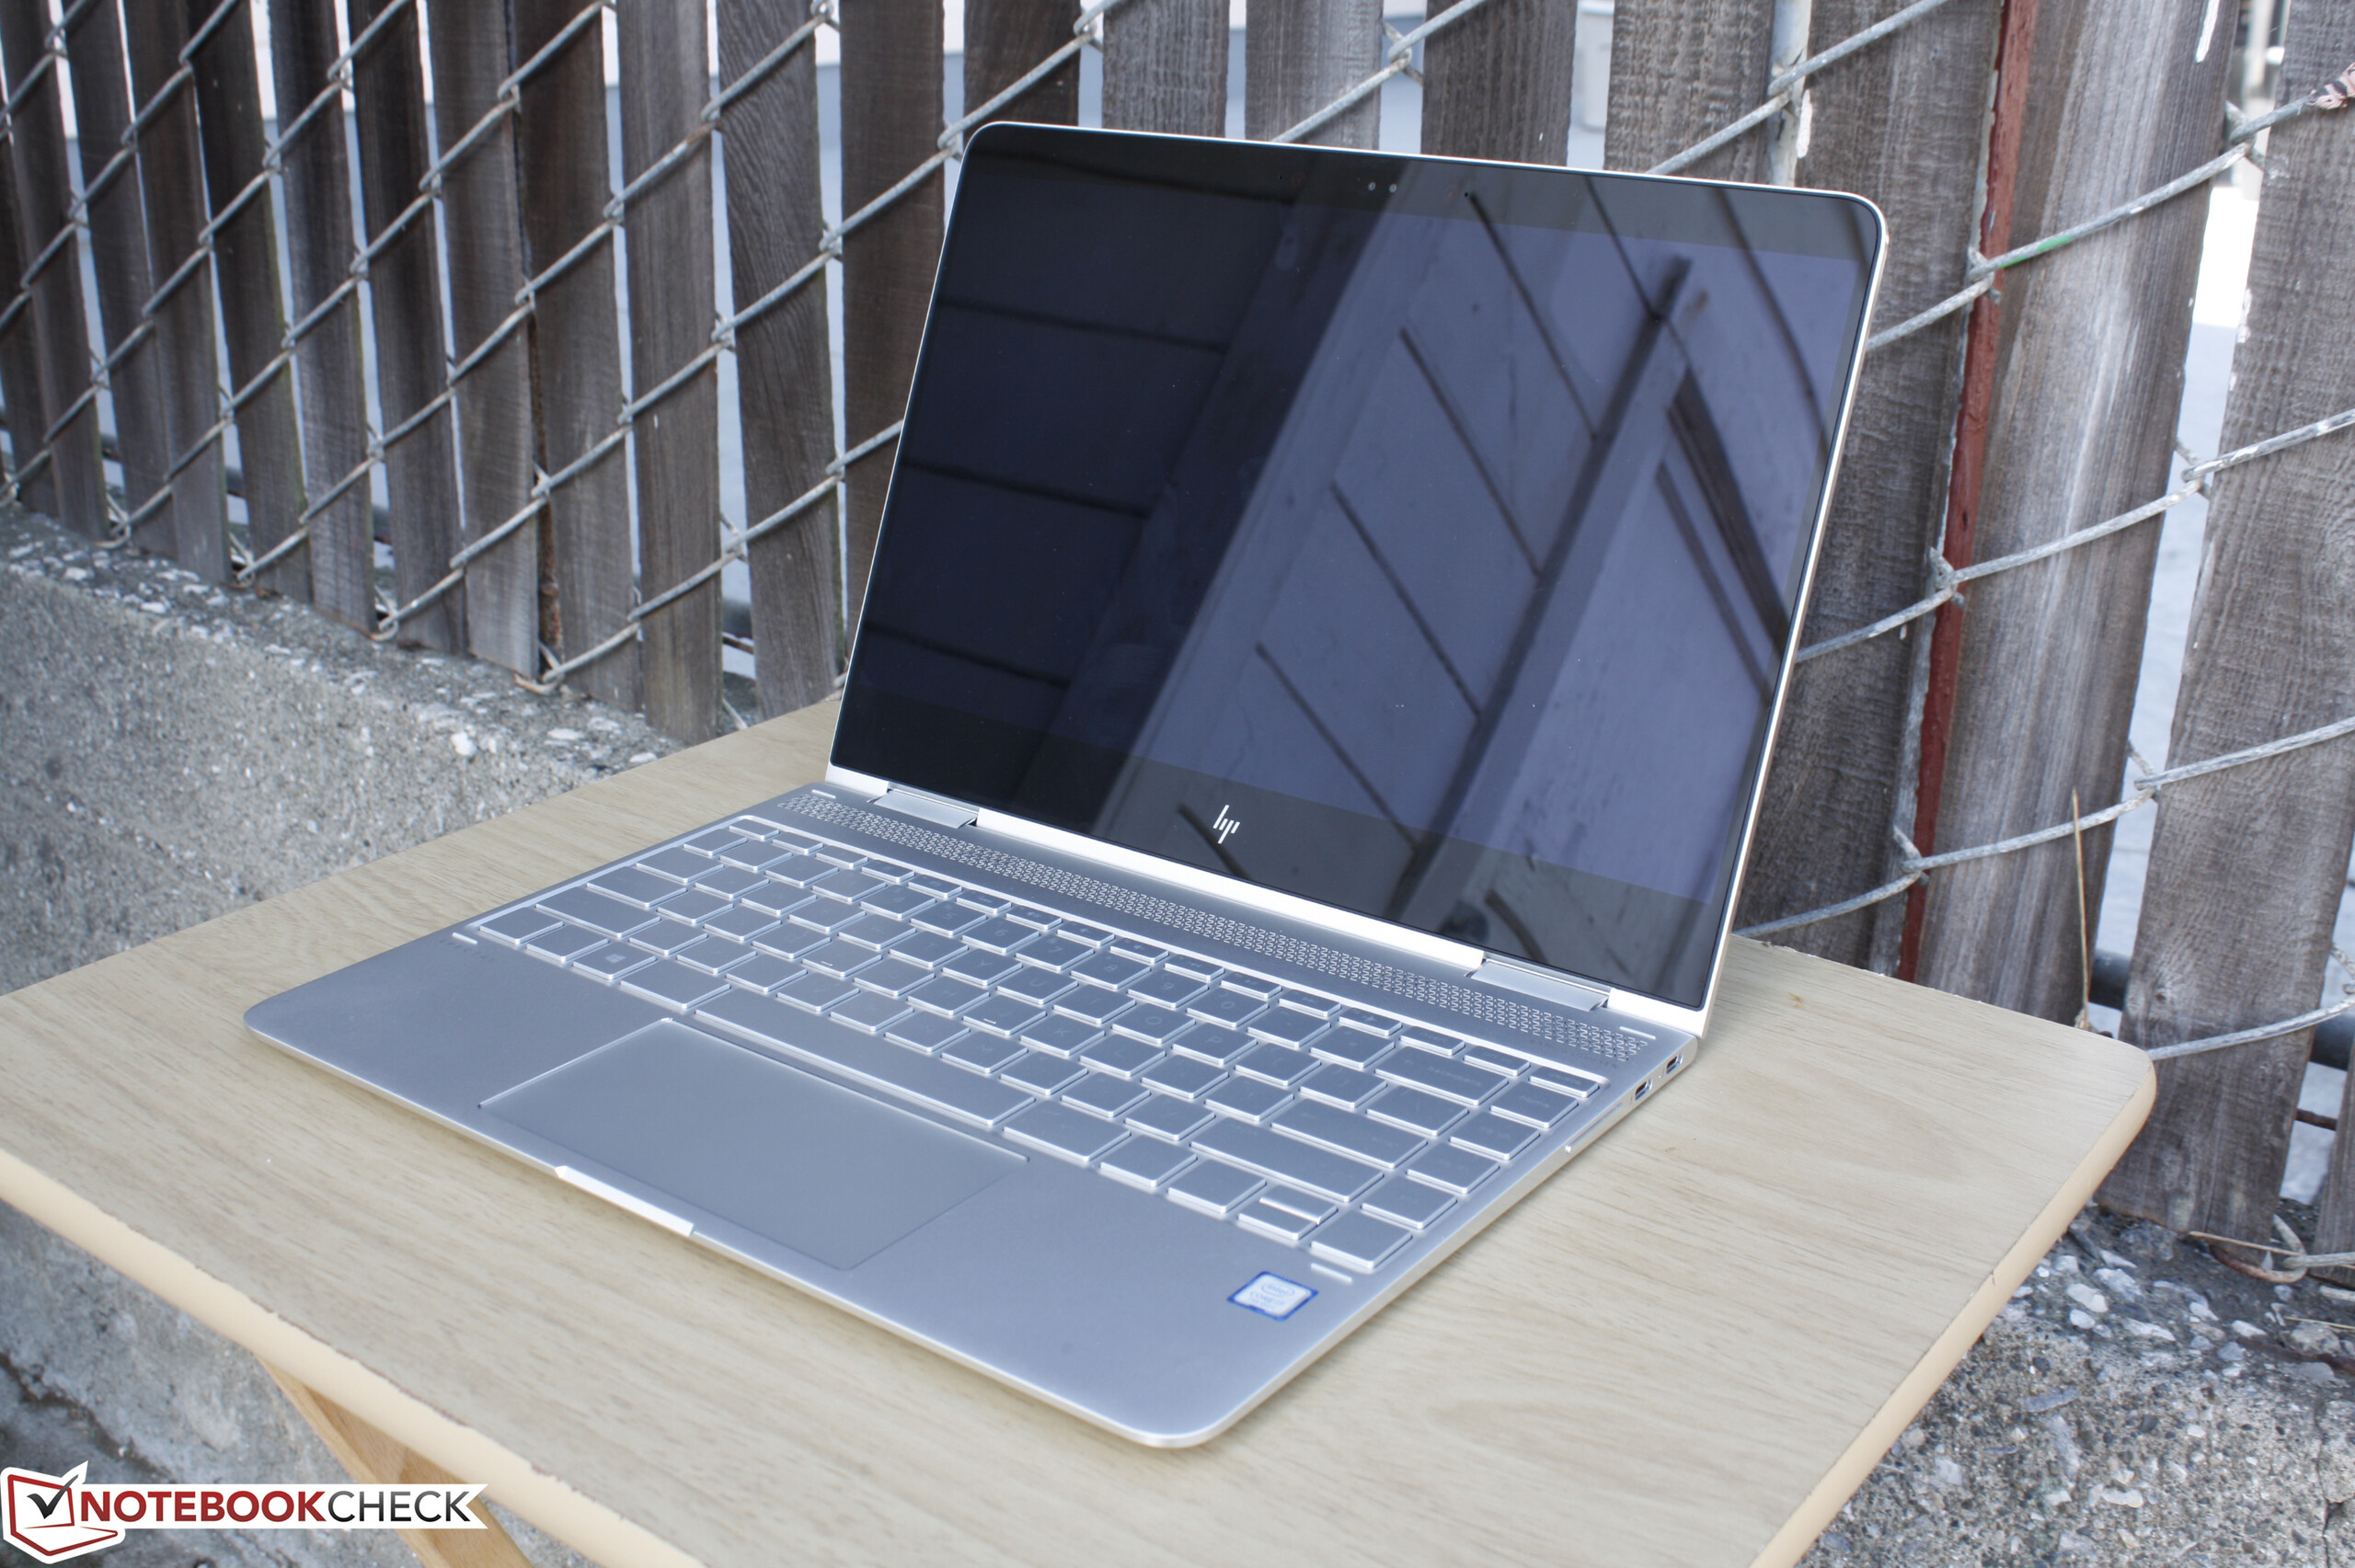
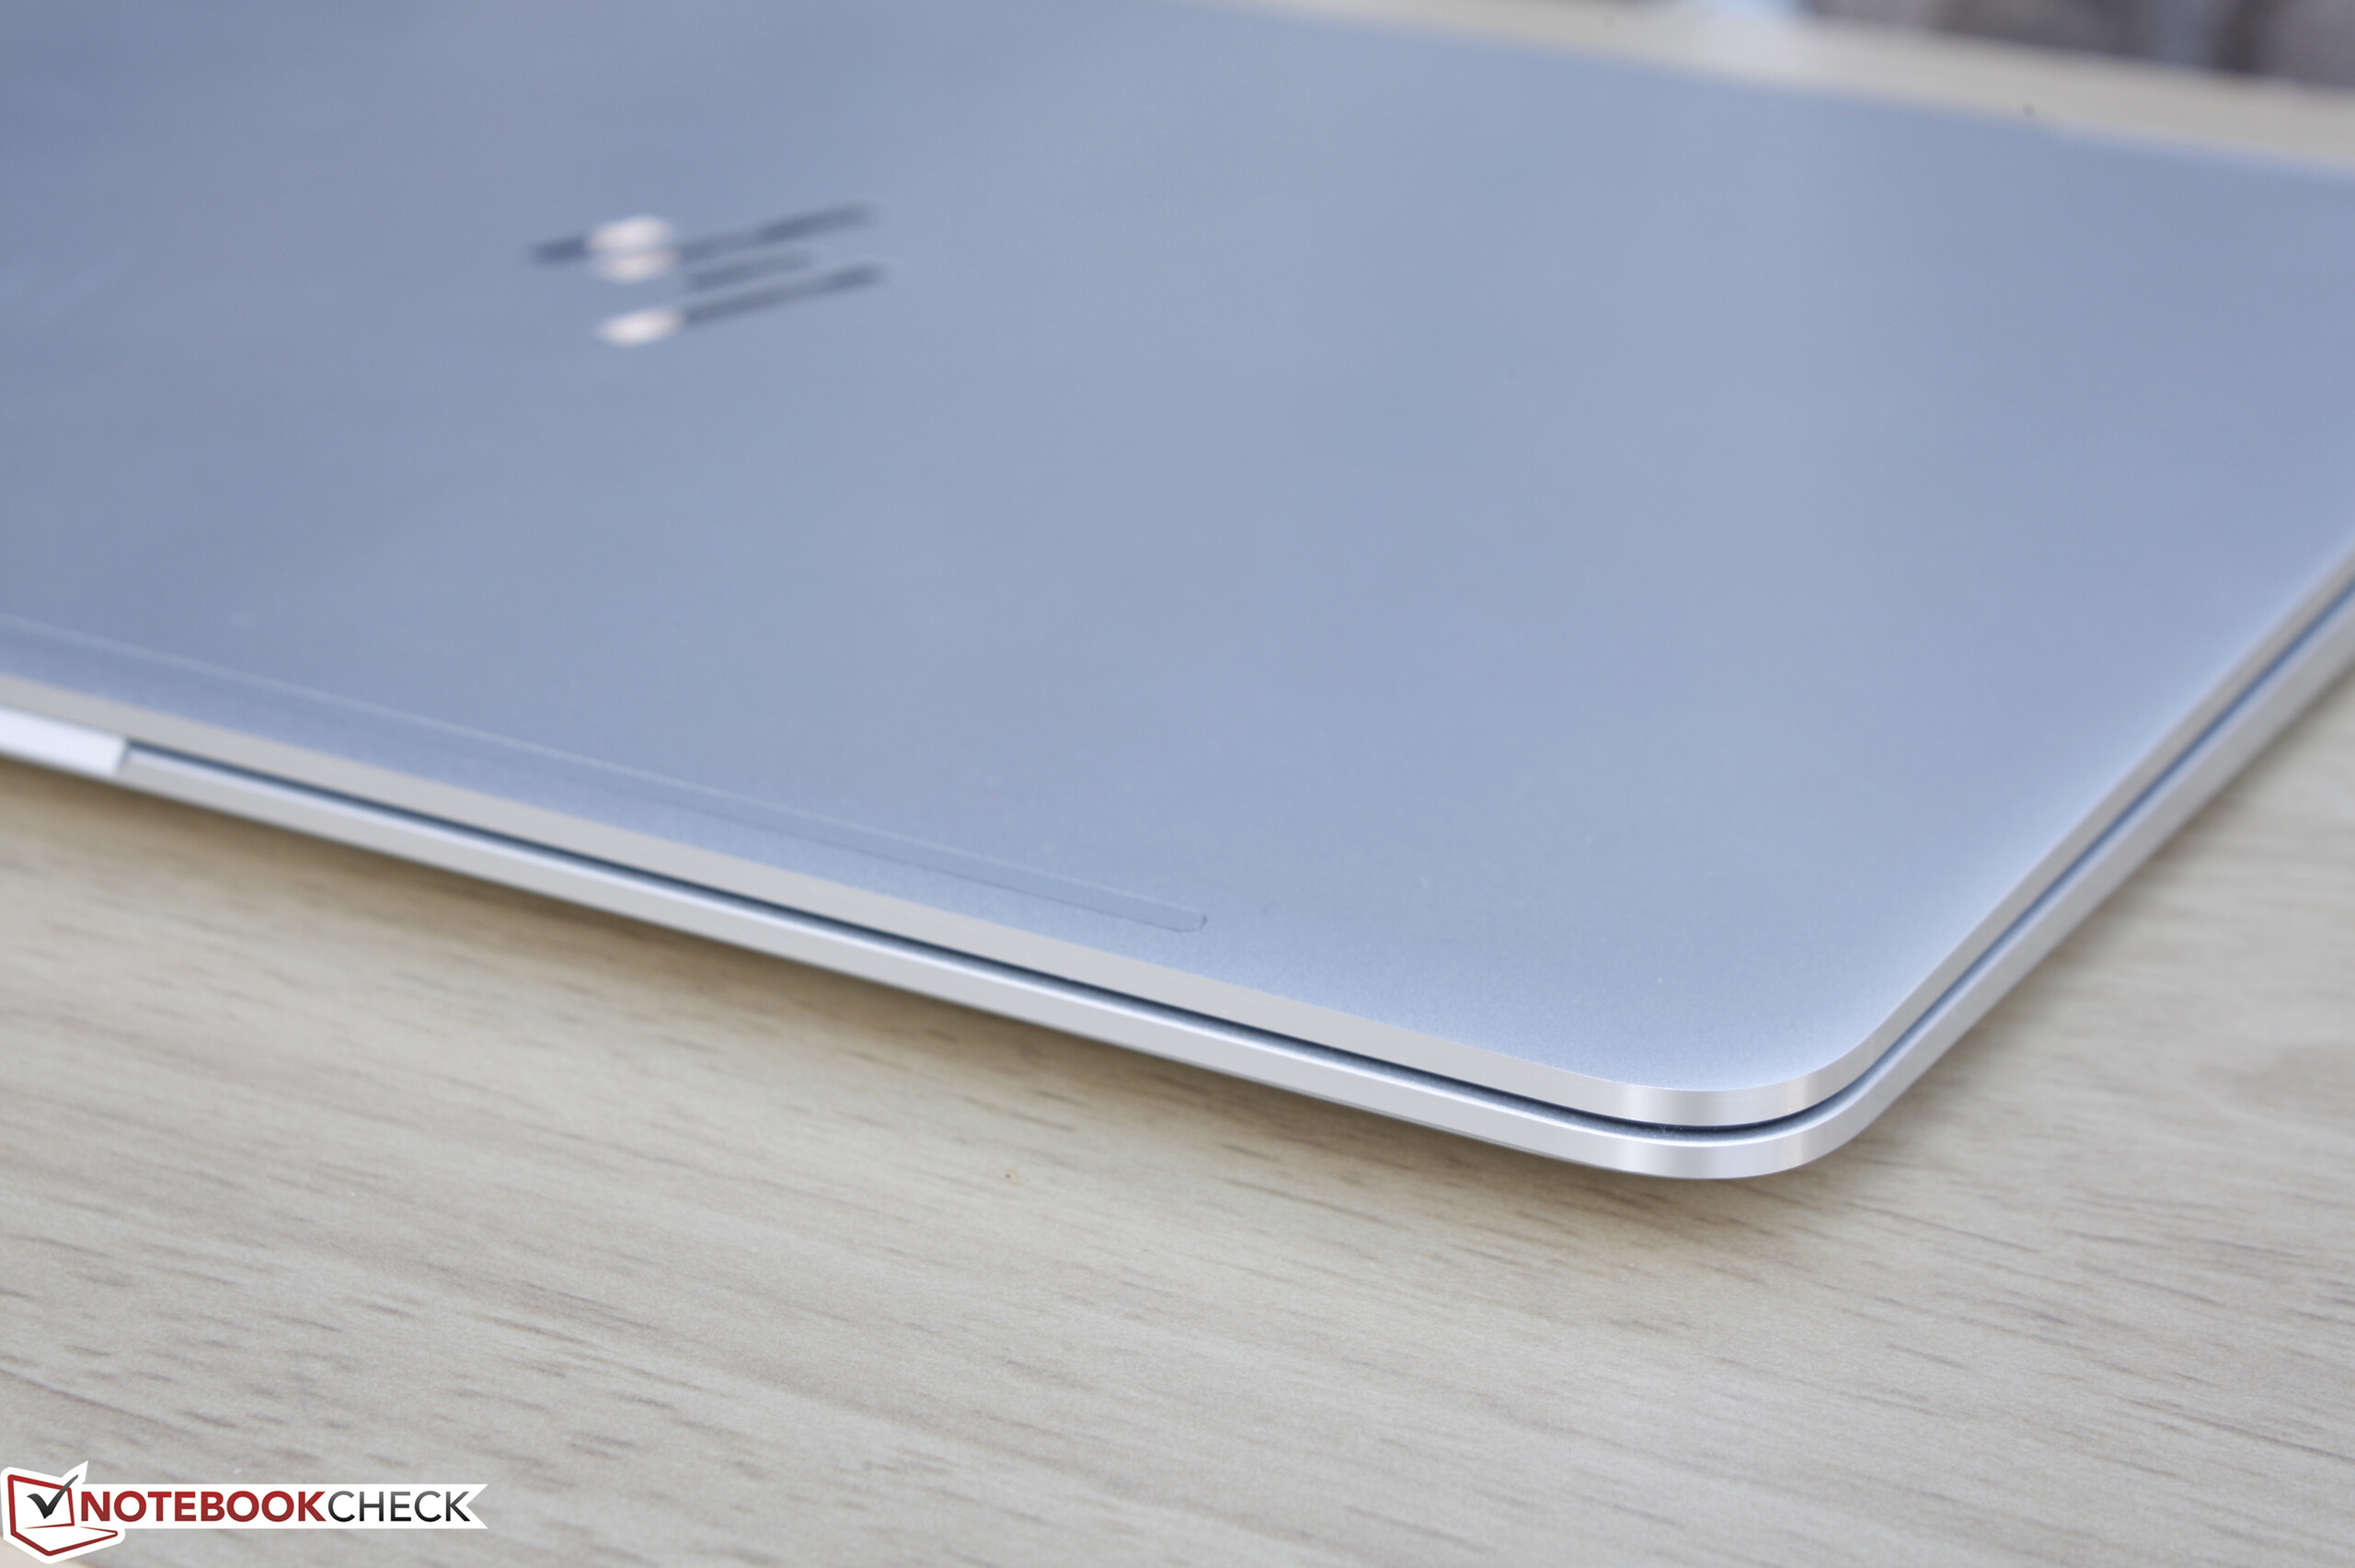
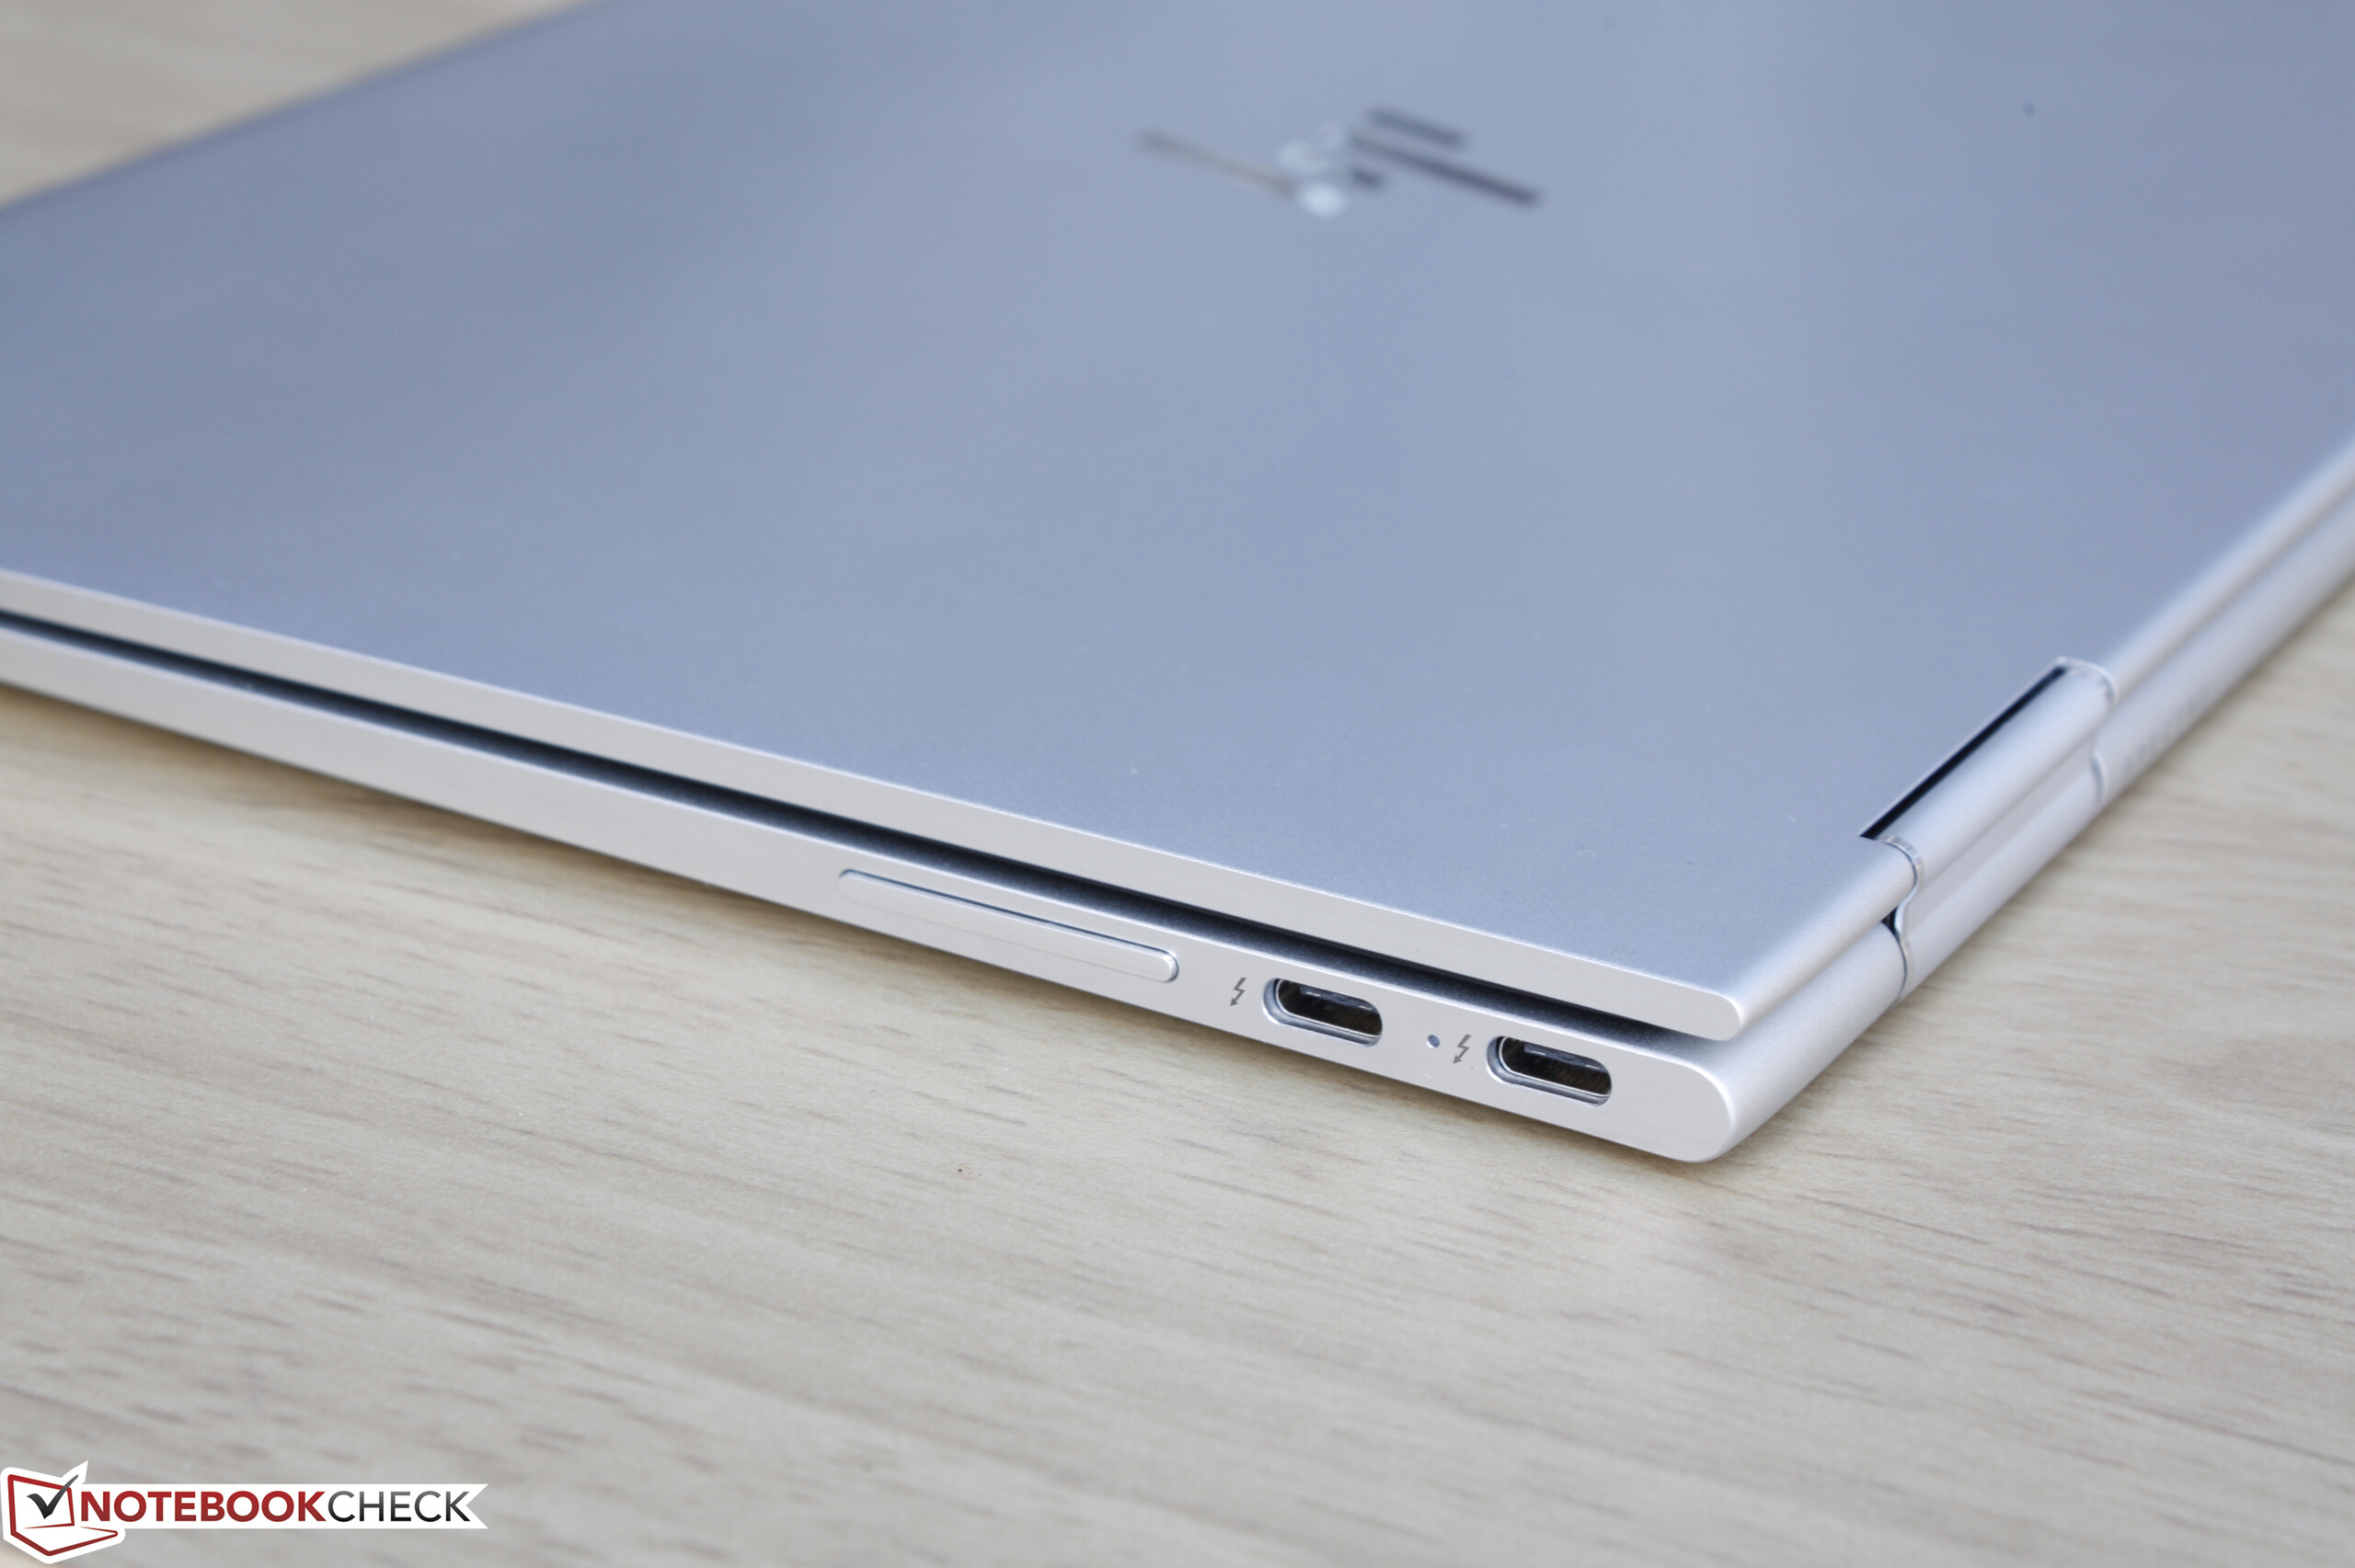
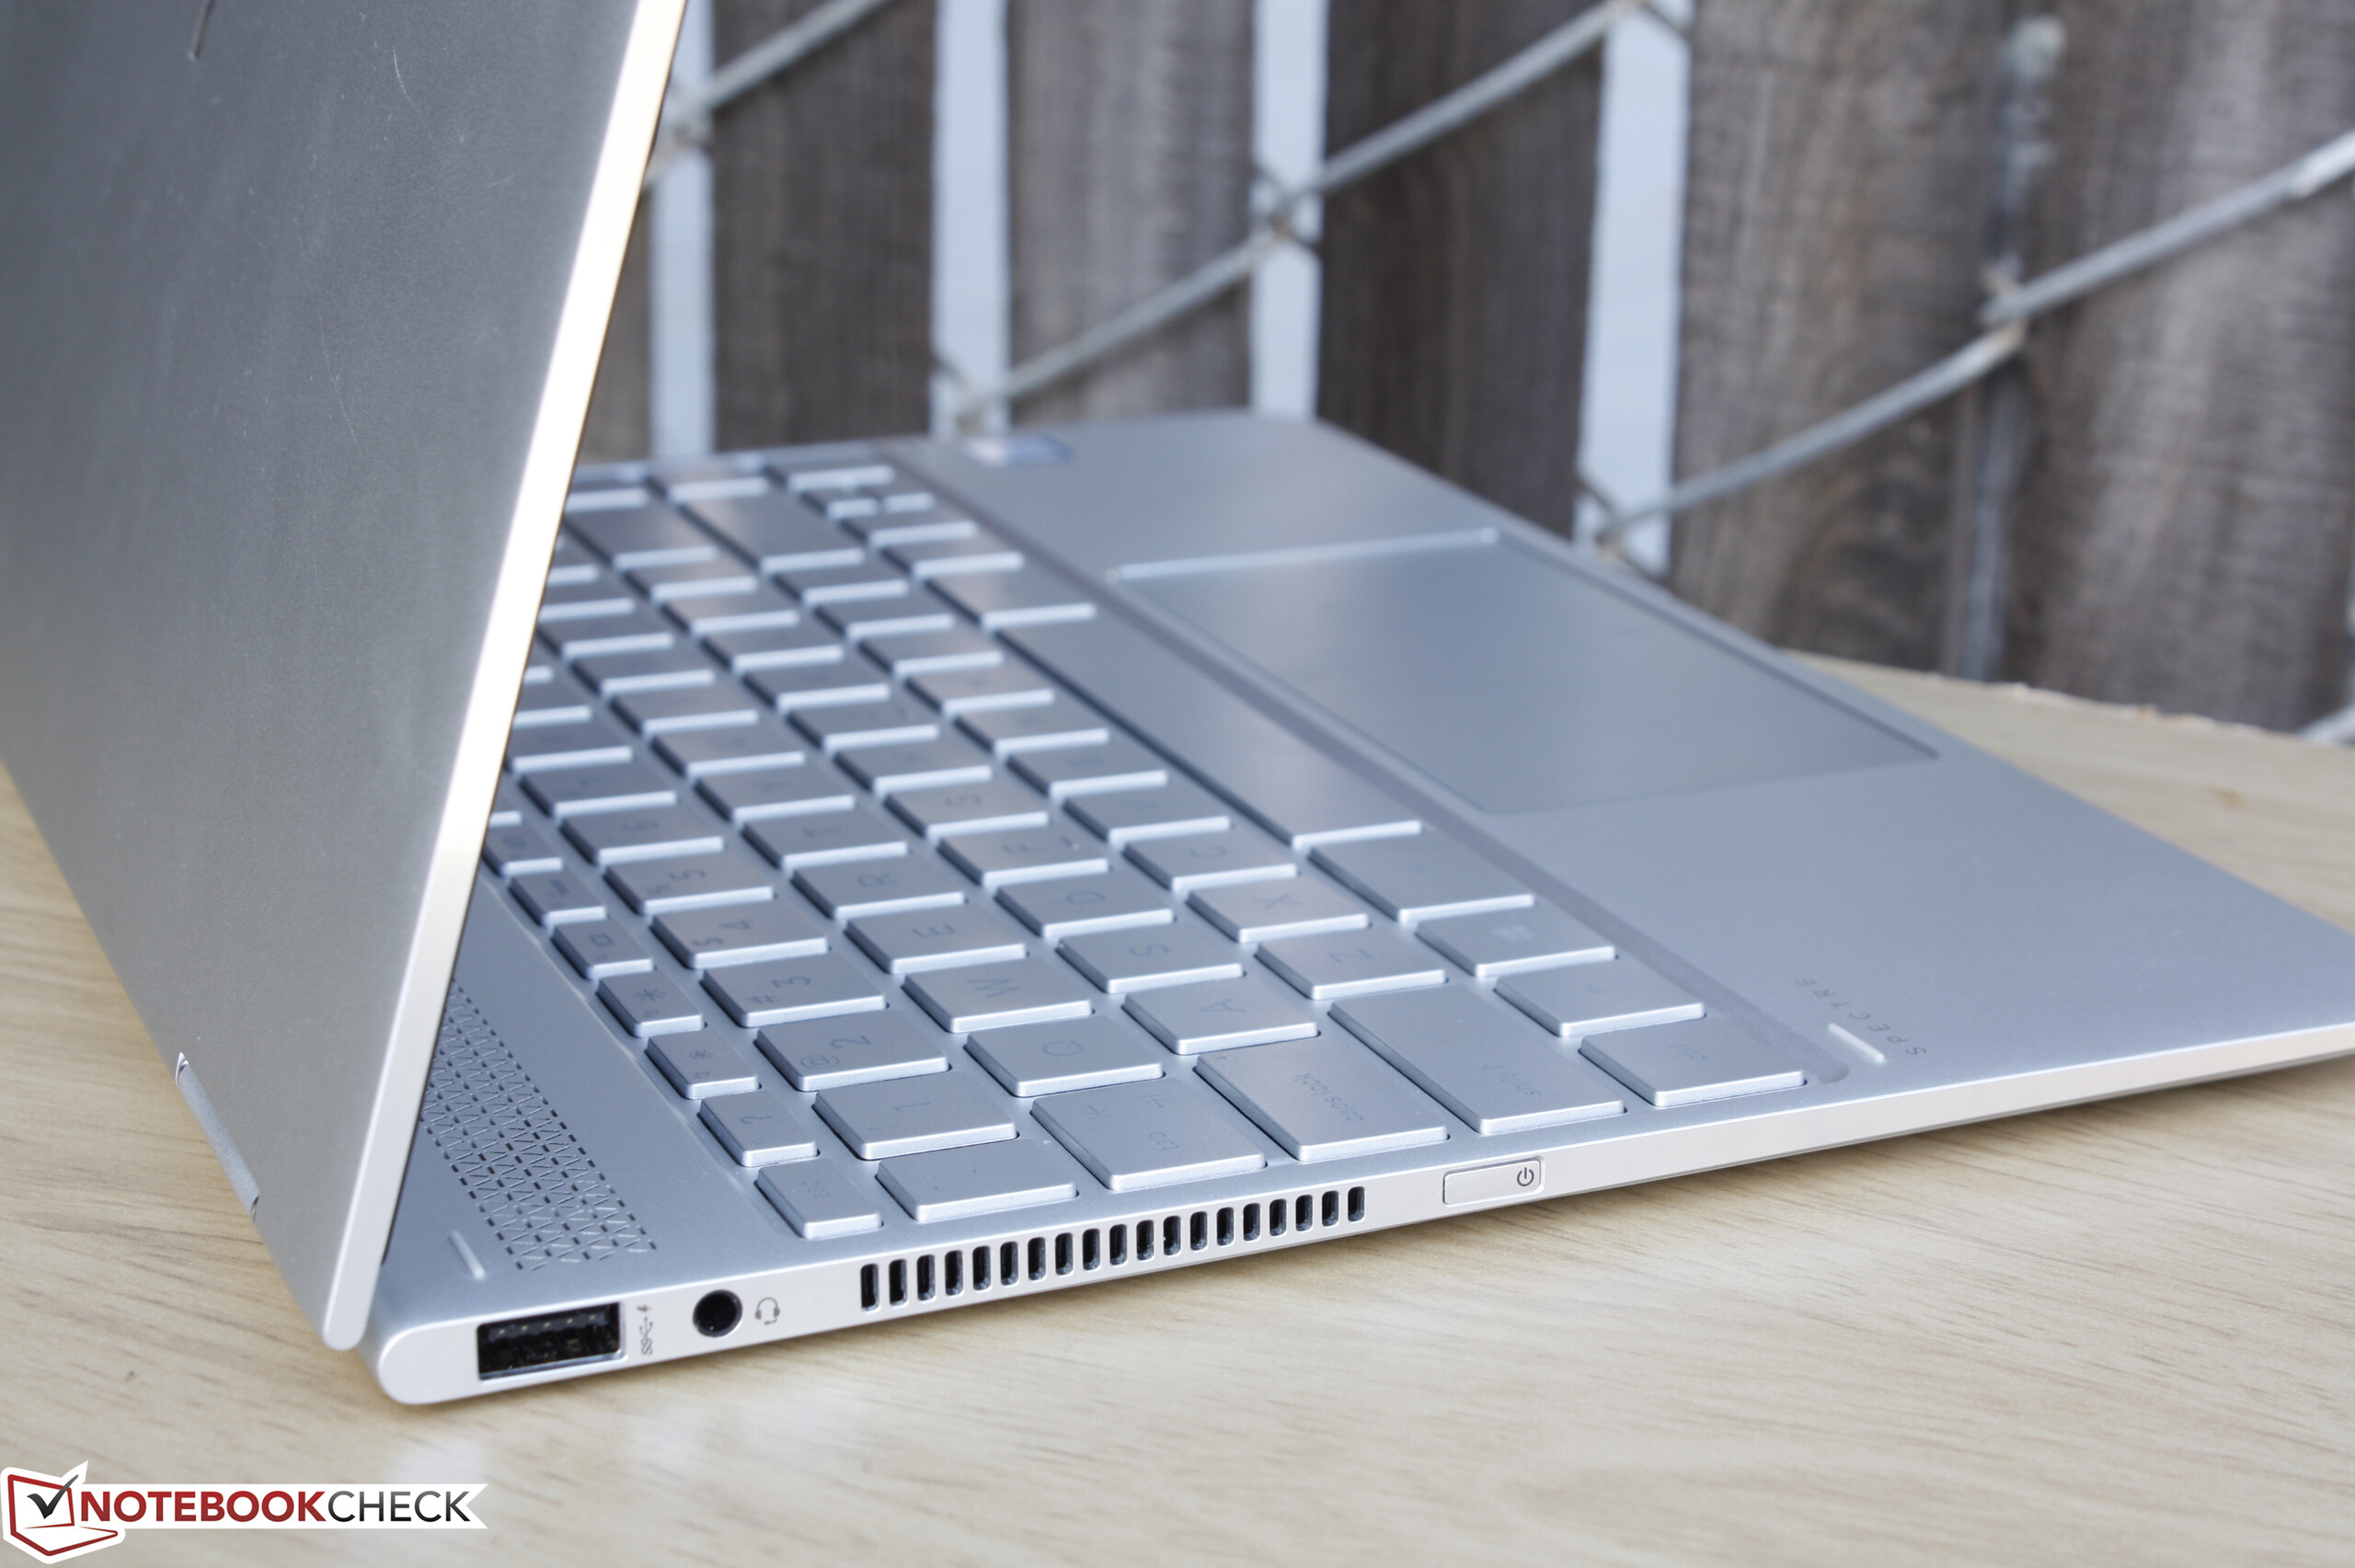
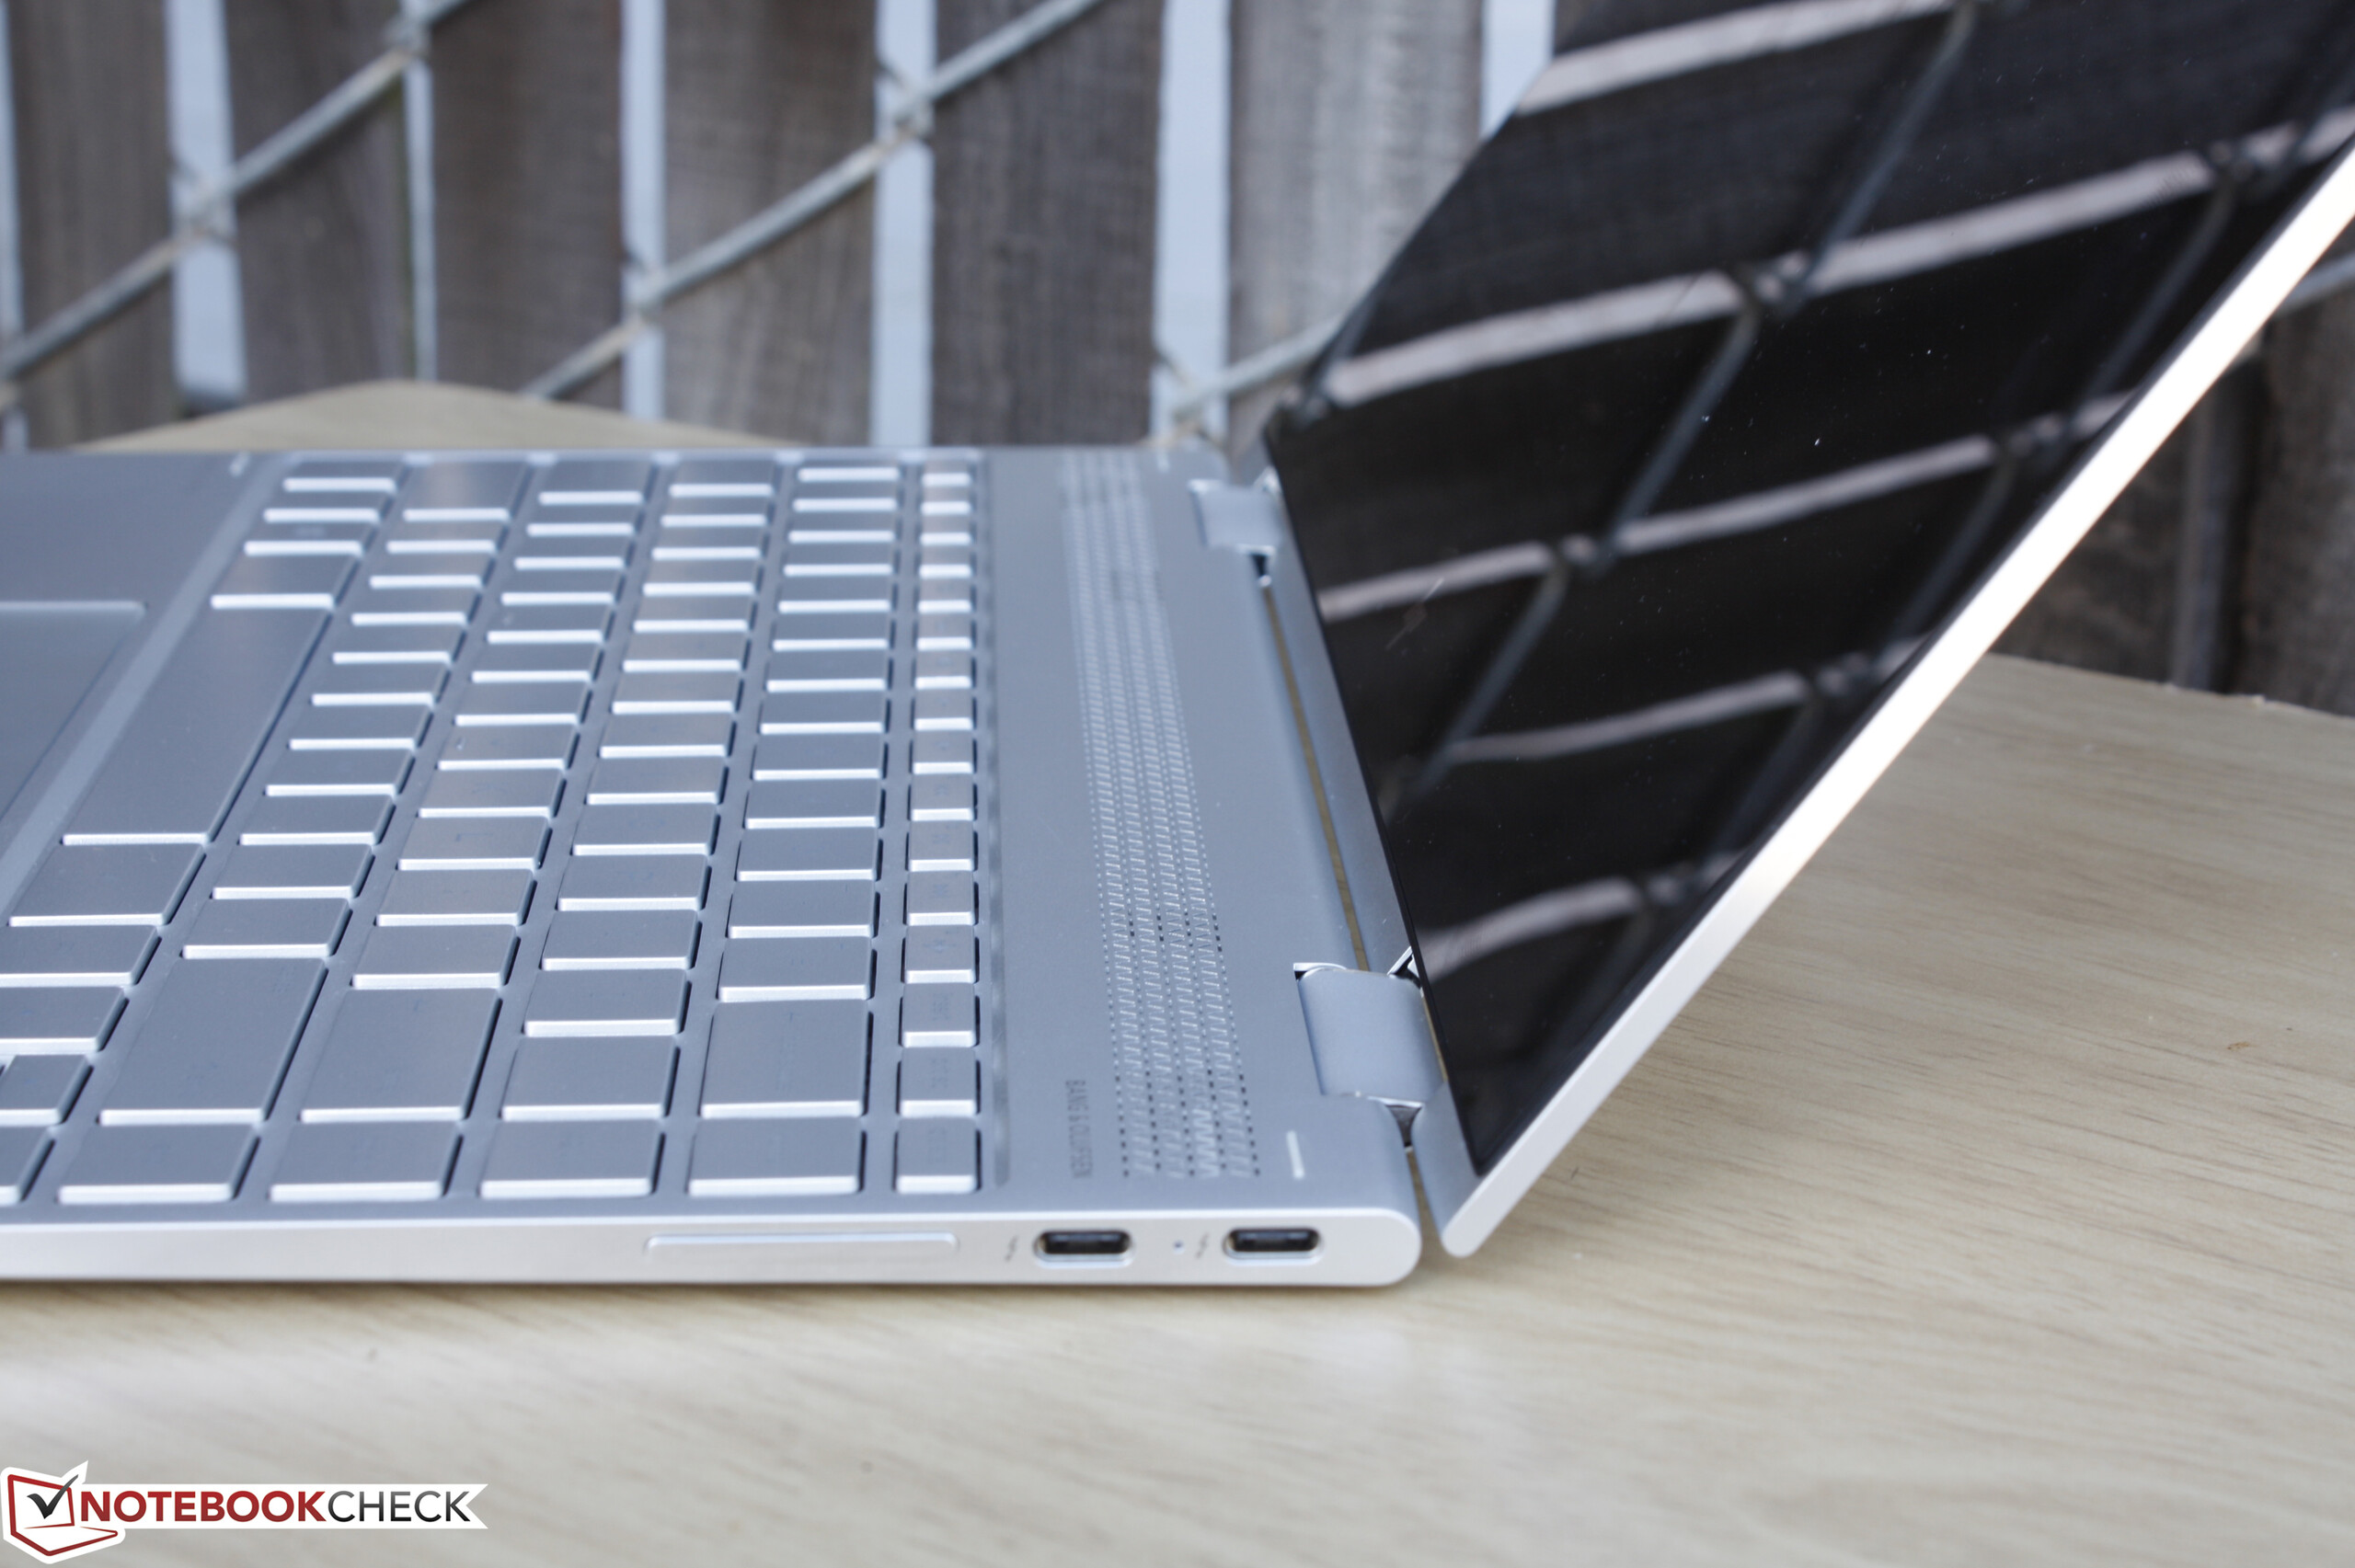
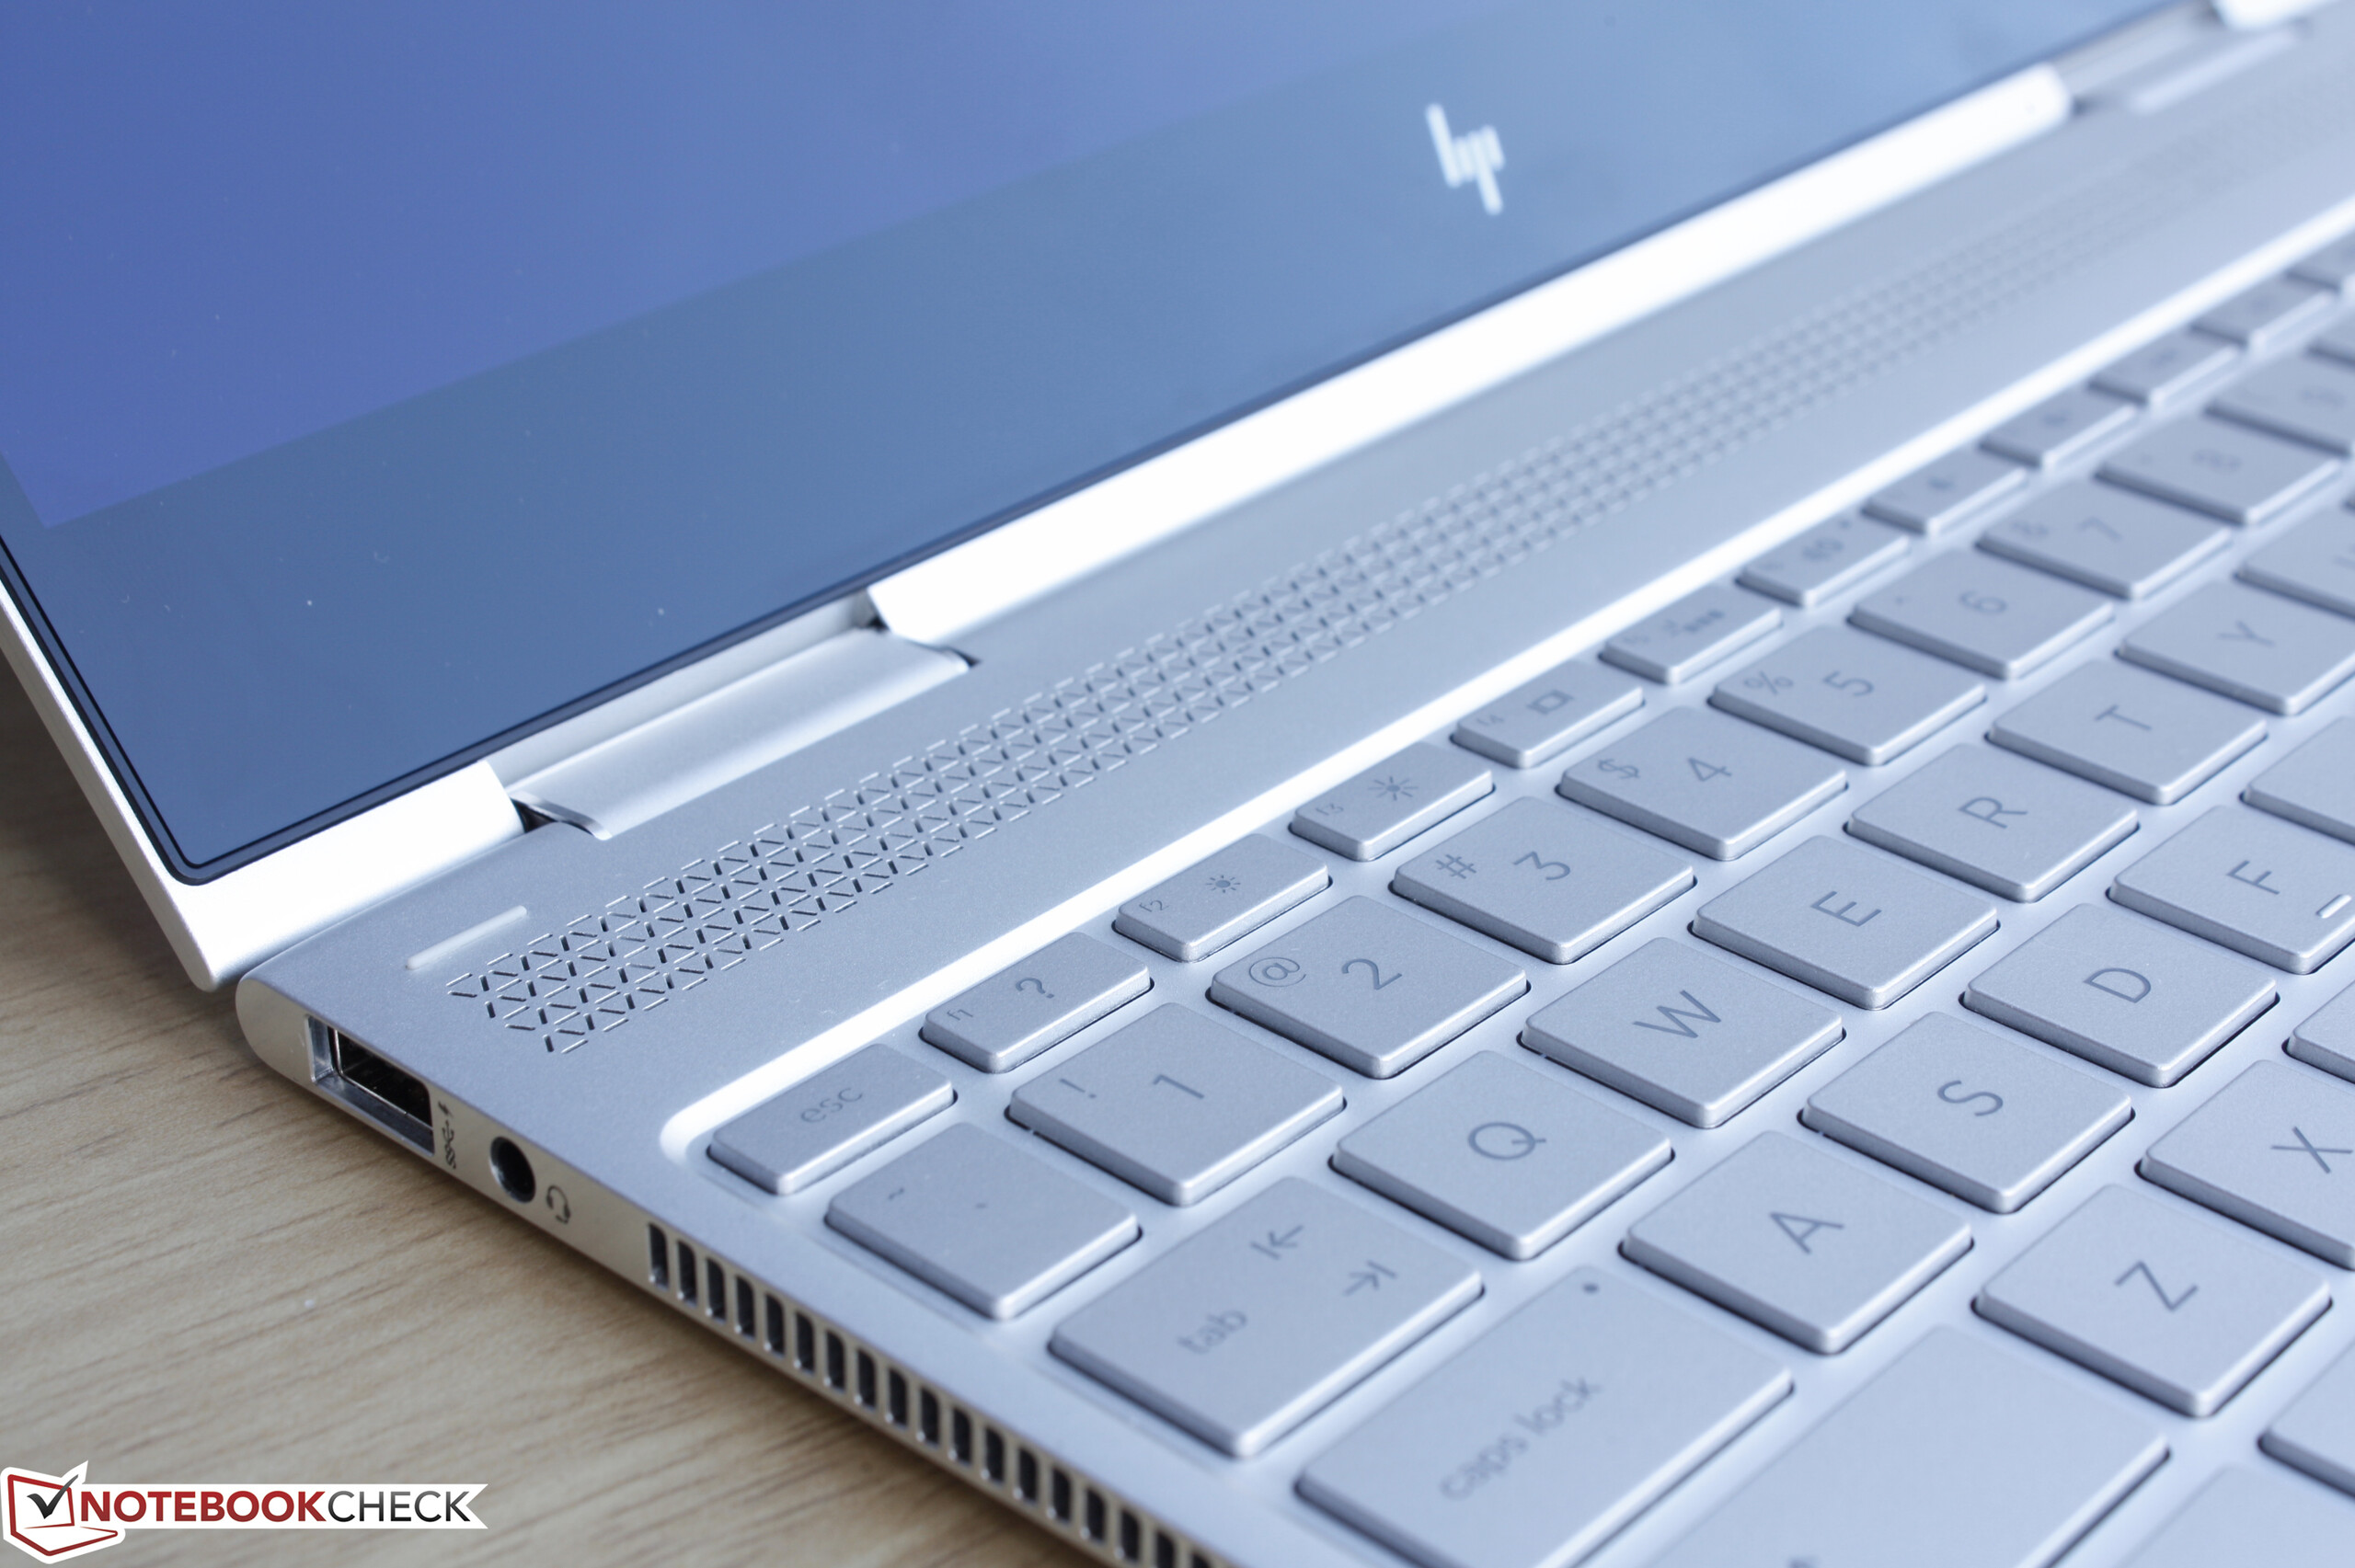
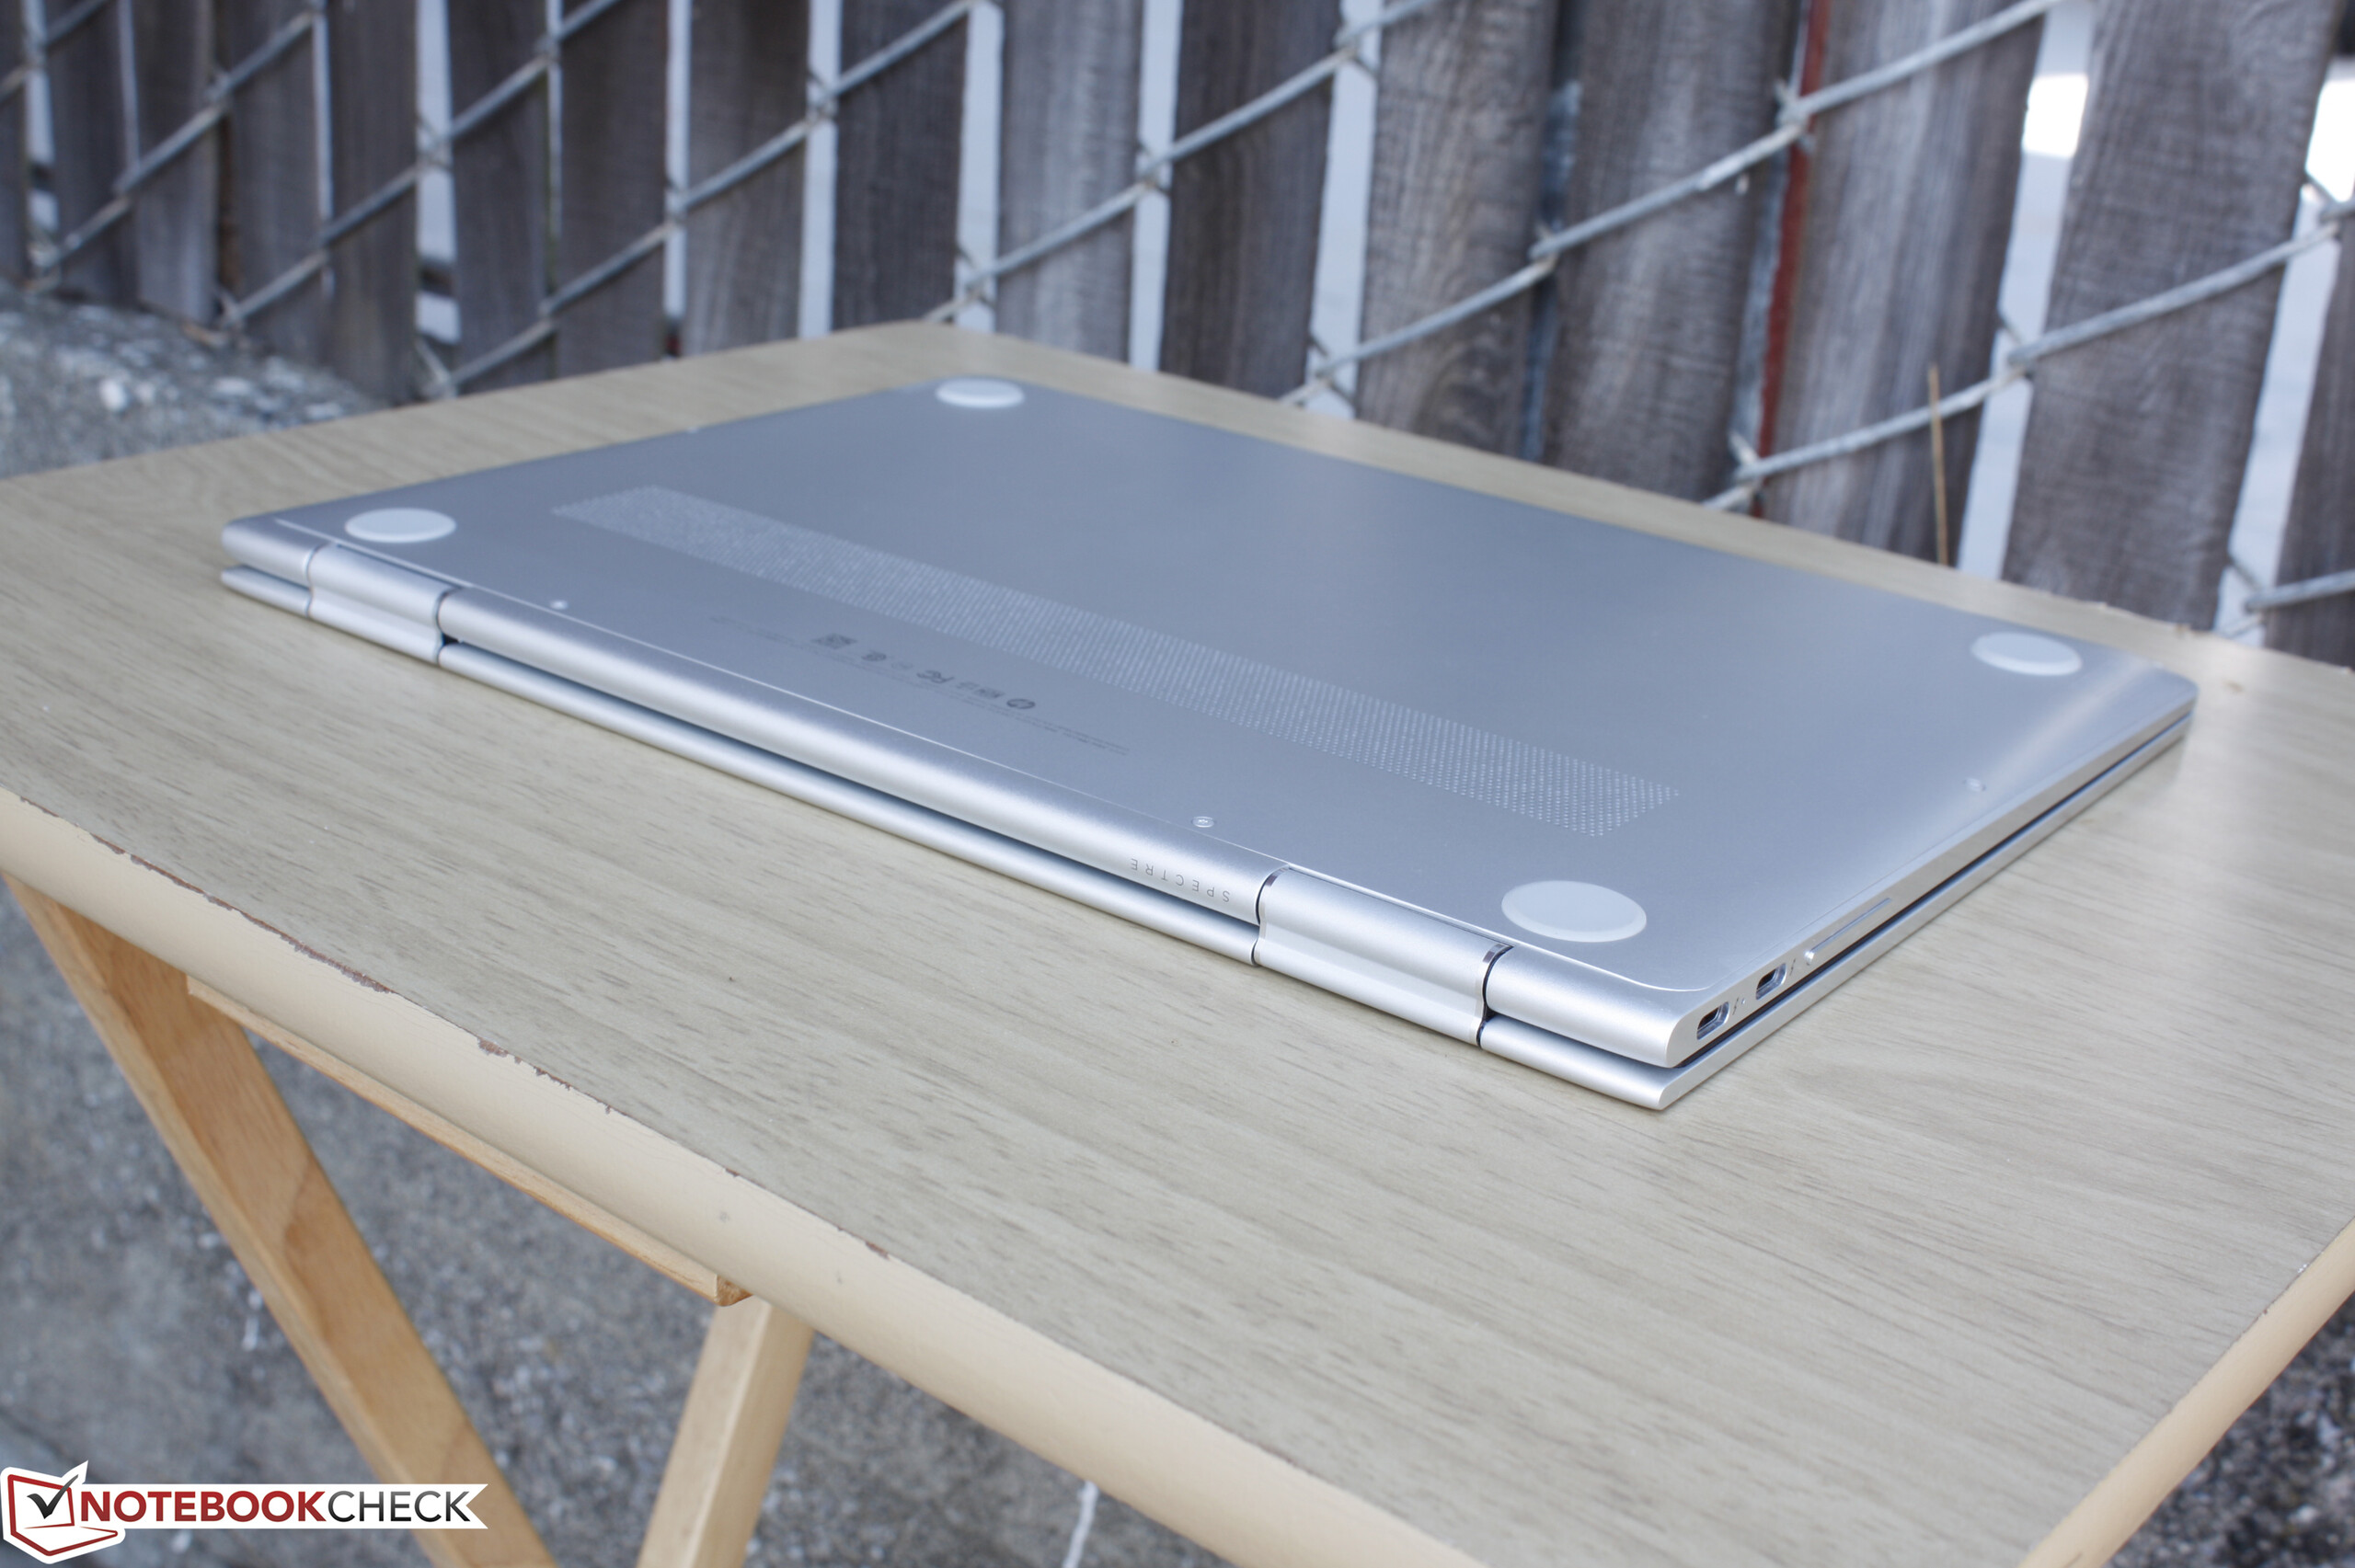
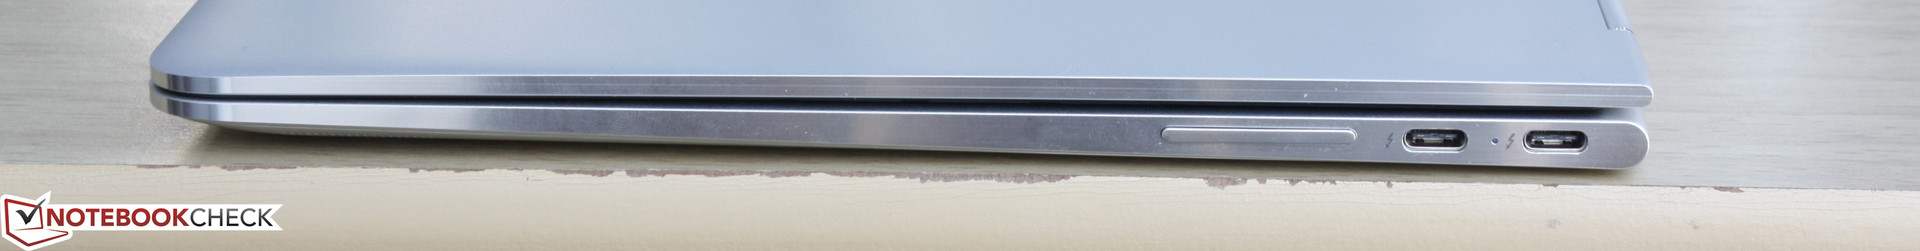
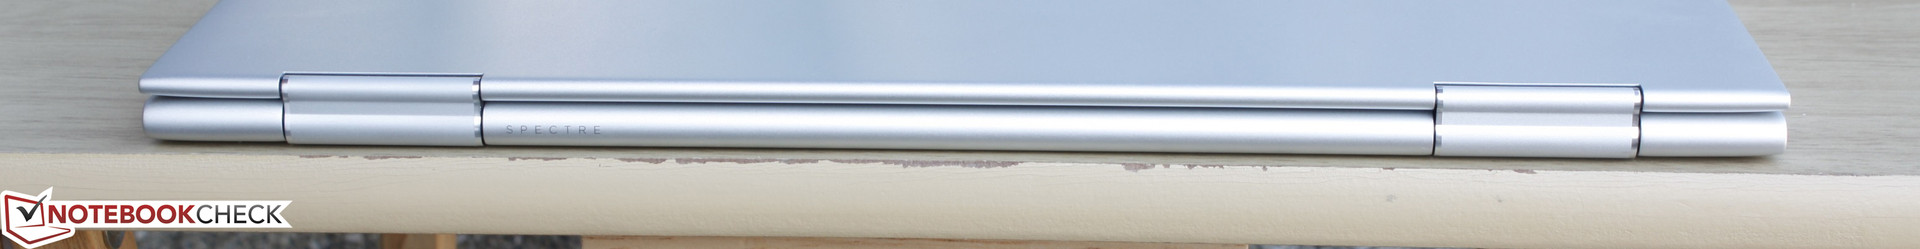
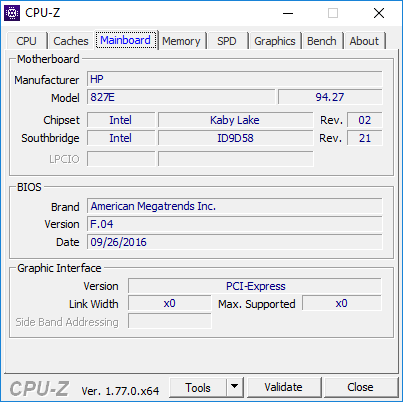
Spectre x360 13是目前为止最优秀的Spectre二合一设备。我们对之前的Spectre变形本机型最大的不满出自它们相比同类产品更加笨重的机身,而这款机型采用较窄屏幕边框和更薄机身让它可以在保证机身坚固度和品质的情况下大幅度降低机身重量。实际上,Spectre x360 13的新设计是比Kaby Lake硬件更新更让我们惊喜的变化。它的其他优势还包括了更长电池续航,NVMe固态硬盘,更强的集成显卡性能,和两个Thunderbolt 3接口。
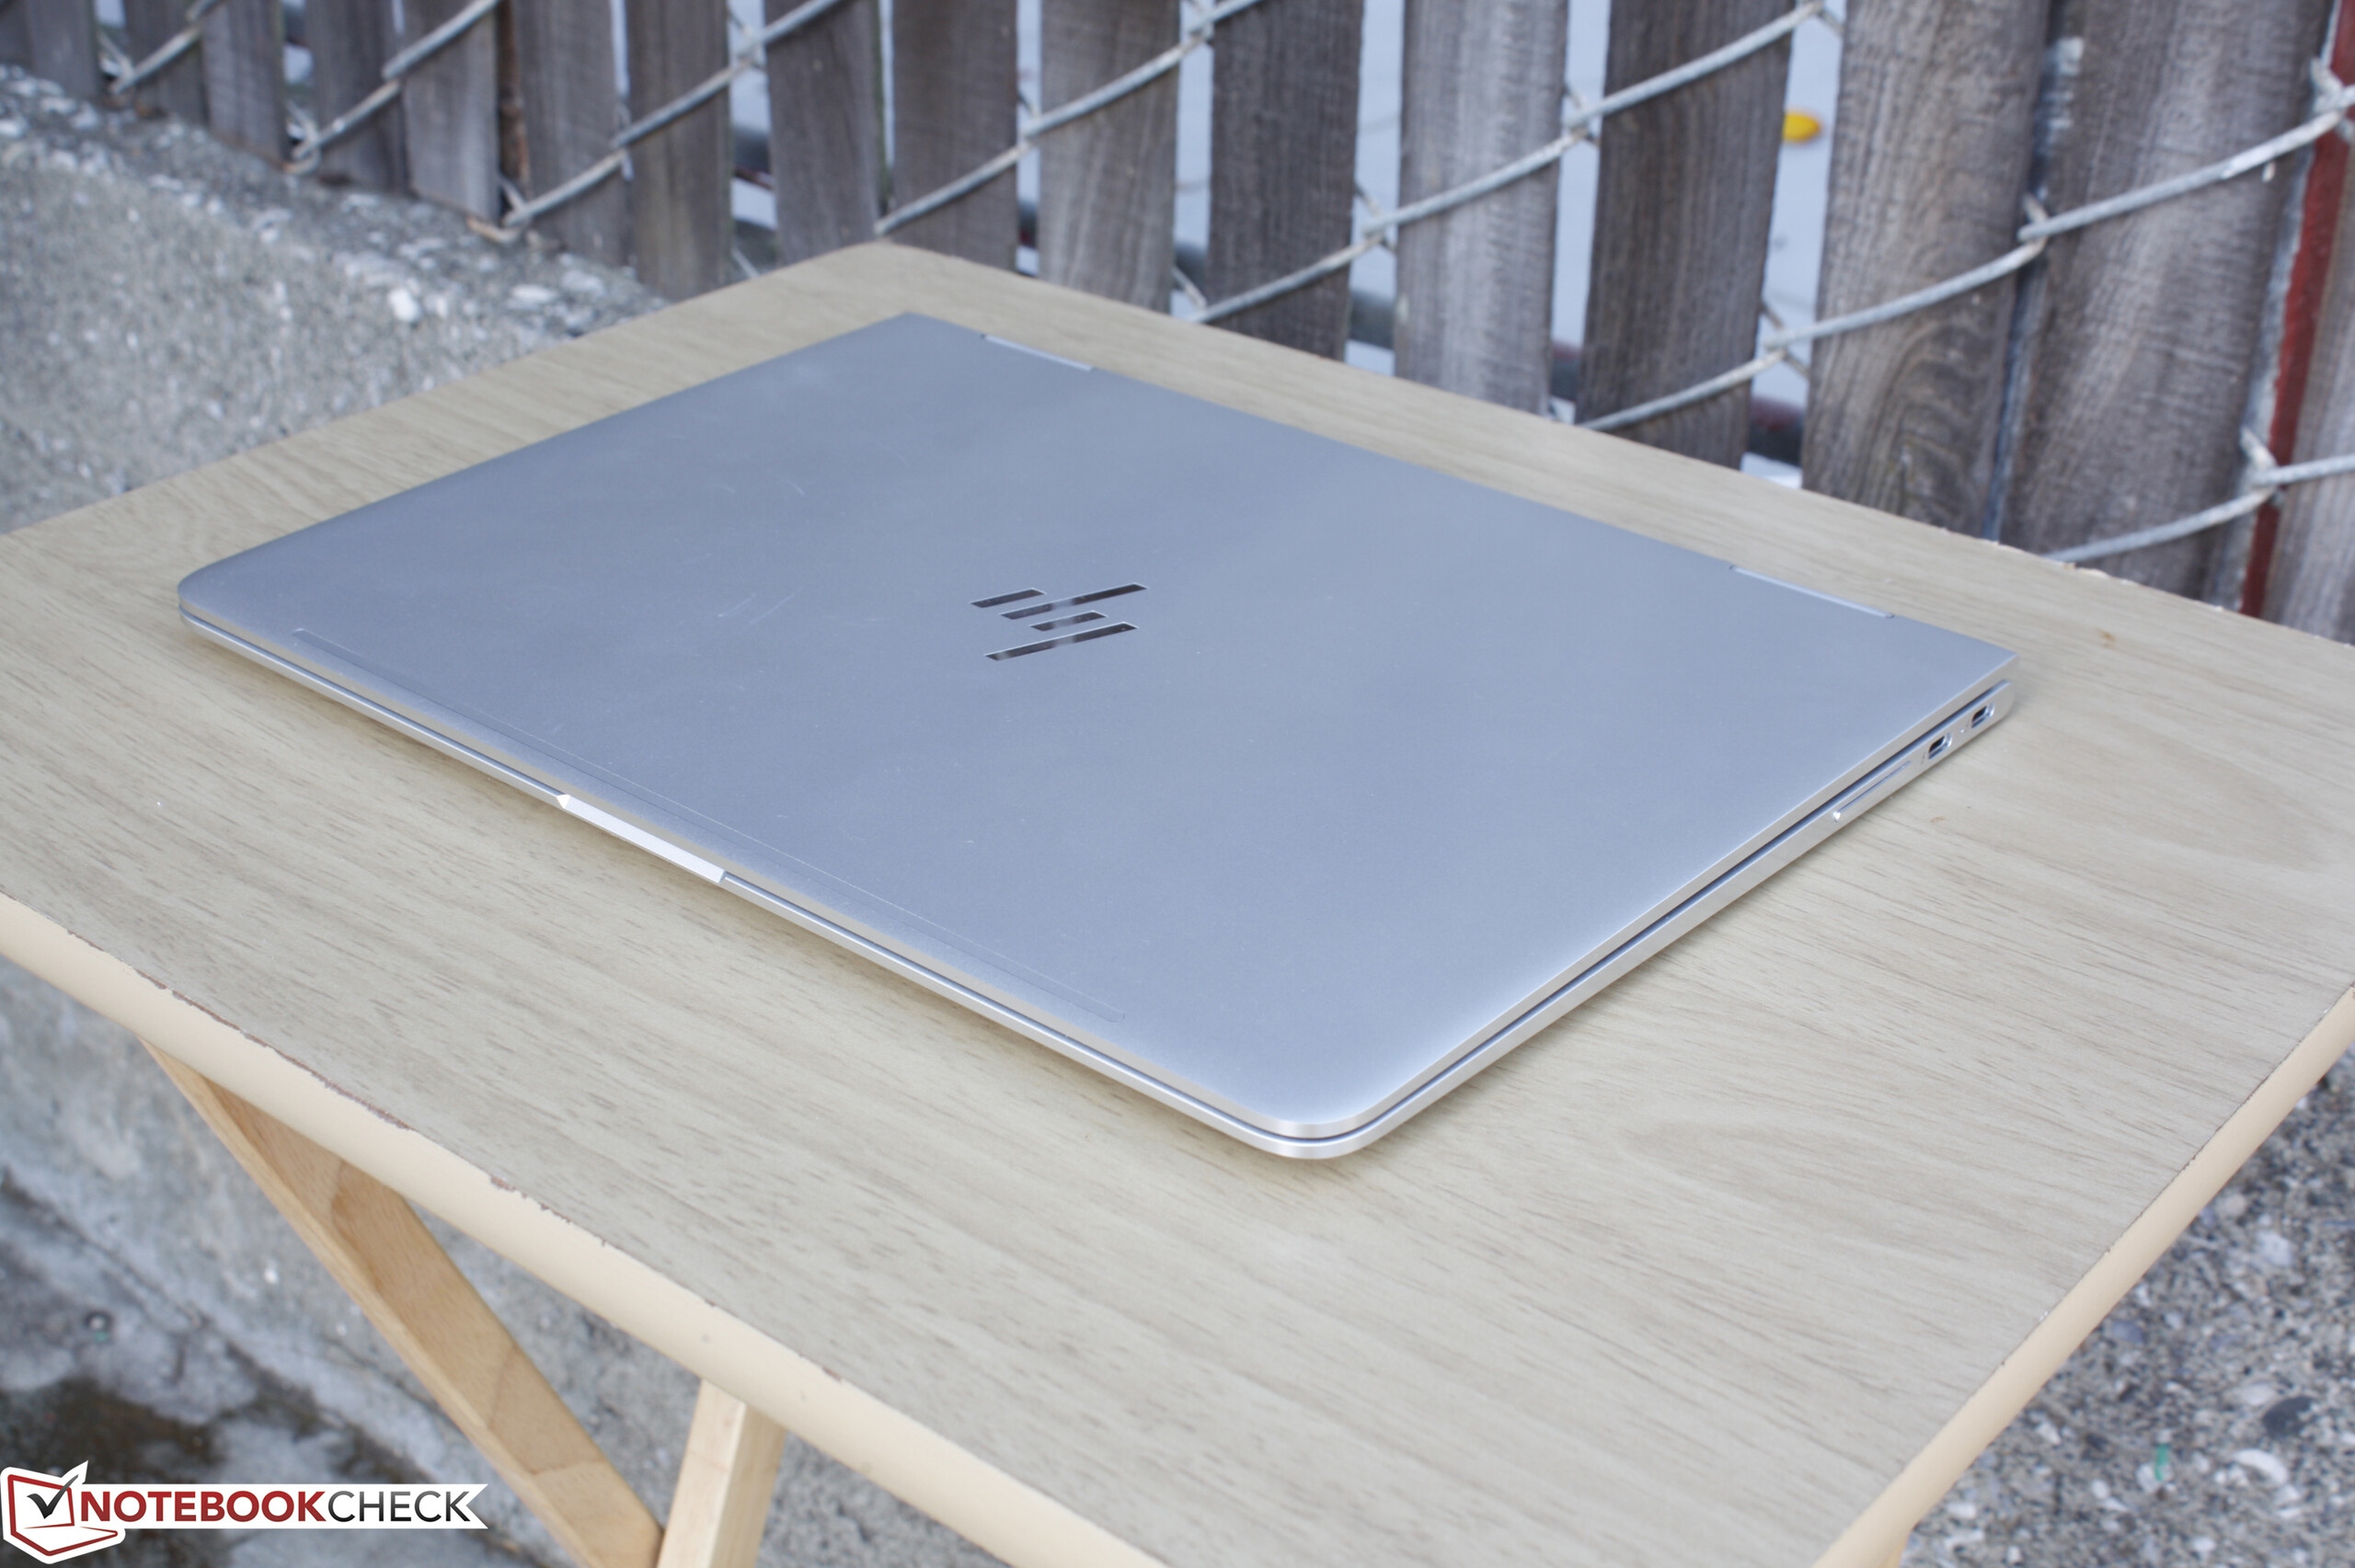
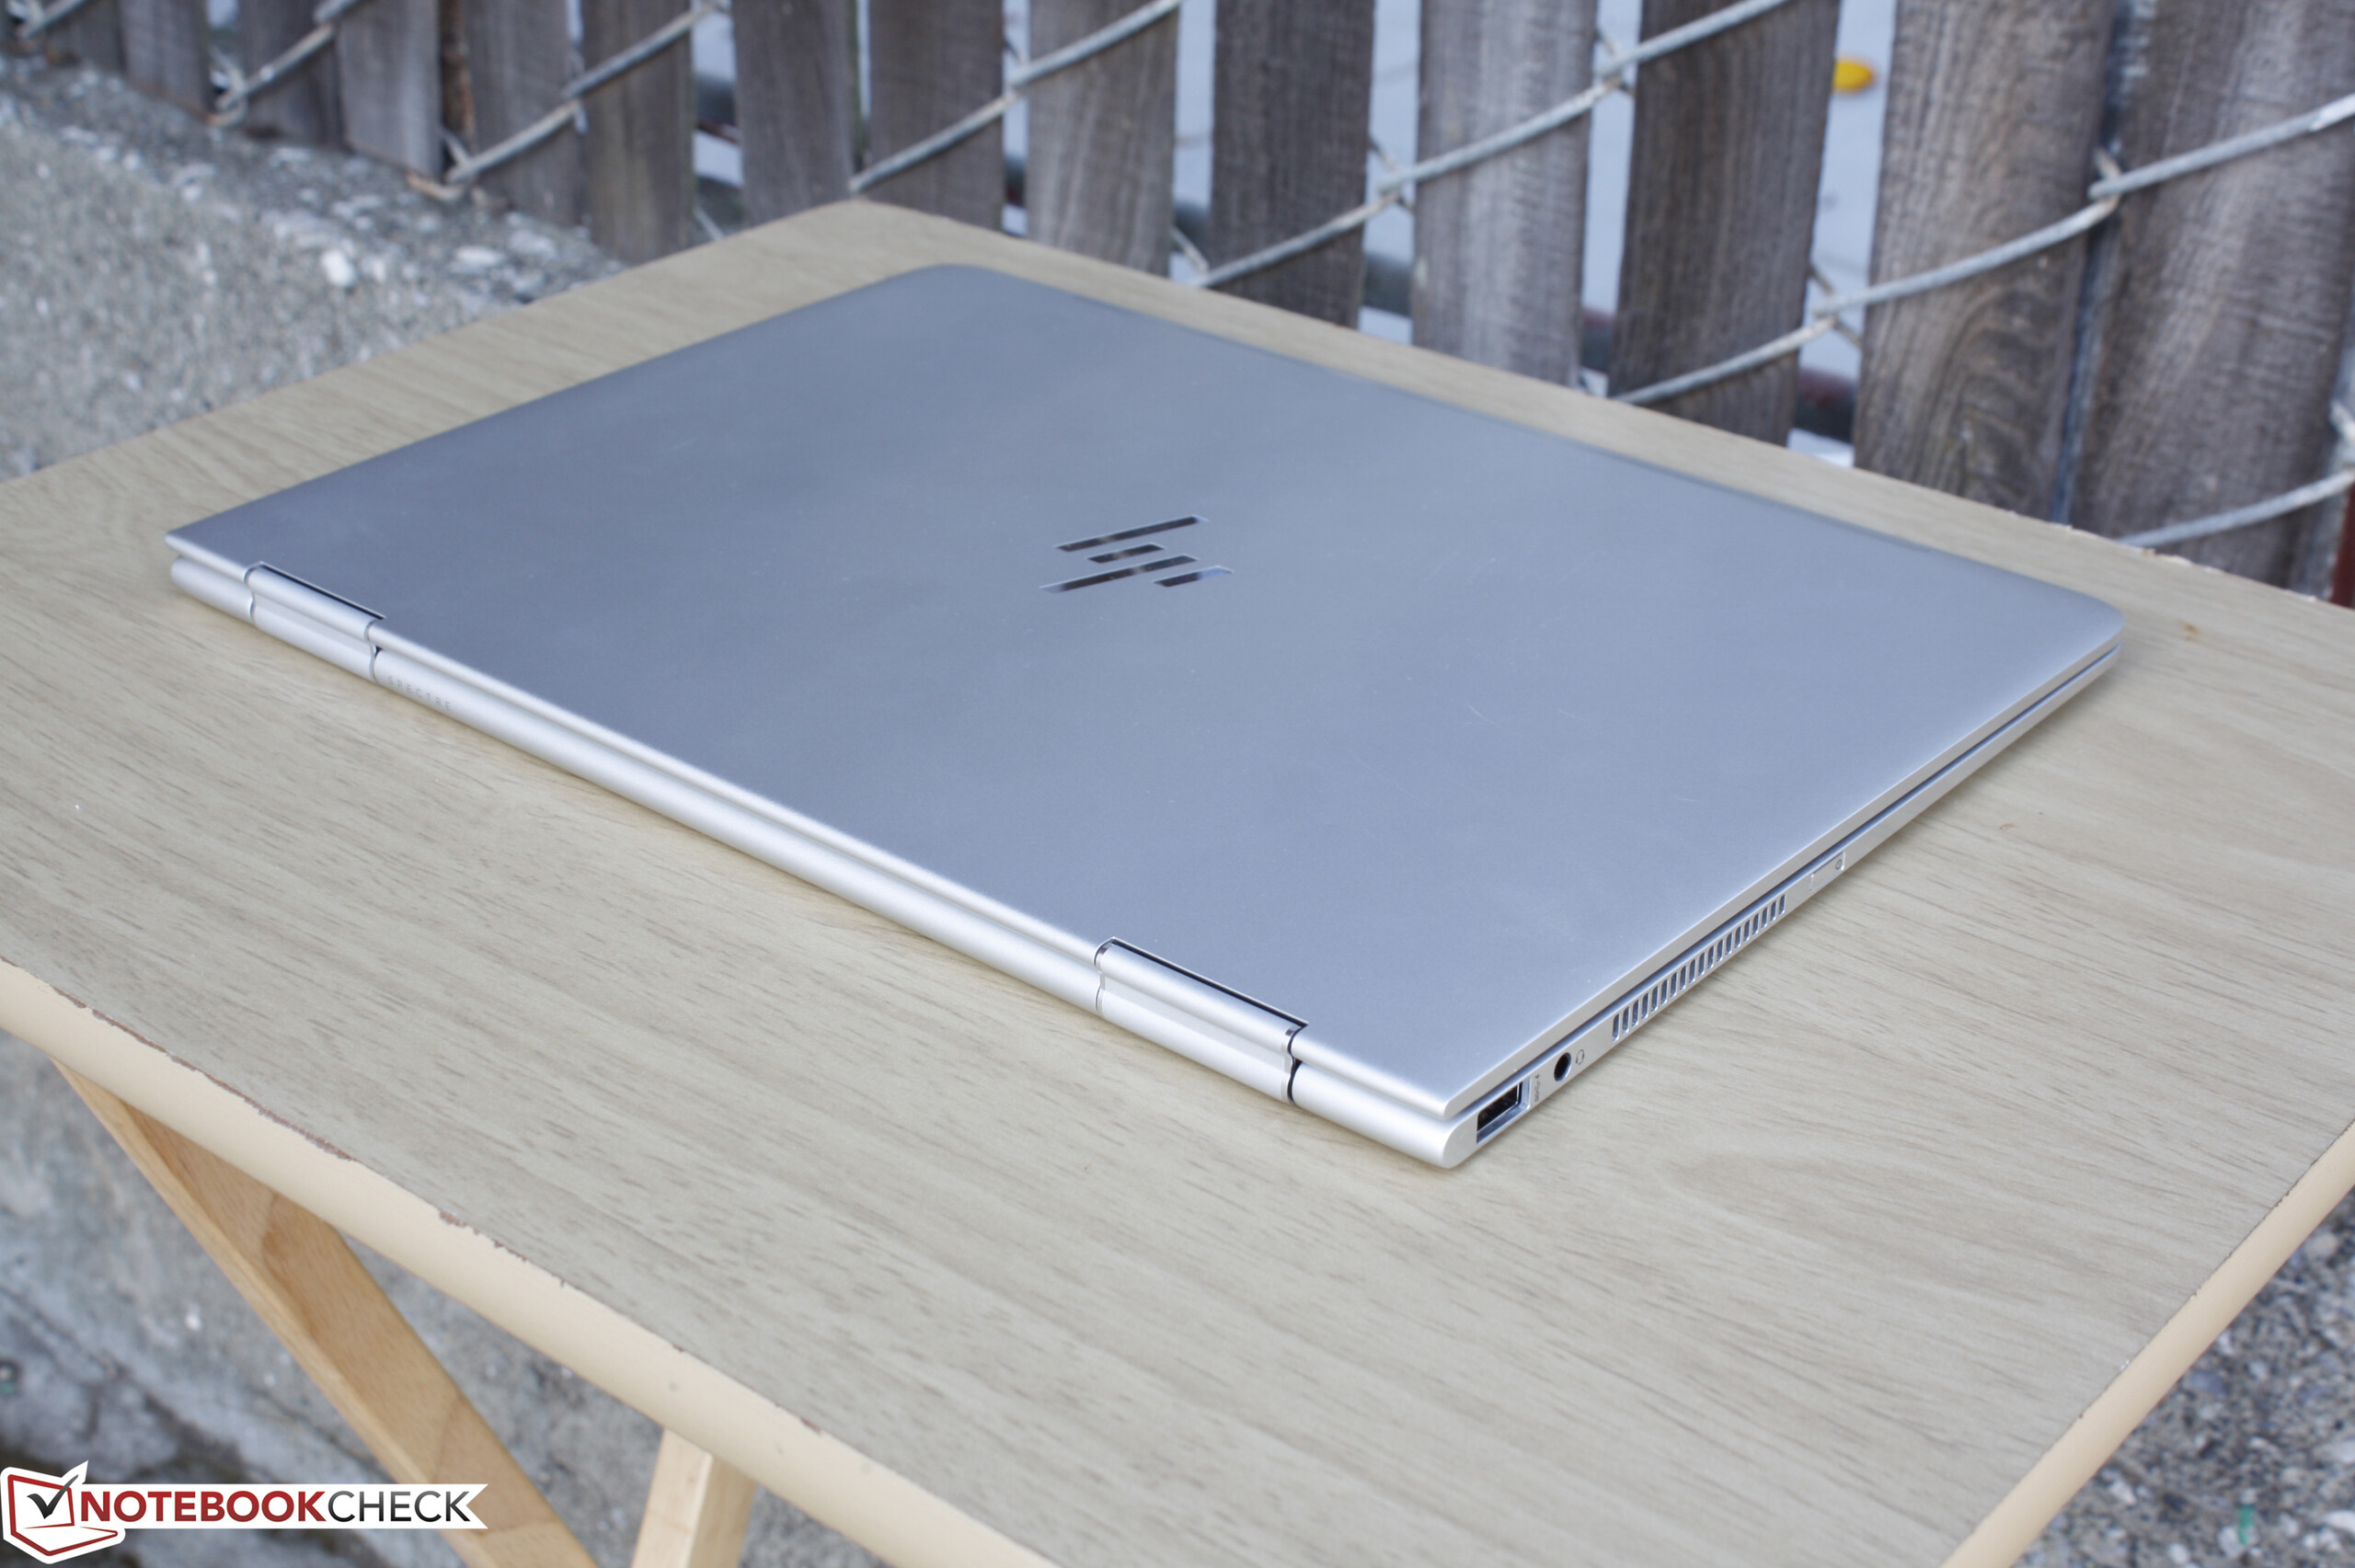
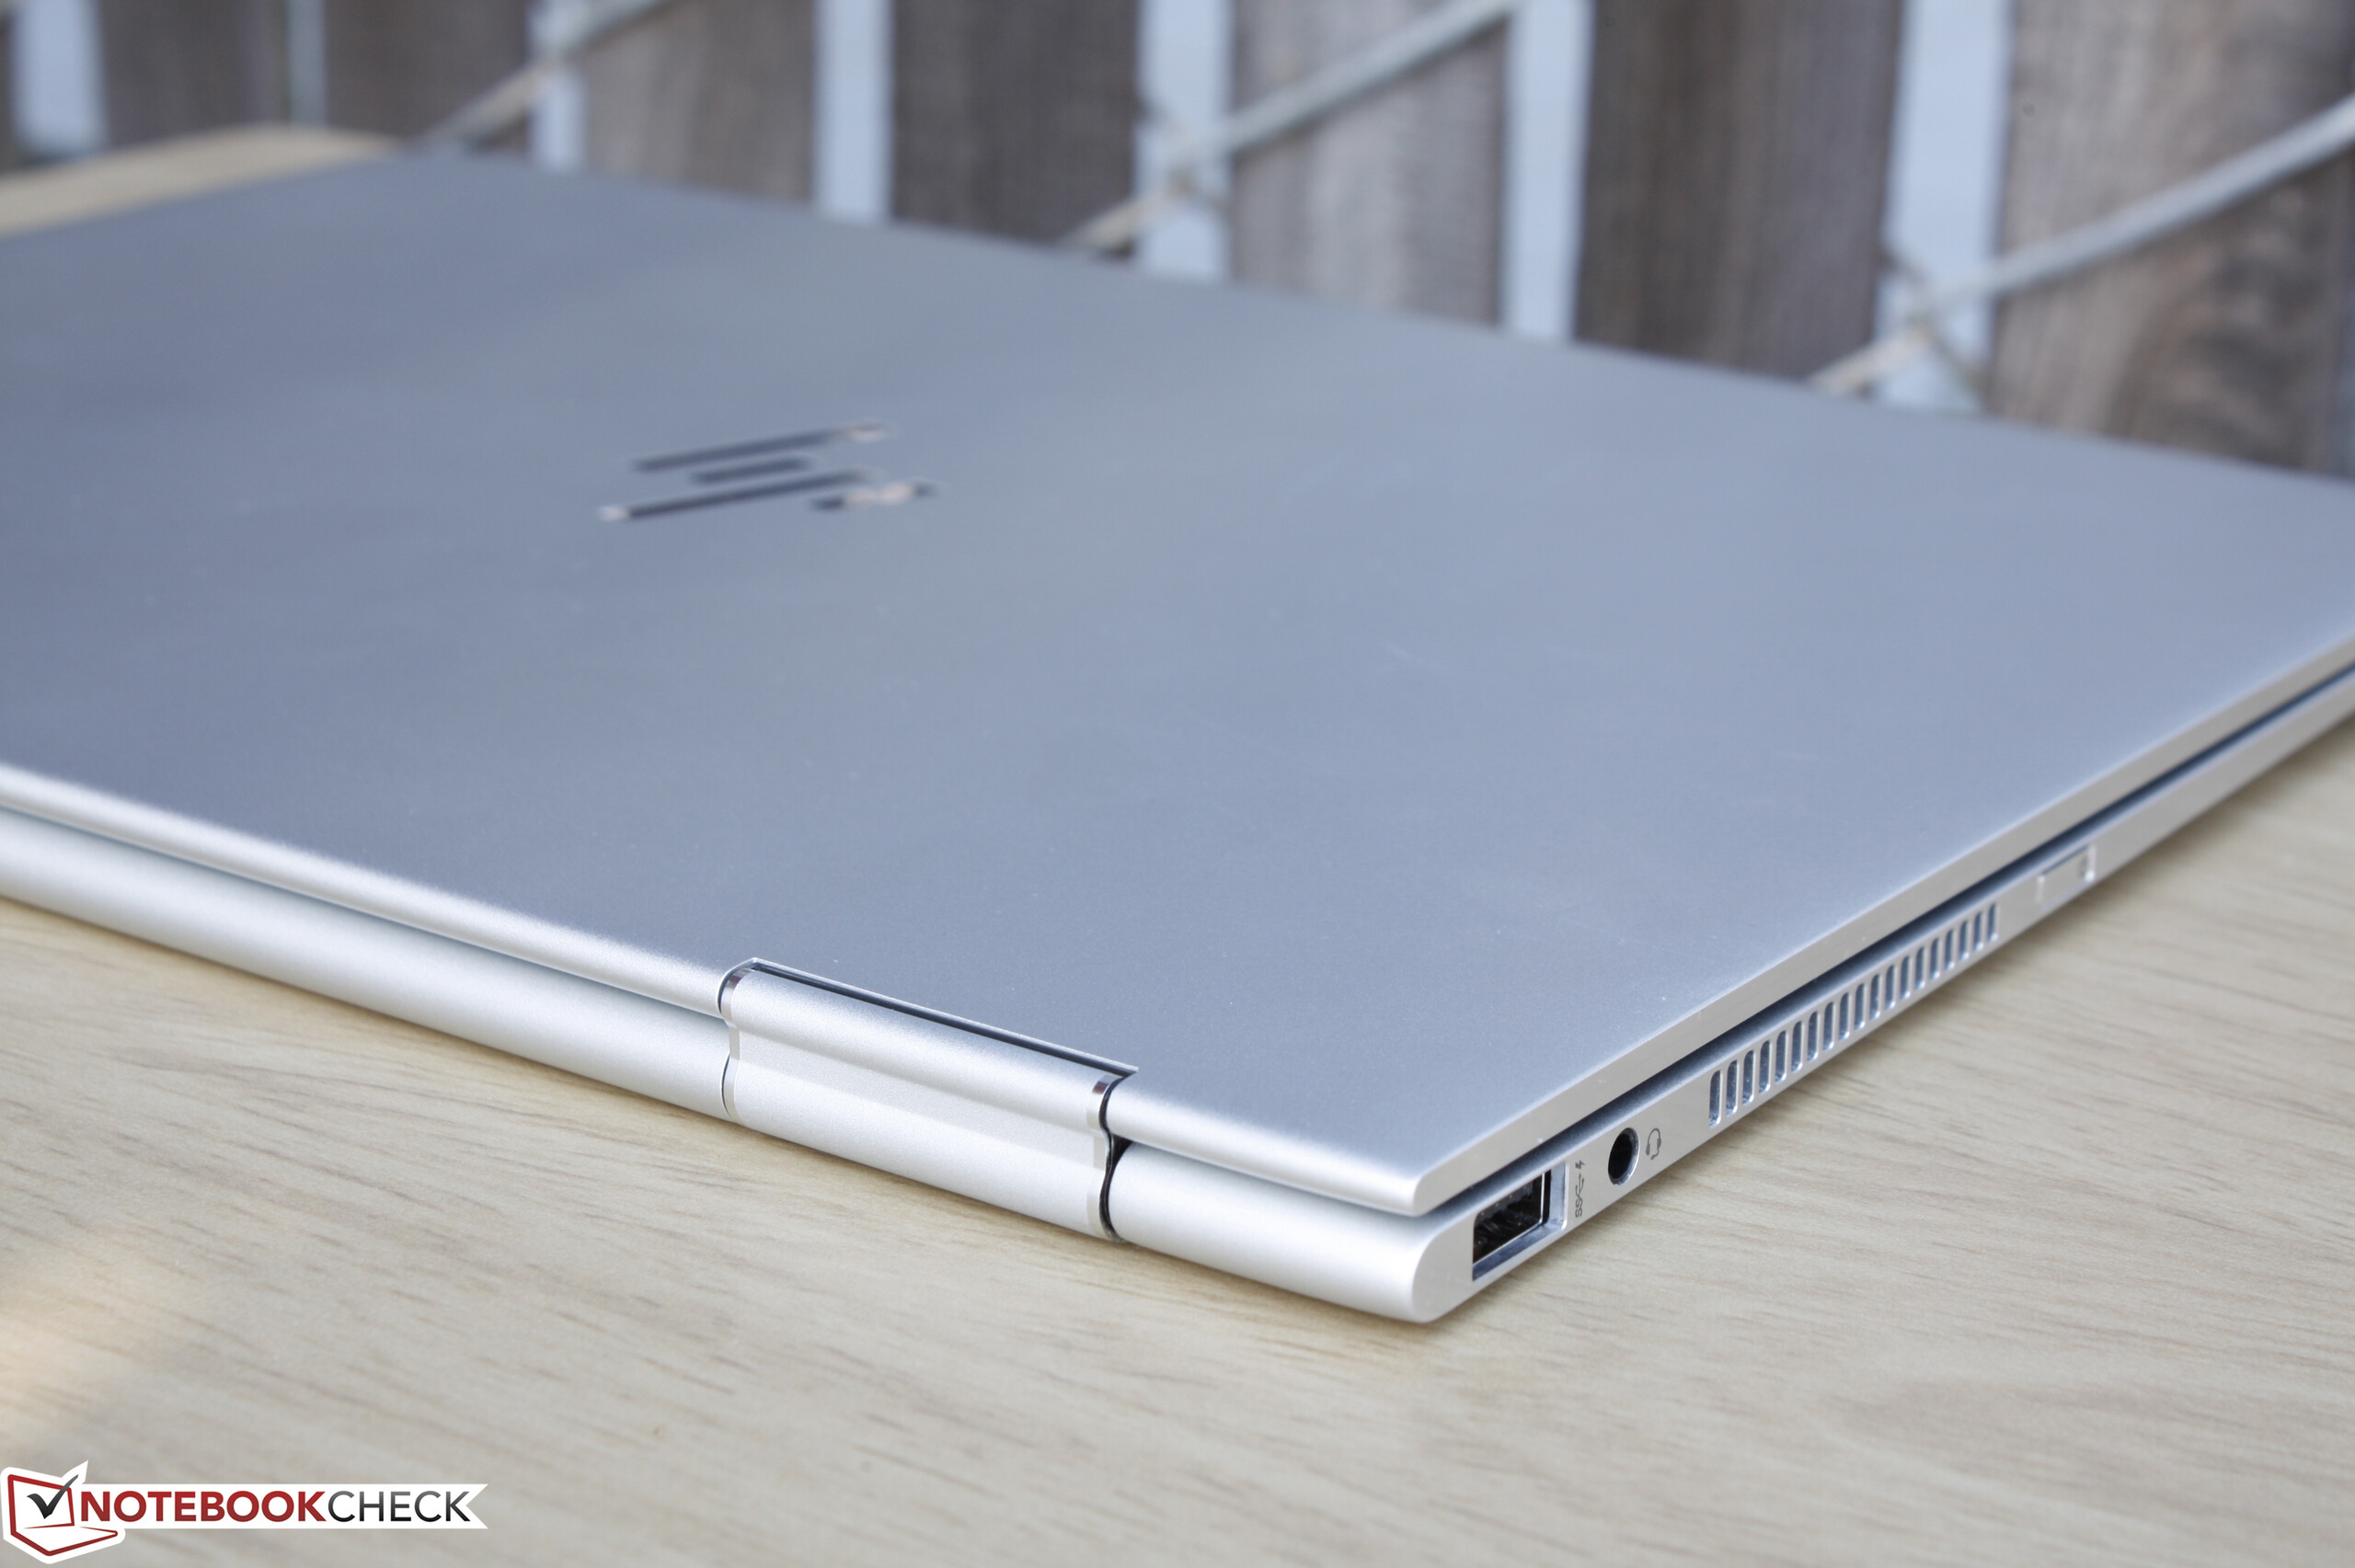
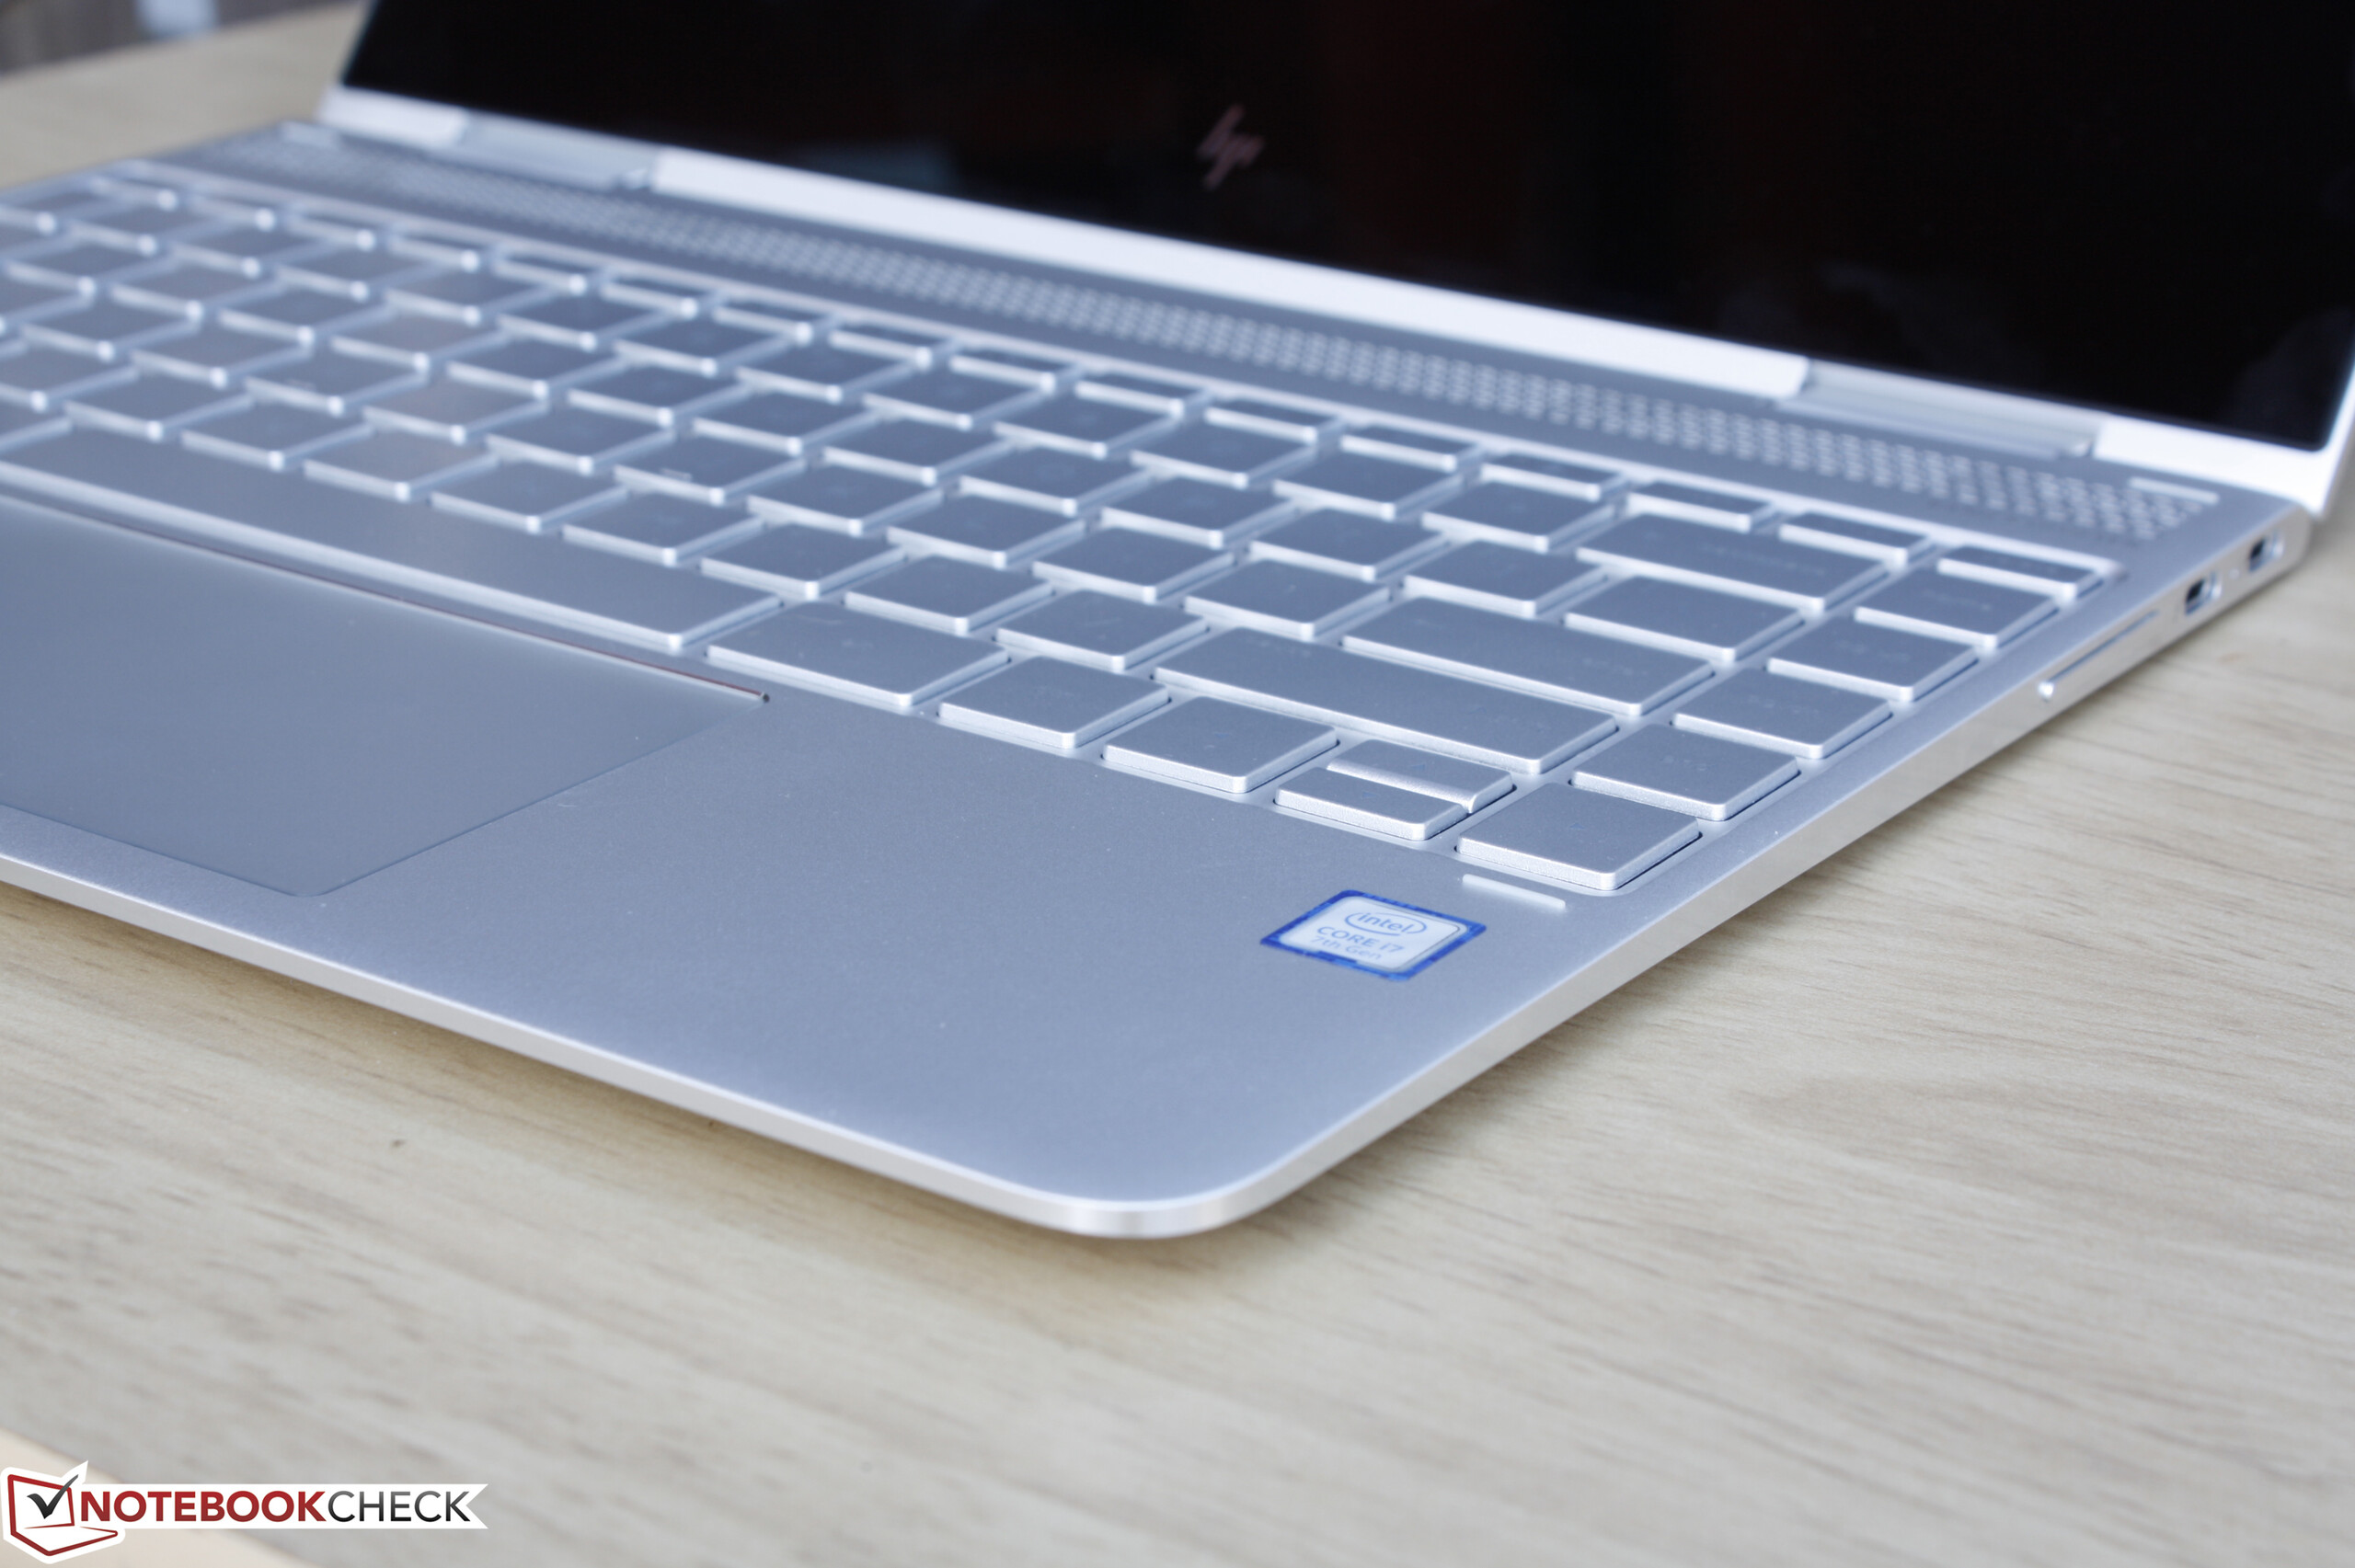
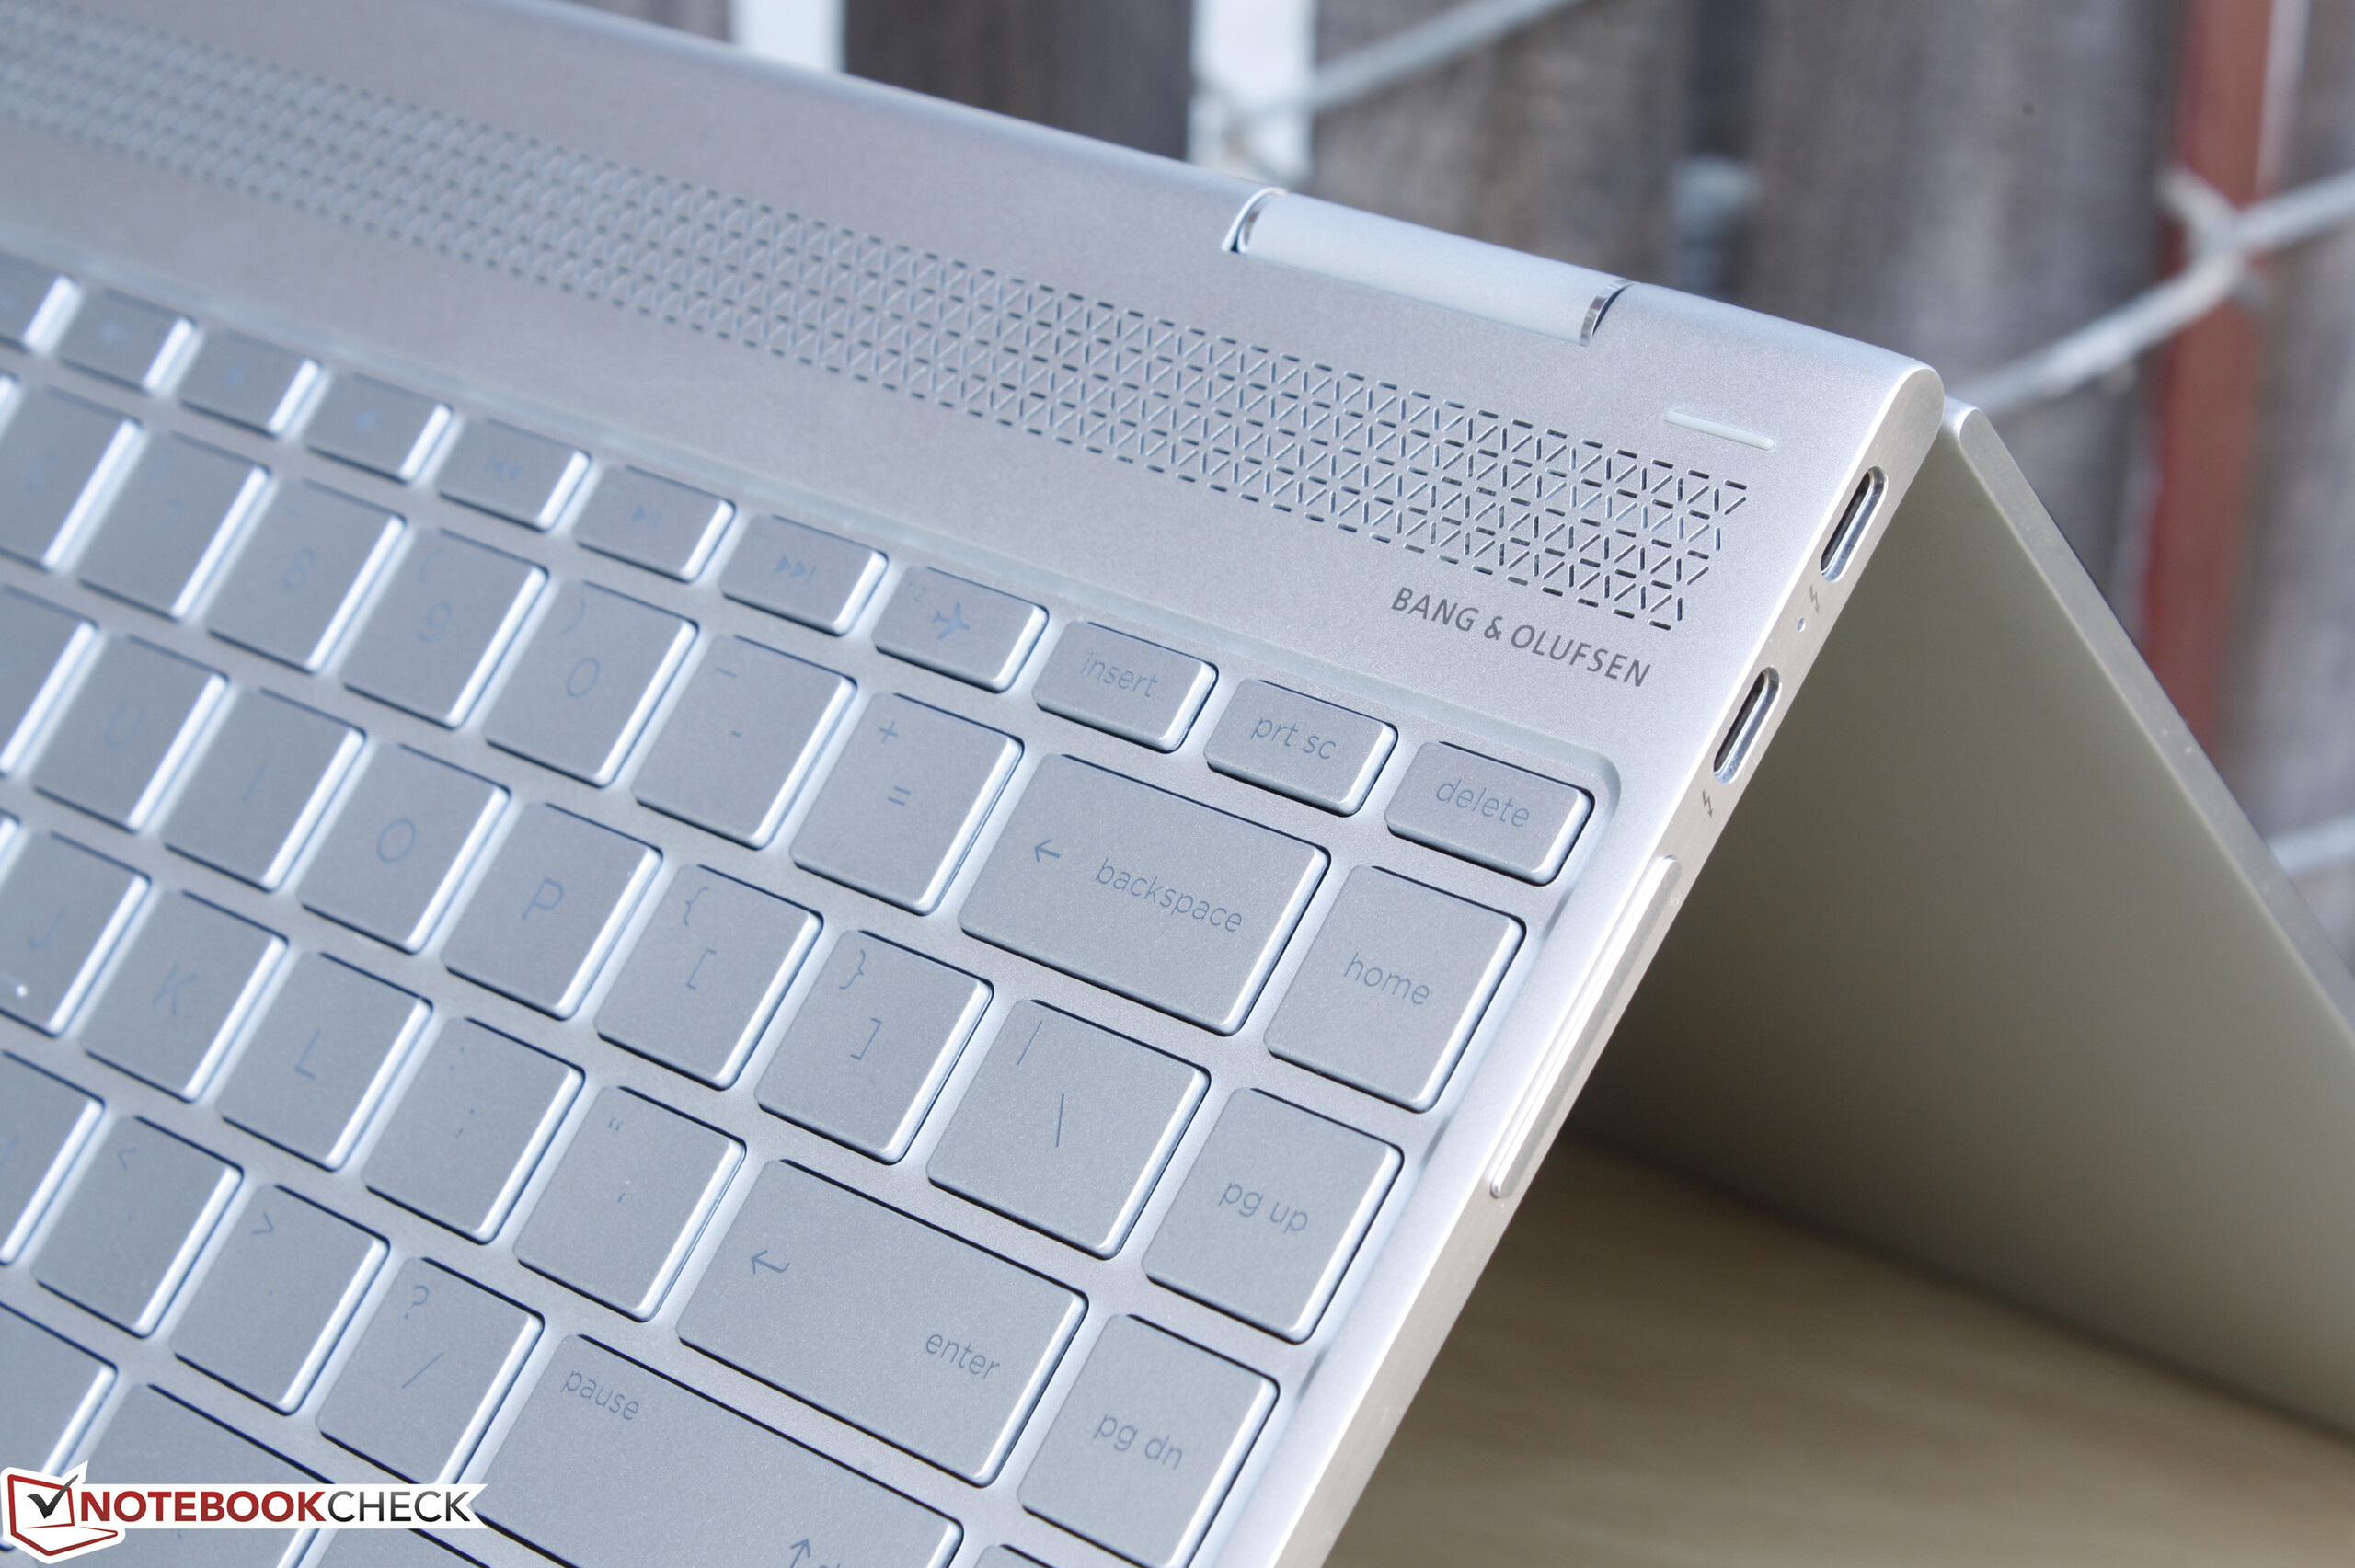
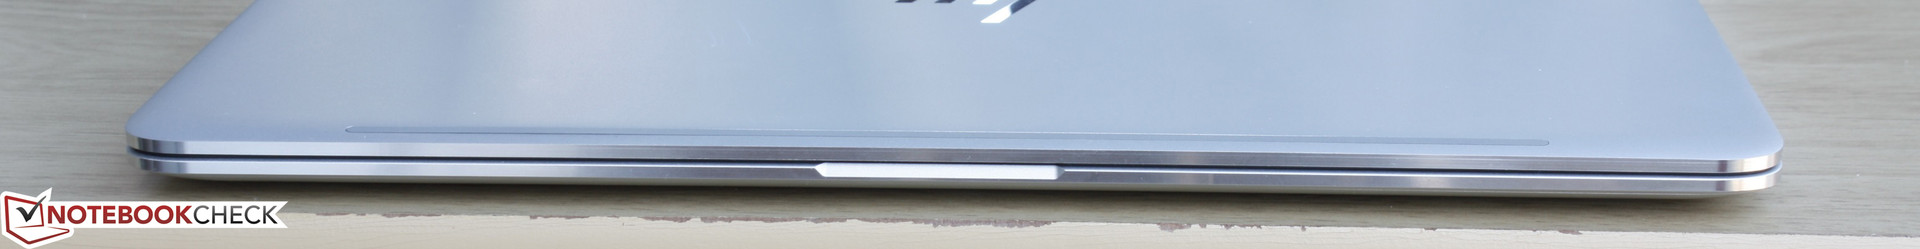
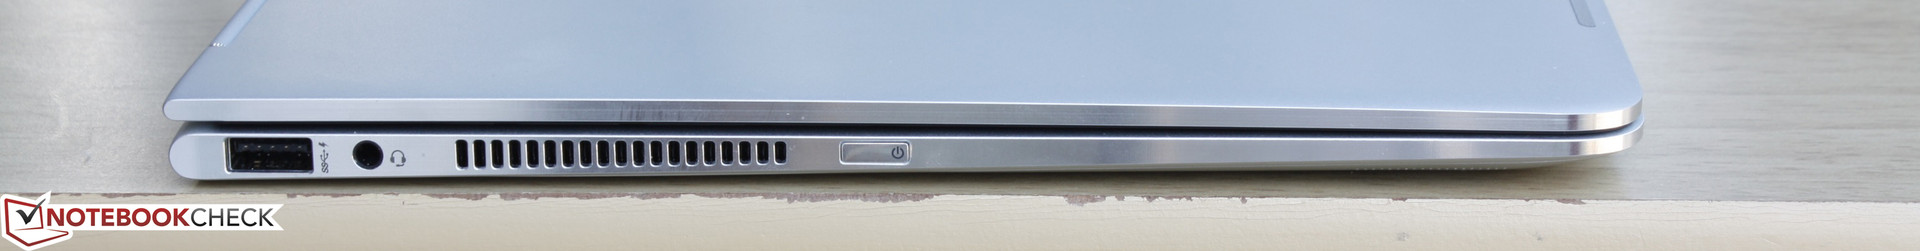
这台惠普变形本的超高便携性和多用性也基于一些妥协,如无microSD读卡器,HDMI/VGA接口等。它的键盘虽然中规中矩,但无法和XPS 13或联想ThinkPad Yoga系列在反馈和键程上相媲美。惠普对新的Spectre采用了极简设计,它可能更适合作为超极本或MacBook Air的竞争对手。我们希望生产商也可以为Spectre x360 15系列搭配同样的窄屏幕边框。
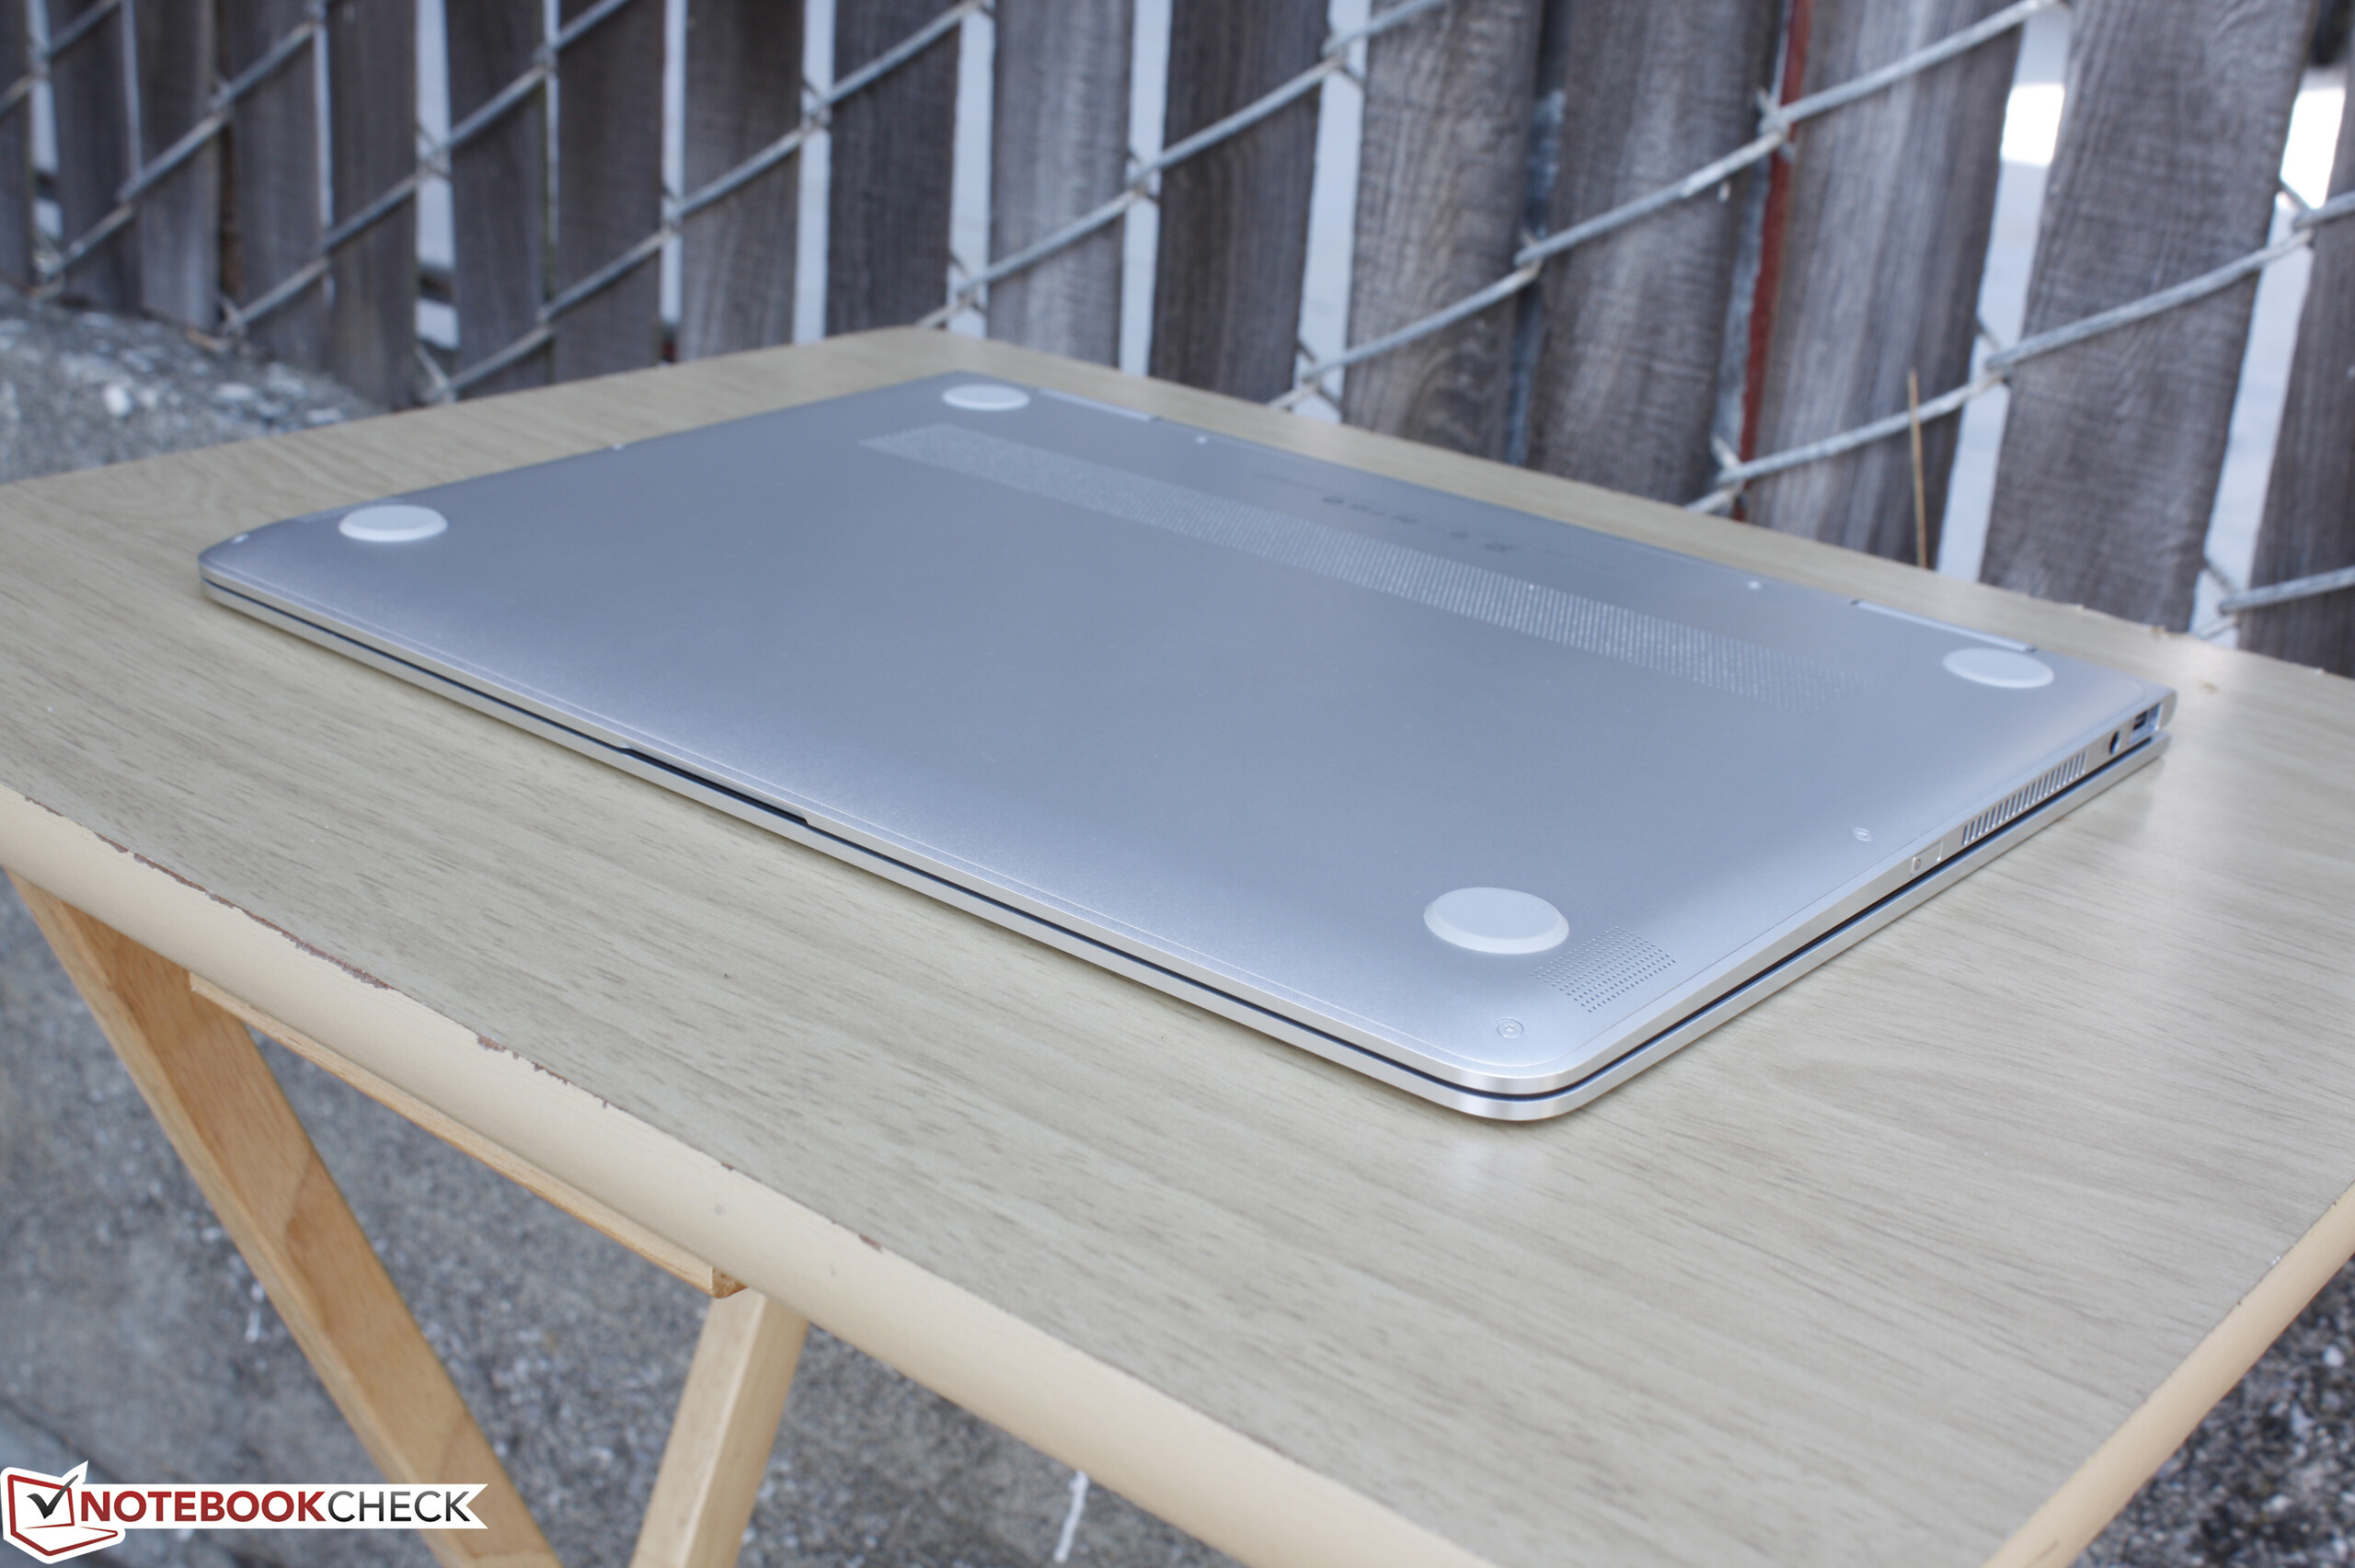
Spectre x360 13在性能上足以作为多媒体笔记本电脑,而同时保证了轻盈便携,可以偶尔作为平板使用。紧凑的机身设计让它作为变形本可以更好地与同类产品竞争。
注:本文是基于完整评测的缩减版本,阅读完整的英文评测,请点击这里。
HP Spectre x360 13-w023dx
-
10/20/2016 v5.1(old)
Allen Ngo
Pricecompare
