 Deutsch
 English
 Español
 Français
 Italiano
 Nederlands
 Polski
 Português
 Русский
 Türkçe
 Svenska
 Chinese
 Magyar
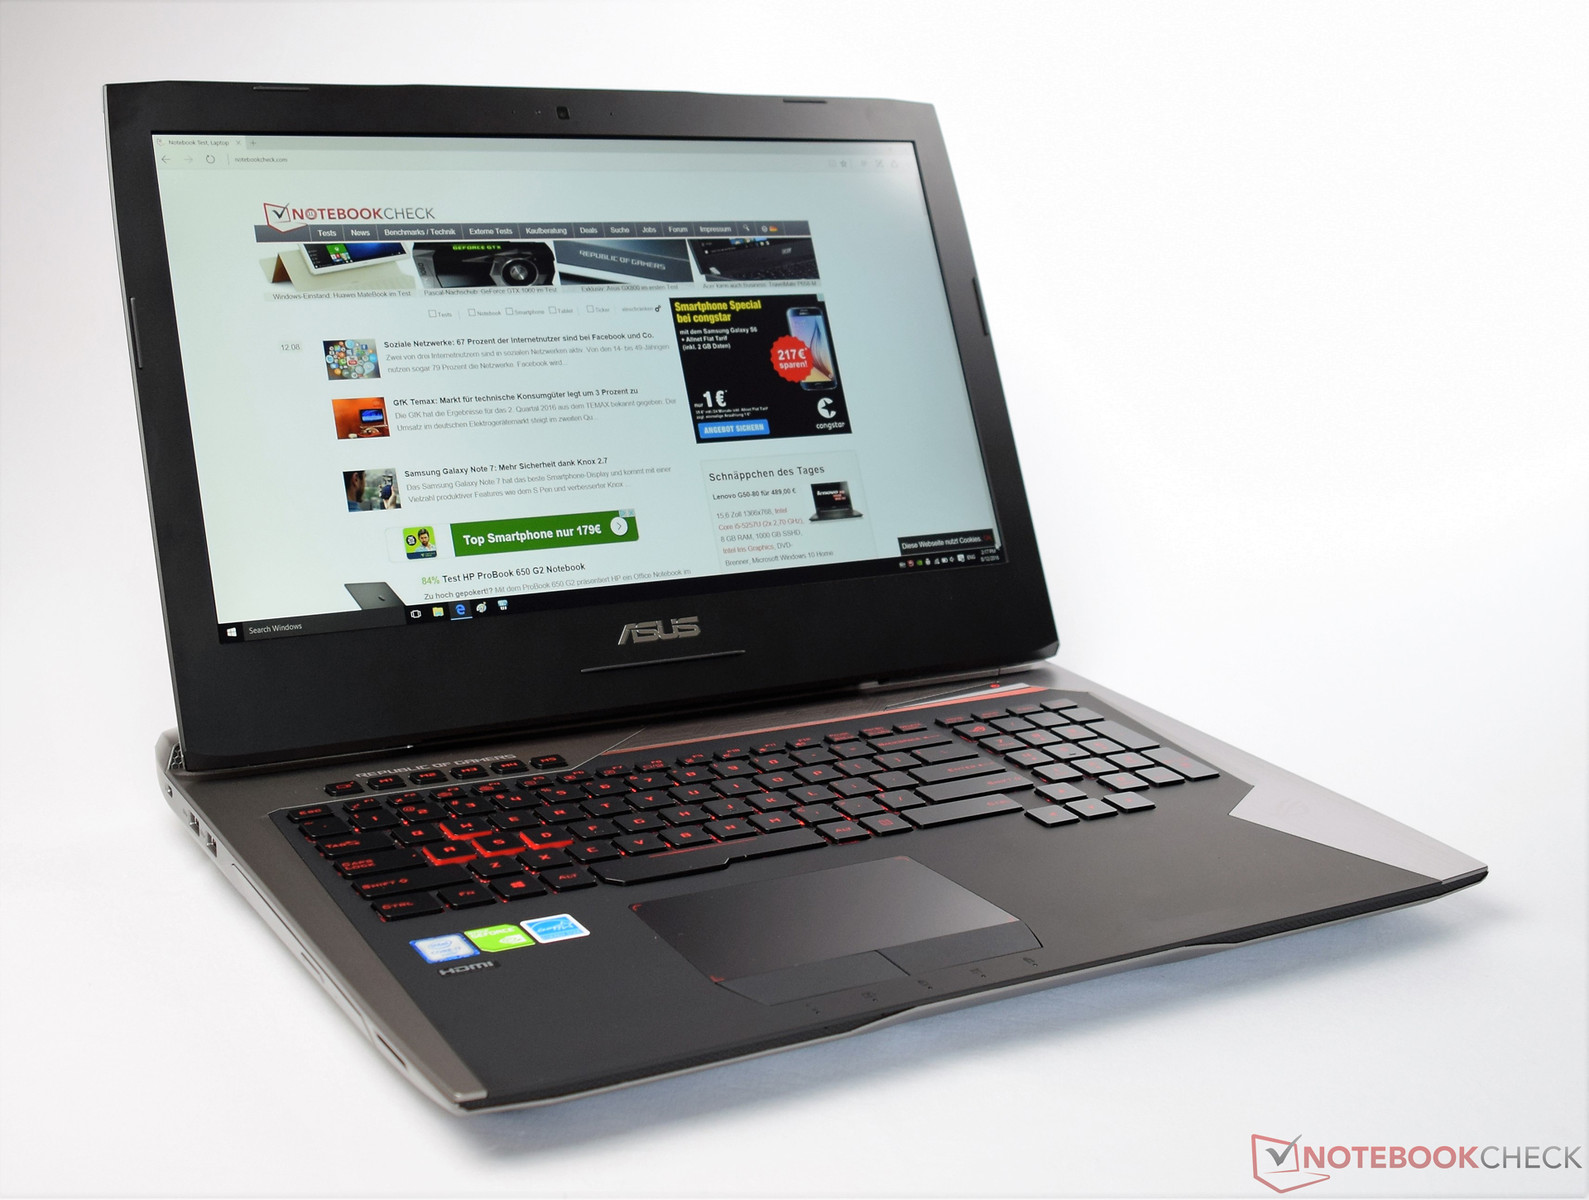
华硕 ROG G752VS 笔记本电脑简短评测

| SD Card Reader | |
| average JPG Copy Test (av. of 3 runs) | |
| SCHENKER XMG U716 | |
| MSI GT62VR-6RE16H21 | |
| MSI GT72VR 6RE-015US | |
| Alienware 17 R3 (A17-9935) | |
| Asus G752VS-XB78K | |
| maximum AS SSD Seq Read Test (1GB) | |
| SCHENKER XMG U716 | |
| MSI GT62VR-6RE16H21 | |
| MSI GT72VR 6RE-015US | |
| Alienware 17 R3 (A17-9935) | |
| Asus G752VS-XB78K | |
| Networking | |
| iperf Server (receive) TCP 1 m | |
| MSI GT62VR-6RE16H21 | |
| Asus G752VS-XB78K | |
| iperf Client (transmit) TCP 1 m | |
| MSI GT62VR-6RE16H21 | |
| Asus G752VS-XB78K | |
| |||||||||||||||||||||||||
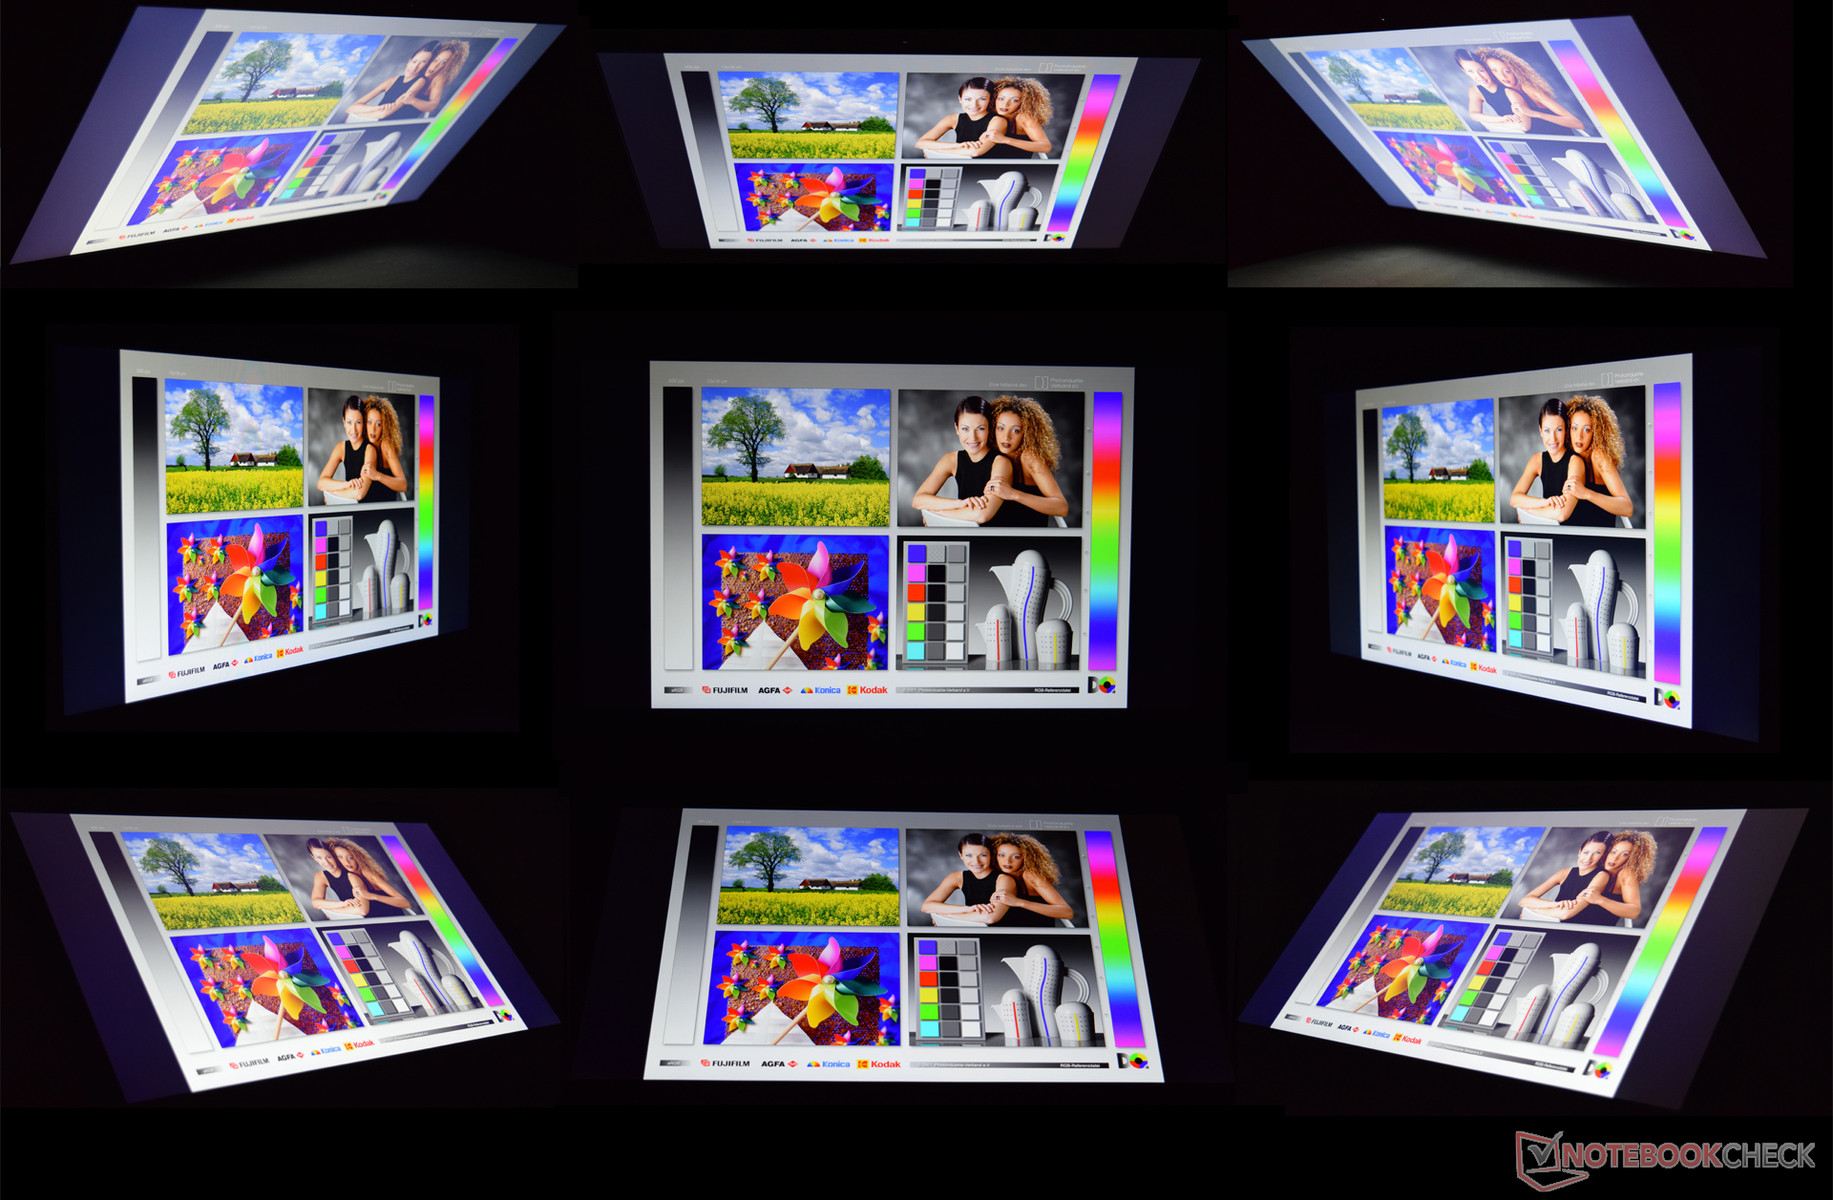
Brightness Distribution: 88 %
Center on Battery: 328 cd/m²
Contrast: 1093:1 (Black: 0.3 cd/m²)
ΔE Color 3.74 | 0.5-29.43 Ø5
ΔE Greyscale 2.67 | 0.57-98 Ø5.3
85% sRGB (Argyll 1.6.3 3D)
56% AdobeRGB 1998 (Argyll 1.6.3 3D)
62.3% AdobeRGB 1998 (Argyll 2.2.0 3D)
85.2% sRGB (Argyll 2.2.0 3D)
66.9% Display P3 (Argyll 2.2.0 3D)
Gamma: 2.41
| Asus G752VS-XB78K LG Philips LP173WF4-SPF3 (LGD04E8), , 1920x1080, 17.30 | MSI GT72VR 6RE-015US LG Philips LGD046E, , 1920x1080, 17.30 | MSI GT62VR-6RE16H21 LG Philips LP156WF6 (LGD046F), , 1920x1080, 15.60 | Asus G752VT 1920x1080, 17.30 | Alienware 17 R3 (A17-9935) CV69H_173WF4 (LGD0459), , 1920x1080, 17.30 | MSI GT80S 6QF Samsung 184HL (SDC4C48), , 1920x1080, 18.40 | SCHENKER XMG U716 AU B173ZAN01.0 (AUO109B), , 3840x2160, 17.30 | Acer Predator 15 G9-591-74ZV LG LP156WF6-SPP1 (LGD04D5), , 1920x1080, 15.60 | |
|---|---|---|---|---|---|---|---|---|
| Display | 2% | -2% | -1% | -1% | 3% | 35% | 0% | |
| Display P3 Coverage | 66.9 | 68.3 2% | 64.6 -3% | 66.3 -1% | 66.9 0% | 65.5 -2% | 86.5 29% | 66 -1% |
| sRGB Coverage | 85.2 | 86.7 2% | 84.6 -1% | 84.5 -1% | 83.9 -2% | 89.2 5% | 100 17% | 85.8 1% |
| AdobeRGB 1998 Coverage | 62.3 | 63.4 2% | 61.8 -1% | 61.8 -1% | 61.4 -1% | 65.2 5% | 99 59% | 62.7 1% |
| Response Times | -3% | 6% | -2% | 4% | 9% | -23% | 2% | |
| Response Time Grey 50% / Grey 80% * | 38 ? | 34.4 ? 9% | 34 ? 11% | 30.4 ? 20% | 33 ? 13% | 35 ? 8% | 45 ? -18% | 31 ? 18% |
| Response Time Black / White * | 22 ? | 25.2 ? -15% | 22 ? -0% | 27.2 ? -24% | 23 ? -5% | 20 ? 9% | 28 ? -27% | 25 ? -14% |
| PWM Frequency | 250 ? | |||||||
| Screen | 2% | -2% | -4% | -14% | -1% | -4% | -6% | |
| Brightness middle | 328 | 348.7 6% | 273 -17% | 357.2 9% | 360 10% | 298 -9% | 374 14% | 310 -5% |
| Brightness | 317 | 327 3% | 278 -12% | 339 7% | 336 6% | 265 -16% | 356 12% | 287 -9% |
| Brightness Distribution | 88 | 89 1% | 88 0% | 89 1% | 90 2% | 78 -11% | 88 0% | 86 -2% |
| Black Level * | 0.3 | 0.323 -8% | 0.27 10% | 0.366 -22% | 0.44 -47% | 0.35 -17% | 0.4 -33% | 0.36 -20% |
| Contrast | 1093 | 1080 -1% | 1011 -8% | 976 -11% | 818 -25% | 851 -22% | 935 -14% | 861 -21% |
| Colorchecker dE 2000 * | 3.74 | 4.09 -9% | 3.67 2% | 3.69 1% | 4.76 -27% | 2.72 27% | 4.23 -13% | 3.83 -2% |
| Colorchecker dE 2000 max. * | 8.97 | 9.02 -1% | 8.33 7% | 10.8 -20% | 5.4 40% | 6.7 25% | ||
| Greyscale dE 2000 * | 2.67 | 2.14 20% | 2.73 -2% | 3.05 -14% | 3.69 -38% | 3 -12% | 5.48 -105% | 2.53 5% |
| Gamma | 2.41 91% | 2.25 98% | 2.49 88% | 2.21 100% | 2.24 98% | 2.36 93% | 2.35 94% | 2.42 91% |
| CCT | 6861 95% | 6885 94% | 7029 92% | 6164 105% | 6091 107% | 6995 93% | 6686 97% | 6934 94% |
| Color Space (Percent of AdobeRGB 1998) | 56 | 56.9 2% | 55 -2% | 55 -2% | 55 -2% | 58 4% | 88 57% | 56 0% |
| Color Space (Percent of sRGB) | 85 | 86.5 2% | 84 -1% | 84 -1% | 84 -1% | 89 5% | 100 18% | 86 1% |
| Total Average (Program / Settings) | 0% /
1% | 1% /
-1% | -2% /
-3% | -4% /
-9% | 4% /
1% | 3% /
1% | -1% /
-3% |
* ... smaller is better
Display Response Times
| ↔ Response Time Black to White | ||
|---|---|---|
| 22 ms ... rise ↗ and fall ↘ combined | ↗ 4 ms rise | 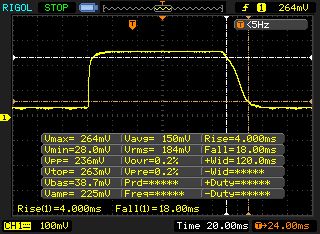 |
| ↘ 18 ms fall | ||
| The screen shows good response rates in our tests, but may be too slow for competitive gamers. In comparison, all tested devices range from 0.1 (minimum) to 240 (maximum) ms. » 42 % of all devices are better. This means that the measured response time is similar to the average of all tested devices (21.5 ms). | ||
| ↔ Response Time 50% Grey to 80% Grey | ||
| 38 ms ... rise ↗ and fall ↘ combined | ↗ 14 ms rise | 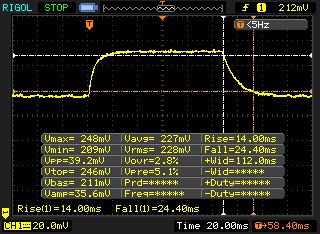 |
| ↘ 24 ms fall | ||
| The screen shows slow response rates in our tests and will be unsatisfactory for gamers. In comparison, all tested devices range from 0.2 (minimum) to 636 (maximum) ms. » 49 % of all devices are better. This means that the measured response time is worse than the average of all tested devices (33.7 ms). | ||
Screen Flickering / PWM (Pulse-Width Modulation)
| Screen flickering / PWM not detected | 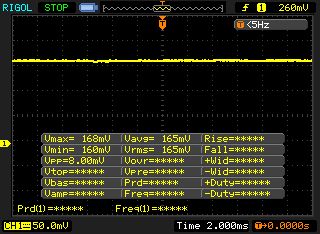 | ||
In comparison: 53 % of all tested devices do not use PWM to dim the display. If PWM was detected, an average of 17924 (minimum: 5 - maximum: 3846000) Hz was measured. | |||
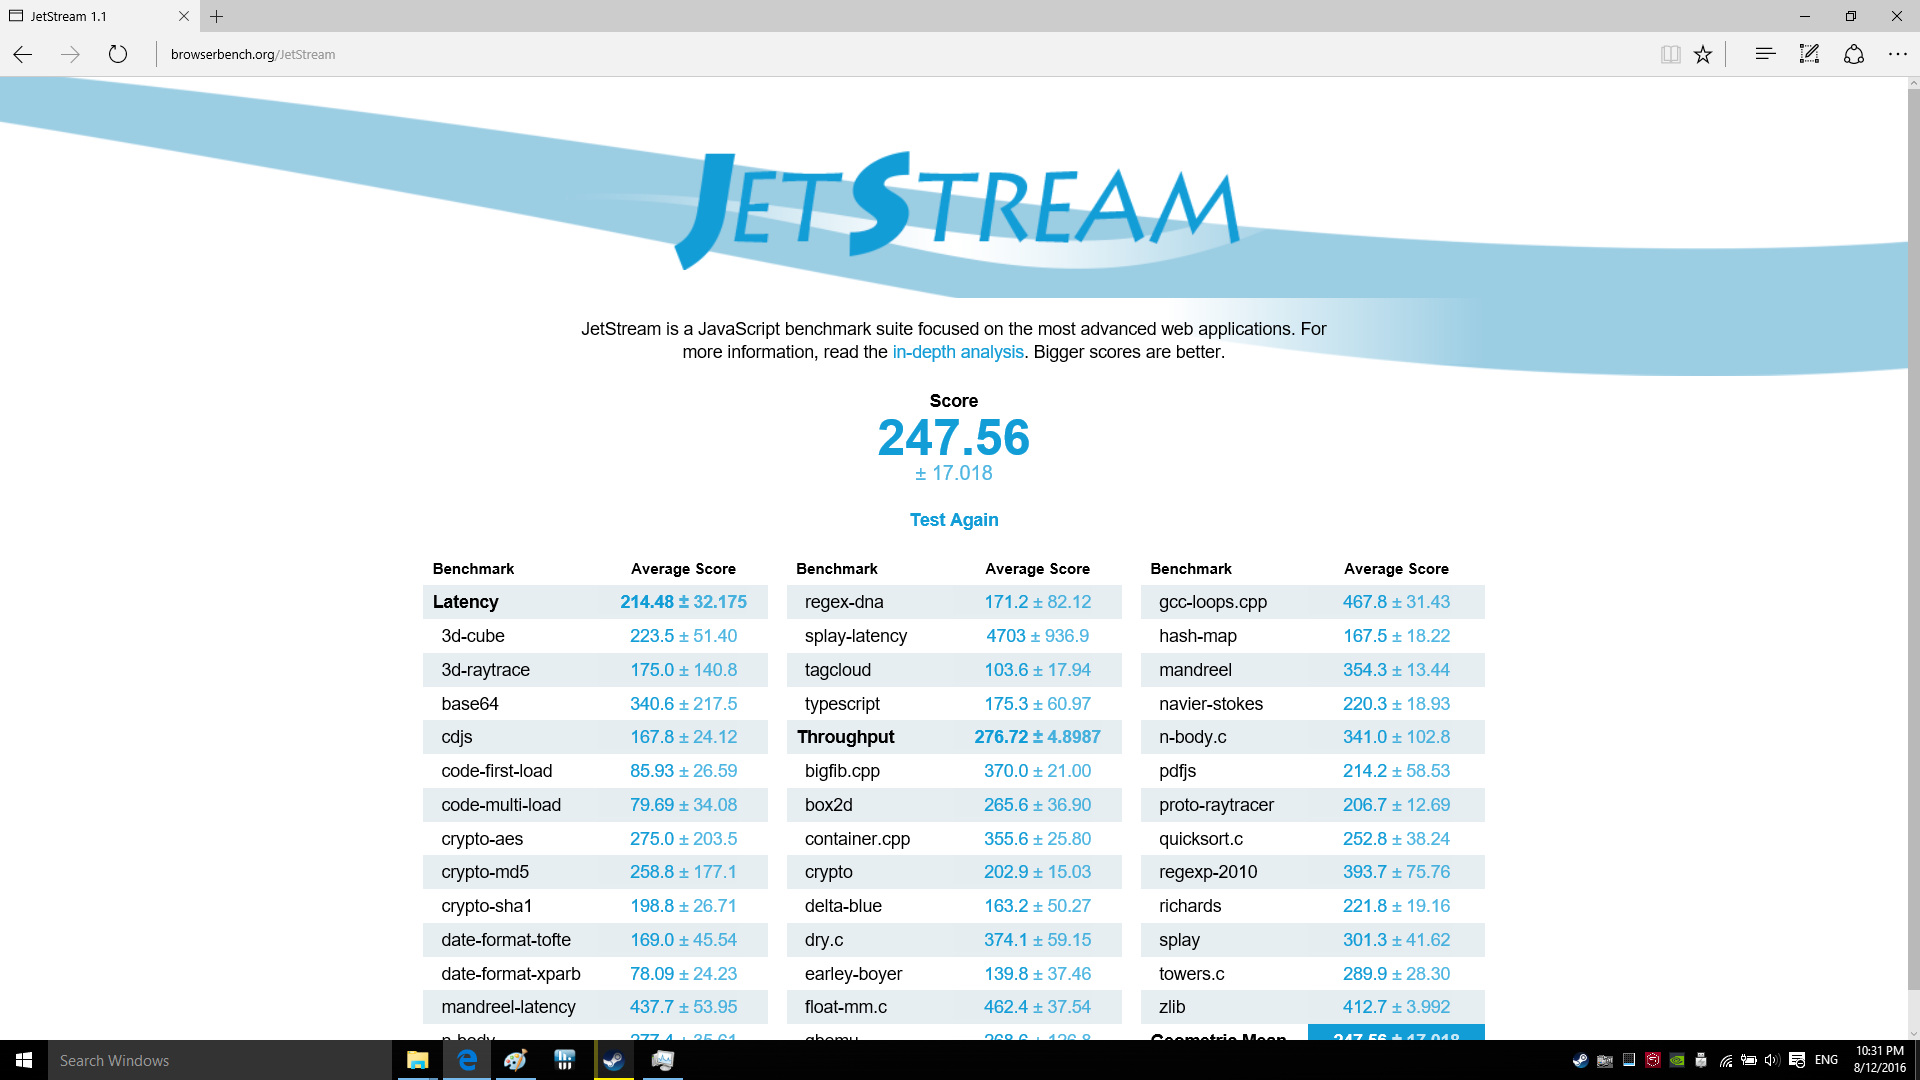
| JetStream 1.1 - Total Score | |
| Asus G752VS-XB78K | |
| MSI GT72VR 6RE-015US | |
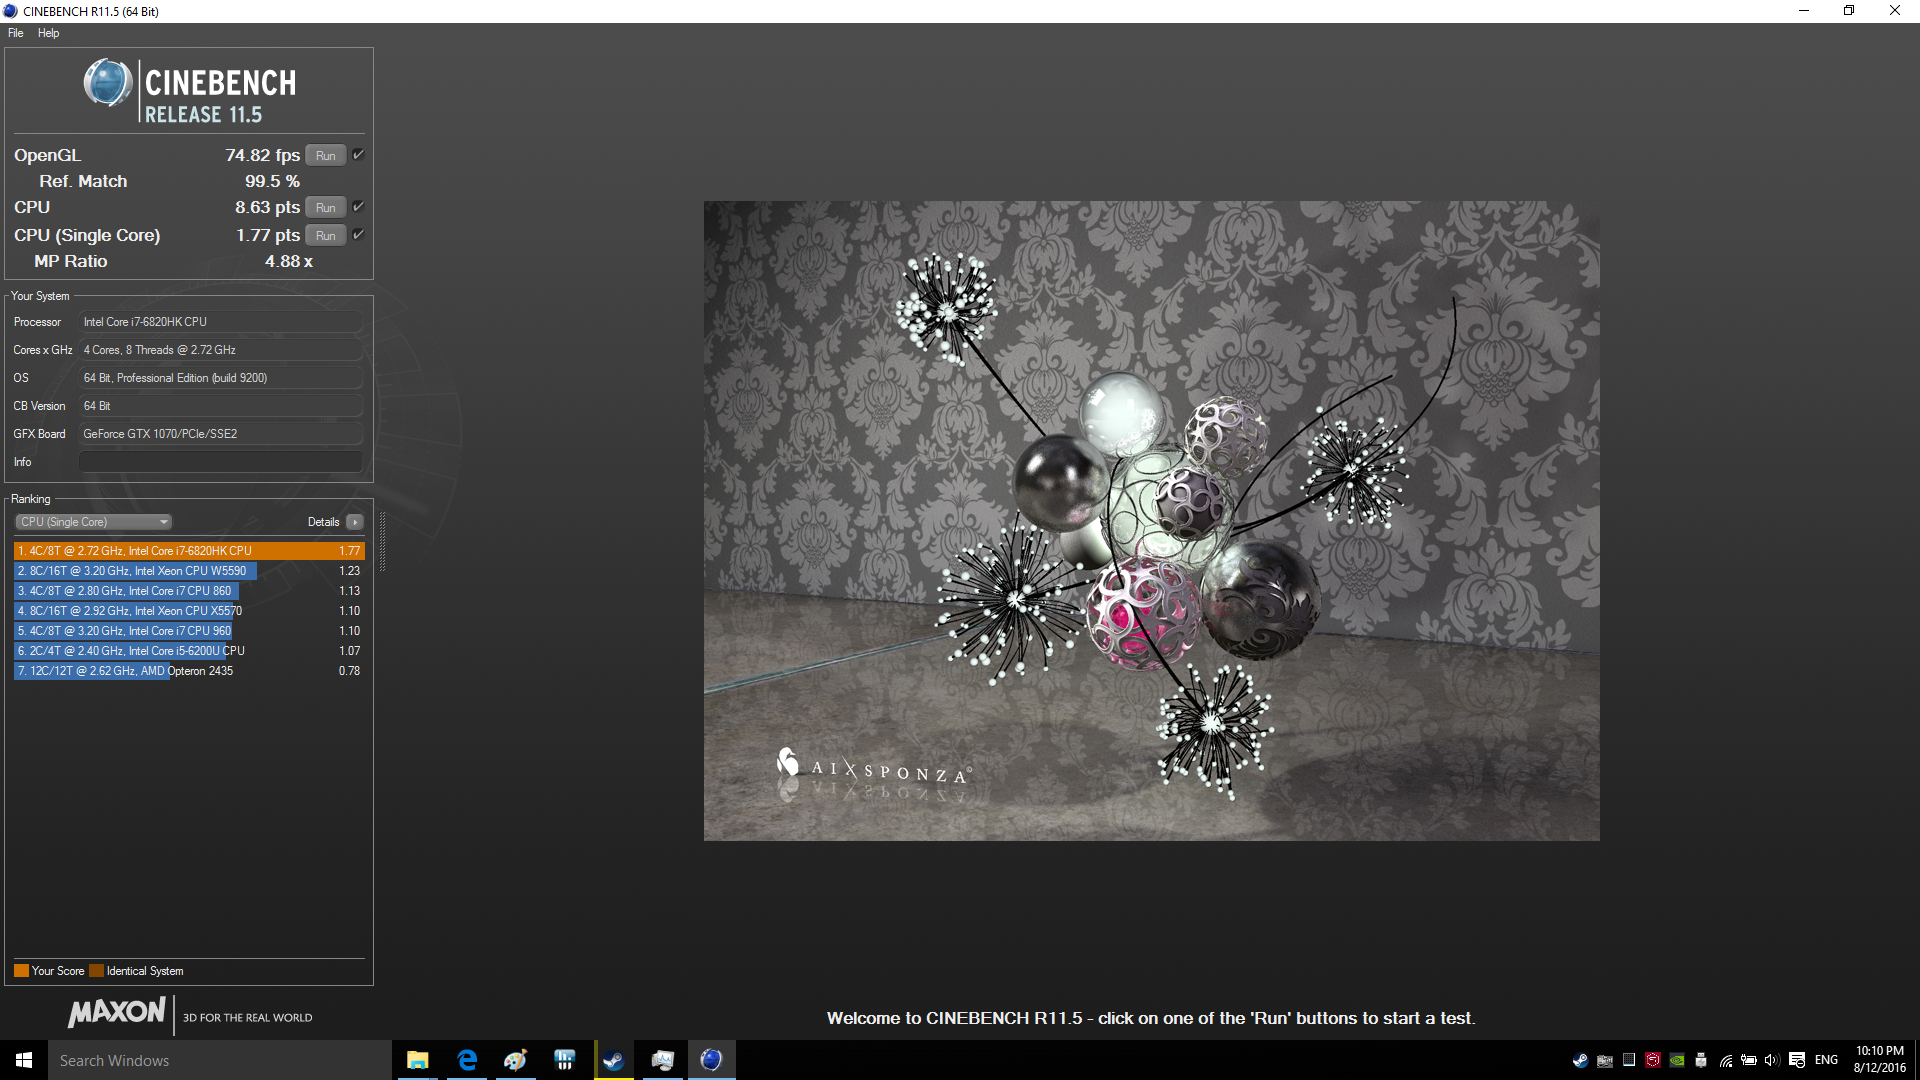
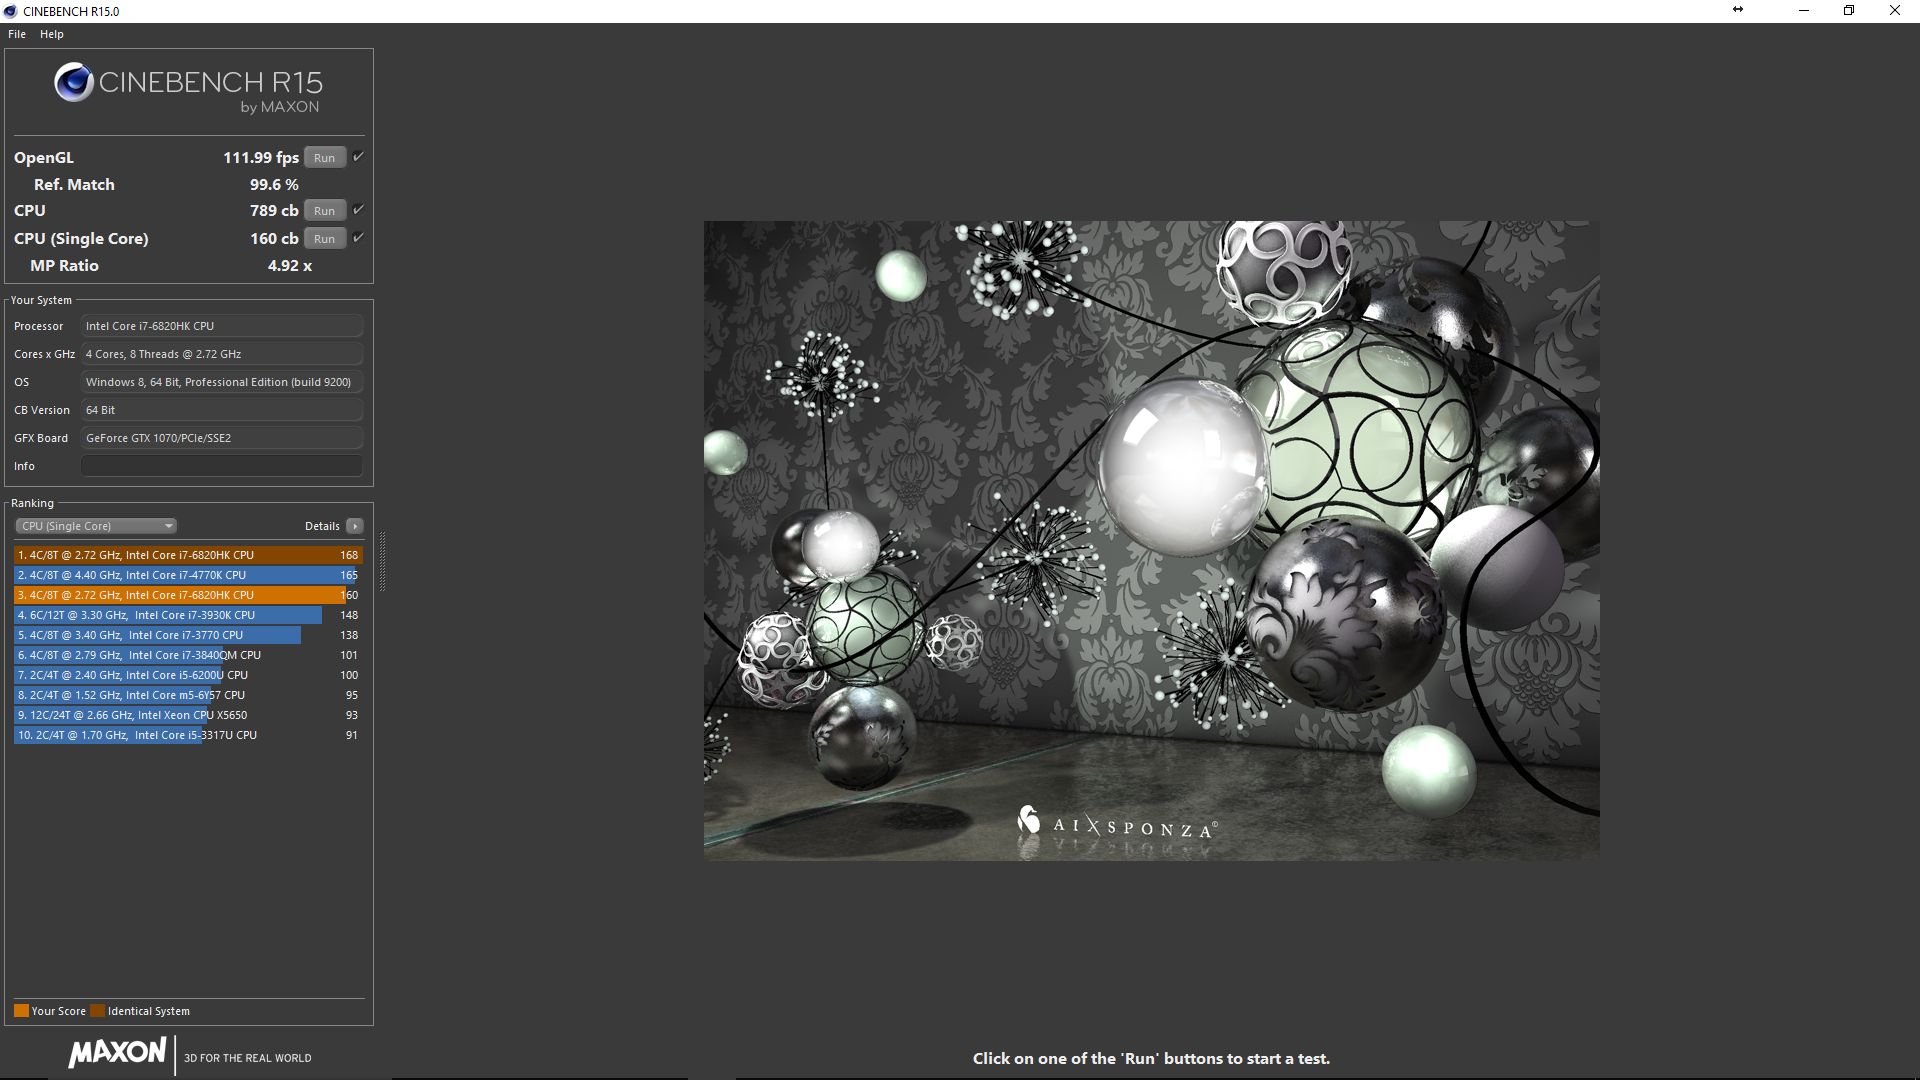
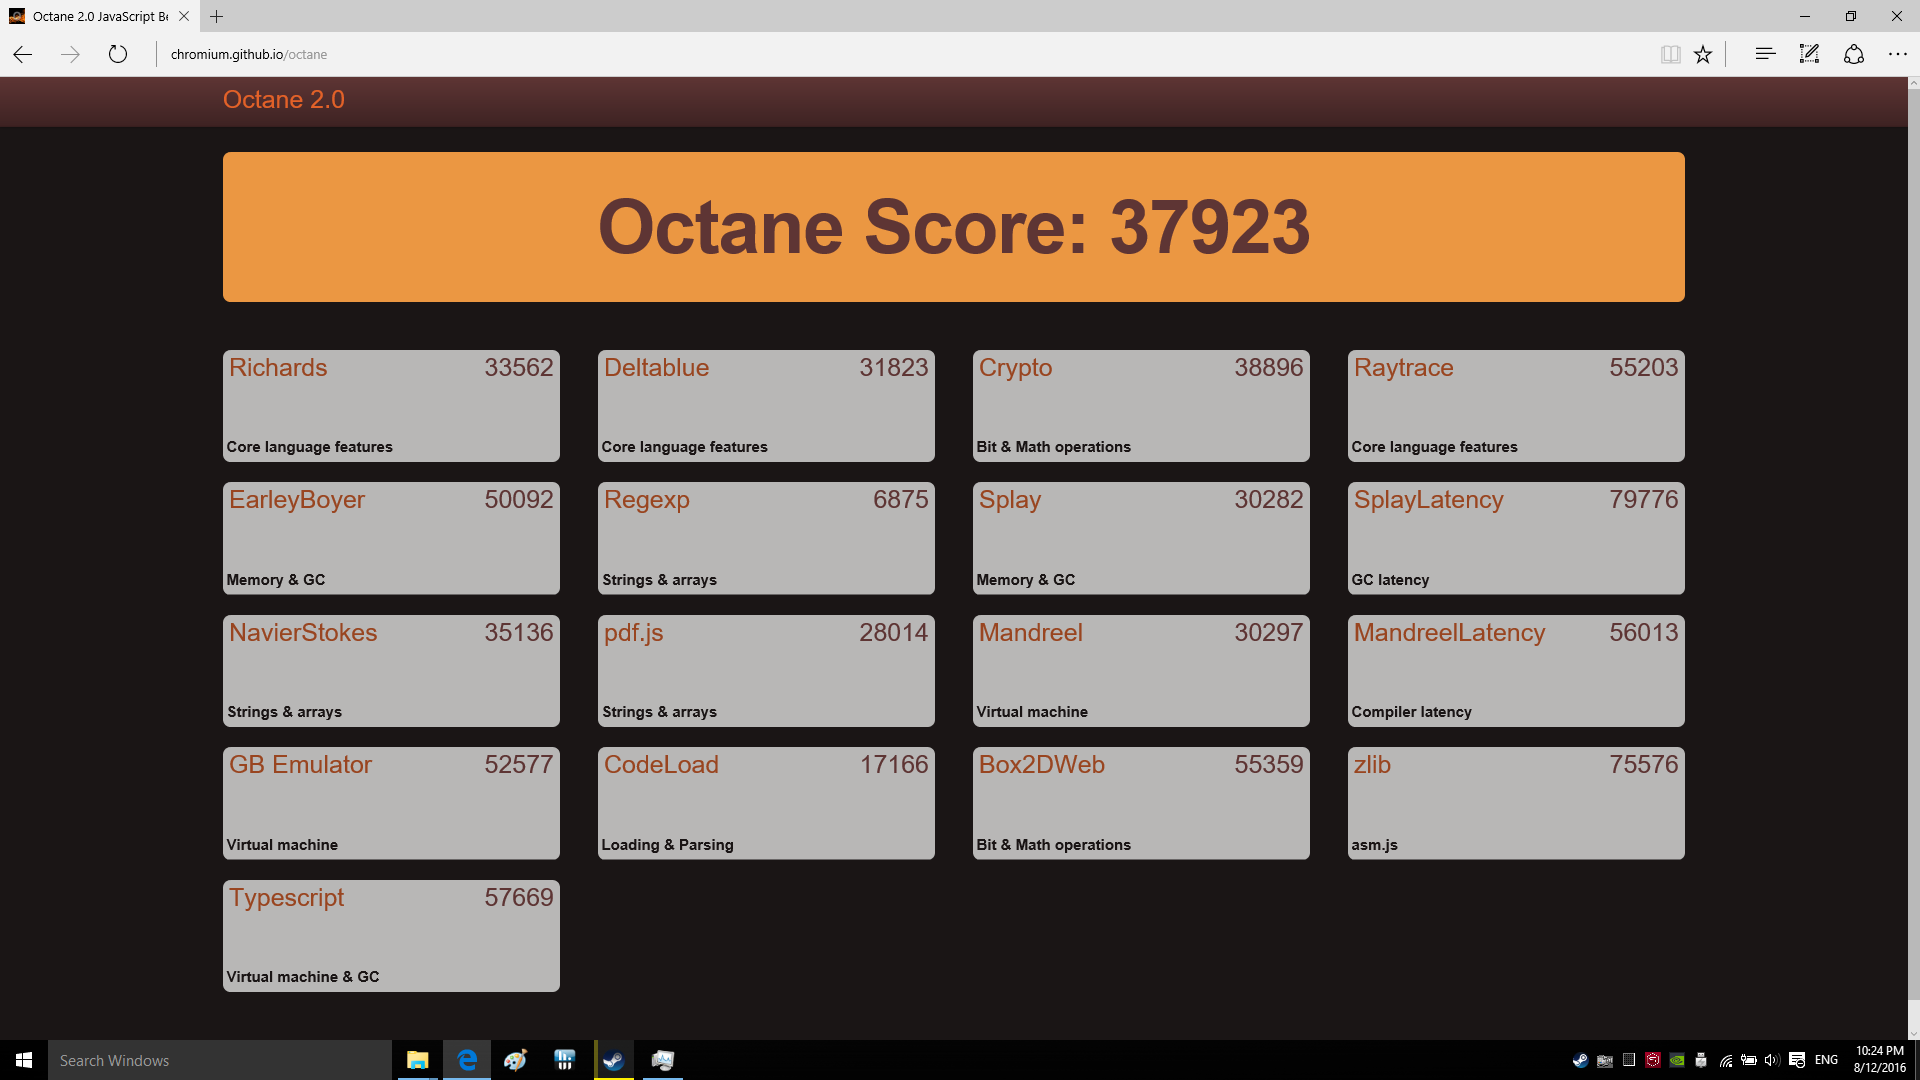
| Octane V2 - Total Score | |
| Asus G752VS-XB78K | |
| MSI GT72VR 6RE-015US | |
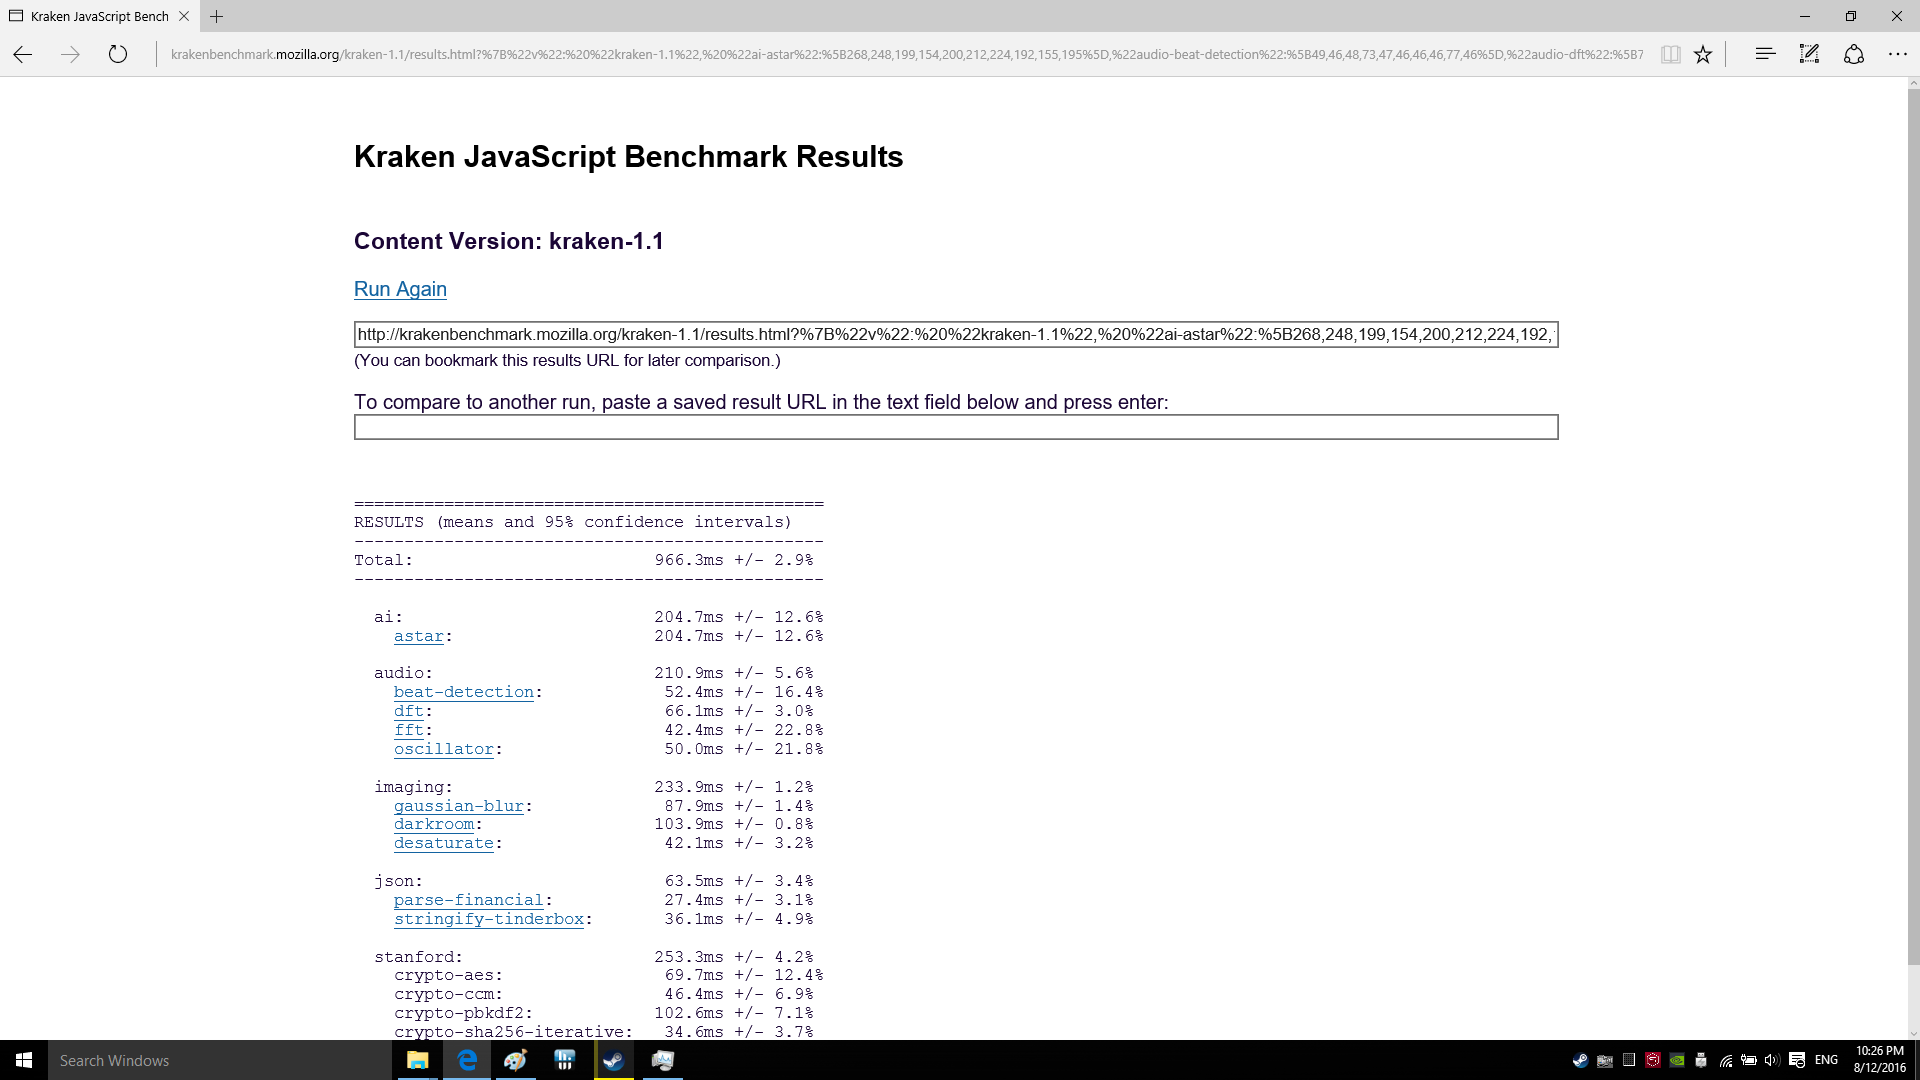
| Mozilla Kraken 1.1 - Total | |
| Asus G752VS-XB78K | |
* ... smaller is better
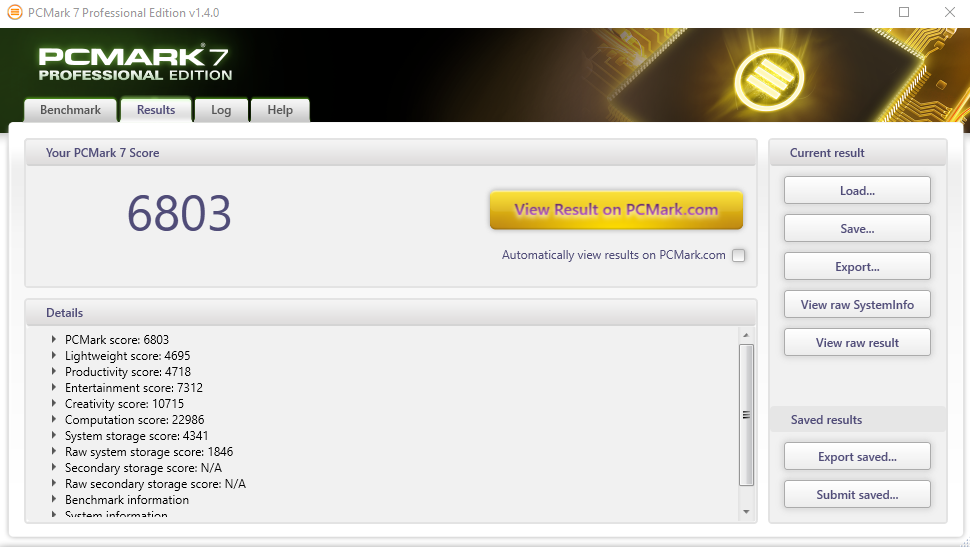
| PCMark 7 Score | 6803 points | |
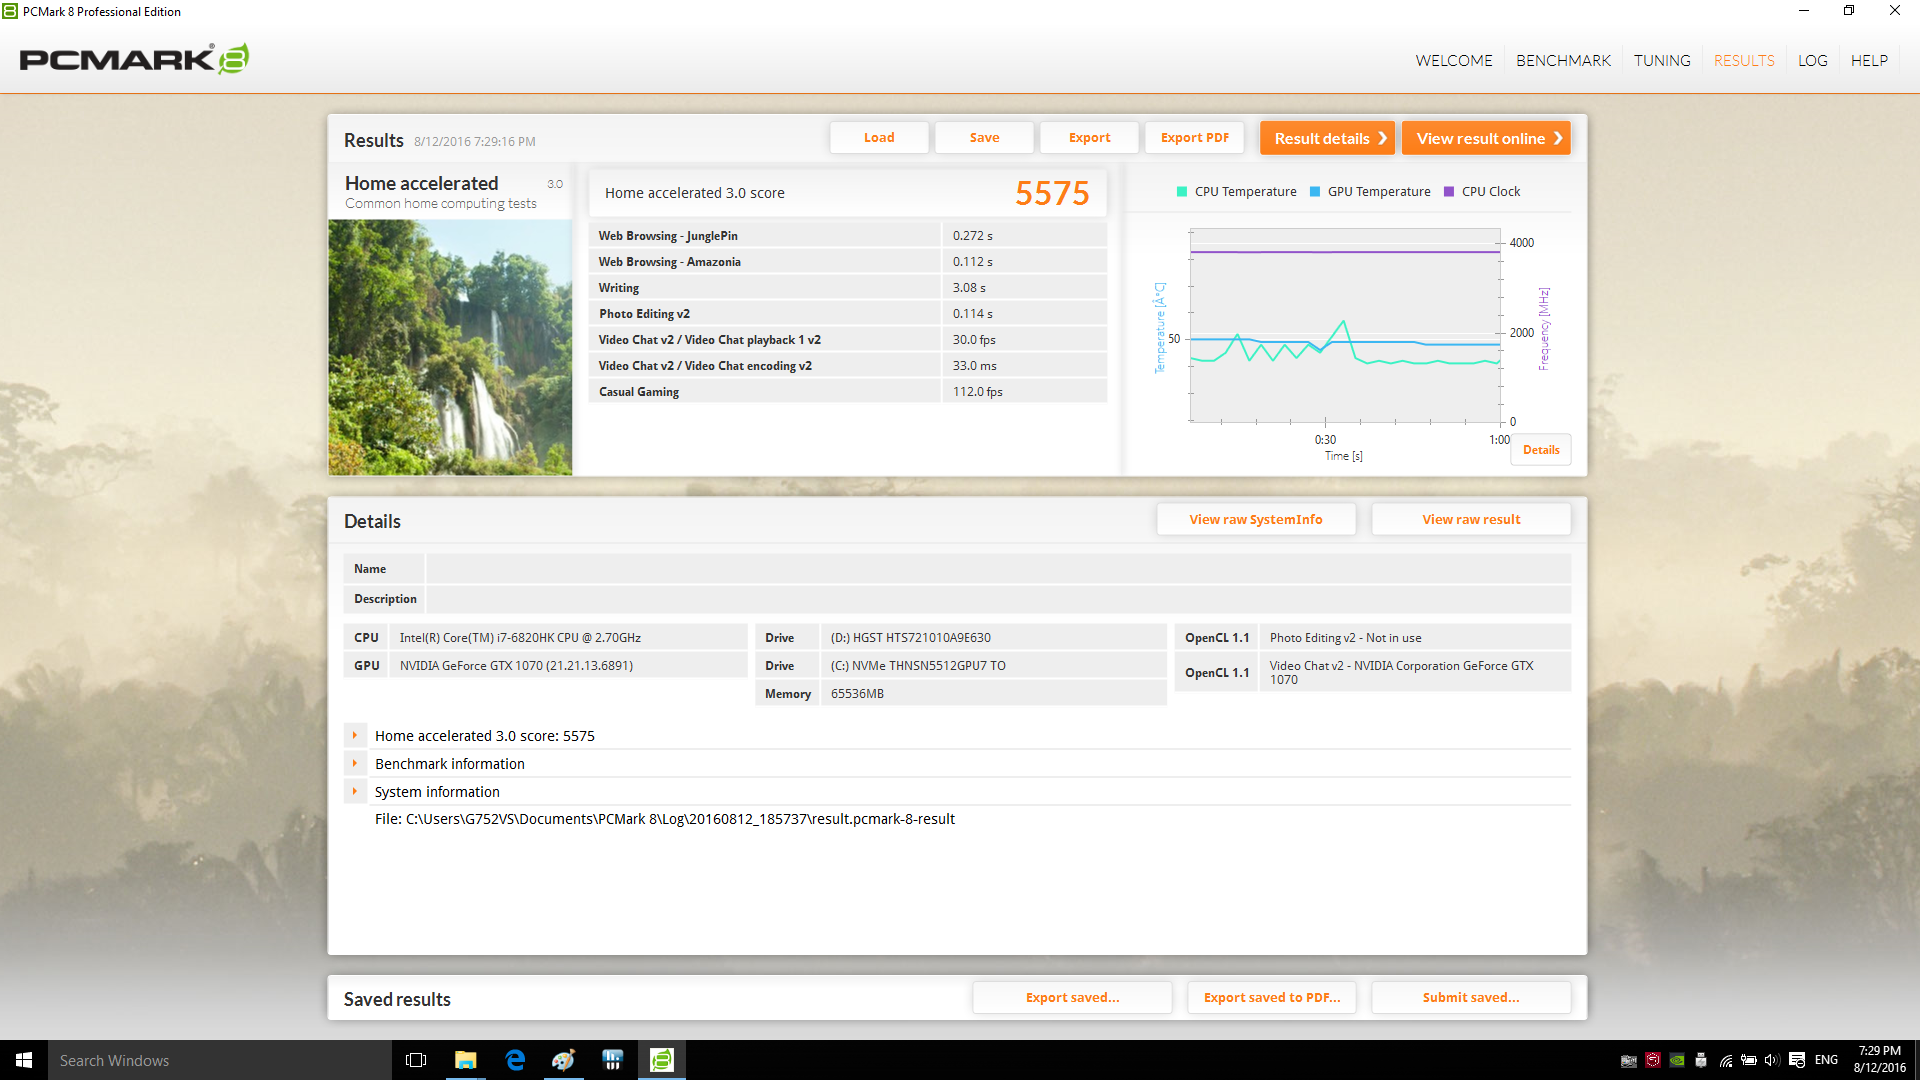
| PCMark 8 Home Score Accelerated v2 | 5575 points | |
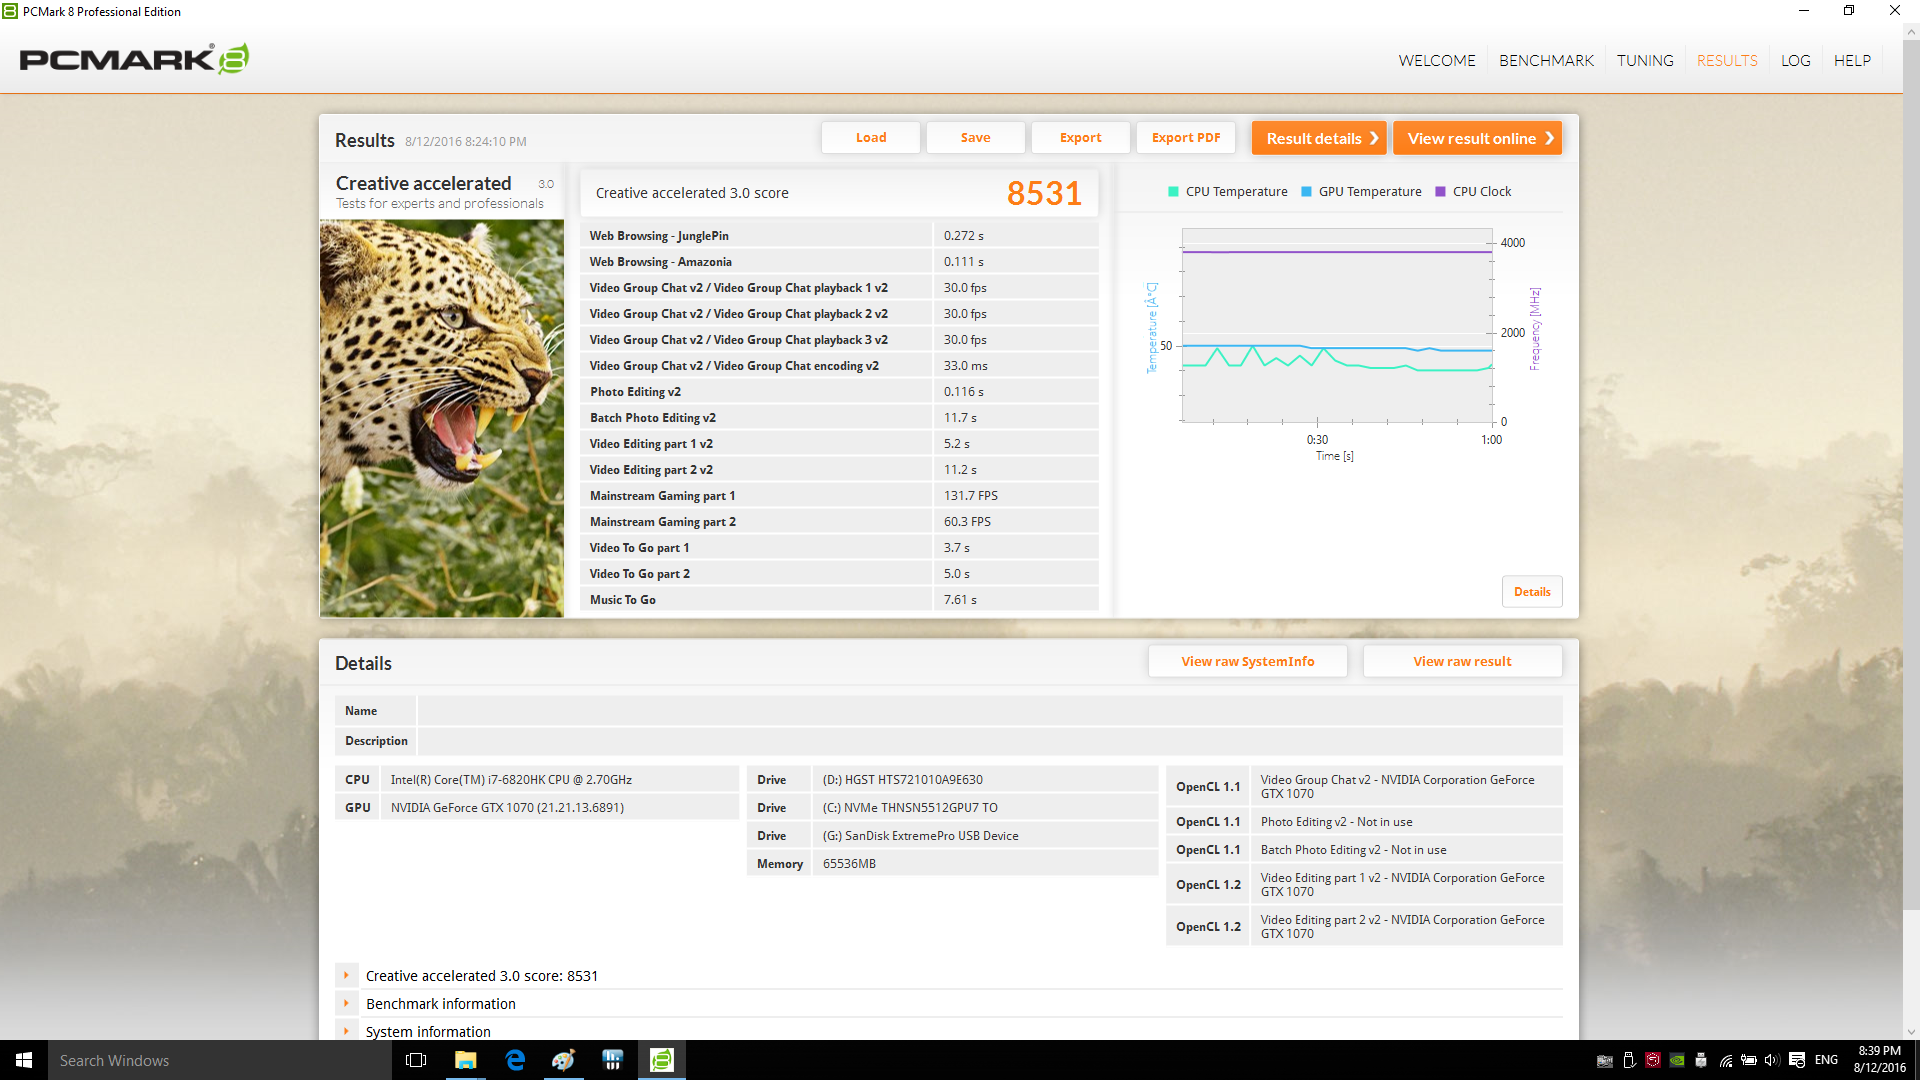
| PCMark 8 Creative Score Accelerated v2 | 8531 points | |
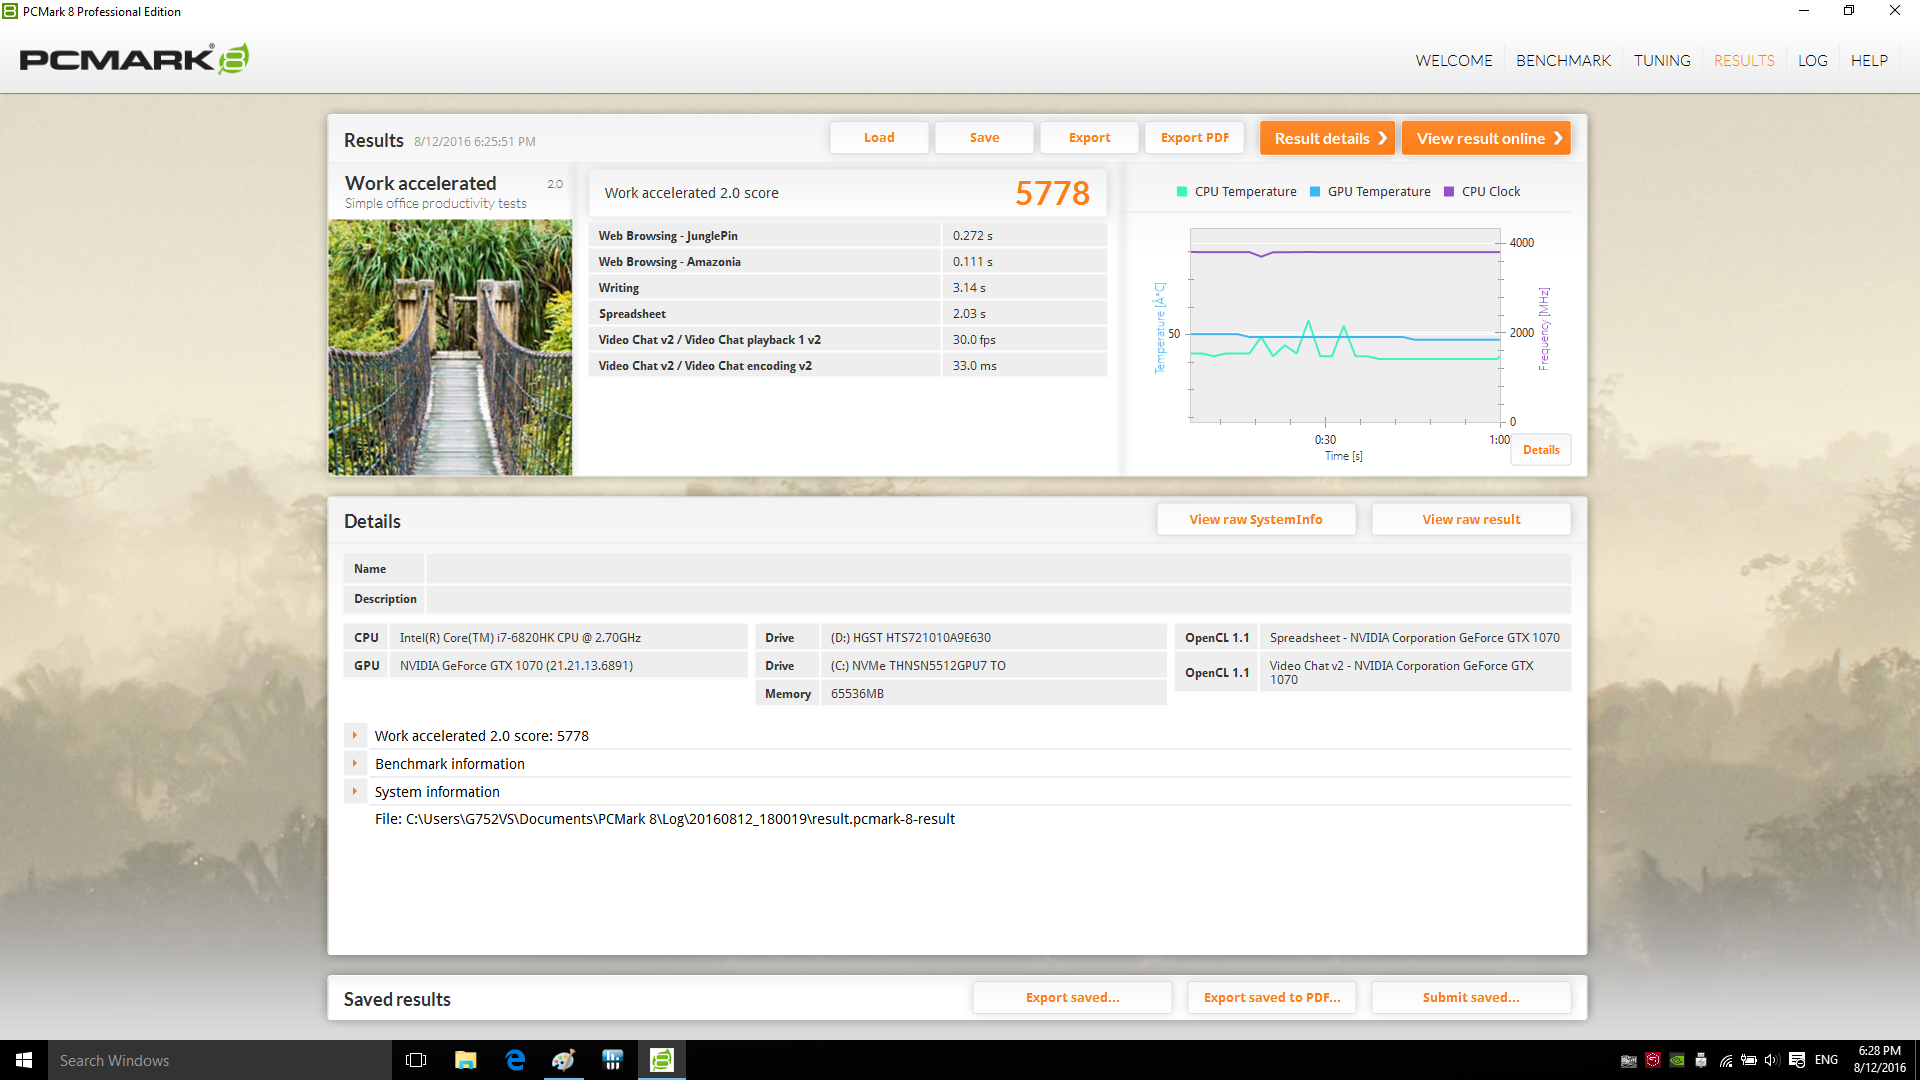
| PCMark 8 Work Score Accelerated v2 | 5778 points | |
Help | ||
| Asus G752VS-XB78K Toshiba NVMe THNSN5512GPU7 | MSI GT72VR 6RE-015US SanDisk SD8SNAT256G1122 | MSI GT62VR-6RE16H21 Toshiba HG6 THNSNJ256G8NY | Asus G752VY-RH71 Samsung SSD 950 Pro 512GB m.2 NVMe | Alienware 17 R3 (A17-9935) Samsung PM951 NVMe 512 GB | SCHENKER XMG U716 Samsung SM951 MZHPV512HDGL m.2 PCI-e | |
|---|---|---|---|---|---|---|
| CrystalDiskMark 3.0 | -57% | -55% | 12% | -24% | -2% | |
| Read Seq | 1718 | 529 -69% | 523 -70% | 2007 17% | 1263 -26% | 1608 -6% |
| Write Seq | 1305 | 338.5 -74% | 485.5 -63% | 1536 18% | 587 -55% | 1577 21% |
| Read 4k | 44.42 | 23.1 -48% | 21.86 -51% | 51.6 16% | 42.59 -4% | 44.95 1% |
| Write 4k | 154.4 | 99.4 -36% | 98.8 -36% | 150.2 -3% | 140.6 -9% | 119.5 -23% |


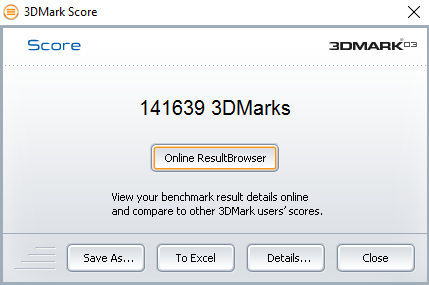
| 3DMark 03 Standard | 141639 points | |
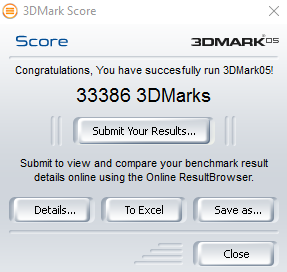
| 3DMark 05 Standard | 33386 points | |
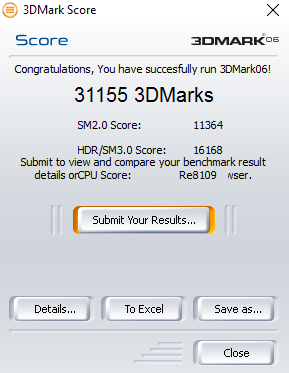
| 3DMark 06 Standard Score | 31155 points | |
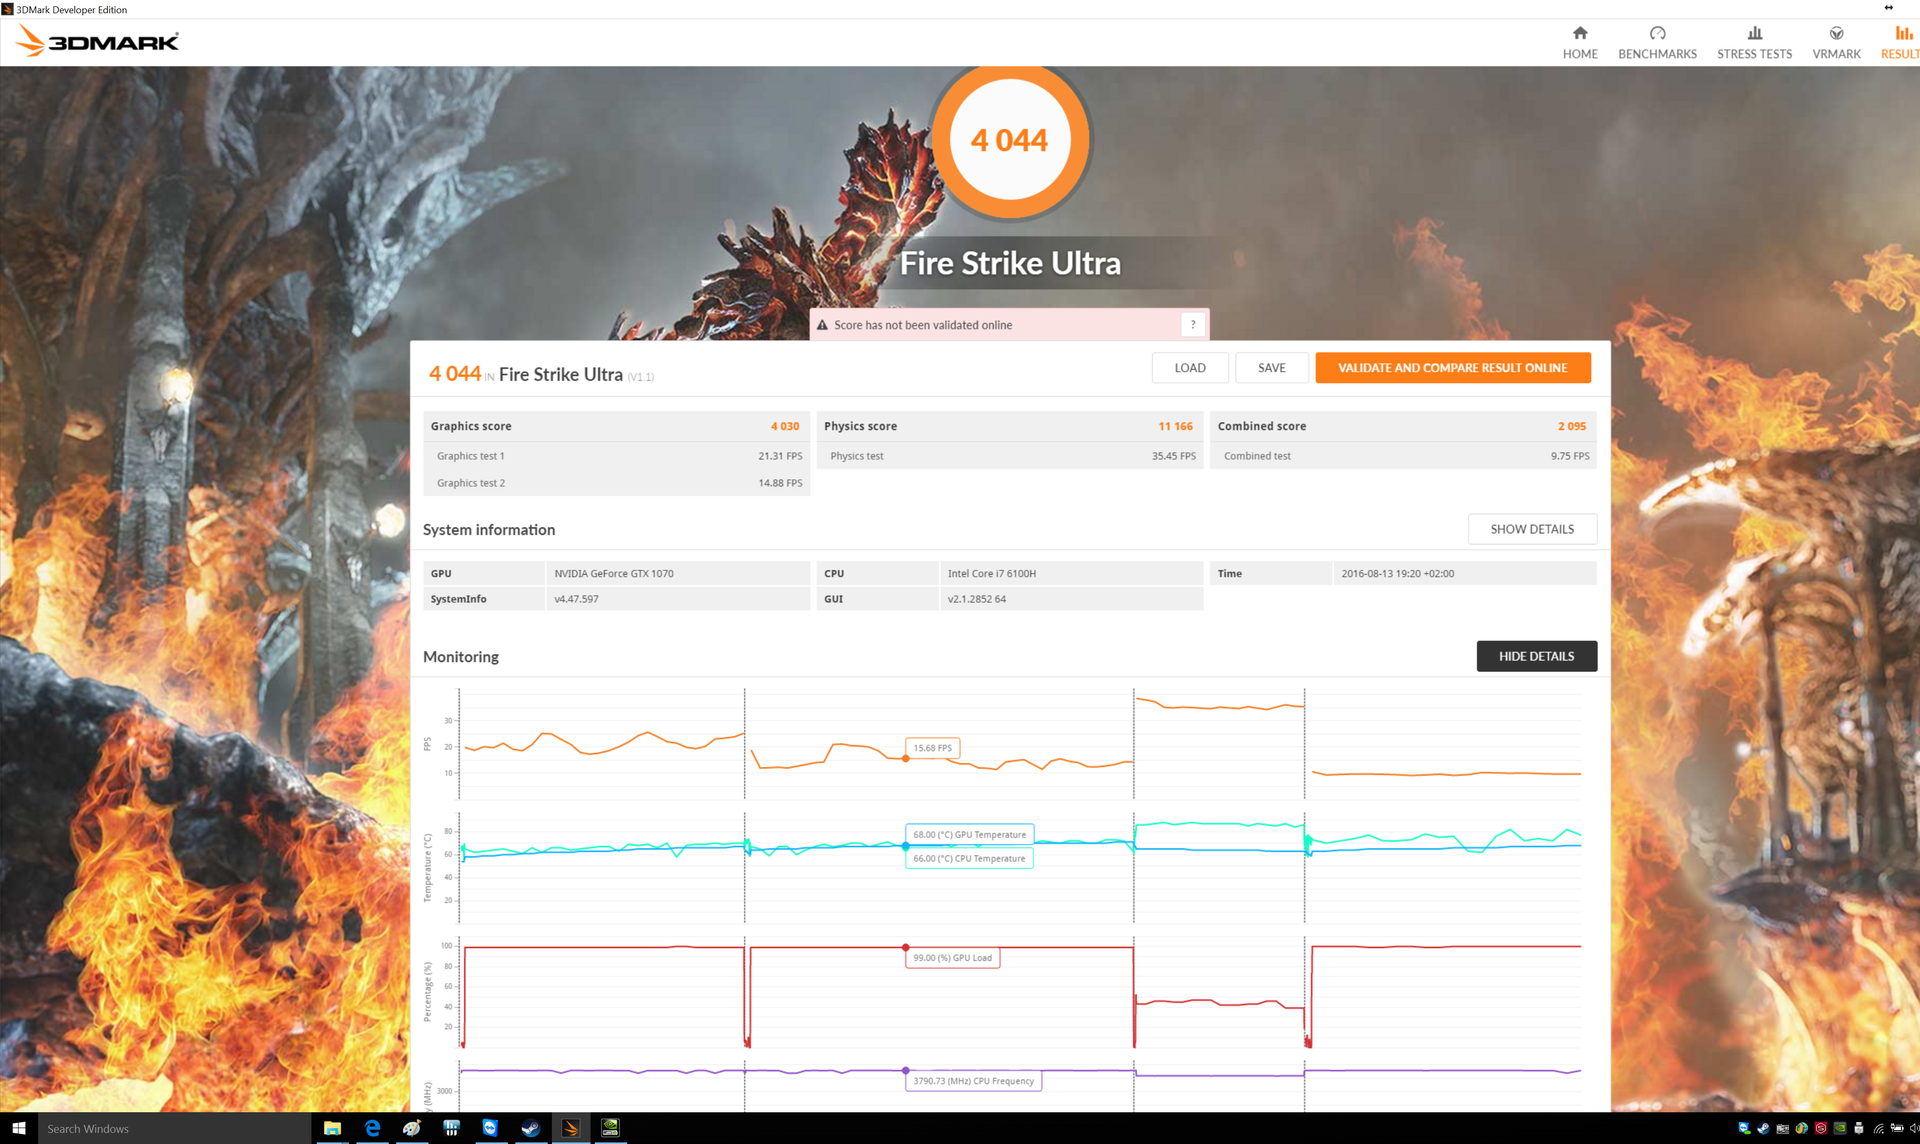
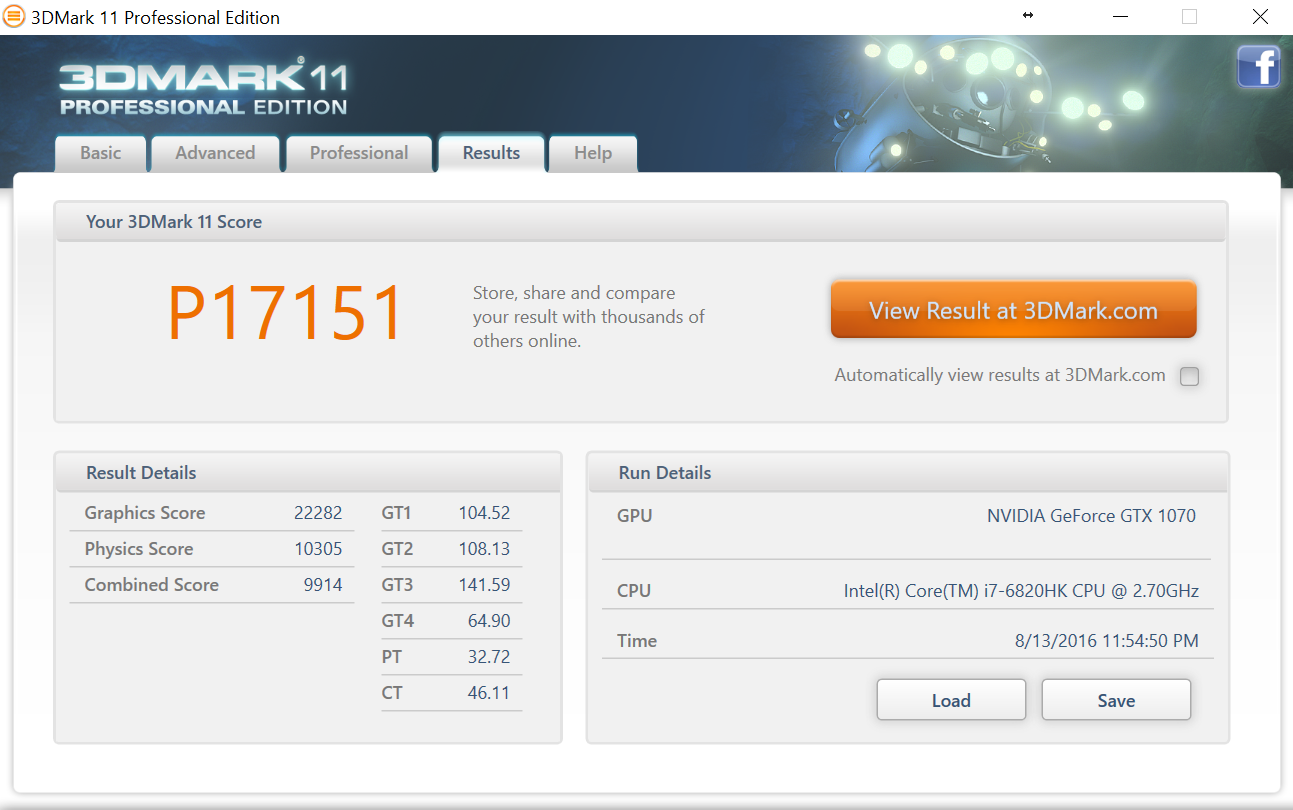
| 3DMark 11 Performance | 17151 points | |
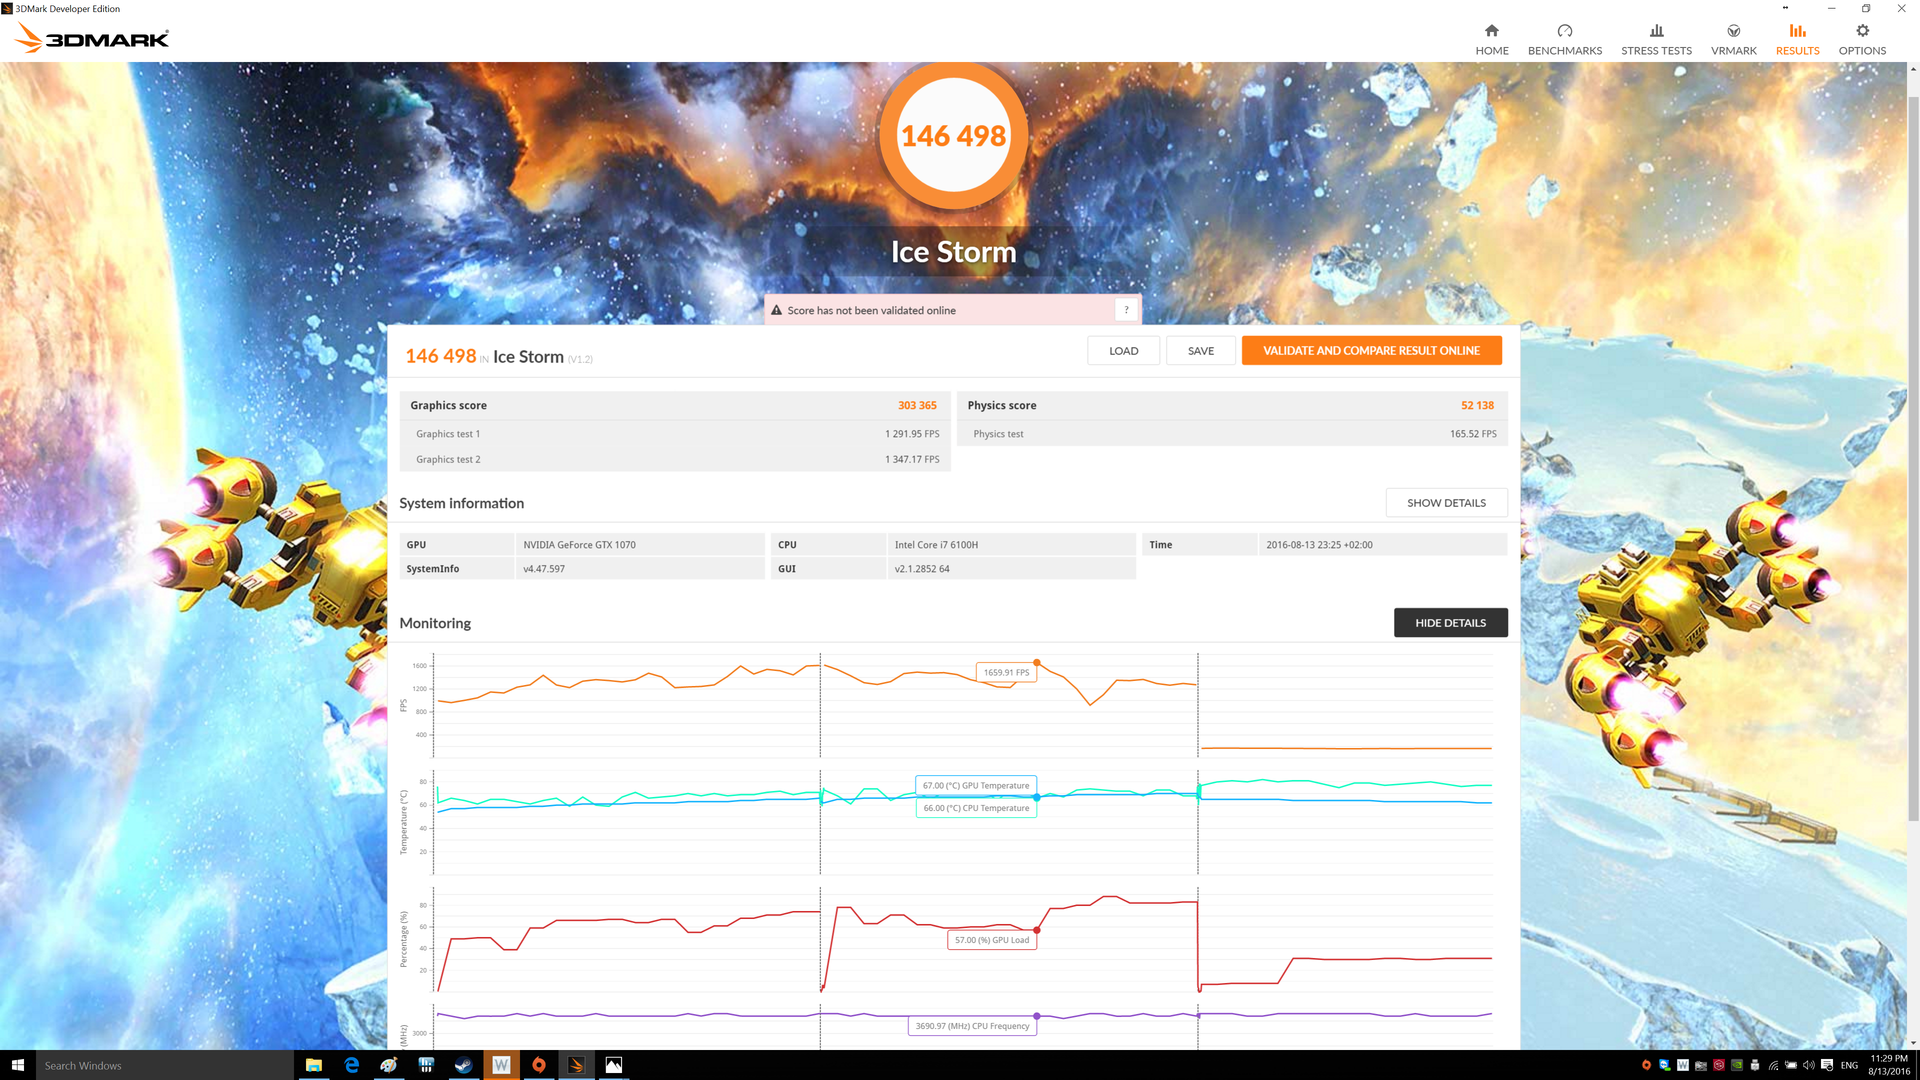
| 3DMark Ice Storm Standard Score | 146498 points | |
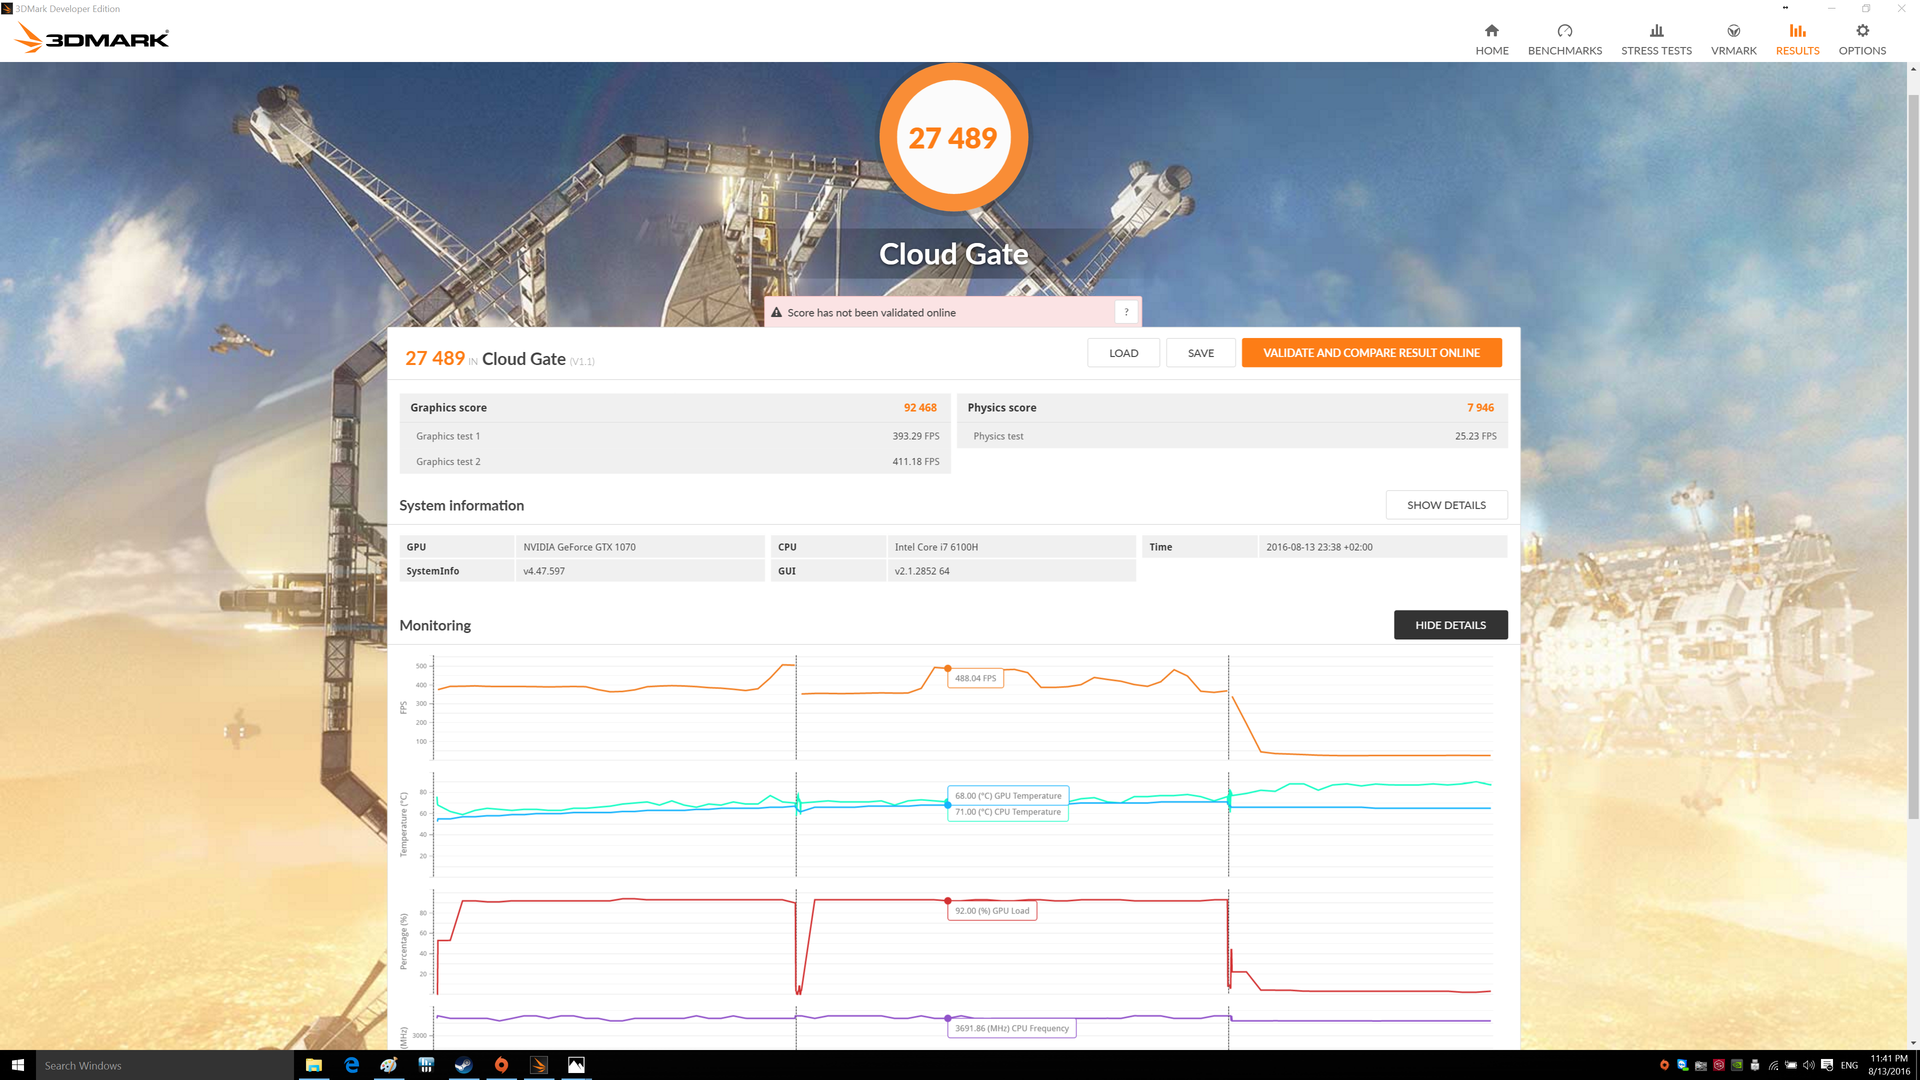
| 3DMark Cloud Gate Standard Score | 27498 points | |
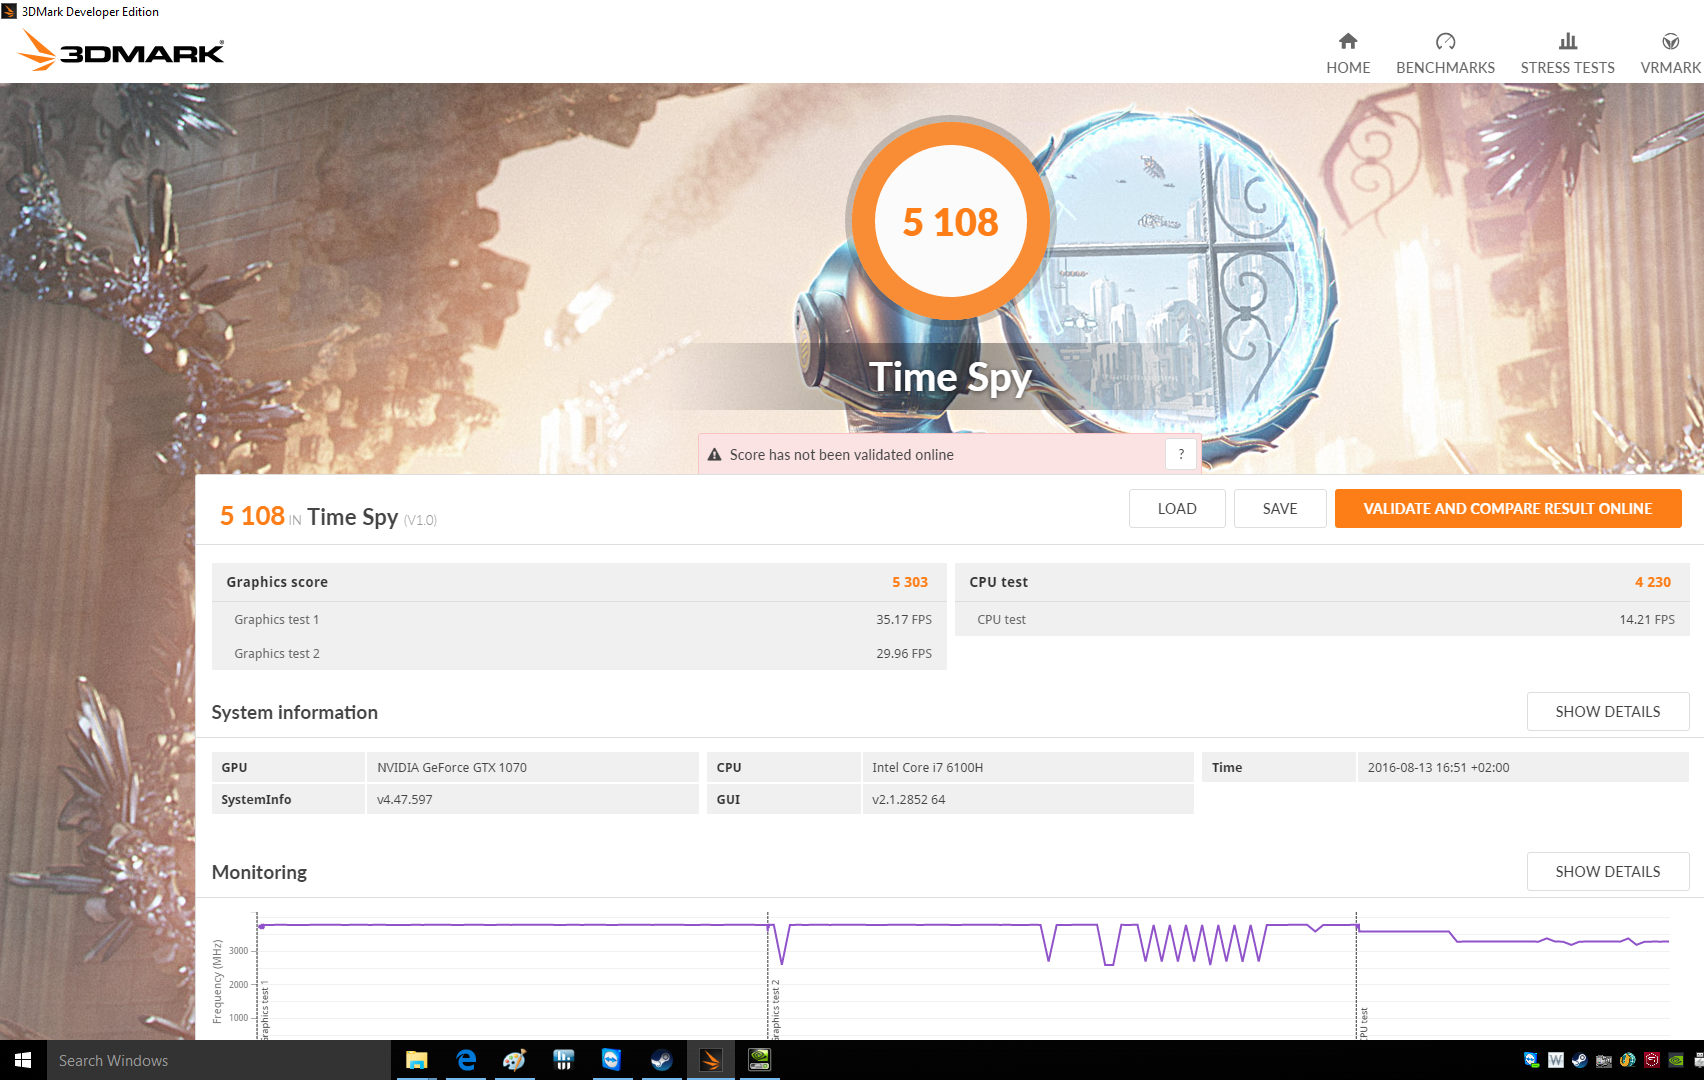
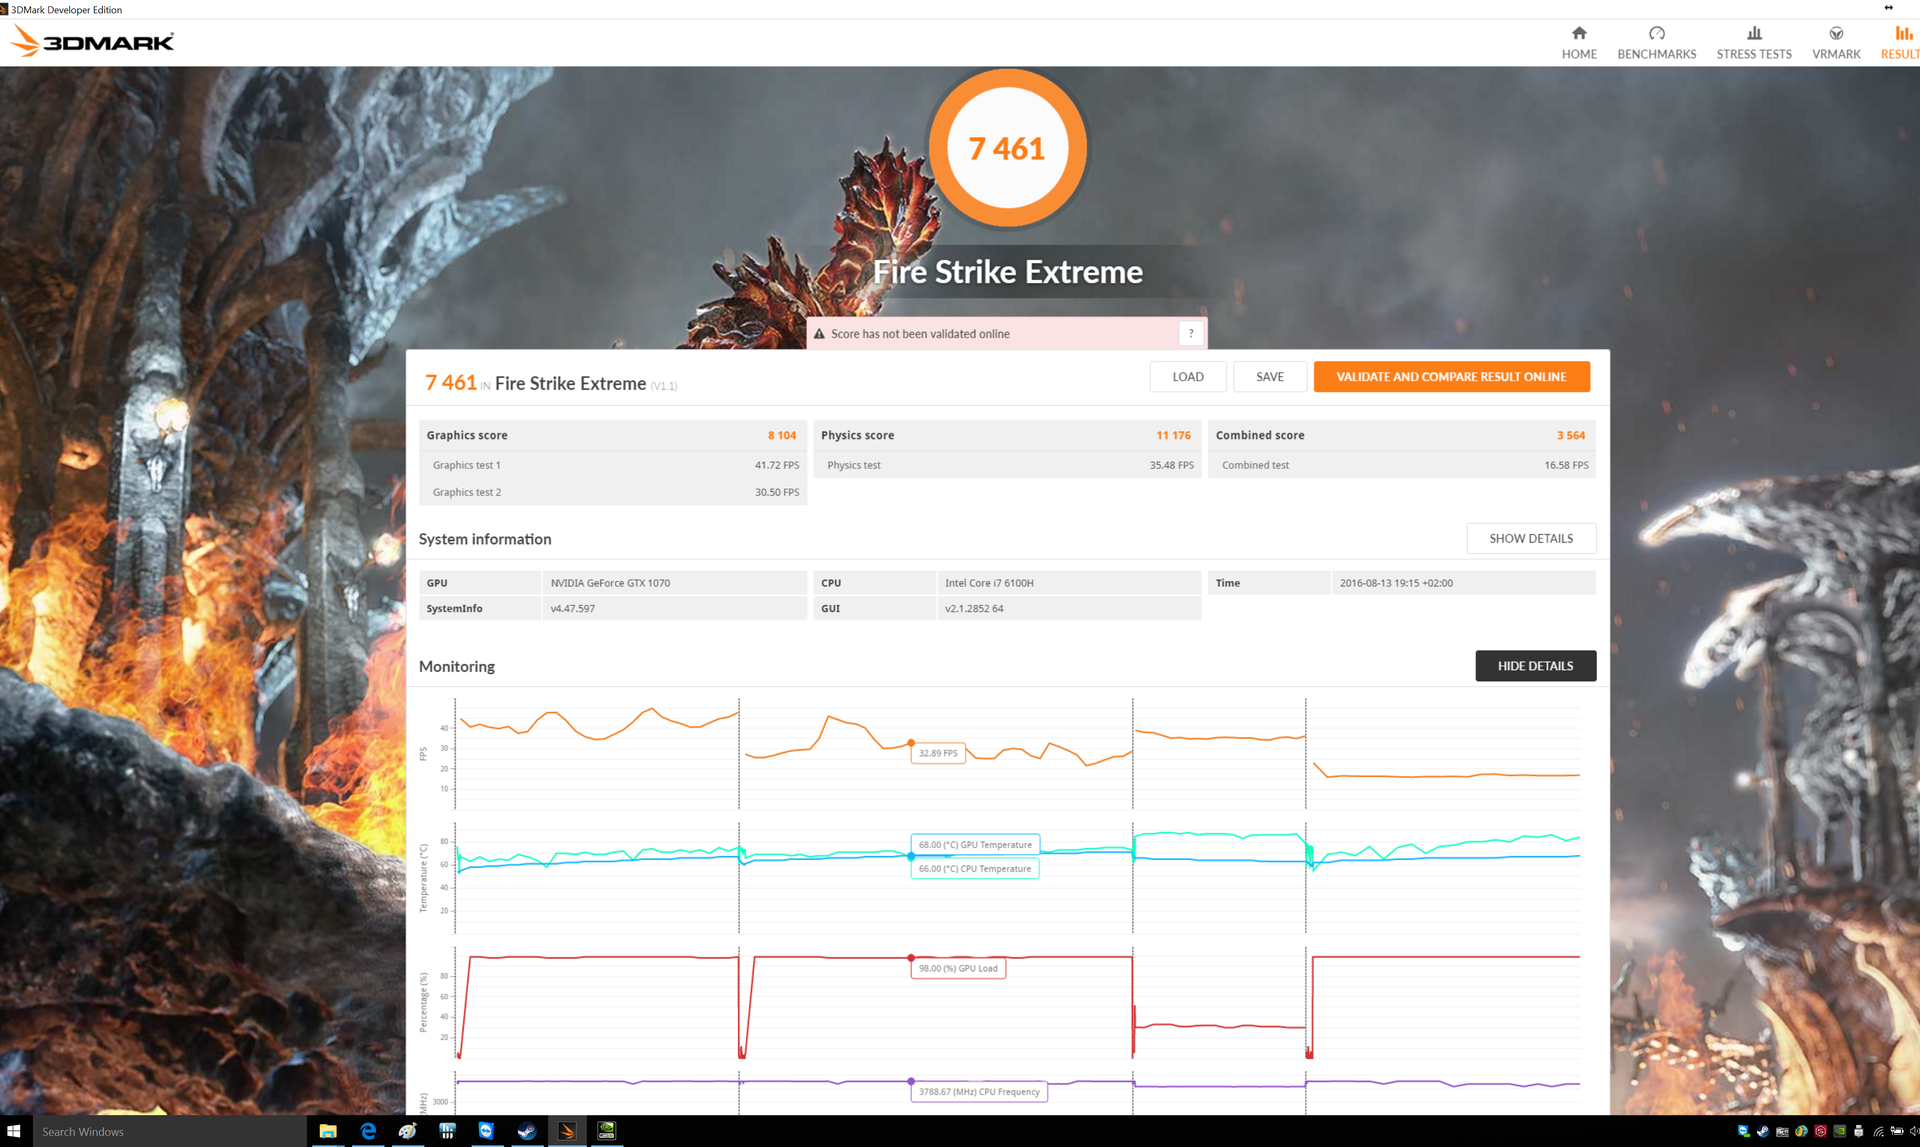
| 3DMark Fire Strike Score | 13621 points | |
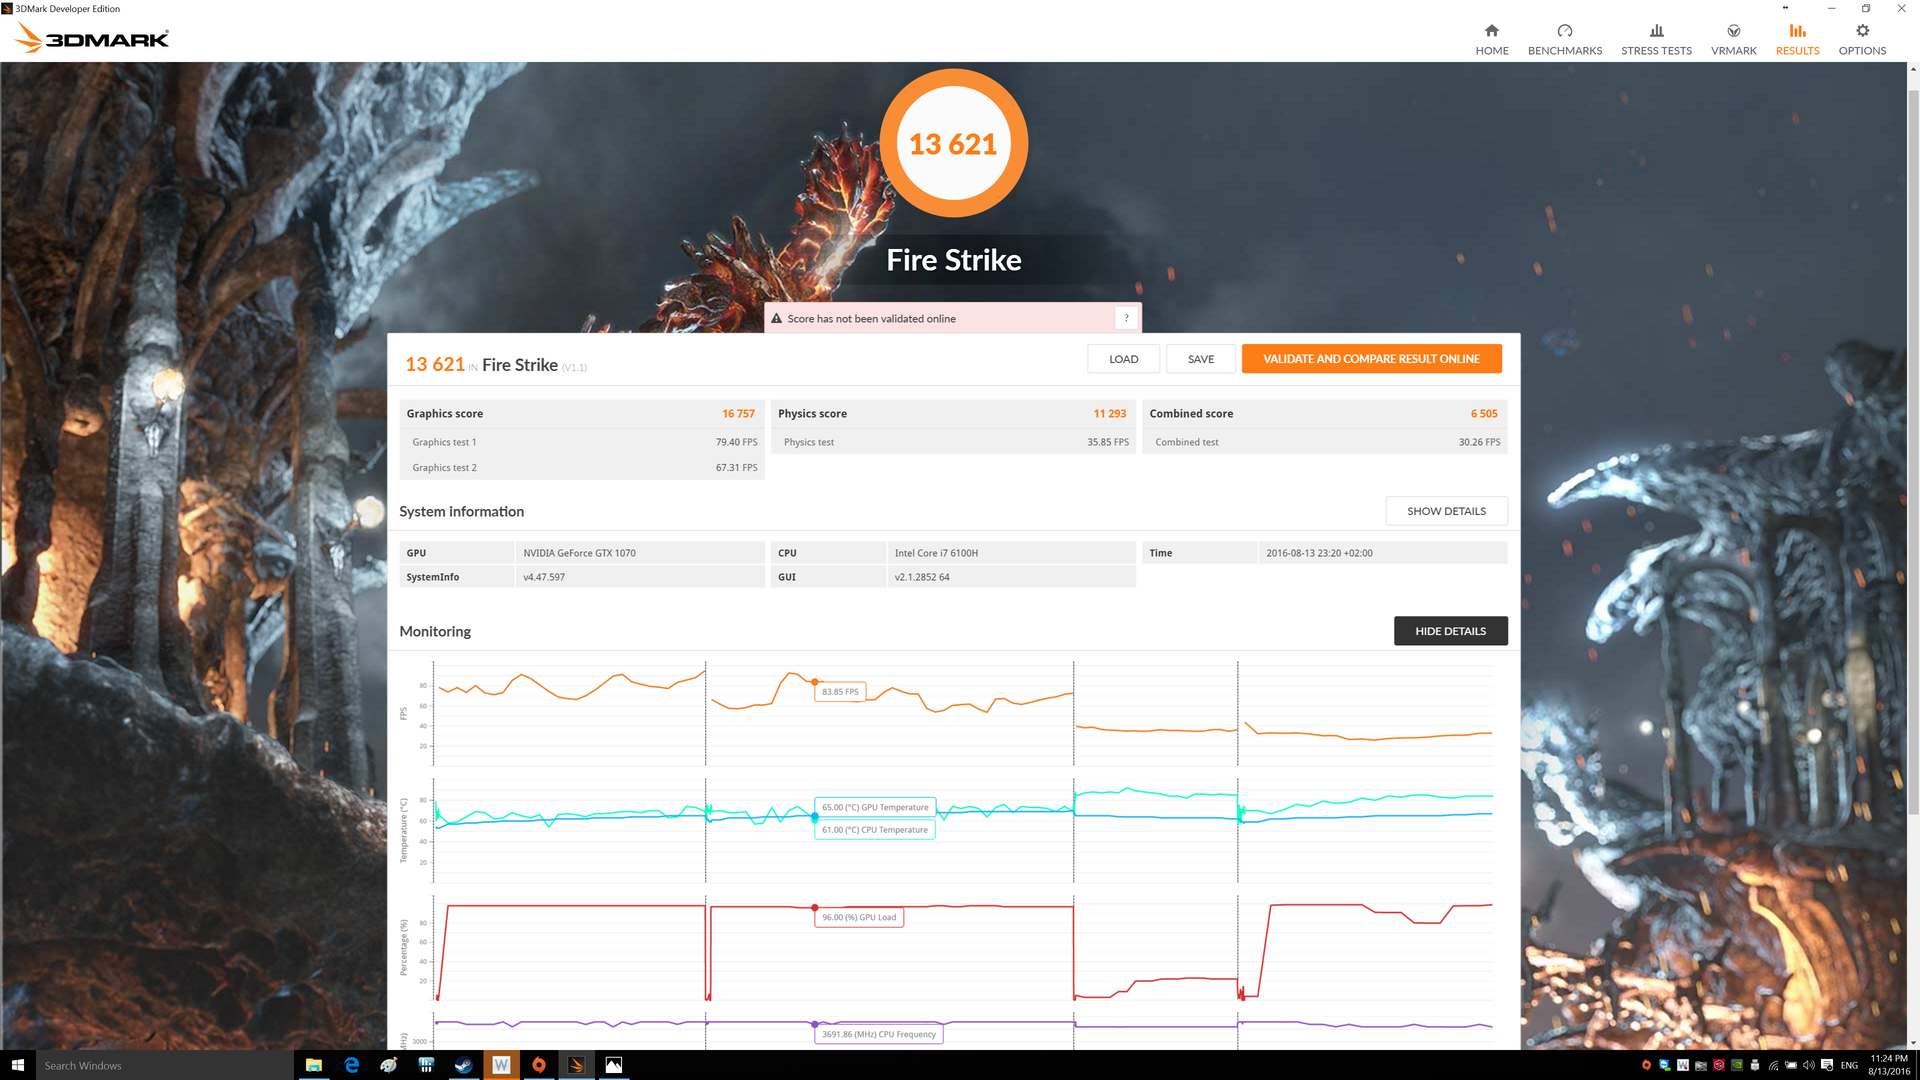
| 3DMark Fire Strike Extreme Score | 7461 points | |
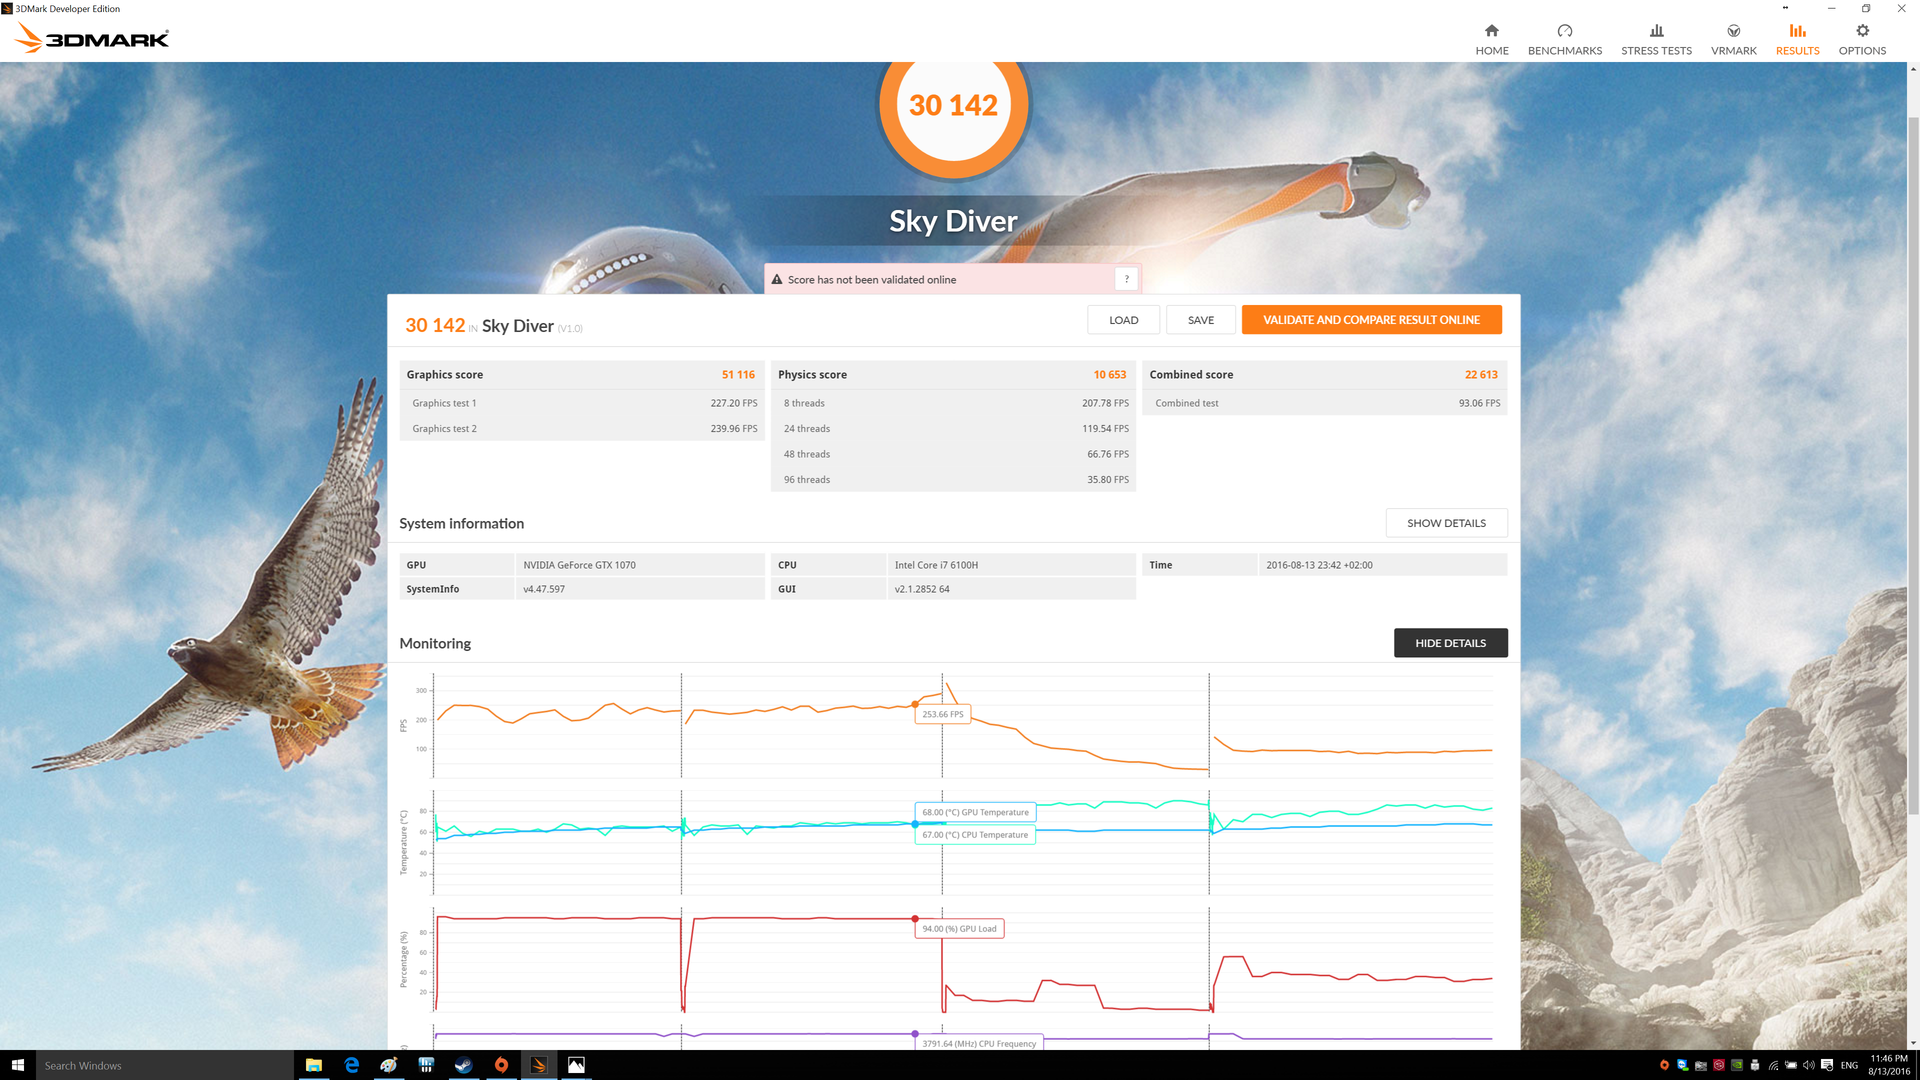
| 3DMark Time Spy Score | 5108 points | |
Help | ||
| BioShock Infinite - 1920x1080 Ultra Preset, DX11 (DDOF) | |
| Asus G752VS-XB78K | |
| MSI GT62VR-6RE16H21 | |
| SCHENKER XMG U716 | |
| Asus G752VY-GC110T | |
| Asus G752VT | |
| Battlefield 4 | |
| 1920x1080 Ultra Preset AA:4x MS | |
| Asus G752VS-XB78K | |
| MSI GT62VR-6RE16H21 | |
| SCHENKER XMG U716 | |
| 3840x2160 High Preset | |
| Asus G752VS-XB78K | |
| MSI GT62VR-6RE16H21 | |
| SCHENKER XMG U716 | |
| Thief - 1920x1080 Very High Preset AA:FXAA & High SS AF:8x | |
| Asus G752VS-XB78K | |
| SCHENKER XMG U716 | |
| MSI GT62VR-6RE16H21 | |
| Asus G752VY-GC110T | |
| Asus G752VT | |
| GRID: Autosport - 1920x1080 Ultra Preset AA:4x MS | |
| SCHENKER XMG U716 | |
| Asus G752VS-XB78K | |
| MSI GT62VR-6RE16H21 | |
| GTA V | |
| 1920x1080 Highest Settings possible AA:4xMSAA + FX AF:16x | |
| Asus G752VS-XB78K | |
| SCHENKER XMG U716 | |
| 3840x2160 High/On (Advanced Graphics Off) AA:FX AF:8x | |
| SCHENKER XMG U716 | |
| Asus G752VS-XB78K | |
| The Witcher 3 | |
| 1920x1080 Ultra Graphics & Postprocessing (HBAO+) | |
| MSI GT62VR-6RE16H21 | |
| Asus G752VS-XB78K | |
| SCHENKER XMG U716 | |
| Asus G752VY-GC110T | |
| 3840x2160 High Graphics & Postprocessing (Nvidia HairWorks Off) | |
| MSI GT62VR-6RE16H21 | |
| Asus G752VS-XB78K | |
| SCHENKER XMG U716 | |
| Rise of the Tomb Raider | |
| 1920x1080 Very High Preset AA:FX AF:16x | |
| Asus G752VS-XB78K | |
| MSI GT62VR-6RE16H21 | |
| Alienware 17 R3 (A17-9935) | |
| 3840x2160 High Preset AA:FX AF:4x | |
| Asus G752VS-XB78K | |
| MSI GT62VR-6RE16H21 | |
| Far Cry Primal | |
| 1920x1080 Ultra Preset AA:SM | |
| Asus G752VS-XB78K | |
| MSI GT62VR-6RE16H21 | |
| 3840x2160 High Preset AA:SM | |
| Asus G752VS-XB78K | |
| MSI GT62VR-6RE16H21 | |
| low | med. | high | ultra | 4K | |
| Hitman: Absolution (2012) | 95.2 | 88 | 77.3 | 72.5 | |
| BioShock Infinite (2013) | 249.9 | 223 | 221 | 137.1 | |
| Battlefield 4 (2013) | 199.8 | 199.6 | 199.5 | 145.6 | 70.9 |
| Thief (2014) | 117.1 | 115 | 113 | 101.6 | |
| GRID: Autosport (2014) | 324.8 | 159 | 136.6 | 115.1 | |
| GTA V (2015) | 167.4 | 152.8 | 120.1 | 64.7 | 53.4 |
| Dirt Rally (2015) | 294.3 | 154.5 | 140.5 | 102.9 | 98.9 |
| The Witcher 3 (2015) | 211.8 | 165.8 | 98.5 | 57 | 34.8 |
| Batman: Arkham Knight (2015) | 163 | 155 | 118 | 117 | 43 |
| Rise of the Tomb Raider (2016) | 203.6 | 162.8 | 99 | 92.8 | 38 |
| Far Cry Primal (2016) | 122 | 106 | 95 | 89 | 37 |
| Hitman 2016 (2016) | 82 | 80.9 | 67.3 | 66 | 35.5 |
Noise Level
| Idle |
| 31 / 32 / 33 dB(A) |
| HDD |
| 33 dB(A) |
| DVD |
| 40 / dB(A) |
| Load |
| 40 / 47 dB(A) |
 | ||
30 dB silent 40 dB(A) audible 50 dB(A) loud |
||
min: | ||
| Asus G752VS-XB78K | MSI GT72VR 6RE-015US | MSI GT62VR-6RE16H21 | Asus G752VY-RH71 | Asus G752VT | Alienware 17 R3 (A17-9935) | SCHENKER XMG U716 | |
|---|---|---|---|---|---|---|---|
| Noise | -2% | -1% | -2% | 1% | -0% | -9% | |
| off / environment * | 30 | 28.9 4% | 30 -0% | 30 -0% | |||
| Idle Minimum * | 31 | 32.4 -5% | 32 -3% | 33.4 -8% | 32.9 -6% | 31 -0% | 33 -6% |
| Idle Average * | 32 | 32.4 -1% | 33 -3% | 33.5 -5% | 33 -3% | 32 -0% | 35 -9% |
| Idle Maximum * | 33 | 32.4 2% | 34 -3% | 33.5 -2% | 33.1 -0% | 33 -0% | 38 -15% |
| Load Average * | 40 | 39.4 1% | 40 -0% | 40.3 -1% | 36.2 9% | 38 5% | 45 -13% |
| Load Maximum * | 47 | 52 -11% | 46 2% | 45.1 4% | 45.8 3% | 50 -6% | 48 -2% |
* ... smaller is better
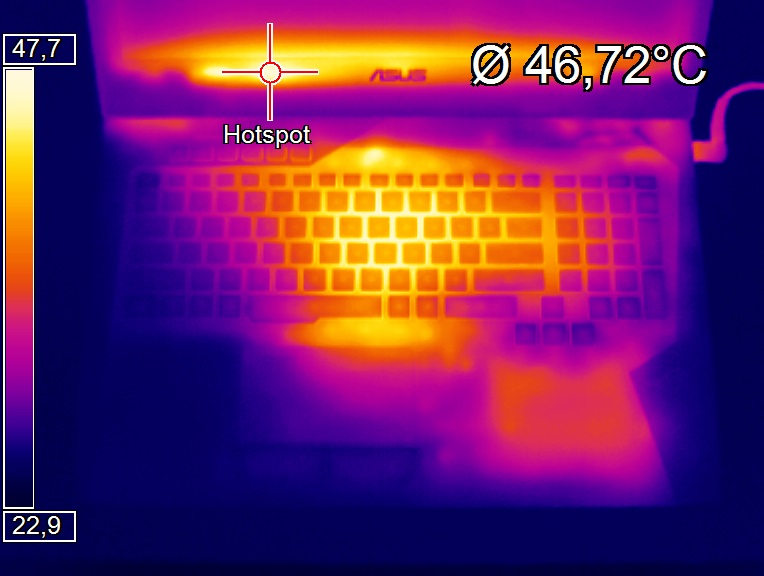
(±) The maximum temperature on the upper side is 42.9 °C / 109 F, compared to the average of 40.4 °C / 105 F, ranging from 21.2 to 68.8 °C for the class Gaming.
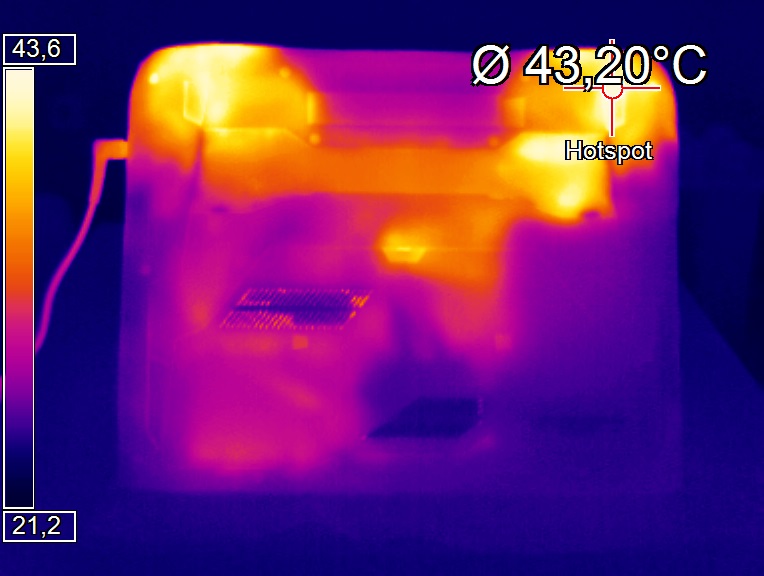
(±) The bottom heats up to a maximum of 41.5 °C / 107 F, compared to the average of 43.2 °C / 110 F
(+) In idle usage, the average temperature for the upper side is 29.5 °C / 85 F, compared to the device average of 33.8 °C / 93 F.
(+) The palmrests and touchpad are reaching skin temperature as a maximum (33 °C / 91.4 F) and are therefore not hot.
(-) The average temperature of the palmrest area of similar devices was 28.9 °C / 84 F (-4.1 °C / -7.4 F).
| Asus G752VS-XB78K | MSI GT72VR 6RE-015US | MSI GT62VR-6RE16H21 | Asus G752VY-RH71 | Asus G752VT | Alienware 17 R3 (A17-9935) | SCHENKER XMG U716 | |
|---|---|---|---|---|---|---|---|
| Heat | -5% | -5% | 8% | 4% | -14% | -23% | |
| Maximum Upper Side * | 42.9 | 40.6 5% | 44 -3% | 38.2 11% | 37.6 12% | 51.1 -19% | 48.8 -14% |
| Maximum Bottom * | 41.5 | 59.4 -43% | 53.1 -28% | 40.2 3% | 38 8% | 53.2 -28% | 55.8 -34% |
| Idle Upper Side * | 31.6 | 28.2 11% | 28.8 9% | 29 8% | 31.6 -0% | 31.7 -0% | 36.7 -16% |
| Idle Bottom * | 29.5 | 27.8 6% | 28.2 4% | 27 8% | 30.6 -4% | 32.2 -9% | 37.3 -26% |
* ... smaller is better
Asus G752VS-XB78K audio analysis
(±) | speaker loudness is average but good (76 dB)
Bass 100 - 315 Hz
(±) | reduced bass - on average 9.6% lower than median
(±) | linearity of bass is average (10.7% delta to prev. frequency)
Mids 400 - 2000 Hz
(+) | balanced mids - only 4.7% away from median
(±) | linearity of mids is average (10.3% delta to prev. frequency)
Highs 2 - 16 kHz
(±) | reduced highs - on average 8.3% lower than median
(±) | linearity of highs is average (9.7% delta to prev. frequency)
Overall 100 - 16.000 Hz
(±) | linearity of overall sound is average (22.4% difference to median)
Compared to same class
» 77% of all tested devices in this class were better, 6% similar, 16% worse
» The best had a delta of 6%, average was 18%, worst was 132%
Compared to all devices tested
» 60% of all tested devices were better, 6% similar, 33% worse
» The best had a delta of 4%, average was 25%, worst was 134%
MSI GT62VR-6RE16H21 audio analysis
(±) | speaker loudness is average but good (79 dB)
Bass 100 - 315 Hz
(±) | reduced bass - on average 11.3% lower than median
(±) | linearity of bass is average (11.4% delta to prev. frequency)
Mids 400 - 2000 Hz
(±) | higher mids - on average 8.3% higher than median
(+) | mids are linear (5.7% delta to prev. frequency)
Highs 2 - 16 kHz
(+) | balanced highs - only 4.3% away from median
(±) | linearity of highs is average (11% delta to prev. frequency)
Overall 100 - 16.000 Hz
(±) | linearity of overall sound is average (20.5% difference to median)
Compared to same class
» 70% of all tested devices in this class were better, 5% similar, 25% worse
» The best had a delta of 6%, average was 18%, worst was 132%
Compared to all devices tested
» 49% of all tested devices were better, 8% similar, 43% worse
» The best had a delta of 4%, average was 25%, worst was 134%
| Off / Standby | |
| Idle | |
| Load |
|
| Asus G752VS-XB78K GeForce GTX 1070 Mobile, 6820HK | MSI GT72VR 6RE-015US GeForce GTX 1070 Mobile, 6700HQ | MSI GT62VR-6RE16H21 GeForce GTX 1070 Mobile, 6700HQ | Alienware 17 R3 (A17-9935) GeForce GTX 980M, 6700HQ | SCHENKER XMG U716 GeForce GTX 980 (Laptop), 6700 | |
|---|---|---|---|---|---|
| Power Consumption | -5% | 8% | 25% | -44% | |
| Idle Minimum * | 24 | 22.3 7% | 20 17% | 12 50% | 35 -46% |
| Idle Average * | 31 | 27.3 12% | 26 16% | 18 42% | 44 -42% |
| Idle Maximum * | 36 | 30 17% | 32 11% | 26 28% | 51 -42% |
| Load Average * | 94 | 152.2 -62% | 100 -6% | 95 -1% | 134 -43% |
| Load Maximum * | 204 | 204.2 -0% | 202 1% | 188 8% | 298 -46% |
* ... smaller is better


| Asus G752VS-XB78K 90 Wh | MSI GT72VR 6RE-015US 83 Wh | MSI GT62VR-6RE16H21 75.24 Wh | Asus G752VY-RH71 67 Wh | Asus G752VT 67 Wh | Alienware 17 R3 (A17-9935) 92 Wh | SCHENKER XMG U716 82 Wh | |
|---|---|---|---|---|---|---|---|
| Battery Runtime | 4% | 9% | 17% | -18% | 93% | -22% | |
| Reader / Idle | 311 | 322 4% | 300 -4% | 368 18% | 230 -26% | 758 144% | 158 -49% |
| H.264 | 186 | ||||||
| WiFi v1.3 | 210 | 224 7% | 246 17% | 241 15% | 183 -13% | 444 111% | |
| Load | 84 | 86 2% | 97 15% | 100 19% | 72 -14% | 105 25% | 88 5% |
| Gaming | 80 |
Pros
Cons
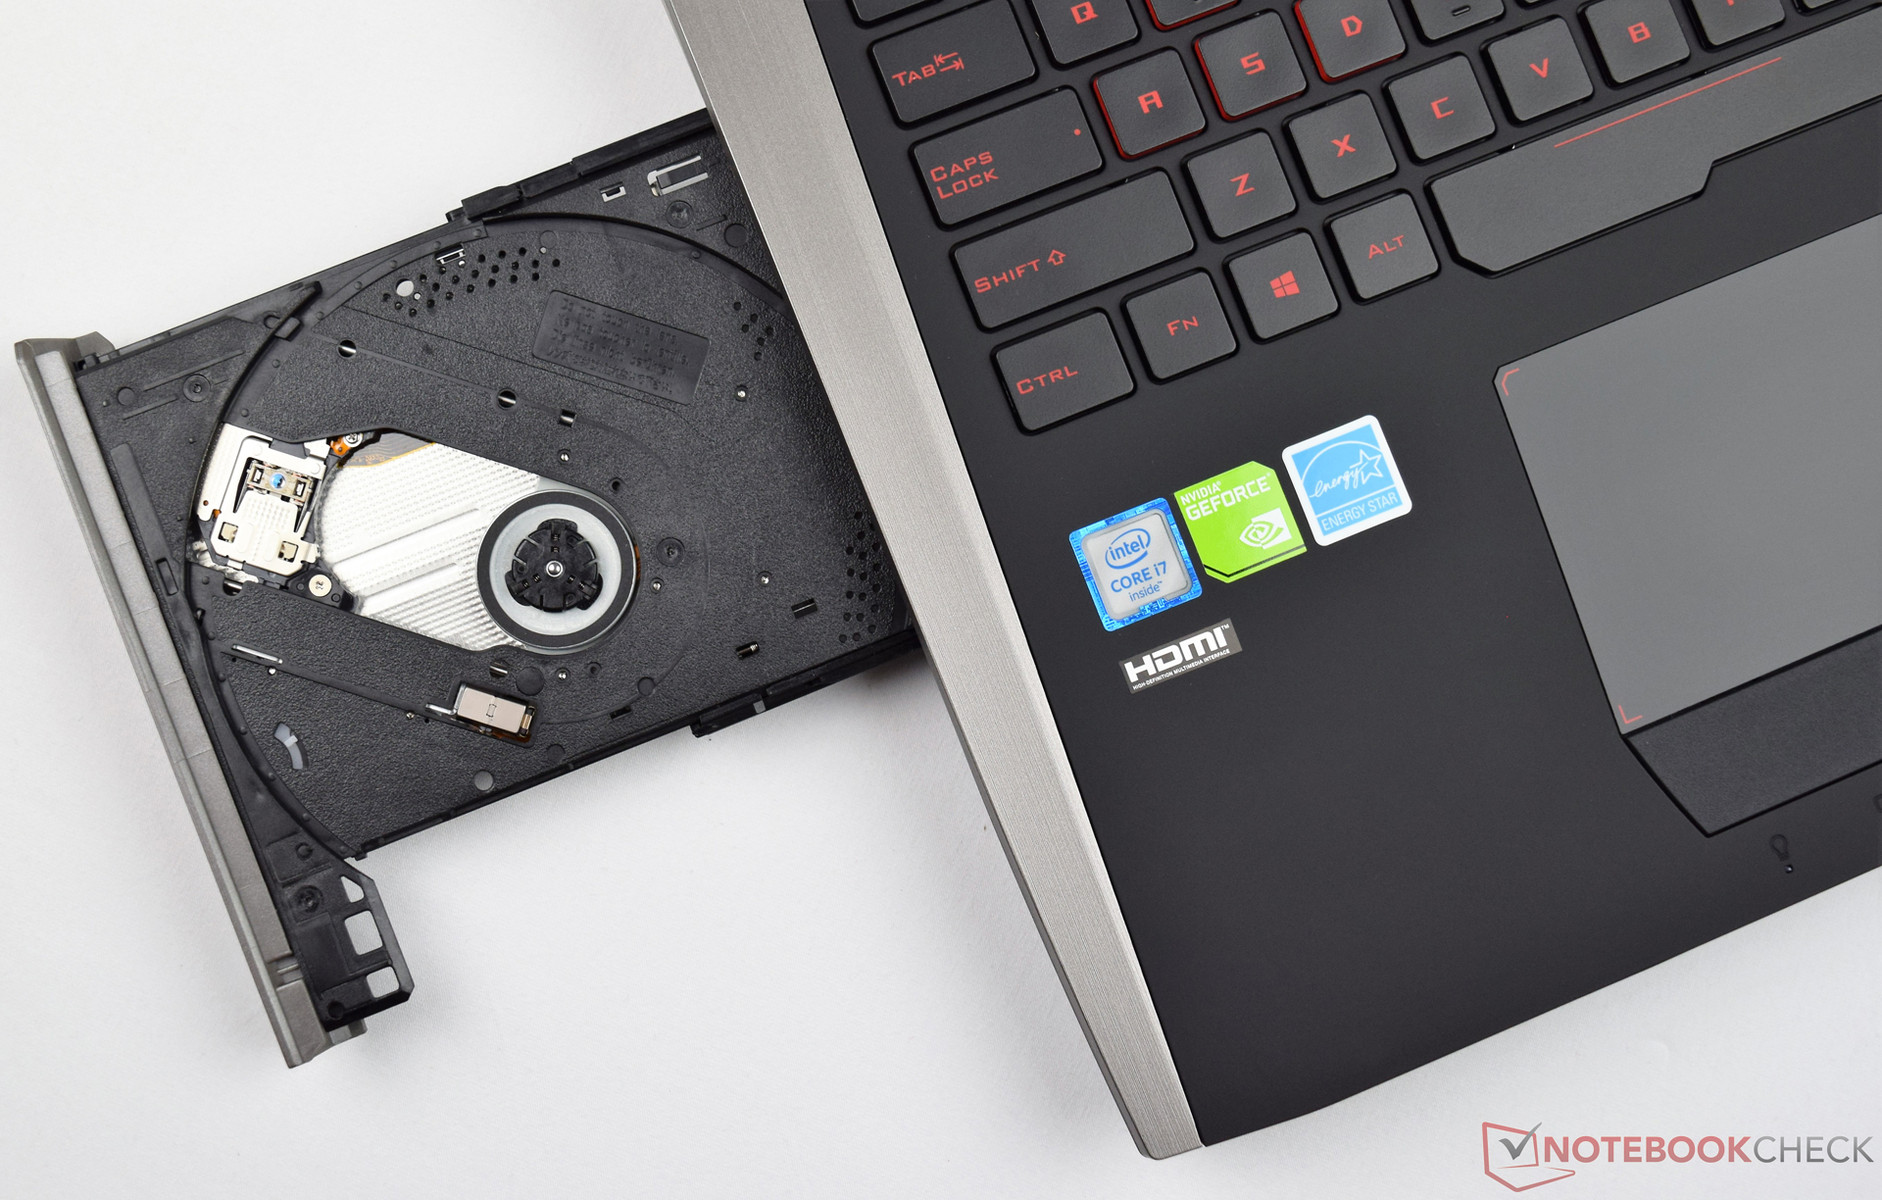
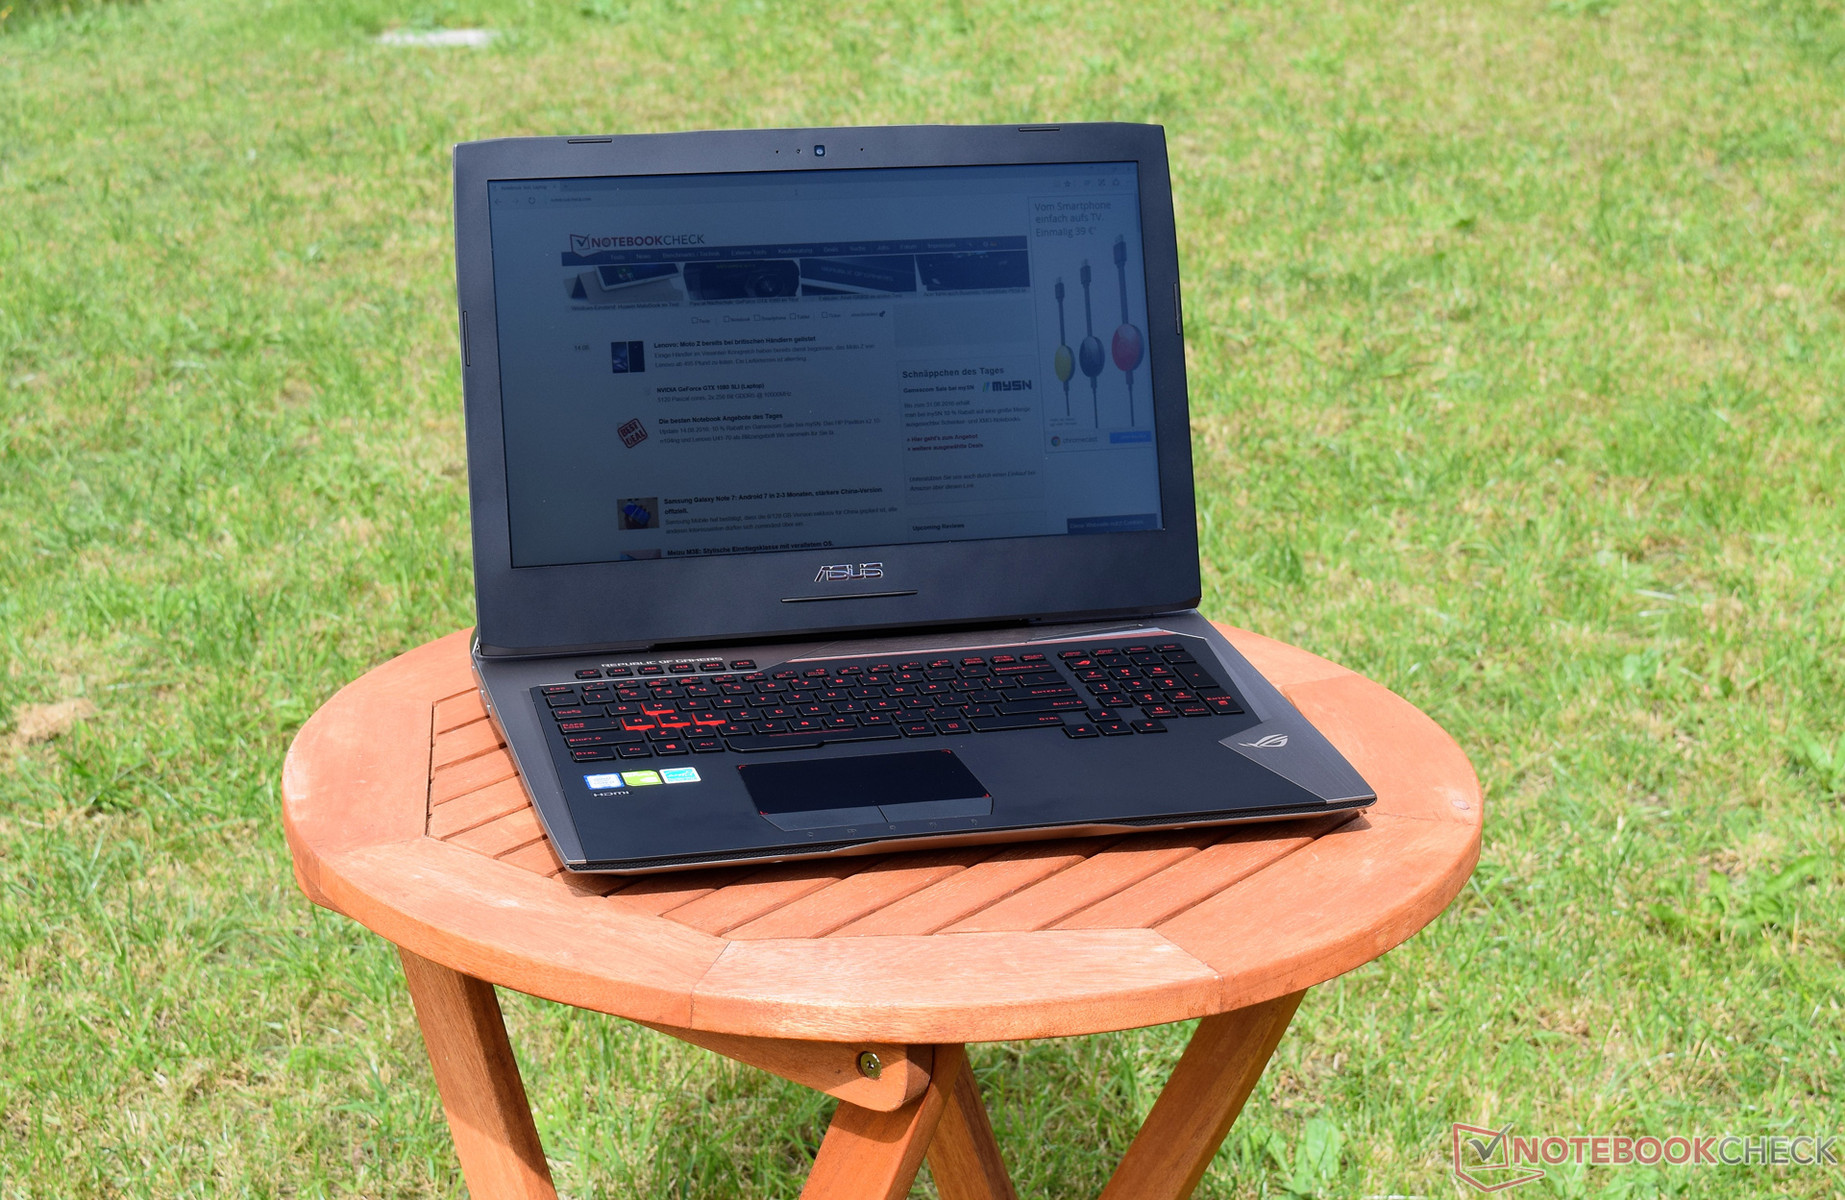
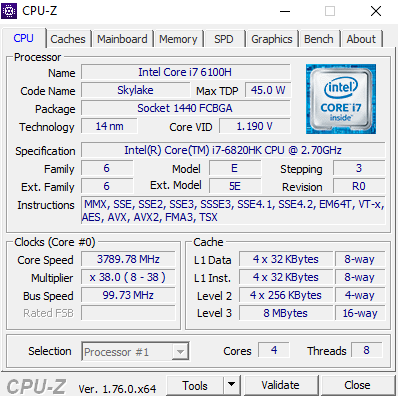
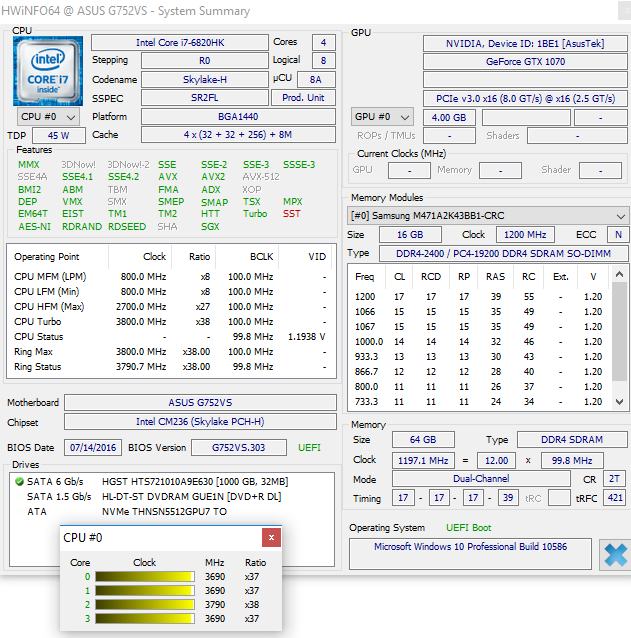
这台来自华硕的高端笔记本电脑面对其他竞争机型可以毫无怯色地挺胸昂头。选择华硕G752VS的用户将会掌握极致的性能。Pascal芯片的上市标志着一个全新游戏本世代的开端,它的性能相比前代芯片有了质的飞跃。
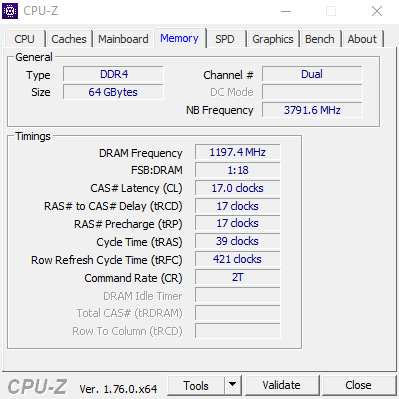
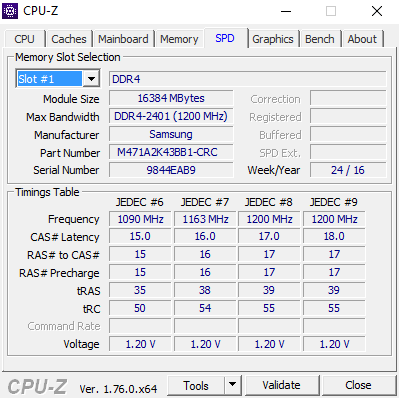
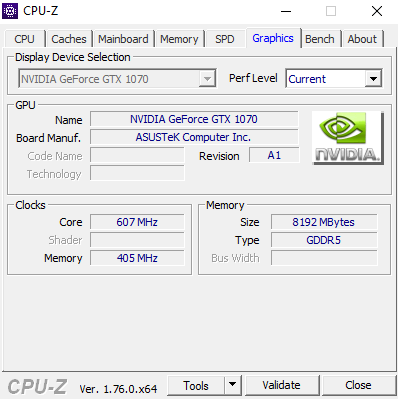
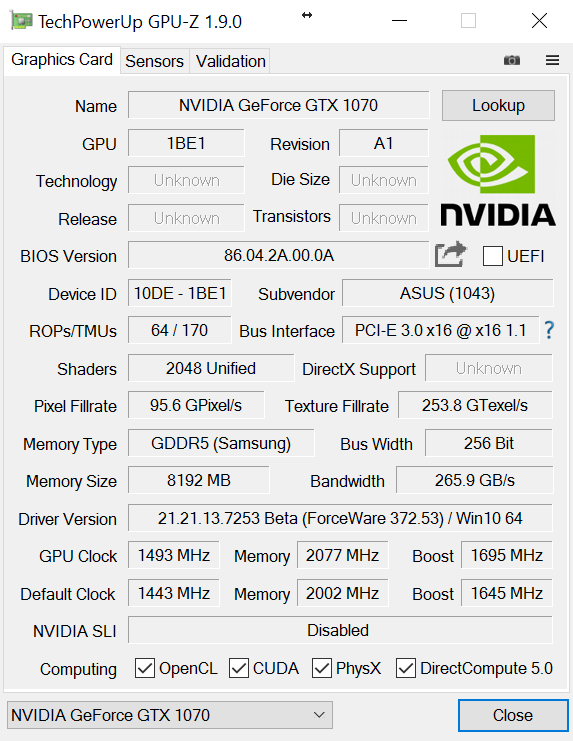
英伟达GeForce GTX 1070是同系列单芯片系统中第二强的显卡,目前只有英伟达GeForce GTX 1080可以相比领先。在内存的方面用户也不需要担心,64 GB的DDR4内存可以轻松应对要求最高的软件需要。
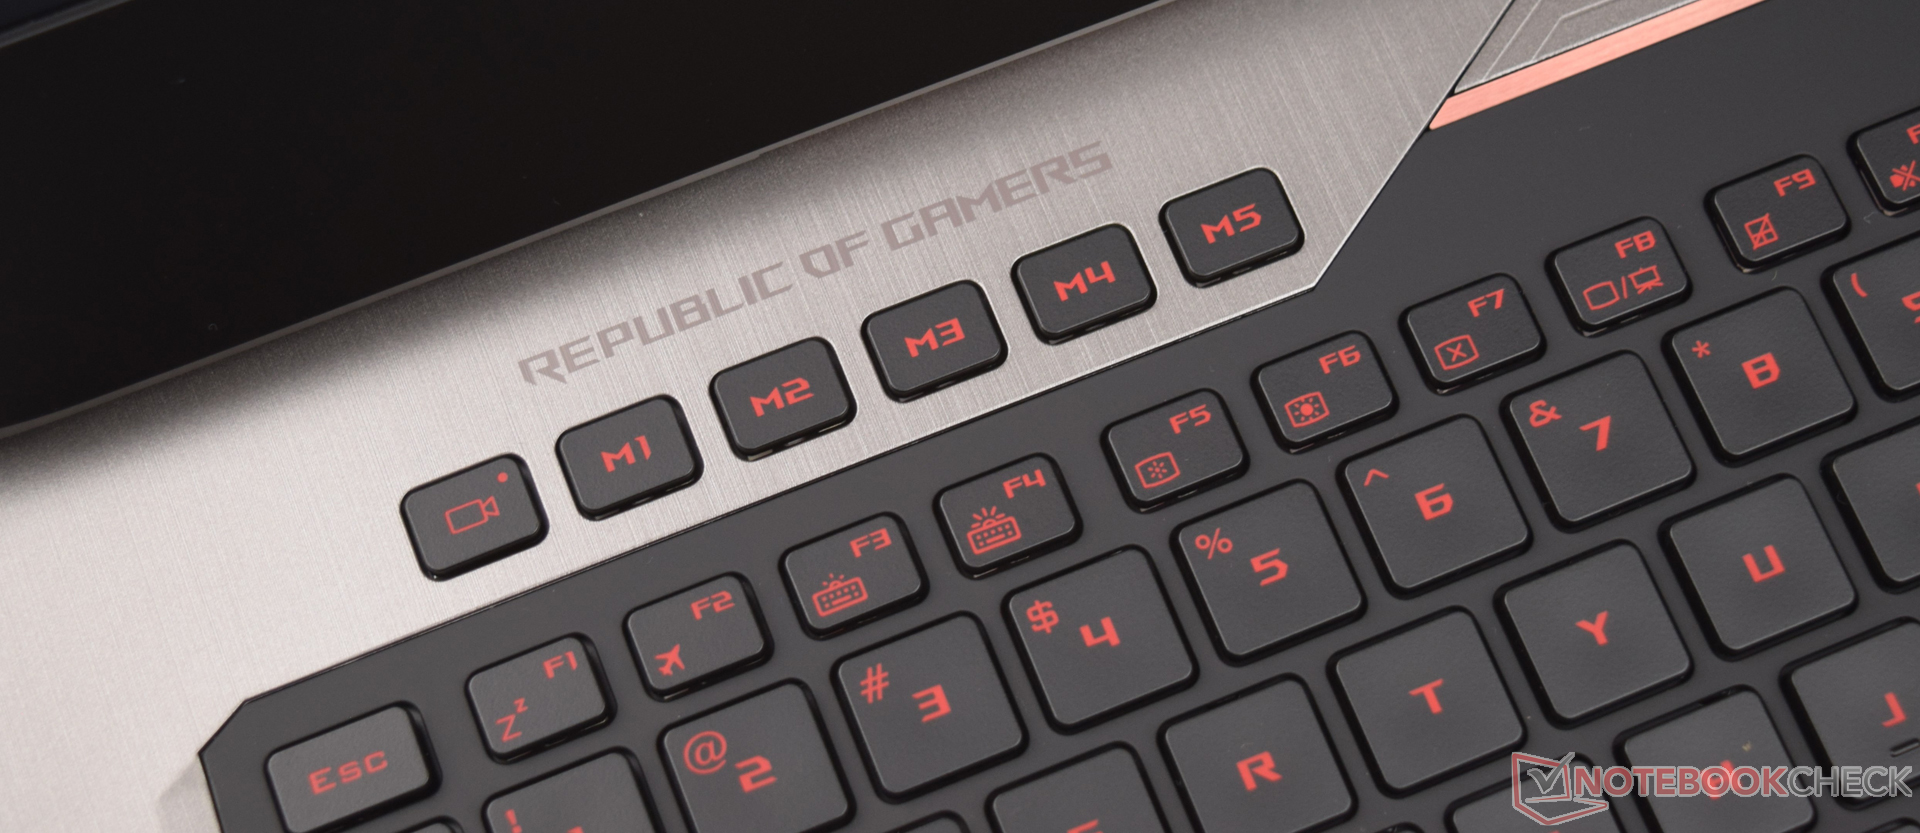
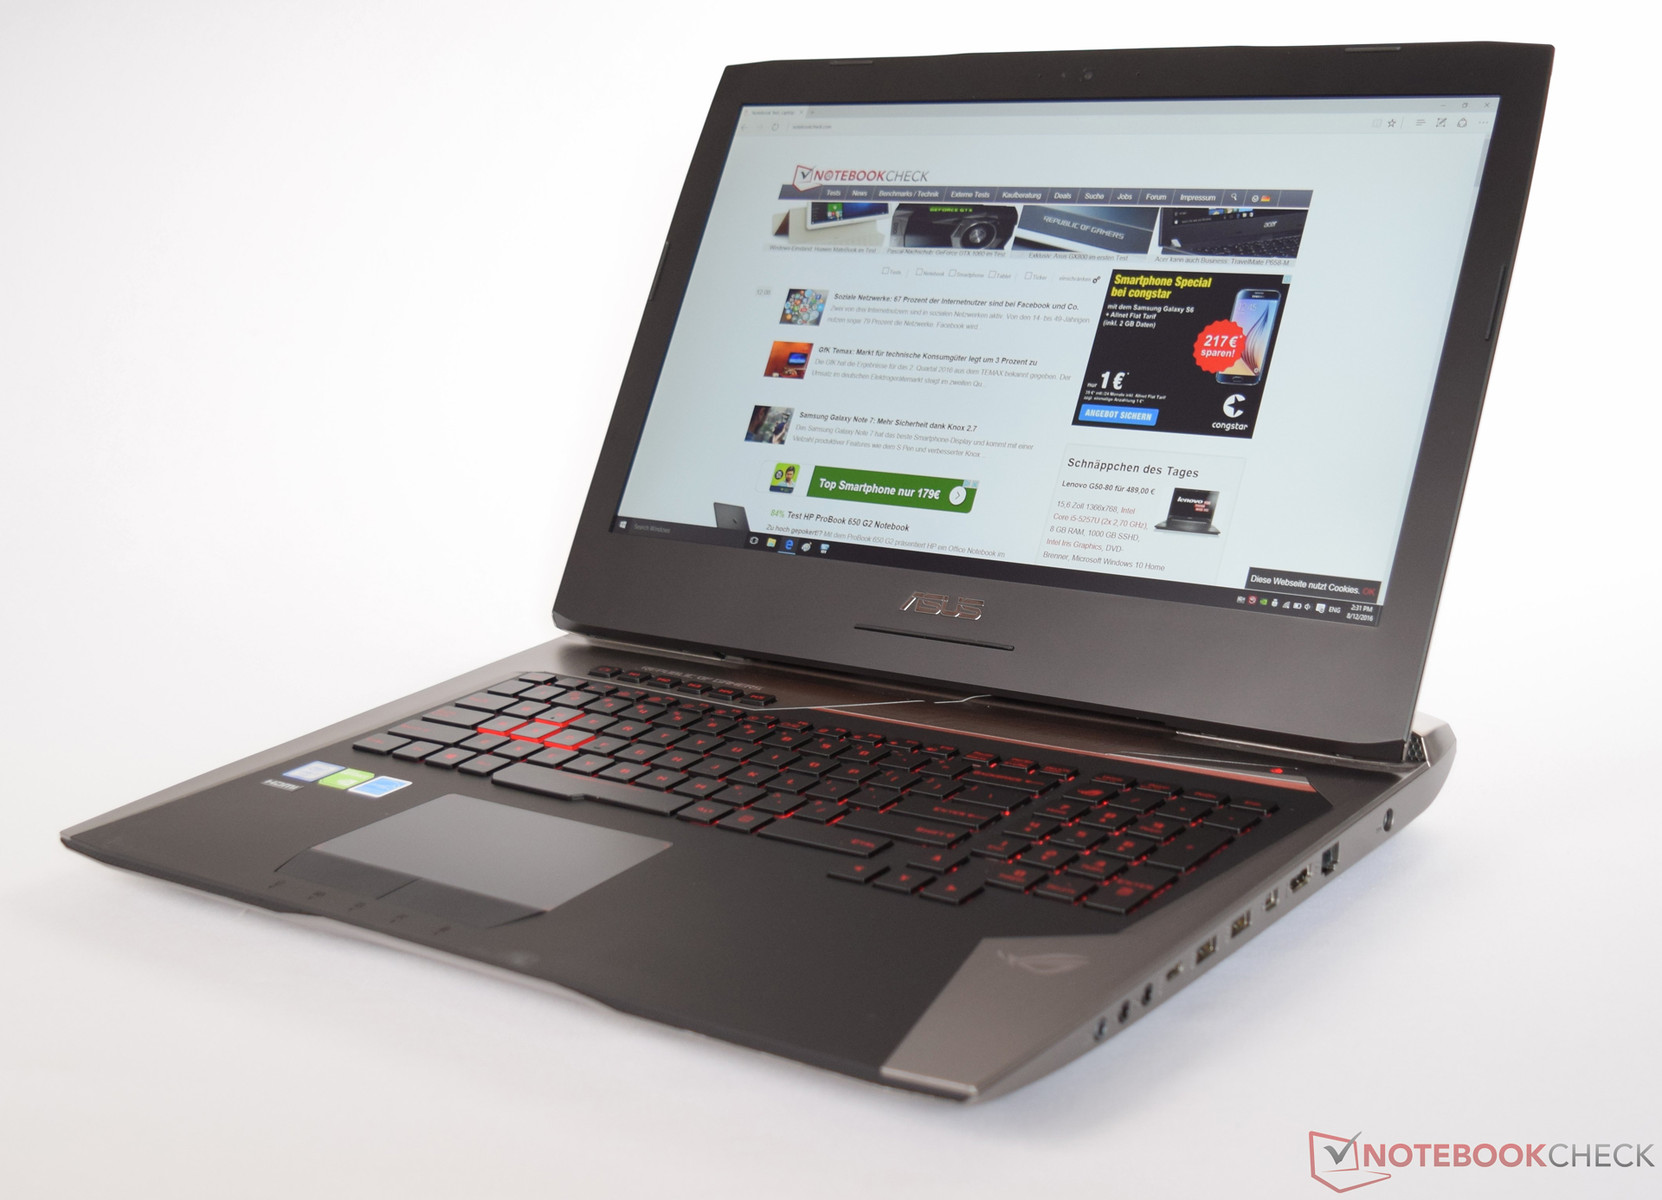
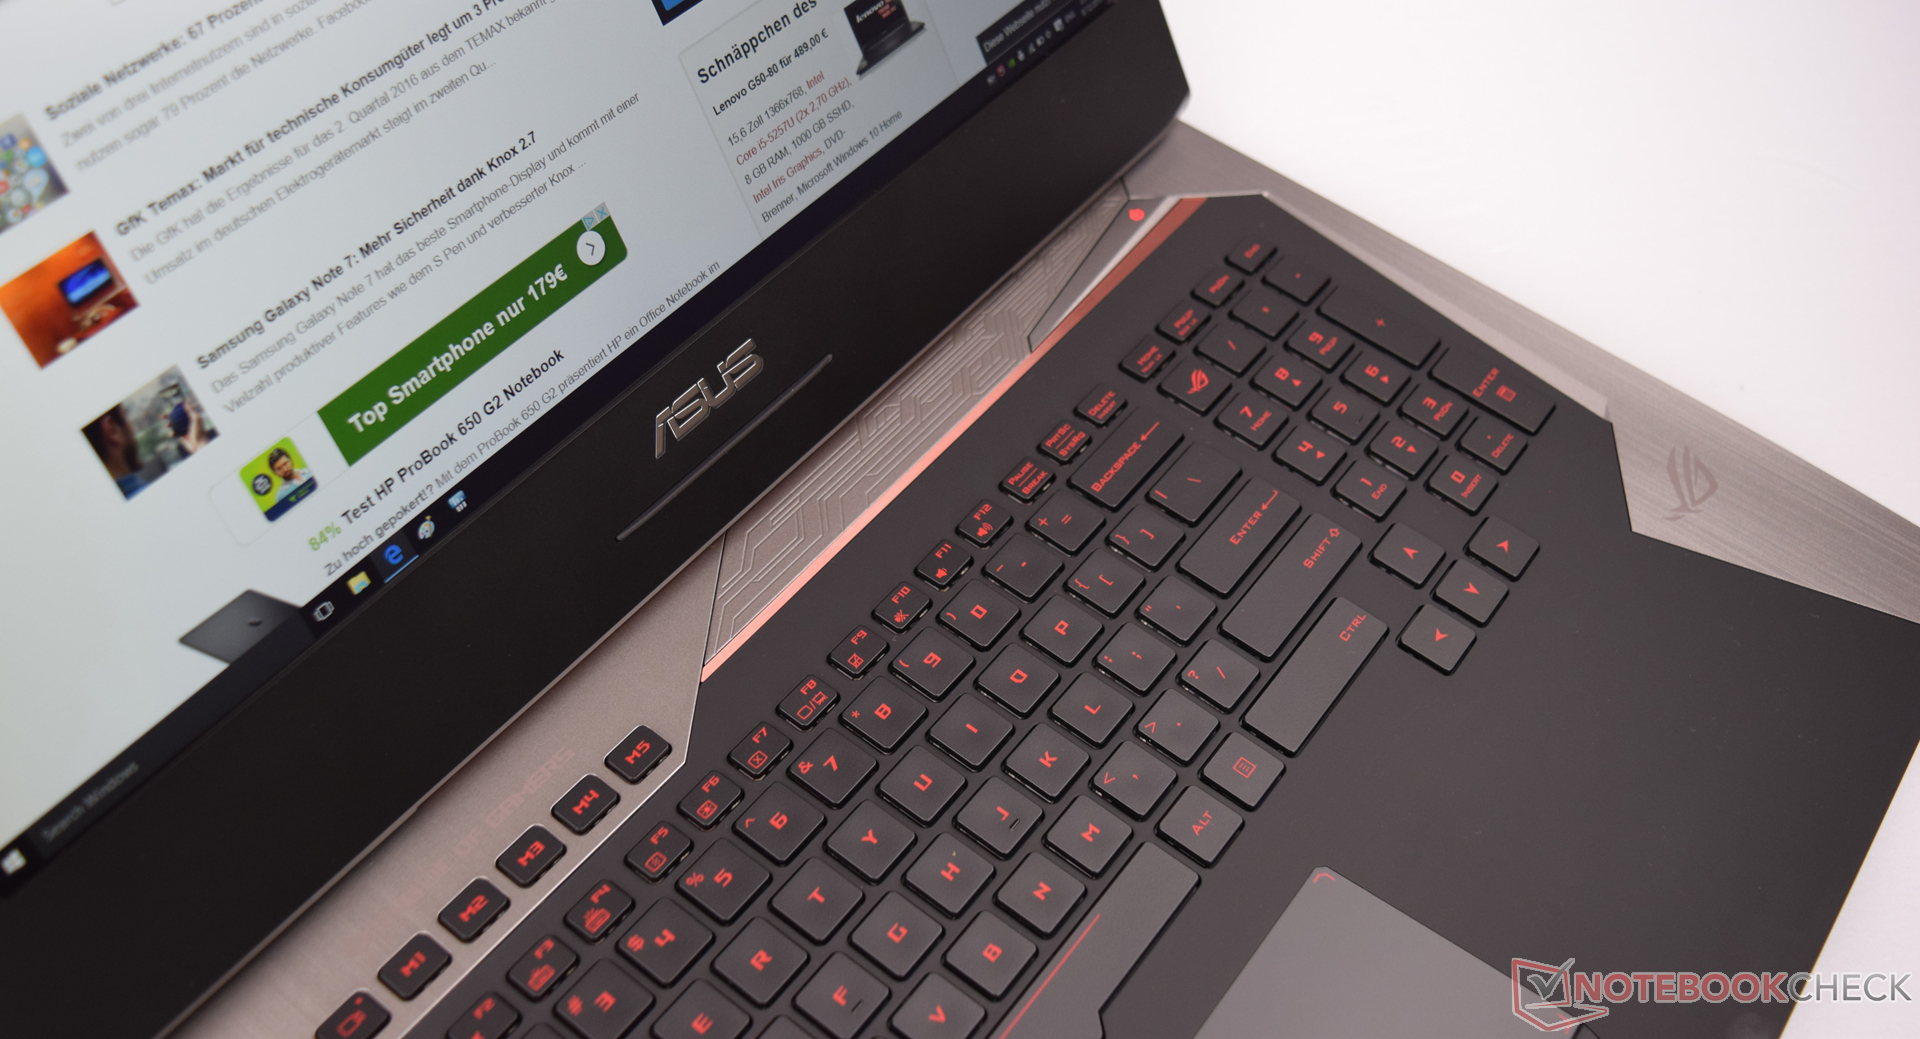
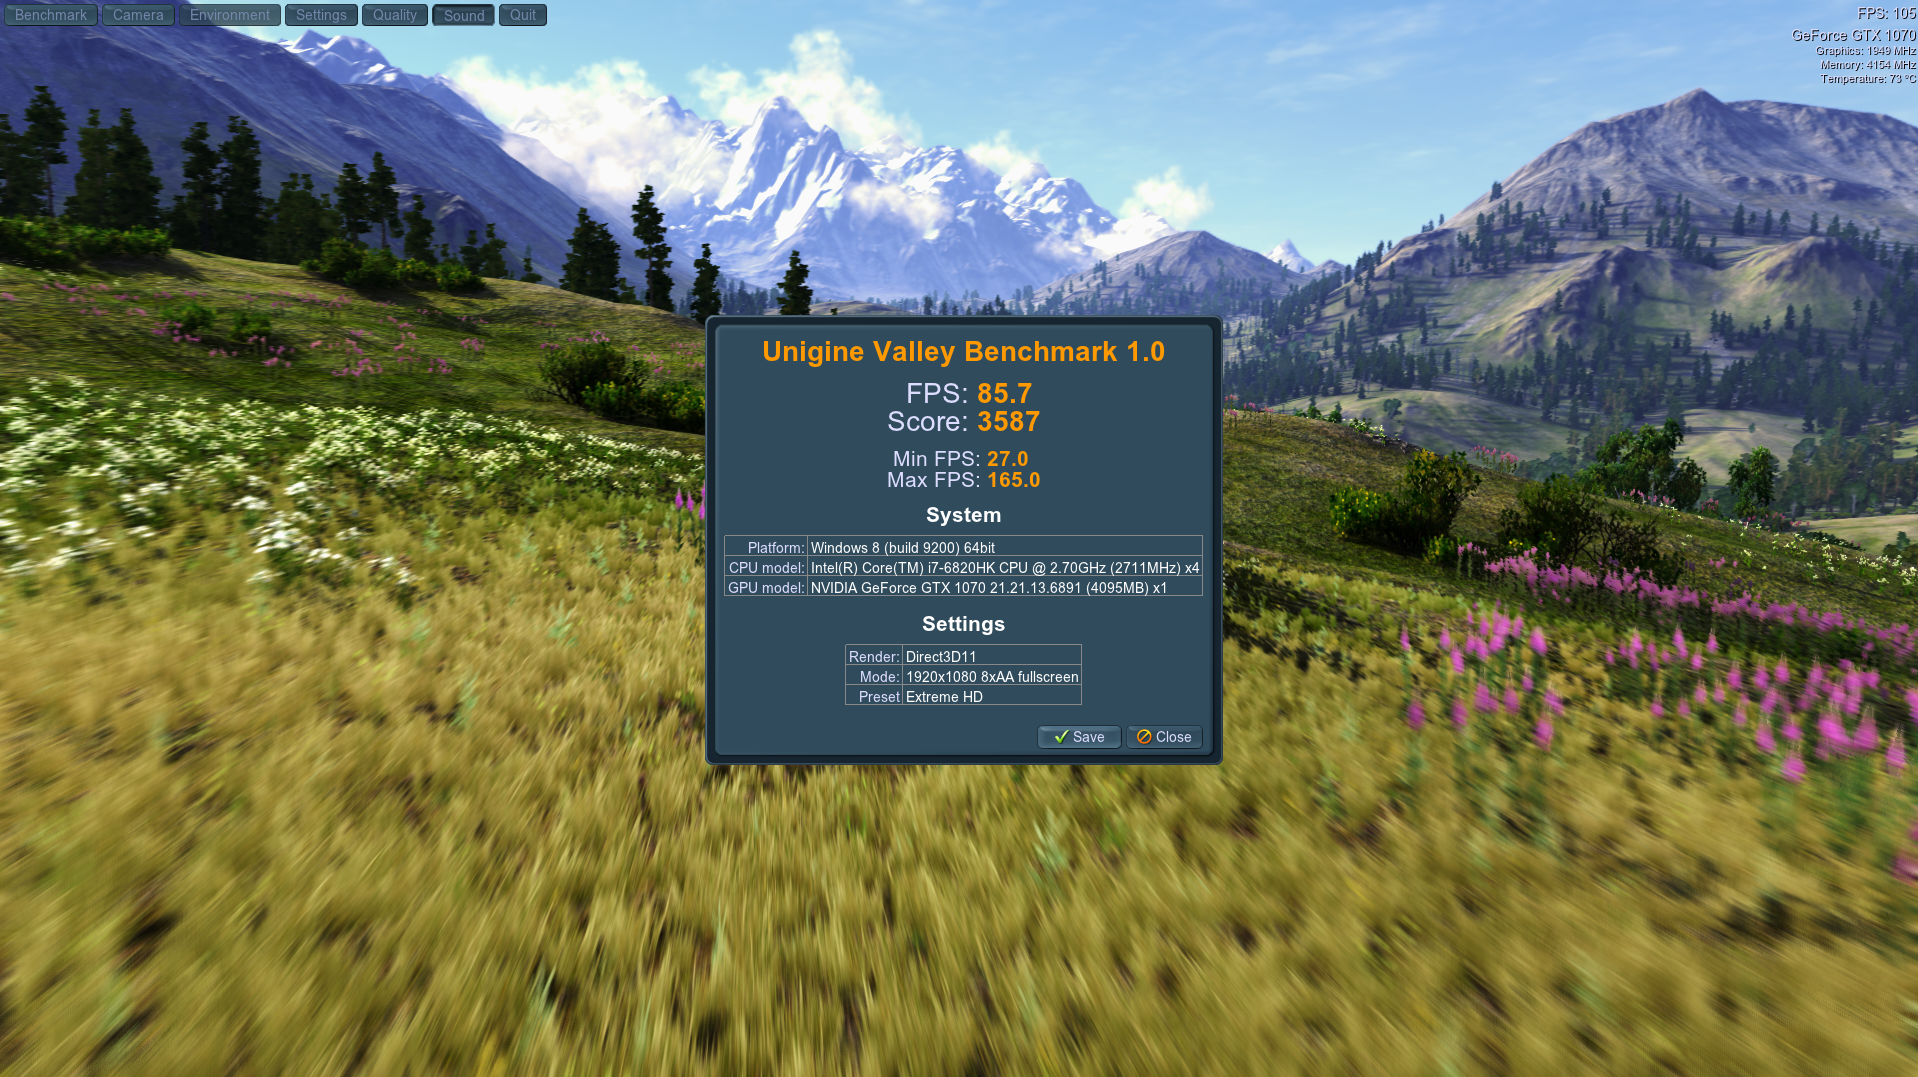
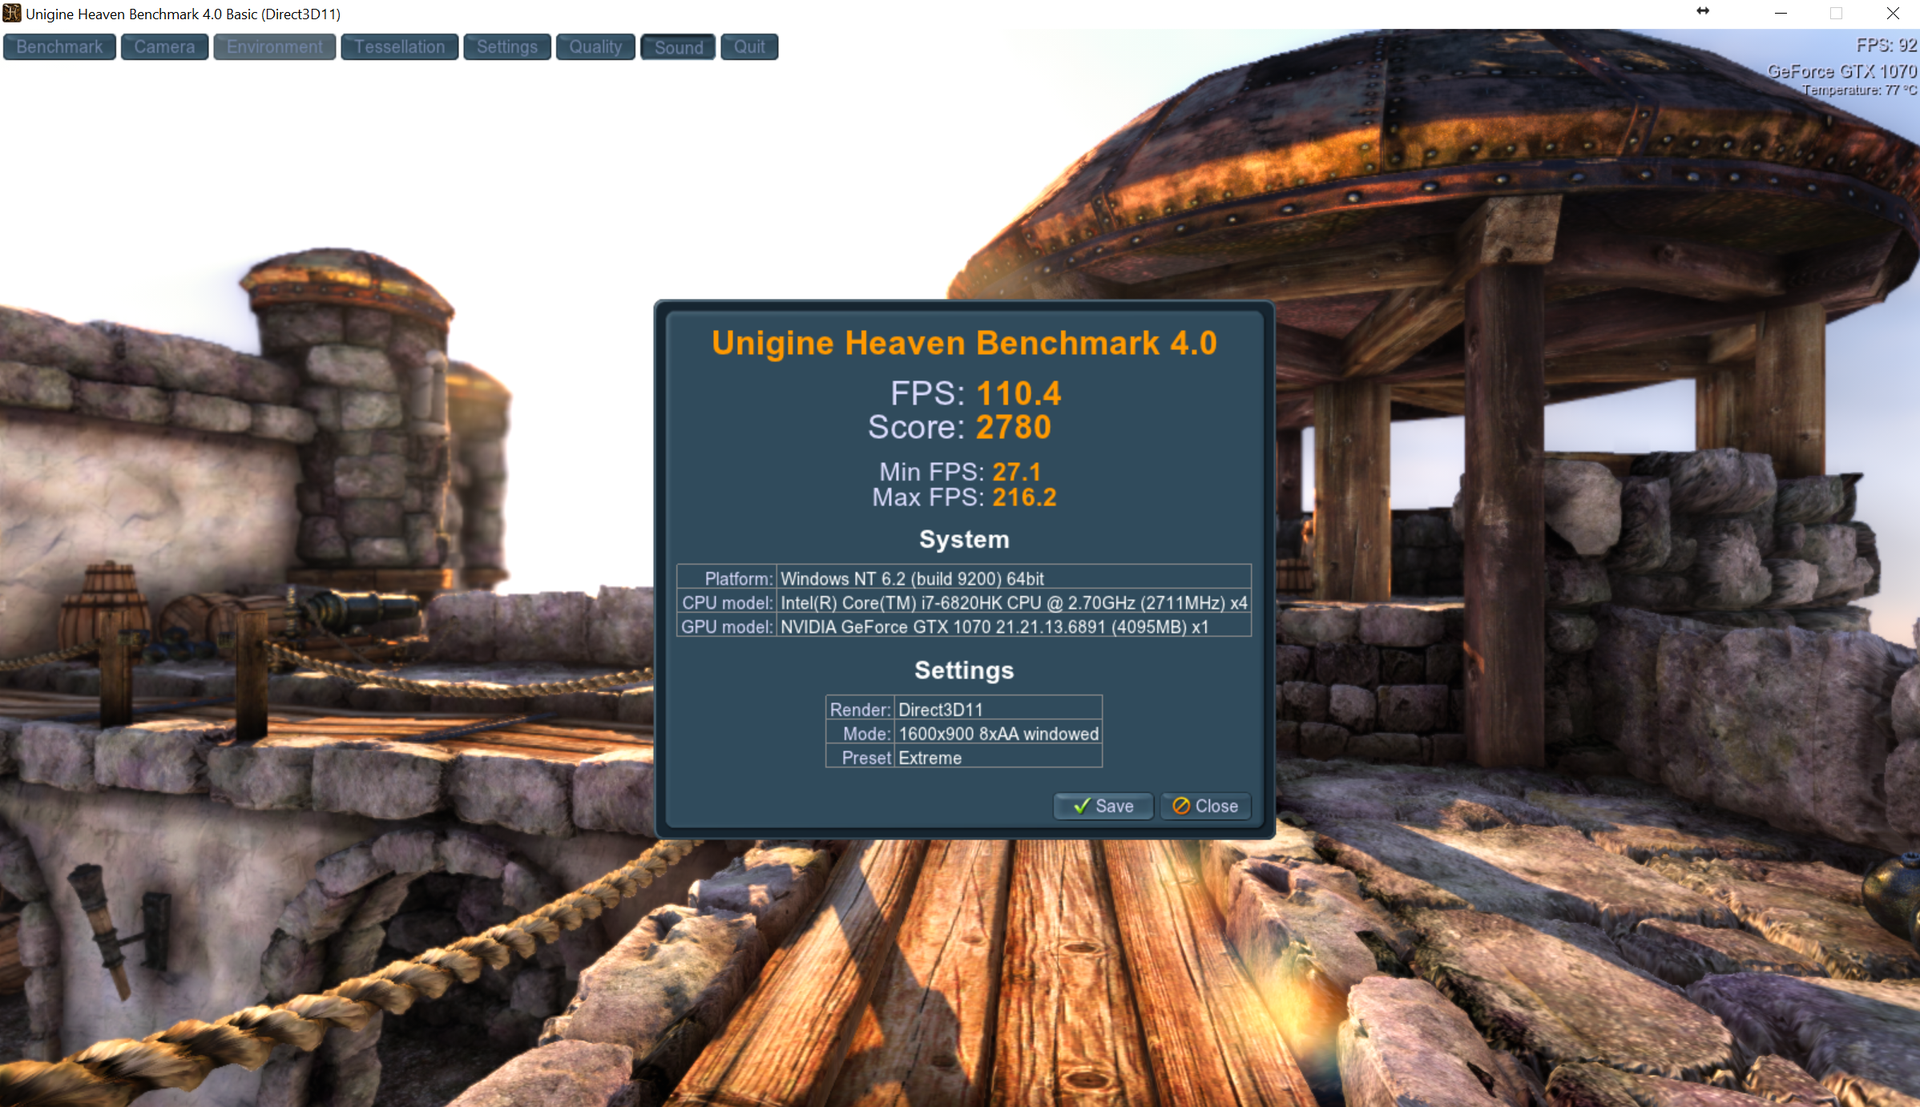
华硕成功的提升了G752VS的性能表现,它可以在4K中高设定下流畅运行最新游戏。它的机身品质也完全可以让人满意。一些额外功能如G-Sync和可定义按键对游戏玩家来说也十分实用。
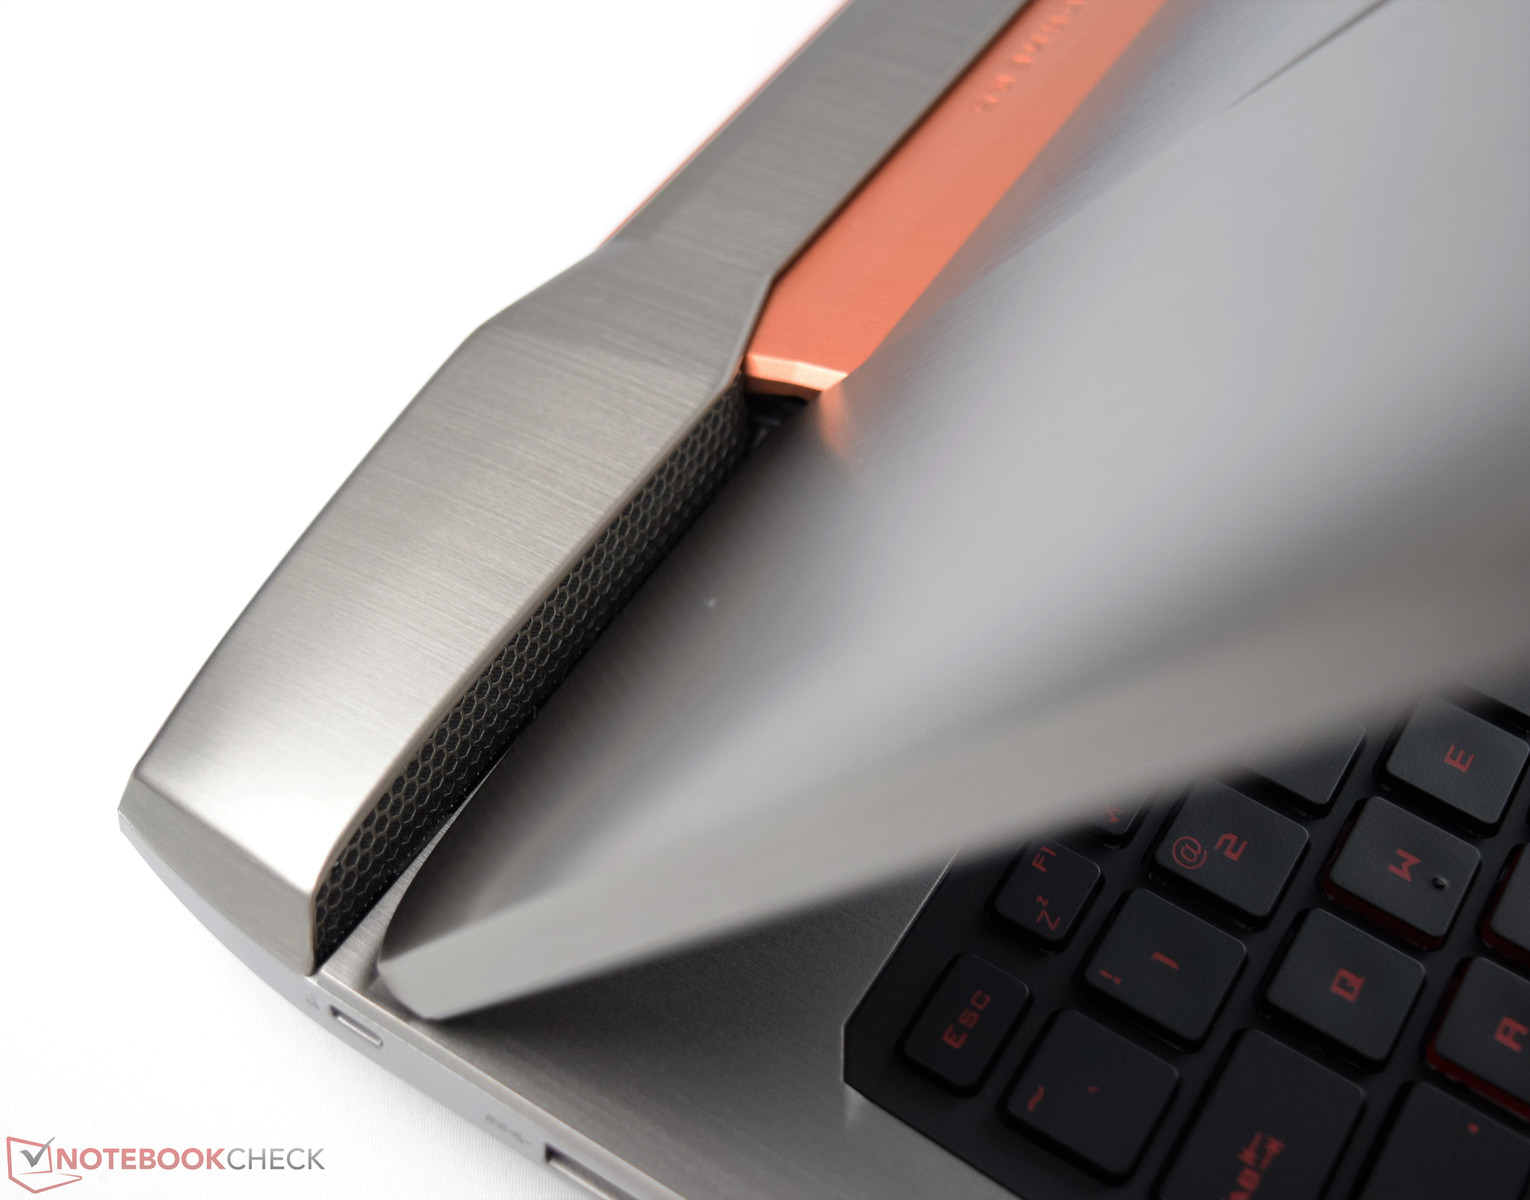
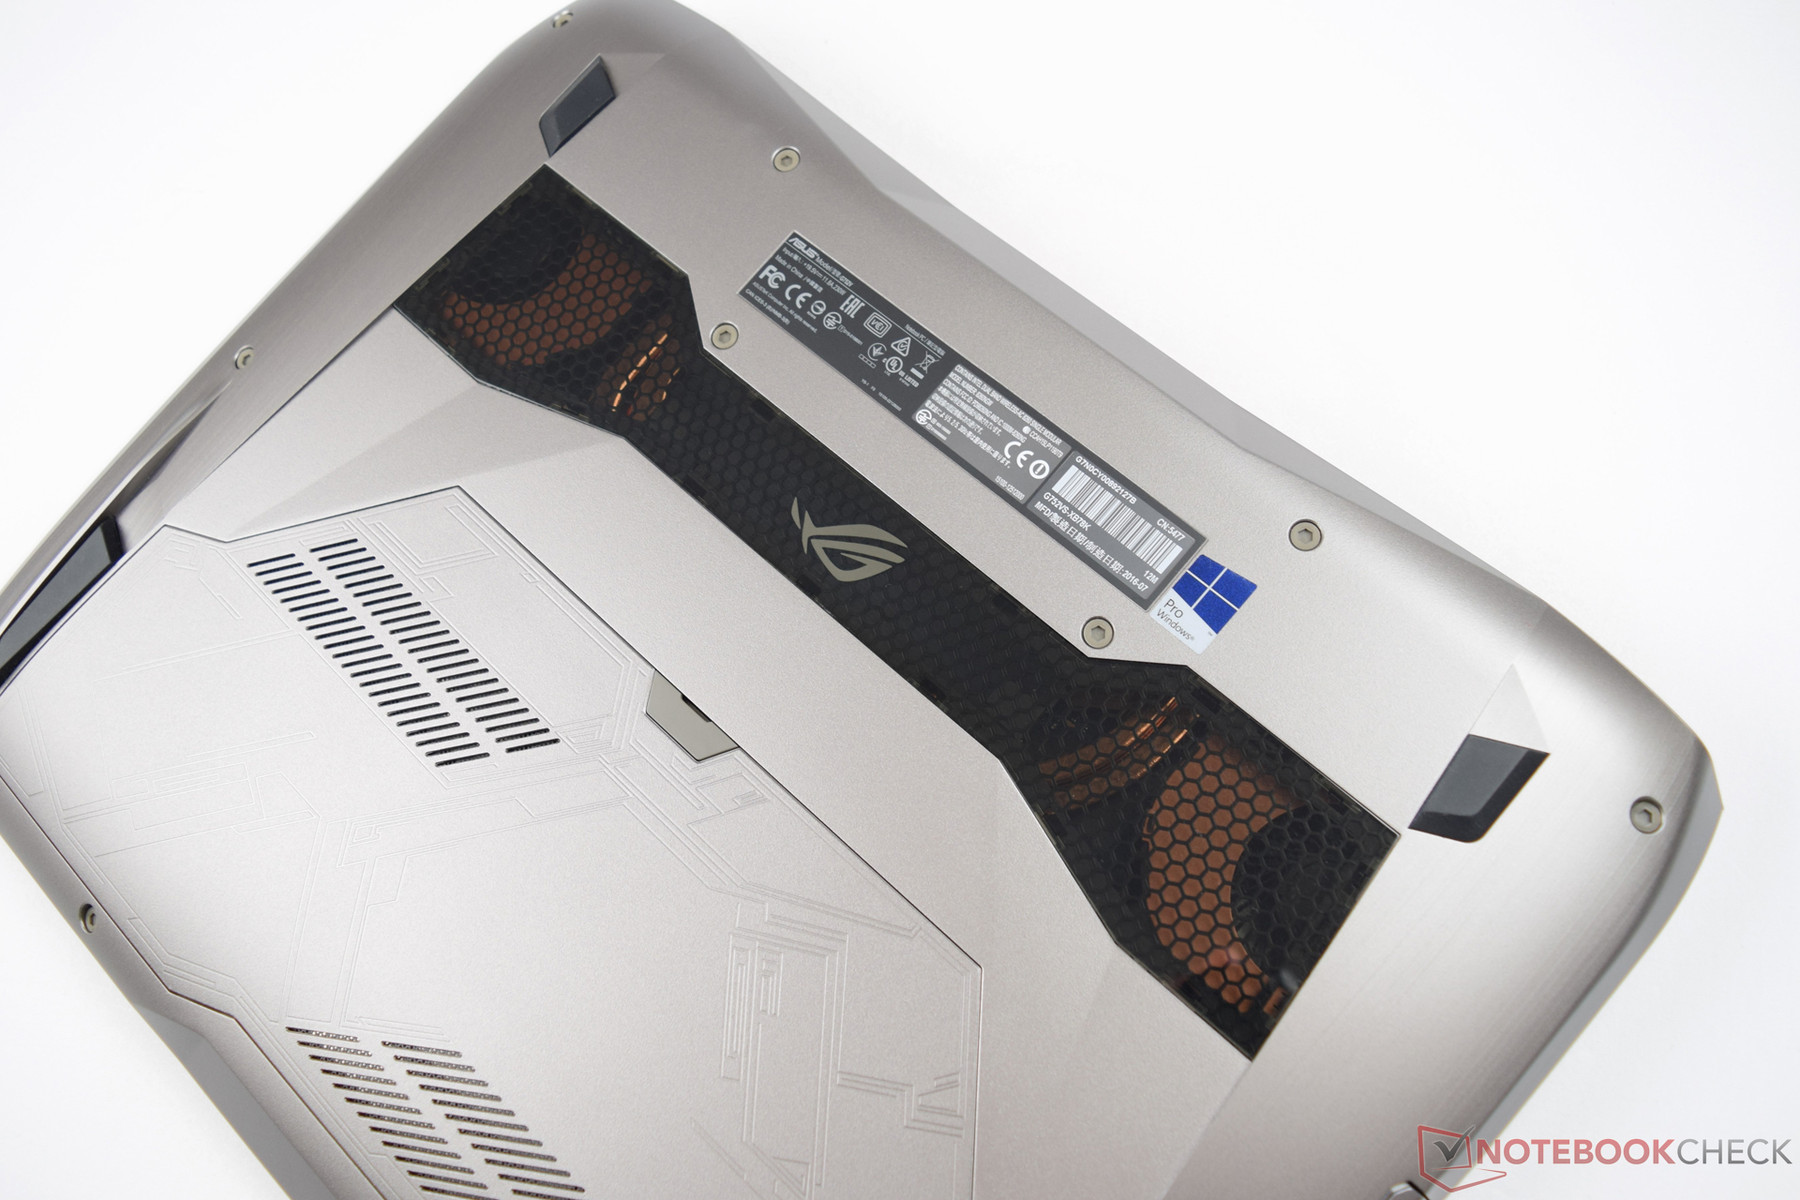
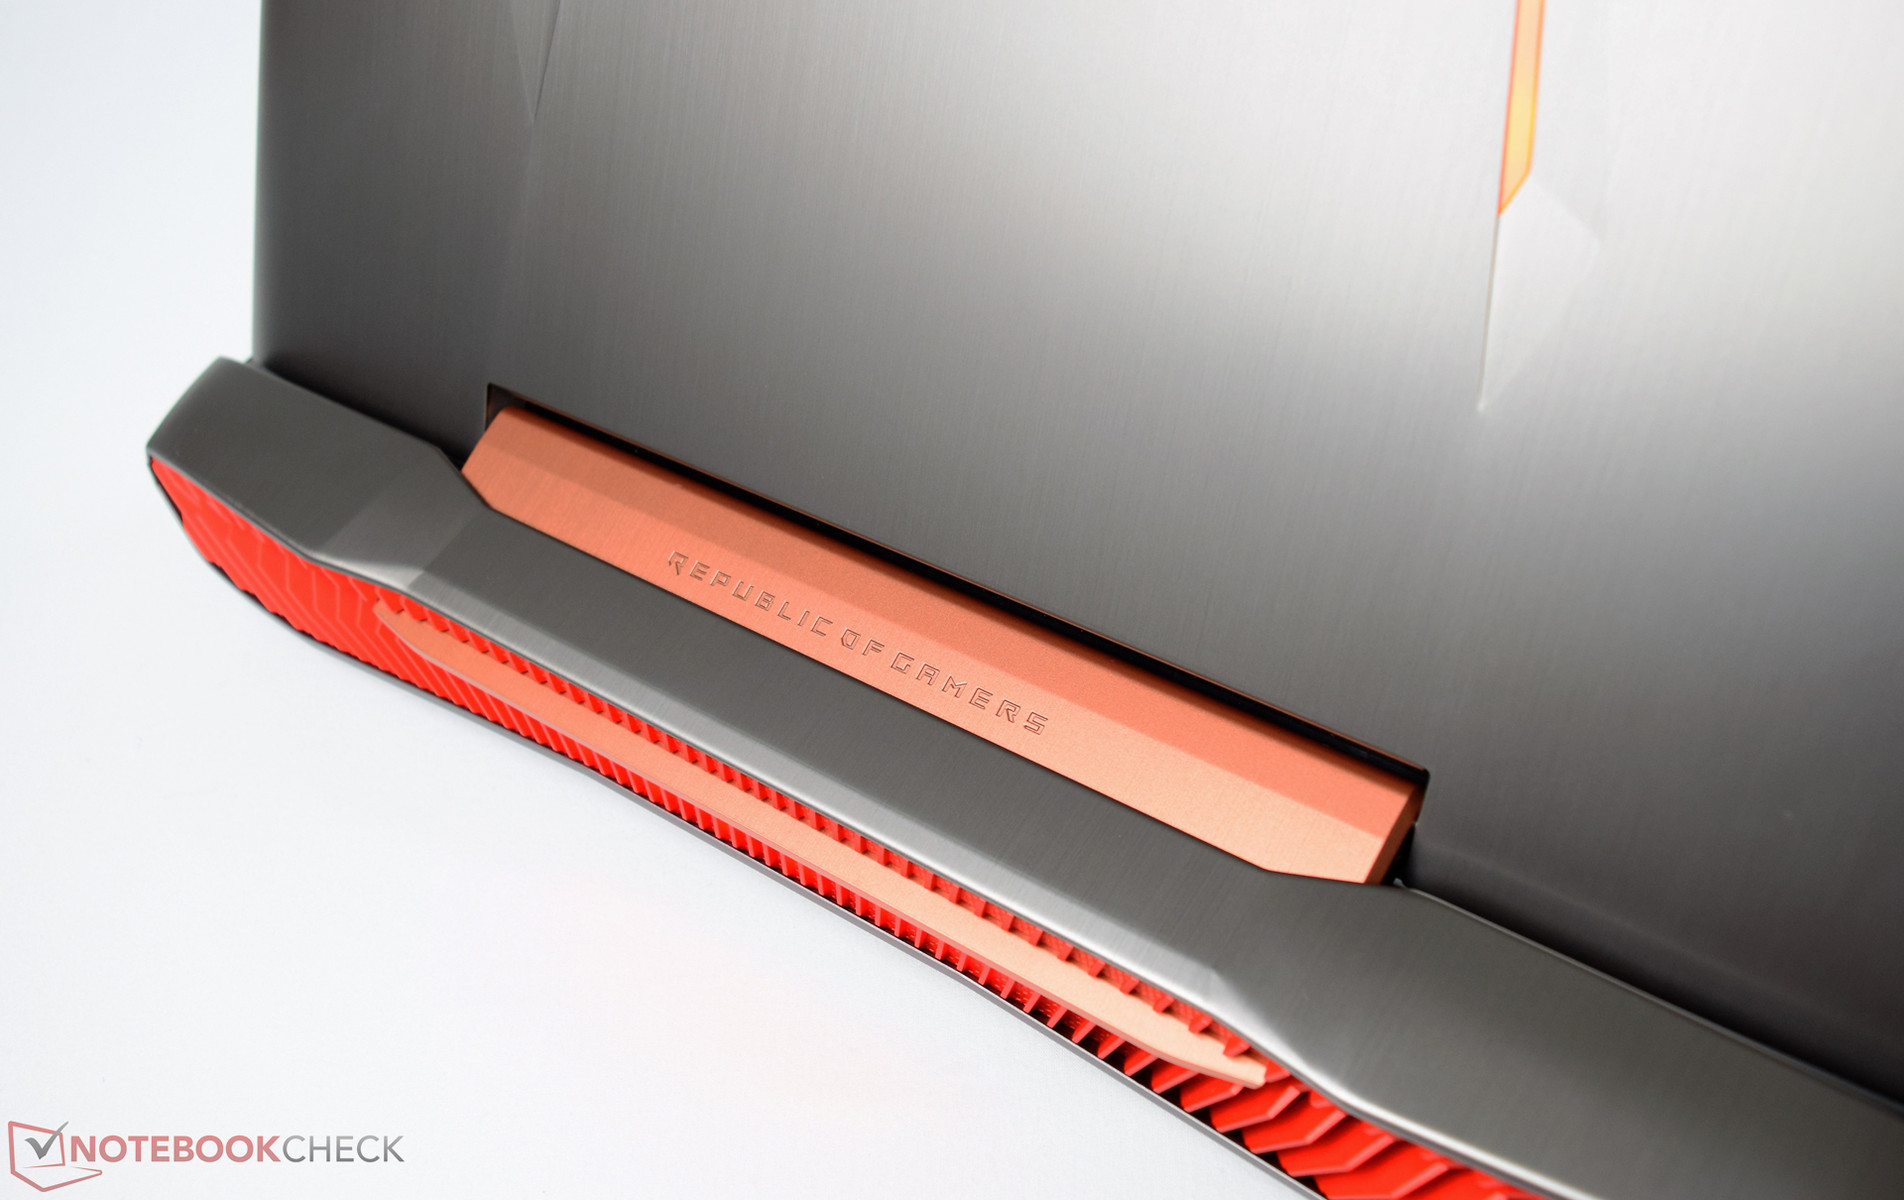
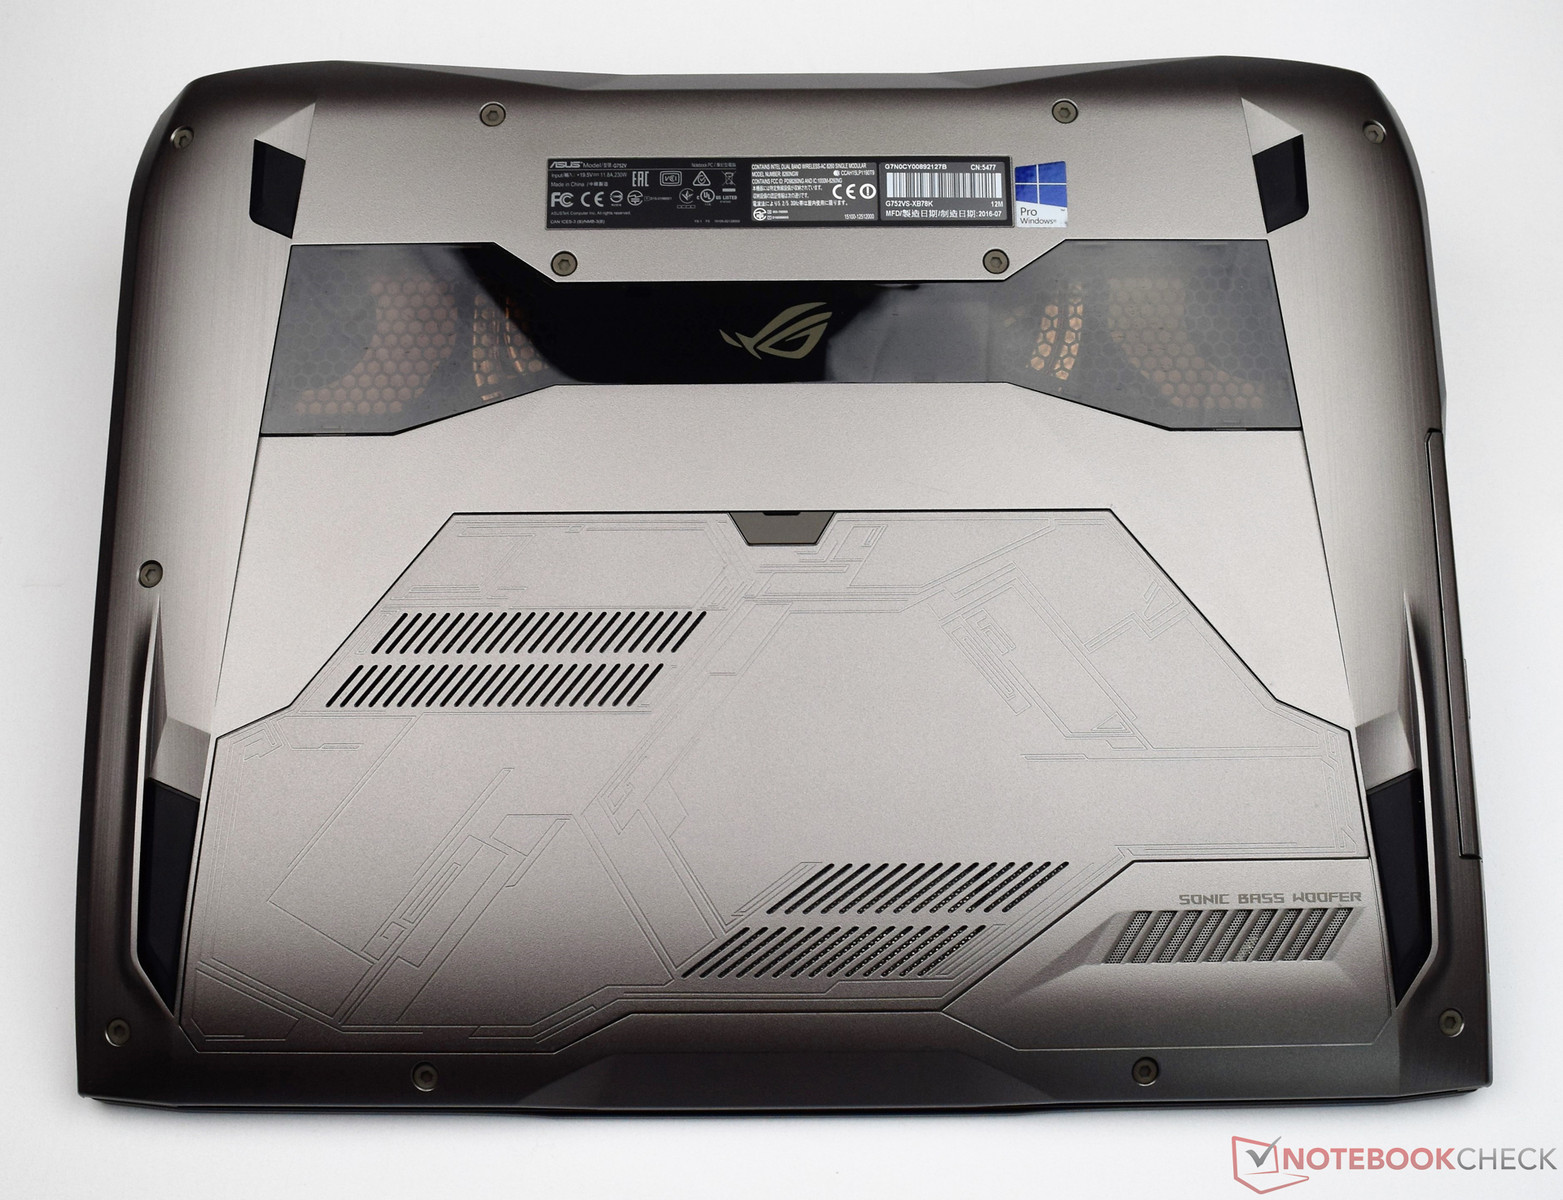
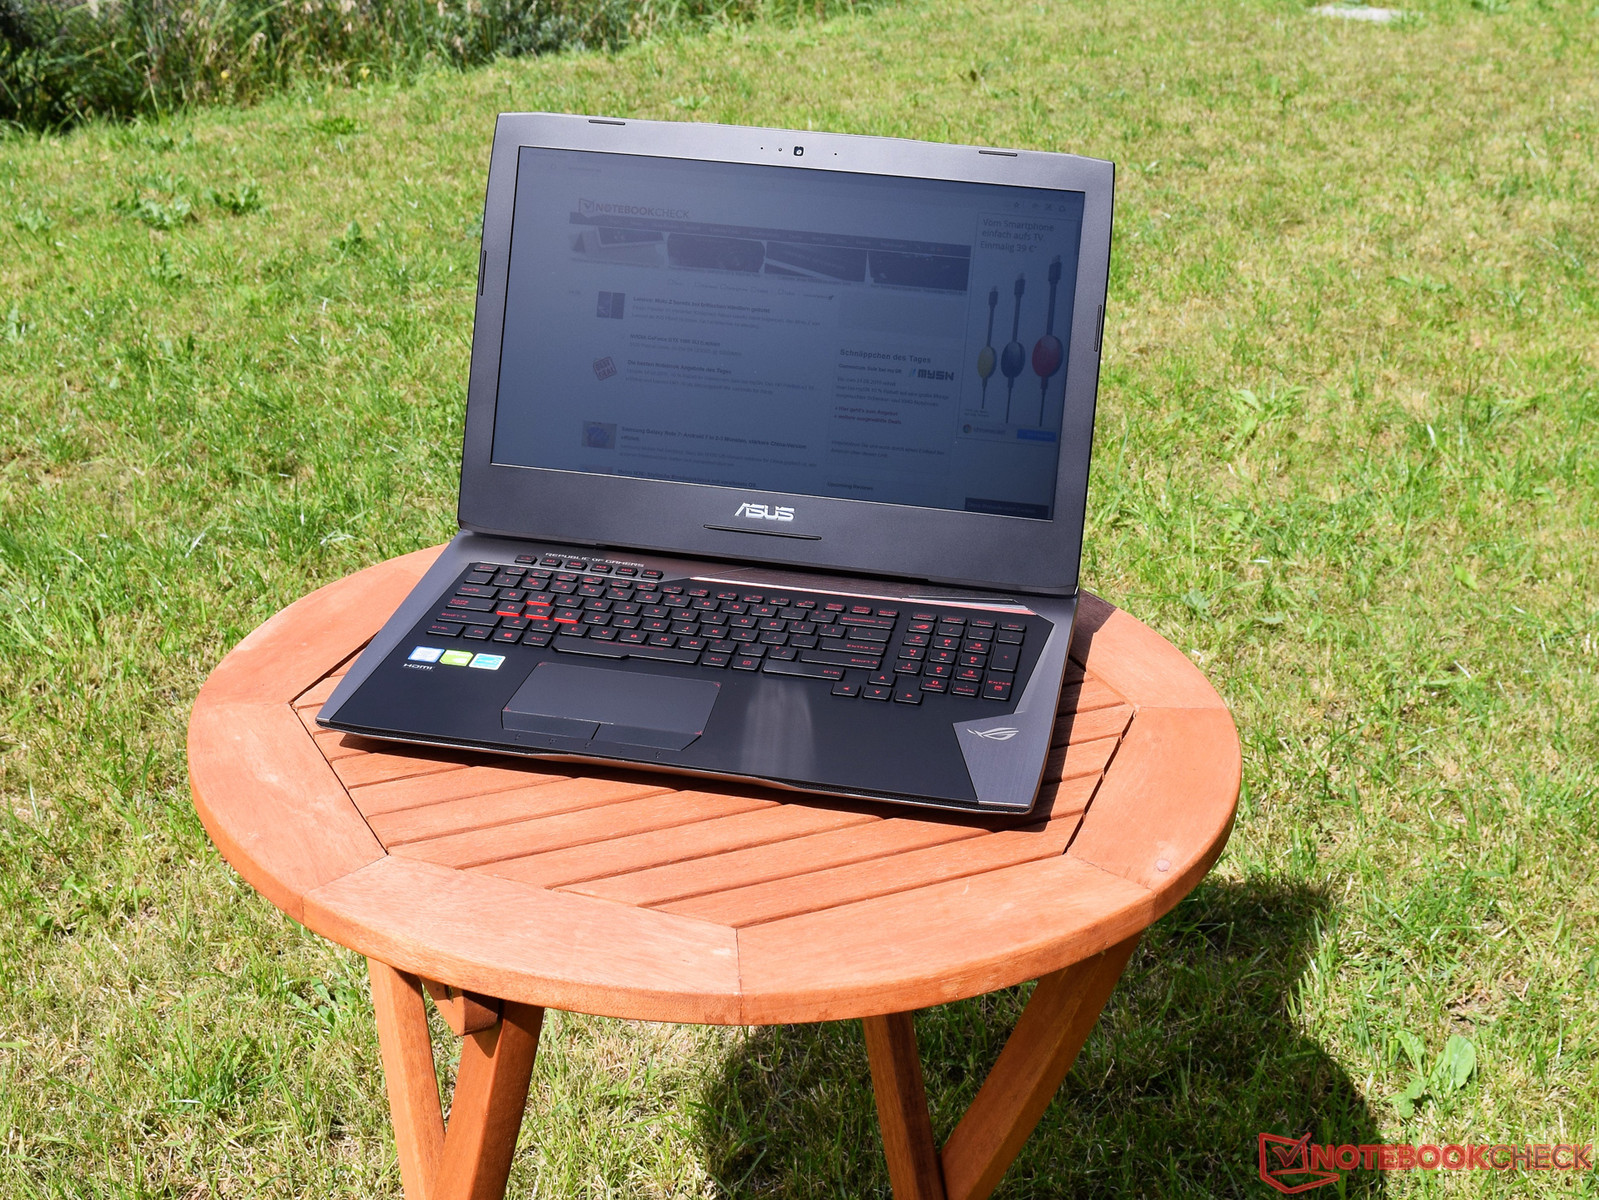
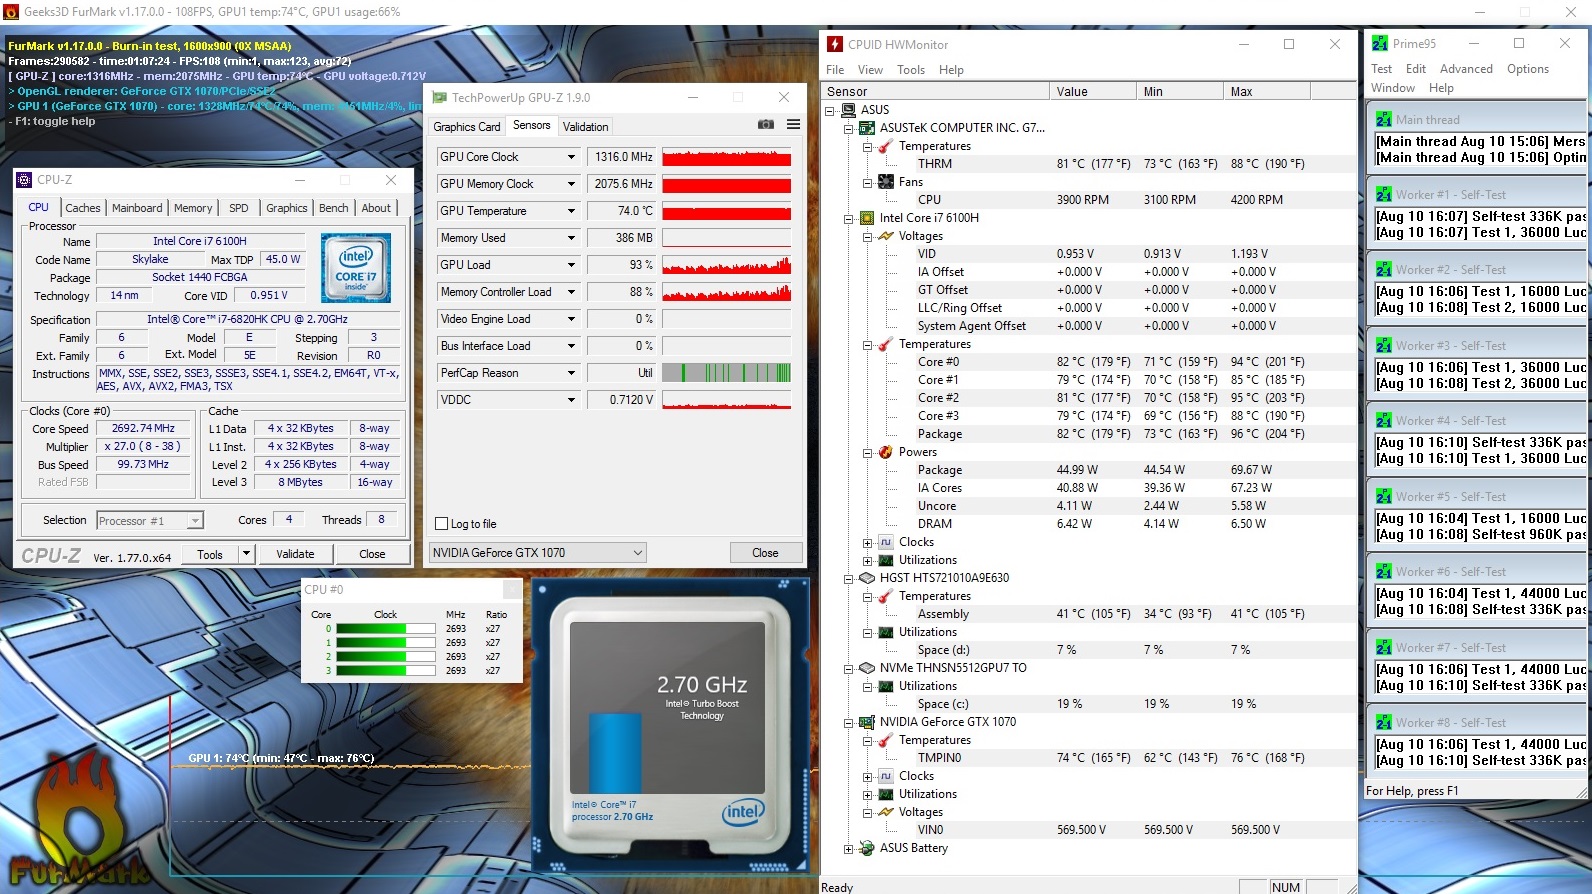
如此强劲的性能当然需要巧妙的散热系统来保证运行。为GeForce GTX 1070搭配的3D蒸汽仓冷却模组可以让它的性能得到充分发挥。你可以听到它的噪音,不过仍然在可以接受的范围内。不过在看到这款设备的重量前你需要有一点心理准备:这台华硕游戏本的重量达到了4.5千克,不过也无可厚非。
注:本文是基于完整评测的缩减版本,阅读完整的英文评测,请点击这里。
Pricecompare
