 Deutsch
 English
 Español
 Français
 Italiano
 Nederlands
 Polski
 Português
 Русский
 Türkçe
 Svenska
 Chinese
 Magyar
华硕 ROG G752VS (7700HQ, GTX 1070, FHD) 笔记本电脑简短评测
| SD Card Reader | |
| average JPG Copy Test (av. of 3 runs) | |
| MSI GT72VR 7RE-433 | |
| Acer Predator 17 G9-793-70PJ | |
| Gigabyte P57X v7 | |
| Asus G752VS-BA338T | |
| Asus G752VS-XB78K | |
| Nexoc G734IV | |
| maximum AS SSD Seq Read Test (1GB) | |
| MSI GT72VR 7RE-433 | |
| Gigabyte P57X v7 | |
| Acer Predator 17 G9-793-70PJ | |
| Nexoc G734IV | |
| Asus G752VS-BA338T | |
| Asus G752VS-XB78K | |
| Networking | |
| iperf3 transmit AX12 | |
| Acer Predator 17 G9-793-70PJ | |
| MSI GT72VR 7RE-433 | |
| Alienware 17 R4 | |
| Nexoc G734IV | |
| Asus G752VS-BA338T | |
| iperf3 receive AX12 | |
| Acer Predator 17 G9-793-70PJ | |
| Asus G752VS-BA338T | |
| Nexoc G734IV | |
| MSI GT72VR 7RE-433 | |
| Alienware 17 R4 | |
| |||||||||||||||||||||||||
Brightness Distribution: 88 %
Center on Battery: 307 cd/m²
Contrast: 959:1 (Black: 0.32 cd/m²)
ΔE Color 5.53 | 0.5-29.43 Ø5
ΔE Greyscale 7 | 0.57-98 Ø5.3
90% sRGB (Argyll 1.6.3 3D)
58% AdobeRGB 1998 (Argyll 1.6.3 3D)
62.8% AdobeRGB 1998 (Argyll 2.2.0 3D)
90.3% sRGB (Argyll 2.2.0 3D)
61.6% Display P3 (Argyll 2.2.0 3D)
Gamma: 2.48
| Asus G752VS-BA338T AU Optronics B173HAN01.1 (AUO119D), IPS, 1920x1080 | Asus G752VS-XB78K LG Philips LP173WF4-SPF3 (LGD04E8), IPS, 1920x1080 | MSI GT72VR 7RE-433 Chi Mei N173HHE-G32 (CMN1747), TN LED, 1920x1080 | Gigabyte P57X v7 SHP145E, IPS, 3840x2160 | Nexoc G734IV LG Philips LP173WF4-SPD1 (LGD046C), IPS, 1920x1080 | Acer Predator 17 G9-793-70PJ AU Optronics B173ZAN01.0 (AUO109B), IPS, 3840x2160 | Alienware 17 R4 TN LED, 2560x1440 | |
|---|---|---|---|---|---|---|---|
| Display | 1% | 3% | 37% | -1% | 36% | -4% | |
| Display P3 Coverage | 61.6 | 66.9 9% | 68.3 11% | 87.8 43% | 66.2 7% | 86.4 40% | 61.2 -1% |
| sRGB Coverage | 90.3 | 85.2 -6% | 86.7 -4% | 100 11% | 83.7 -7% | 99.9 11% | 82.9 -8% |
| AdobeRGB 1998 Coverage | 62.8 | 62.3 -1% | 63.4 1% | 98.9 57% | 61.2 -3% | 99.1 58% | 60.5 -4% |
| Response Times | 5% | 46% | -67% | -13% | -19% | 34% | |
| Response Time Grey 50% / Grey 80% * | 36 ? | 38 ? -6% | 29 ? 19% | 55.6 ? -54% | 42 ? -17% | 50 ? -39% | 30 ? 17% |
| Response Time Black / White * | 26 ? | 22 ? 15% | 7 ? 73% | 46.8 ? -80% | 28 ? -8% | 25.6 ? 2% | 12.8 ? 51% |
| PWM Frequency | 1000 ? | ||||||
| Screen | 14% | -9% | 17% | 12% | 22% | -4% | |
| Brightness middle | 307 | 328 7% | 299 -3% | 441.3 44% | 348 13% | 343 12% | 402.3 31% |
| Brightness | 300 | 317 6% | 277 -8% | 408 36% | 336 12% | 328 9% | 372 24% |
| Brightness Distribution | 88 | 88 0% | 87 -1% | 86 -2% | 91 3% | 84 -5% | 86 -2% |
| Black Level * | 0.32 | 0.3 6% | 0.27 16% | 0.44 -38% | 0.32 -0% | 0.29 9% | 0.62 -94% |
| Contrast | 959 | 1093 14% | 1107 15% | 1003 5% | 1088 13% | 1183 23% | 649 -32% |
| Colorchecker dE 2000 * | 5.53 | 3.74 32% | 9.65 -75% | 5.1 8% | 4.13 25% | 4.01 27% | 5.6 -1% |
| Colorchecker dE 2000 max. * | 11.54 | 8.97 22% | 15.43 -34% | 9.8 15% | 9.21 20% | 6.03 48% | 9.8 15% |
| Greyscale dE 2000 * | 7 | 2.67 62% | 9.68 -38% | 4.3 39% | 3.52 50% | 4.7 33% | 4.7 33% |
| Gamma | 2.48 89% | 2.41 91% | 1.89 116% | 2.08 106% | 2.32 95% | 2.4 92% | 2.14 103% |
| CCT | 8103 80% | 6861 95% | 11652 56% | 7345 88% | 6228 104% | 6451 101% | 7519 86% |
| Color Space (Percent of AdobeRGB 1998) | 58 | 56 -3% | 75 29% | 87 50% | 55 -5% | 88 52% | 53.7 -7% |
| Color Space (Percent of sRGB) | 90 | 85 -6% | 100 11% | 100 11% | 84 -7% | 100 11% | 82.2 -9% |
| Total Average (Program / Settings) | 7% /
10% | 13% /
1% | -4% /
10% | -1% /
6% | 13% /
19% | 9% /
1% |
* ... smaller is better
Screen Flickering / PWM (Pulse-Width Modulation)
| Screen flickering / PWM not detected | 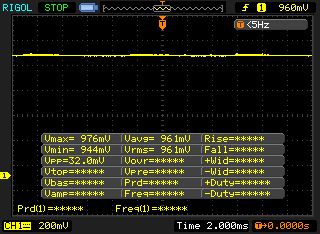 | ||
In comparison: 53 % of all tested devices do not use PWM to dim the display. If PWM was detected, an average of 17915 (minimum: 5 - maximum: 3846000) Hz was measured. | |||
Display Response Times
| ↔ Response Time Black to White | ||
|---|---|---|
| 26 ms ... rise ↗ and fall ↘ combined | ↗ 14.4 ms rise | 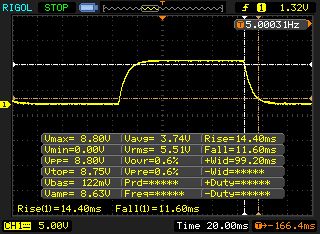 |
| ↘ 11.6 ms fall | ||
| The screen shows relatively slow response rates in our tests and may be too slow for gamers. In comparison, all tested devices range from 0.1 (minimum) to 240 (maximum) ms. » 57 % of all devices are better. This means that the measured response time is worse than the average of all tested devices (21.5 ms). | ||
| ↔ Response Time 50% Grey to 80% Grey | ||
| 36 ms ... rise ↗ and fall ↘ combined | ↗ 18 ms rise | 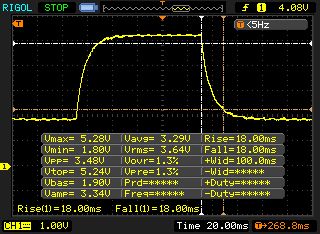 |
| ↘ 18 ms fall | ||
| The screen shows slow response rates in our tests and will be unsatisfactory for gamers. In comparison, all tested devices range from 0.2 (minimum) to 636 (maximum) ms. » 44 % of all devices are better. This means that the measured response time is similar to the average of all tested devices (33.7 ms). | ||
| Cinebench R10 | |
| Rendering Multiple CPUs 32Bit | |
| Alienware 17 R4 | |
| Asus G752VS-XB78K | |
| Asus G752VS-BA338T | |
| MSI GT72VR 7RE-433 | |
| Nexoc G734IV | |
| Rendering Single 32Bit | |
| Alienware 17 R4 | |
| Asus G752VS-XB78K | |
| Asus G752VS-BA338T | |
| MSI GT72VR 7RE-433 | |
| Nexoc G734IV | |
| Geekbench 3 | |
| 32 Bit Multi-Core Score | |
| Nexoc G734IV | |
| Asus G752VS-BA338T | |
| MSI GT72VR 7RE-433 | |
| 32 Bit Single-Core Score | |
| Asus G752VS-BA338T | |
| Nexoc G734IV | |
| MSI GT72VR 7RE-433 | |
| Geekbench 4.0 | |
| 64 Bit Multi-Core Score | |
| Nexoc G734IV | |
| Asus G752VS-BA338T | |
| MSI GT72VR 7RE-433 | |
| 64 Bit Single-Core Score | |
| Asus G752VS-BA338T | |
| Nexoc G734IV | |
| MSI GT72VR 7RE-433 | |
| Geekbench 4.4 | |
| 64 Bit Multi-Core Score | |
| Asus G752VS-BA338T | |
| 64 Bit Single-Core Score | |
| Asus G752VS-BA338T | |
| JetStream 1.1 - Total Score | |
| Asus G752VS-BA338T | |
| Nexoc G734IV | |
| MSI GT72VR 7RE-433 | |
| Asus G752VS-XB78K | |
| Alienware 17 R4 | |
| PCMark 7 Score | 6805 points | |
| PCMark 8 Home Score Accelerated v2 | 5103 points | |
| PCMark 8 Creative Score Accelerated v2 | 8191 points | |
| PCMark 8 Work Score Accelerated v2 | 5410 points | |
Help | ||

| Asus G752VS-BA338T Samsung SM961 MZVKW512HMJP m.2 PCI-e | MSI GT72VR 7RE-433 Kingston RBU-SNS8152S3256GG5 | Gigabyte P57X v7 Transcend MTS800 256GB M.2 (TS256GMTS800) | Nexoc G734IV Samsung SM961 MZVKW512HMJP m.2 PCI-e | Alienware 17 R4 SK Hynix PC300 NVMe 512 GB | Asus G752VS-XB78K Toshiba NVMe THNSN5512GPU7 | |
|---|---|---|---|---|---|---|
| CrystalDiskMark 3.0 | -49% | -58% | -6% | -11% | 19% | |
| Read Seq | 2791 | 521 -81% | 517 -81% | 2268 -19% | 1277 -54% | 1718 -38% |
| Write Seq | 1596 | 311.8 -80% | 305.7 -81% | 1559 -2% | 786 -51% | 1305 -18% |
| Read 512 | 400.8 | 403.1 1% | 315 -21% | 413.8 3% | 894 123% | 1250 212% |
| Write 512 | 1606 | 332.3 -79% | 306.1 -81% | 1167 -27% | 659 -59% | 1438 -10% |
| Read 4k | 55.1 | 33.35 -39% | 26.04 -53% | 54 -2% | 38.11 -31% | 44.42 -19% |
| Write 4k | 163.8 | 111.1 -32% | 82.3 -50% | 154.9 -5% | 128.5 -22% | 154.4 -6% |
| Read 4k QD32 | 607 | 331.1 -45% | 281.3 -54% | 634 4% | 628 3% | 744 23% |
| Write 4k QD32 | 527 | 318.3 -40% | 296 -44% | 509 -3% | 531 1% | 578 10% |
| 3DMark 06 Standard Score | 30279 points | |
| 3DMark 11 Performance | 17222 points | |
| 3DMark Ice Storm Standard Score | 122763 points | |
| 3DMark Cloud Gate Standard Score | 26609 points | |
| 3DMark Fire Strike Score | 14277 points | |
| 3DMark Fire Strike Extreme Score | 7961 points | |
| 3DMark Time Spy Score | 5392 points | |
Help | ||
| 3DMark - 1920x1080 Fire Strike Graphics | |
| Alienware 17 R4 | |
| Asus G752VS-BA338T | |
| MSI GT72VR 7RE-433 | |
| Nexoc G734IV | |
| Gigabyte P57X v7 | |
| Acer Predator 17 G9-793-70PJ | |
| Asus G752VS-XB78K | |
| 3DMark 11 - 1280x720 Performance GPU | |
| Alienware 17 R4 | |
| Asus G752VS-BA338T | |
| Gigabyte P57X v7 | |
| MSI GT72VR 7RE-433 | |
| Acer Predator 17 G9-793-70PJ | |
| Asus G752VS-XB78K | |
| Nexoc G734IV | |
| BioShock Infinite - 1920x1080 Ultra Preset, DX11 (DDOF) | |
| Alienware 17 R4 | |
| Asus G752VS-BA338T | |
| Asus G752VS-XB78K | |
| MSI GT72VR 7RE-433 | |
| Gigabyte P57X v7 | |
| Nexoc G734IV | |
| The Witcher 3 - 1920x1080 Ultra Graphics & Postprocessing (HBAO+) | |
| Alienware 17 R4 | |
| Asus G752VS-BA338T | |
| Acer Predator 17 G9-793-70PJ | |
| Asus G752VS-XB78K | |
| Far Cry Primal - 1920x1080 Ultra Preset AA:SM | |
| Asus G752VS-XB78K | |
| Asus G752VS-BA338T | |
| Rise of the Tomb Raider - 1920x1080 Very High Preset AA:FX AF:16x | |
| Alienware 17 R4 | |
| Asus G752VS-BA338T | |
| Asus G752VS-XB78K | |
| Nexoc G734IV | |
| For Honor - 1920x1080 Extreme Preset AA:T AF:16x | |
| Asus G752VS-BA338T | |
| Acer Predator 17 G9-793-70PJ | |
| low | med. | high | ultra | |
| Tomb Raider (2013) | 431.5 | 407.8 | 339 | 192 |
| BioShock Infinite (2013) | 260.3 | 220.8 | 207.5 | 139.4 |
| The Witcher 3 (2015) | 228.1 | 184.4 | 117 | 59.6 |
| Rise of the Tomb Raider (2016) | 219.7 | 180.1 | 117.7 | 99 |
| Far Cry Primal (2016) | 118 | 103 | 93 | 86 |
| For Honor (2017) | 242.6 | 160 | 154 | 113.4 |
| Ghost Recon Wildlands (2017) | 127 | 96.3 | 91 | 54.4 |
| Prey (2017) | 142 | 140.2 | 135.2 | 132.5 |
Noise Level
| Idle |
| 30 / 32 / 36 dB(A) |
| HDD |
| 34 dB(A) |
| DVD |
| 40 / dB(A) |
| Load |
| 43 / 49 dB(A) |
 | ||
30 dB silent 40 dB(A) audible 50 dB(A) loud |
||
min: | ||
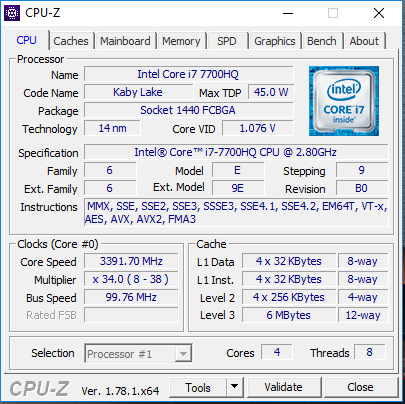
| Asus G752VS-BA338T i7-7700HQ, GeForce GTX 1070 Mobile | MSI GT72VR 7RE-433 i7-7700HQ, GeForce GTX 1070 Mobile | Gigabyte P57X v7 i7-7700HQ, GeForce GTX 1070 Mobile | Nexoc G734IV i7-7700HQ, GeForce GTX 1070 Mobile | Acer Predator 17 G9-793-70PJ i7-7700HQ, GeForce GTX 1070 Mobile | Alienware 17 R4 i7-7820HK, GeForce GTX 1080 Mobile | Asus G752VS-XB78K 6820HK, GeForce GTX 1070 Mobile | |
|---|---|---|---|---|---|---|---|
| Noise | -1% | 0% | -13% | -4% | -8% | 3% | |
| off / environment * | 30 | 31 -3% | 29 3% | 30 -0% | 31 -3% | 28.2 6% | 30 -0% |
| Idle Minimum * | 30 | 34 -13% | 30.4 -1% | 34 -13% | 32 -7% | 35.6 -19% | 31 -3% |
| Idle Average * | 32 | 35 -9% | 32.1 -0% | 35 -9% | 35 -9% | 35.6 -11% | 32 -0% |
| Idle Maximum * | 36 | 37 -3% | 32.1 11% | 46 -28% | 38 -6% | 35.7 1% | 33 8% |
| Load Average * | 43 | 37 14% | 45.6 -6% | 49 -14% | 42 2% | 50.2 -17% | 40 7% |
| Witcher 3 ultra * | 43 | 44 -2% | 50.2 -17% | ||||
| Load Maximum * | 49 | 44 10% | 51.5 -5% | 56 -14% | 50 -2% | 50.2 -2% | 47 4% |
* ... smaller is better
(±) The maximum temperature on the upper side is 41 °C / 106 F, compared to the average of 40.4 °C / 105 F, ranging from 21.2 to 68.8 °C for the class Gaming.
(+) The bottom heats up to a maximum of 39.3 °C / 103 F, compared to the average of 43.2 °C / 110 F
(+) In idle usage, the average temperature for the upper side is 26.8 °C / 80 F, compared to the device average of 33.8 °C / 93 F.
(+) Playing The Witcher 3, the average temperature for the upper side is 31.3 °C / 88 F, compared to the device average of 33.8 °C / 93 F.
(+) The palmrests and touchpad are cooler than skin temperature with a maximum of 27.6 °C / 81.7 F and are therefore cool to the touch.
(±) The average temperature of the palmrest area of similar devices was 28.9 °C / 84 F (+1.3 °C / 2.3 F).
| Asus G752VS-BA338T i7-7700HQ, GeForce GTX 1070 Mobile | MSI GT72VR 7RE-433 i7-7700HQ, GeForce GTX 1070 Mobile | Gigabyte P57X v7 i7-7700HQ, GeForce GTX 1070 Mobile | Nexoc G734IV i7-7700HQ, GeForce GTX 1070 Mobile | Acer Predator 17 G9-793-70PJ i7-7700HQ, GeForce GTX 1070 Mobile | Alienware 17 R4 i7-7820HK, GeForce GTX 1080 Mobile | Asus G752VS-XB78K 6820HK, GeForce GTX 1070 Mobile | |
|---|---|---|---|---|---|---|---|
| Heat | -4% | -20% | -15% | 1% | -18% | -7% | |
| Maximum Upper Side * | 41 | 41.5 -1% | 51.2 -25% | 48.1 -17% | 39.1 5% | 49.6 -21% | 42.9 -5% |
| Maximum Bottom * | 39.3 | 50.6 -29% | 56.8 -45% | 59.3 -51% | 42.1 -7% | 56 -42% | 41.5 -6% |
| Idle Upper Side * | 28.8 | 26.4 8% | 29.2 -1% | 28.2 2% | 27.9 3% | 29.6 -3% | 31.6 -10% |
| Idle Bottom * | 27.3 | 25.4 7% | 29.2 -7% | 26 5% | 26.1 4% | 29.2 -7% | 29.5 -8% |
* ... smaller is better
Asus G752VS-BA338T audio analysis
(±) | speaker loudness is average but good (80 dB)
Bass 100 - 315 Hz
(±) | reduced bass - on average 9.4% lower than median
(±) | linearity of bass is average (11.1% delta to prev. frequency)
Mids 400 - 2000 Hz
(+) | balanced mids - only 4.2% away from median
(+) | mids are linear (6% delta to prev. frequency)
Highs 2 - 16 kHz
(±) | reduced highs - on average 7.7% lower than median
(±) | linearity of highs is average (10% delta to prev. frequency)
Overall 100 - 16.000 Hz
(±) | linearity of overall sound is average (21.2% difference to median)
Compared to same class
» 74% of all tested devices in this class were better, 4% similar, 22% worse
» The best had a delta of 6%, average was 18%, worst was 132%
Compared to all devices tested
» 54% of all tested devices were better, 7% similar, 39% worse
» The best had a delta of 4%, average was 25%, worst was 134%
Acer Predator 17 G9-793-70PJ audio analysis
(+) | speakers can play relatively loud (87 dB)
Bass 100 - 315 Hz
(±) | reduced bass - on average 5.5% lower than median
(±) | linearity of bass is average (8% delta to prev. frequency)
Mids 400 - 2000 Hz
(+) | balanced mids - only 2.9% away from median
(+) | mids are linear (3.5% delta to prev. frequency)
Highs 2 - 16 kHz
(±) | reduced highs - on average 5.2% lower than median
(+) | highs are linear (6.2% delta to prev. frequency)
Overall 100 - 16.000 Hz
(+) | overall sound is linear (10.3% difference to median)
Compared to same class
» 5% of all tested devices in this class were better, 2% similar, 93% worse
» The best had a delta of 6%, average was 18%, worst was 132%
Compared to all devices tested
» 3% of all tested devices were better, 1% similar, 96% worse
» The best had a delta of 4%, average was 25%, worst was 134%
| Off / Standby | |
| Idle | |
| Load |
|
| Asus G752VS-BA338T i7-7700HQ, GeForce GTX 1070 Mobile | MSI GT72VR 7RE-433 i7-7700HQ, GeForce GTX 1070 Mobile | Gigabyte P57X v7 i7-7700HQ, GeForce GTX 1070 Mobile | Nexoc G734IV i7-7700HQ, GeForce GTX 1070 Mobile | Acer Predator 17 G9-793-70PJ i7-7700HQ, GeForce GTX 1070 Mobile | Alienware 17 R4 i7-7820HK, GeForce GTX 1080 Mobile | Asus G752VS-XB78K 6820HK, GeForce GTX 1070 Mobile | |
|---|---|---|---|---|---|---|---|
| Power Consumption | 4% | -13% | 20% | -14% | -37% | -10% | |
| Idle Minimum * | 21 | 20 5% | 15.7 25% | 12 43% | 23 -10% | 37.5 -79% | 24 -14% |
| Idle Average * | 27 | 27 -0% | 23.4 13% | 17 37% | 33 -22% | 37.6 -39% | 31 -15% |
| Idle Maximum * | 32 | 31 3% | 23.5 27% | 22 31% | 40 -25% | 37.6 -18% | 36 -13% |
| Load Average * | 86 | 86 -0% | 184.6 -115% | 86 -0% | 94 -9% | 122.4 -42% | 94 -9% |
| Witcher 3 ultra * | 165 | 177 -7% | 180.3 -9% | ||||
| Load Maximum * | 206 | 184 11% | 233.1 -13% | 224 -9% | 228 -11% | 277.4 -35% | 204 1% |
* ... smaller is better
| Asus G752VS-BA338T i7-7700HQ, GeForce GTX 1070 Mobile, 90 Wh | MSI GT72VR 7RE-433 i7-7700HQ, GeForce GTX 1070 Mobile, 83 Wh | Gigabyte P57X v7 i7-7700HQ, GeForce GTX 1070 Mobile, 75.81 Wh | Nexoc G734IV i7-7700HQ, GeForce GTX 1070 Mobile, 60 Wh | Acer Predator 17 G9-793-70PJ i7-7700HQ, GeForce GTX 1070 Mobile, 88 Wh | Alienware 17 R4 i7-7820HK, GeForce GTX 1080 Mobile, 99 Wh | Asus G752VS-XB78K 6820HK, GeForce GTX 1070 Mobile, 90 Wh | |
|---|---|---|---|---|---|---|---|
| Battery Runtime | -17% | -29% | -19% | -19% | -35% | -25% | |
| Reader / Idle | 445 | 316 -29% | 256 -42% | 463 4% | 323 -27% | 276 -38% | 311 -30% |
| H.264 | 257 | 228 -11% | 195 -24% | 186 -28% | |||
| WiFi v1.3 | 293 | 230 -22% | 155 -47% | 205 -30% | 218 -26% | 181 -38% | 210 -28% |
| Load | 96 | 91 -5% | 98 2% | 71 -26% | 91 -5% | 69 -28% | 84 -12% |
Pros
Cons
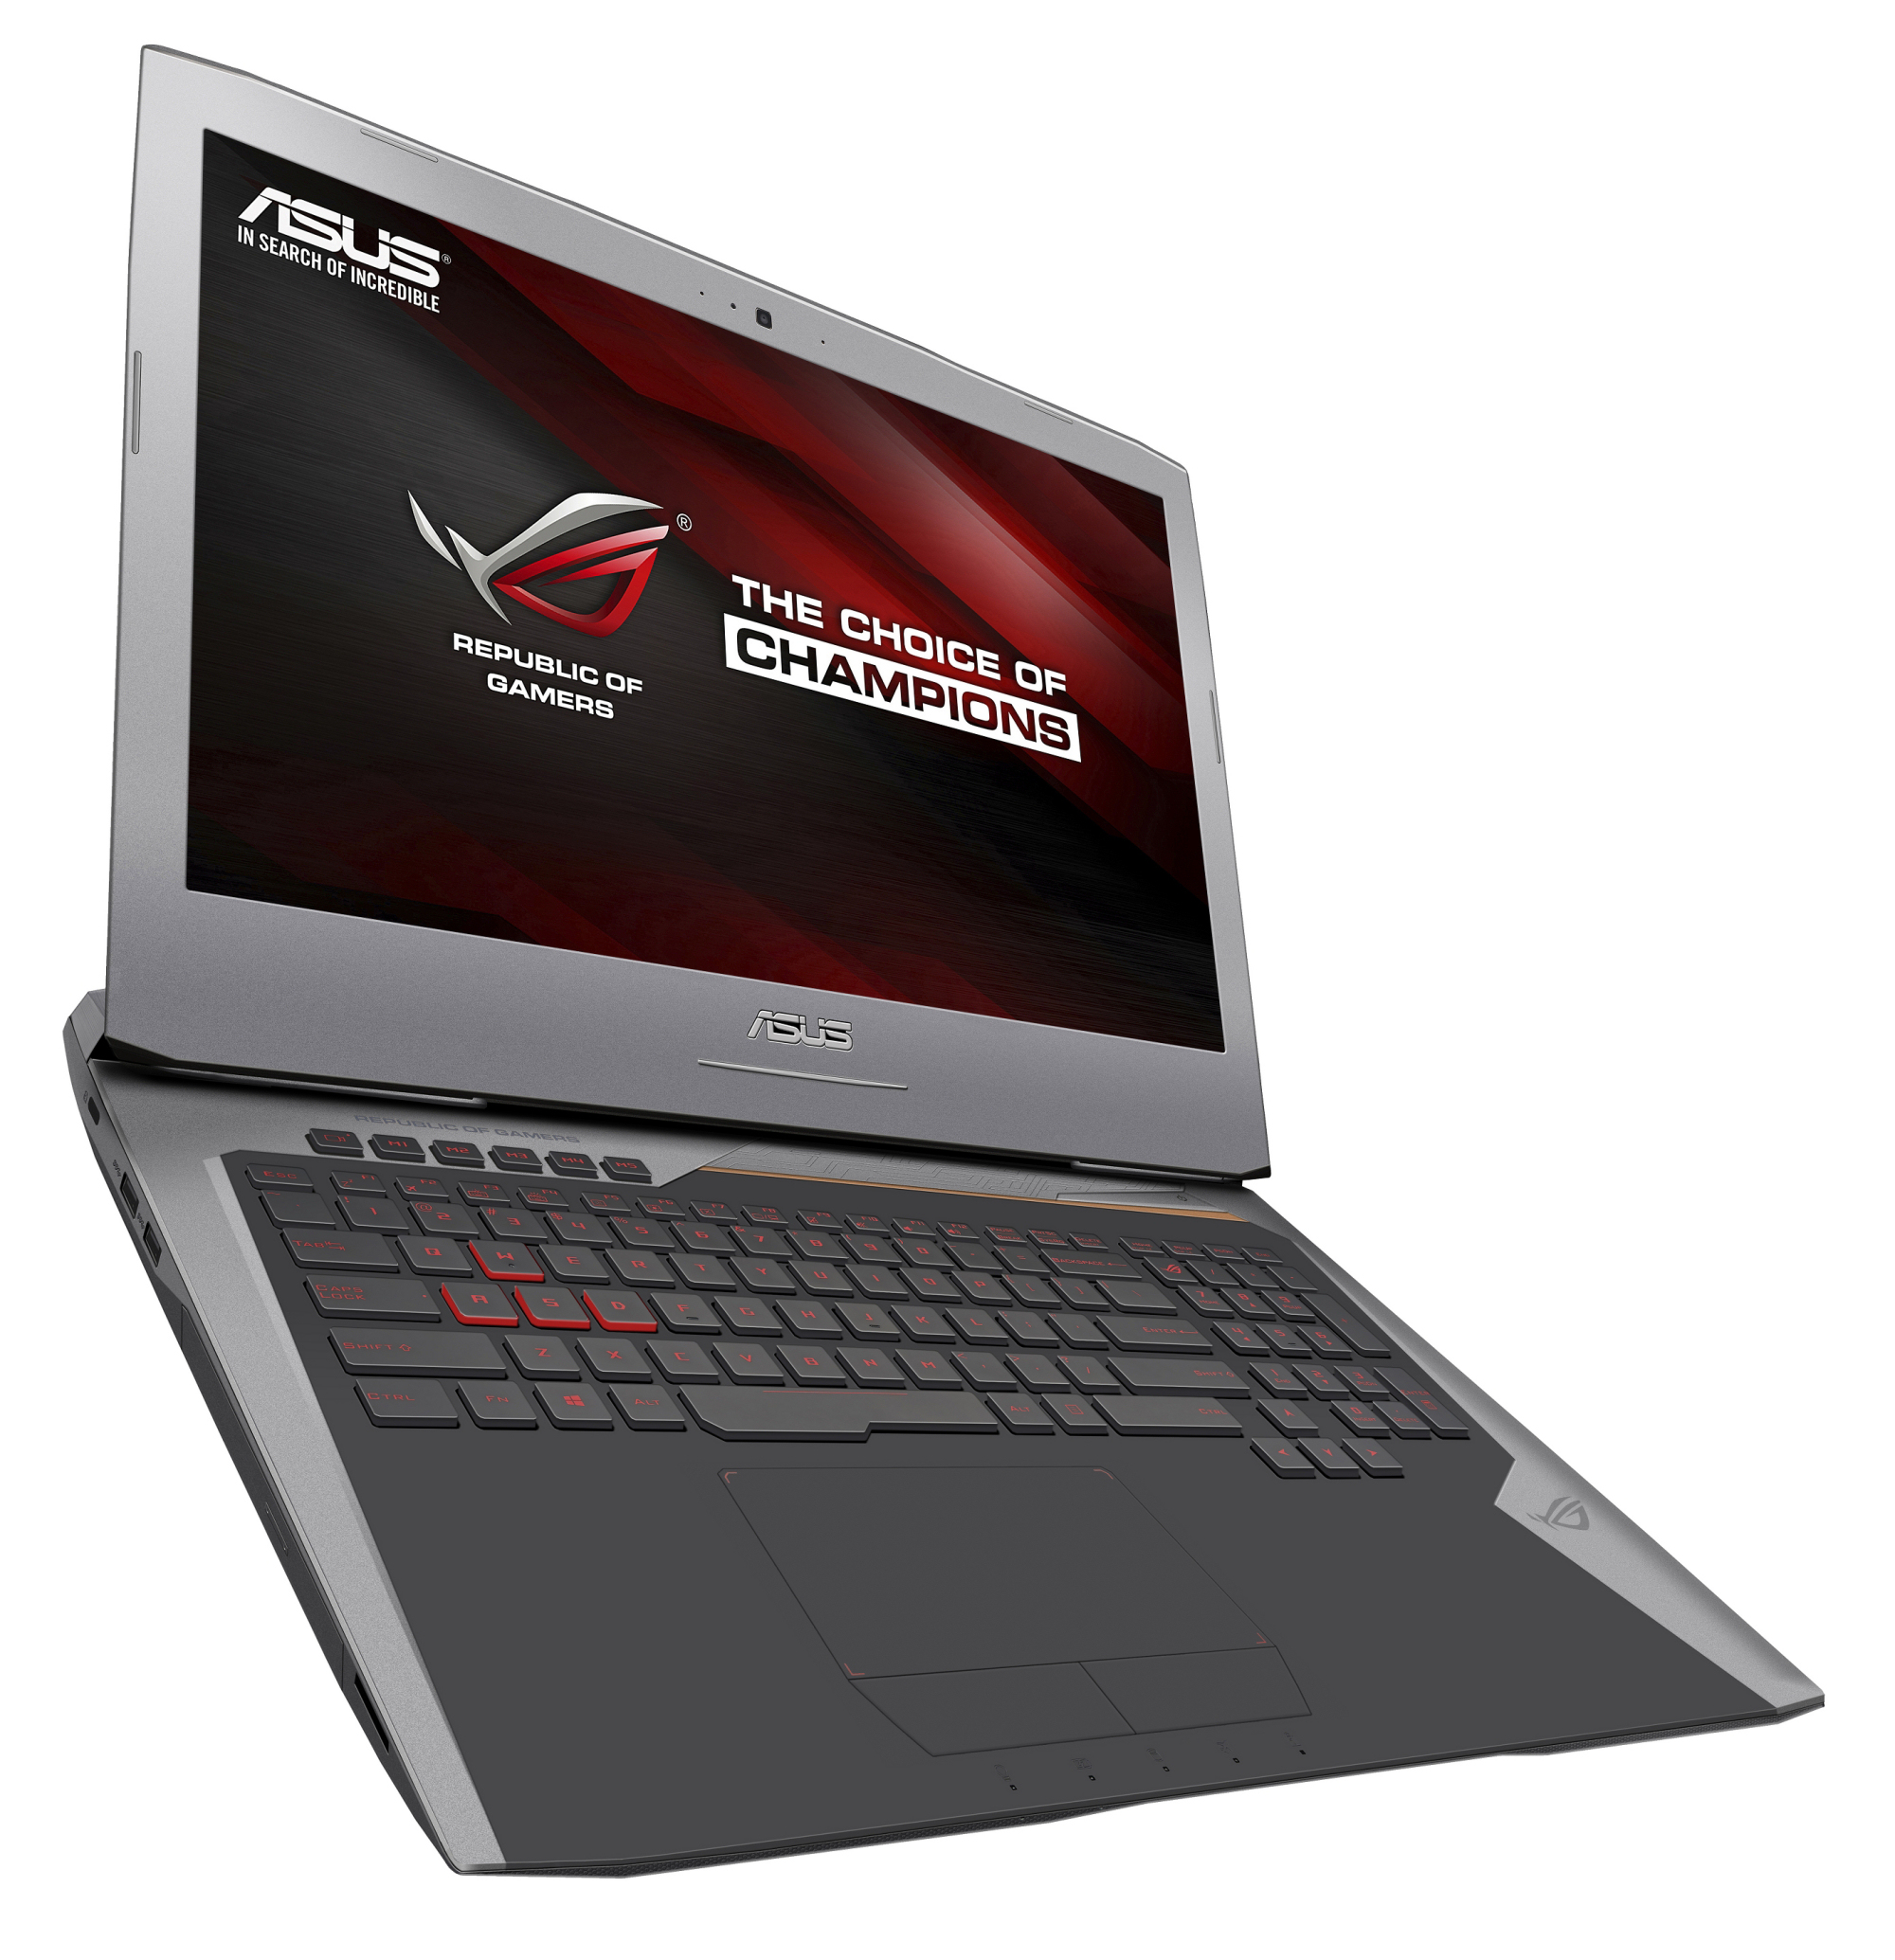
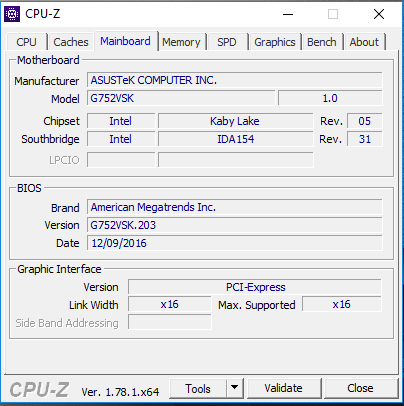
G752VS-BA338T是华硕17寸游戏笔记本电脑系列中的Kaby Lake机型。新的 Core i7-7700HQ 处理器并没有比Skylake 处理器快多少。
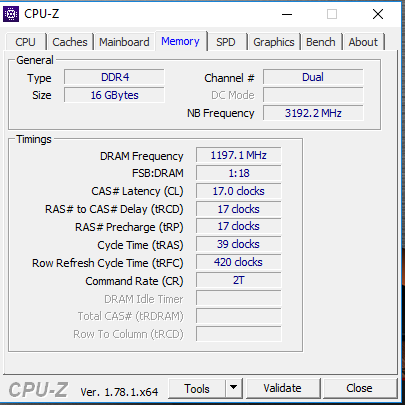
Kaby Lake处理器使得机器续航变得更长,因为它的效率更高。
处理器和显卡的组合可以处理在全高清分辨率下呈现的所有游戏,同时可以达到最高细节表现。Nvidia的G-Sync技术可确保120赫兹的显示屏运作,而且显卡仍具有足够的能力空间以获得更高的分辨率。但,这就需要外接显示器了。
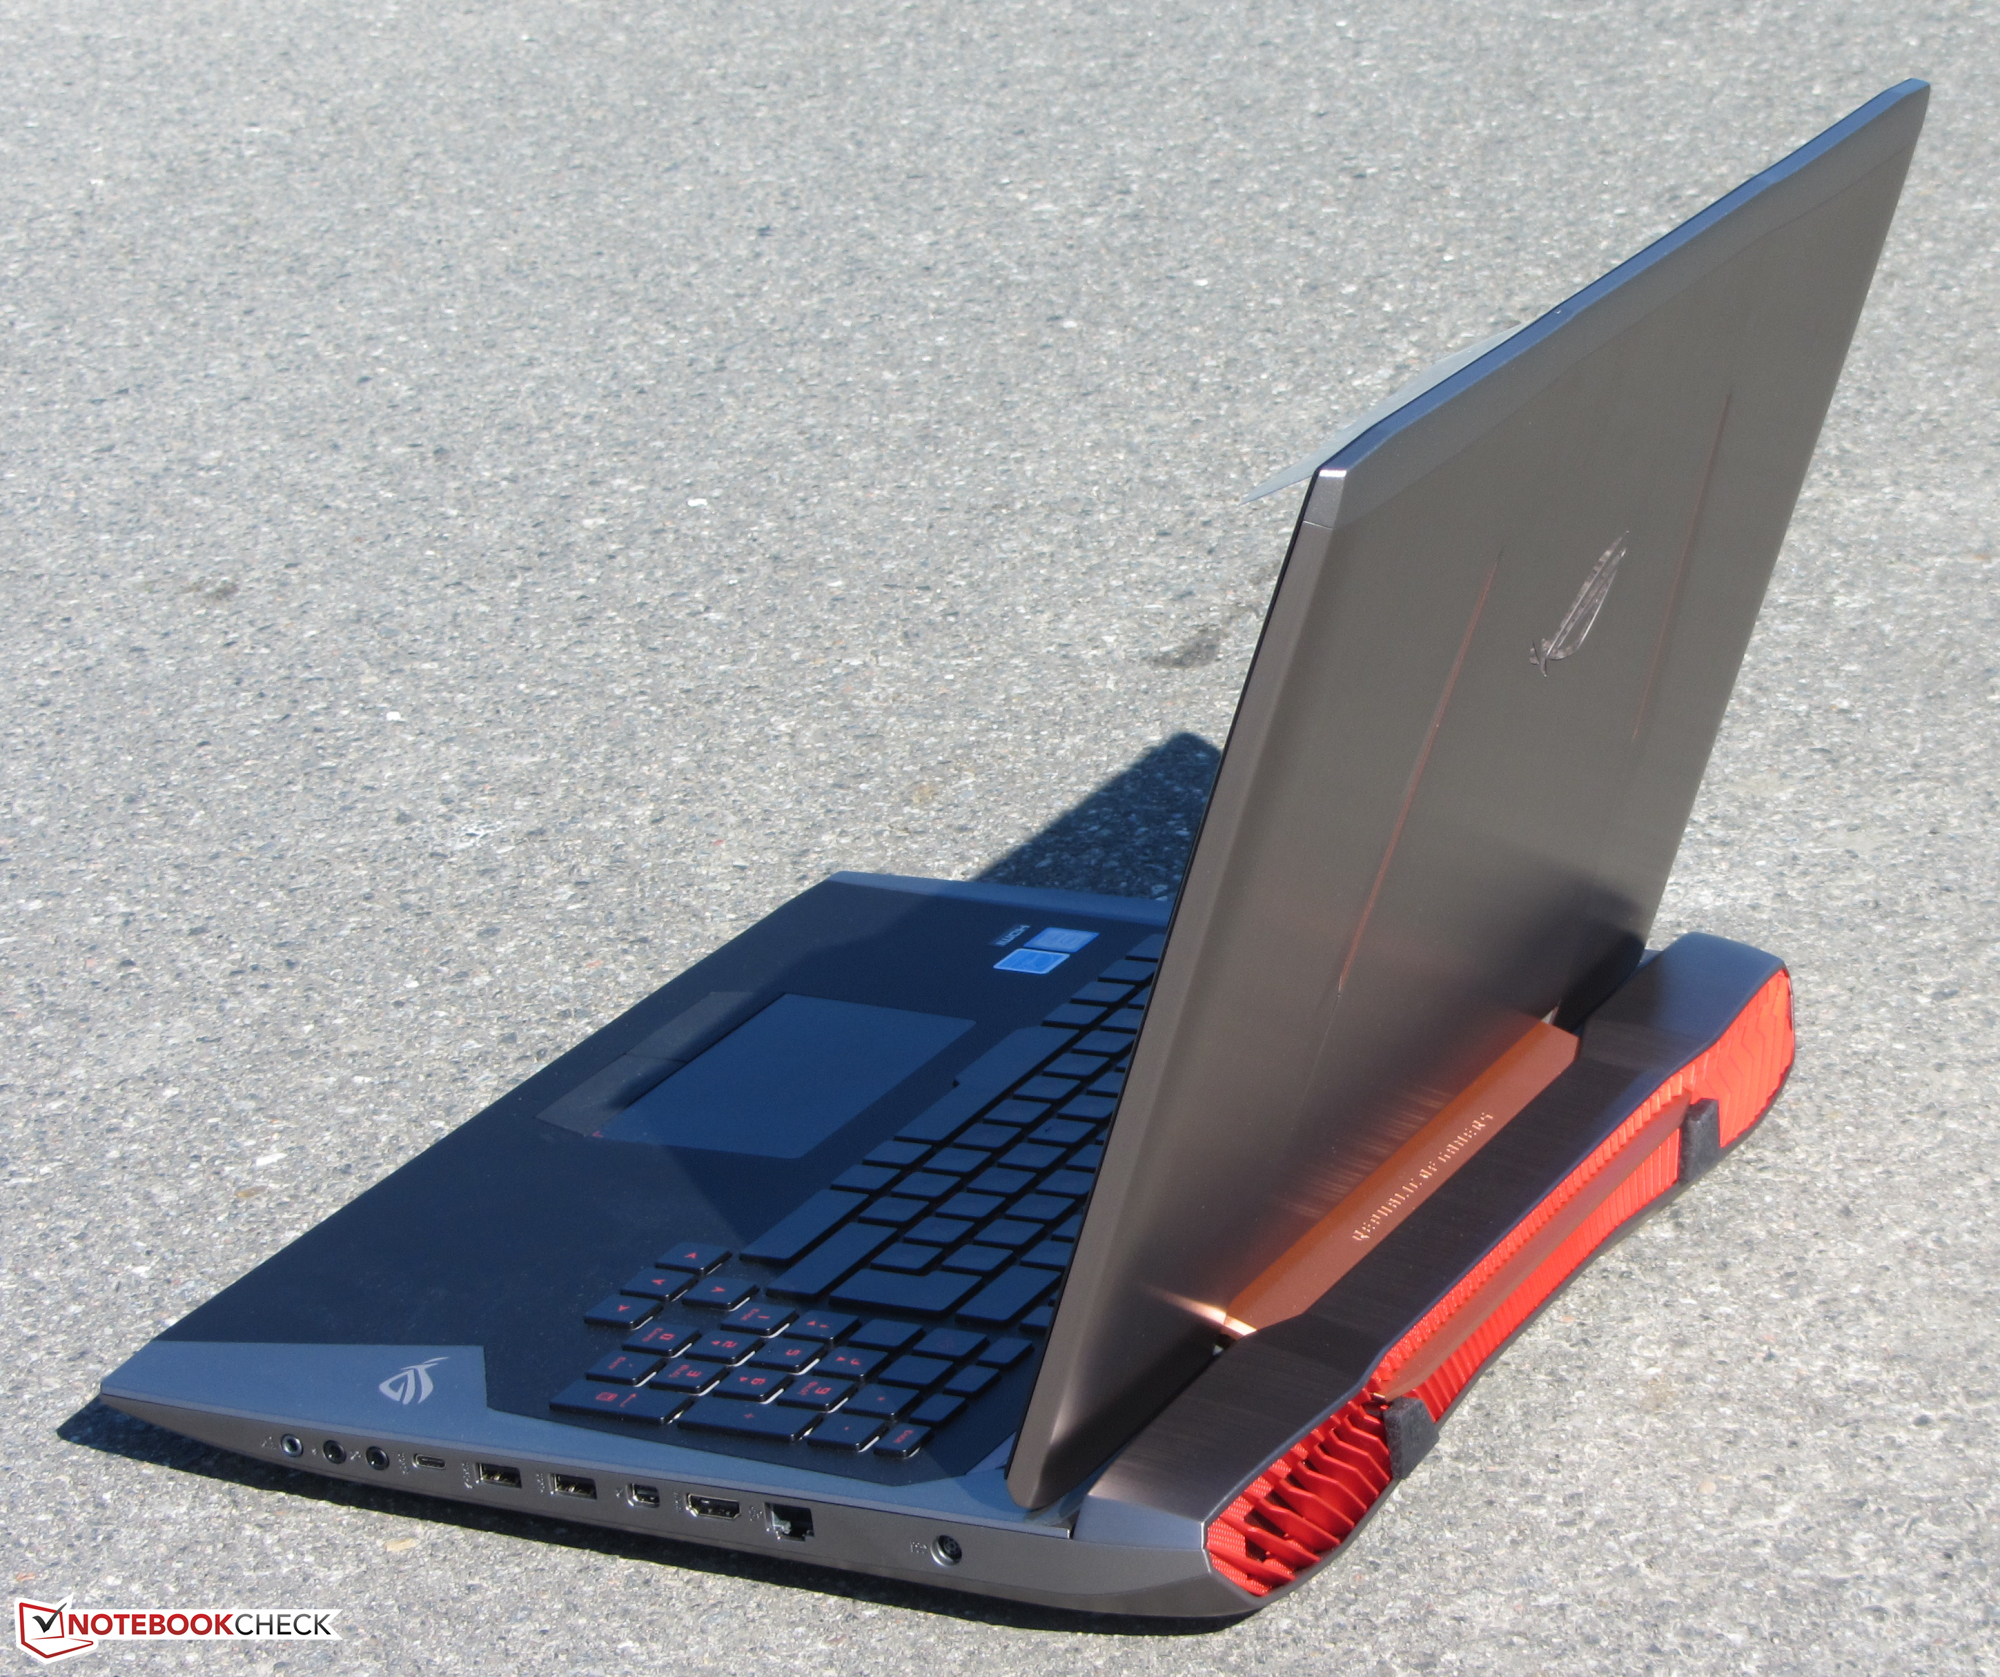
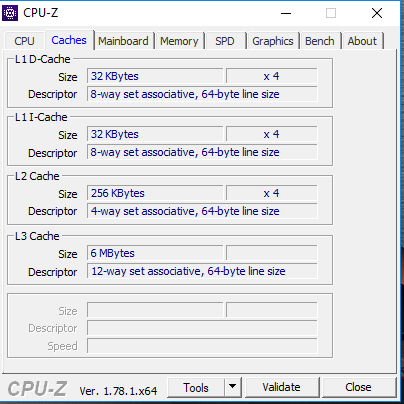
尽管功能硬件功能强大,噪音排放方面也不算太差。发热情况也如此。华硕为该机配备了一个快速的NVMe固态硬盘,甚至还有可以连接第二个NVMe固态硬盘的空闲的插槽。还包括传统的2.5英寸机械硬盘。由于维护舱口的存在,更换硬盘不难。
注:本文是基于完整评测的缩减版本,阅读完整的英文评测,请点击这里。
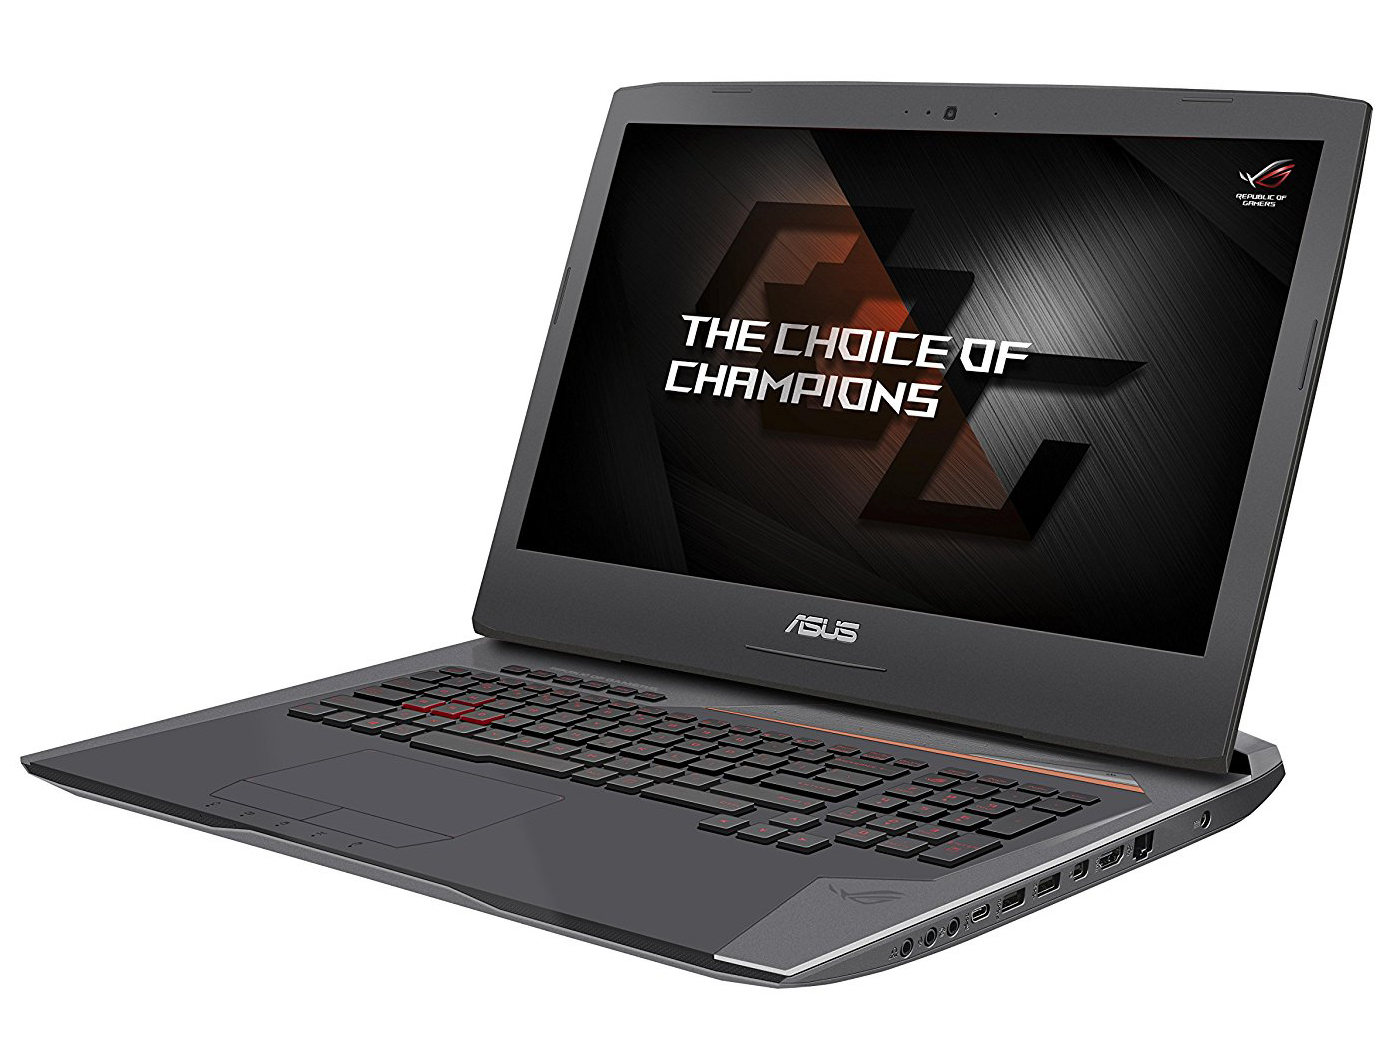
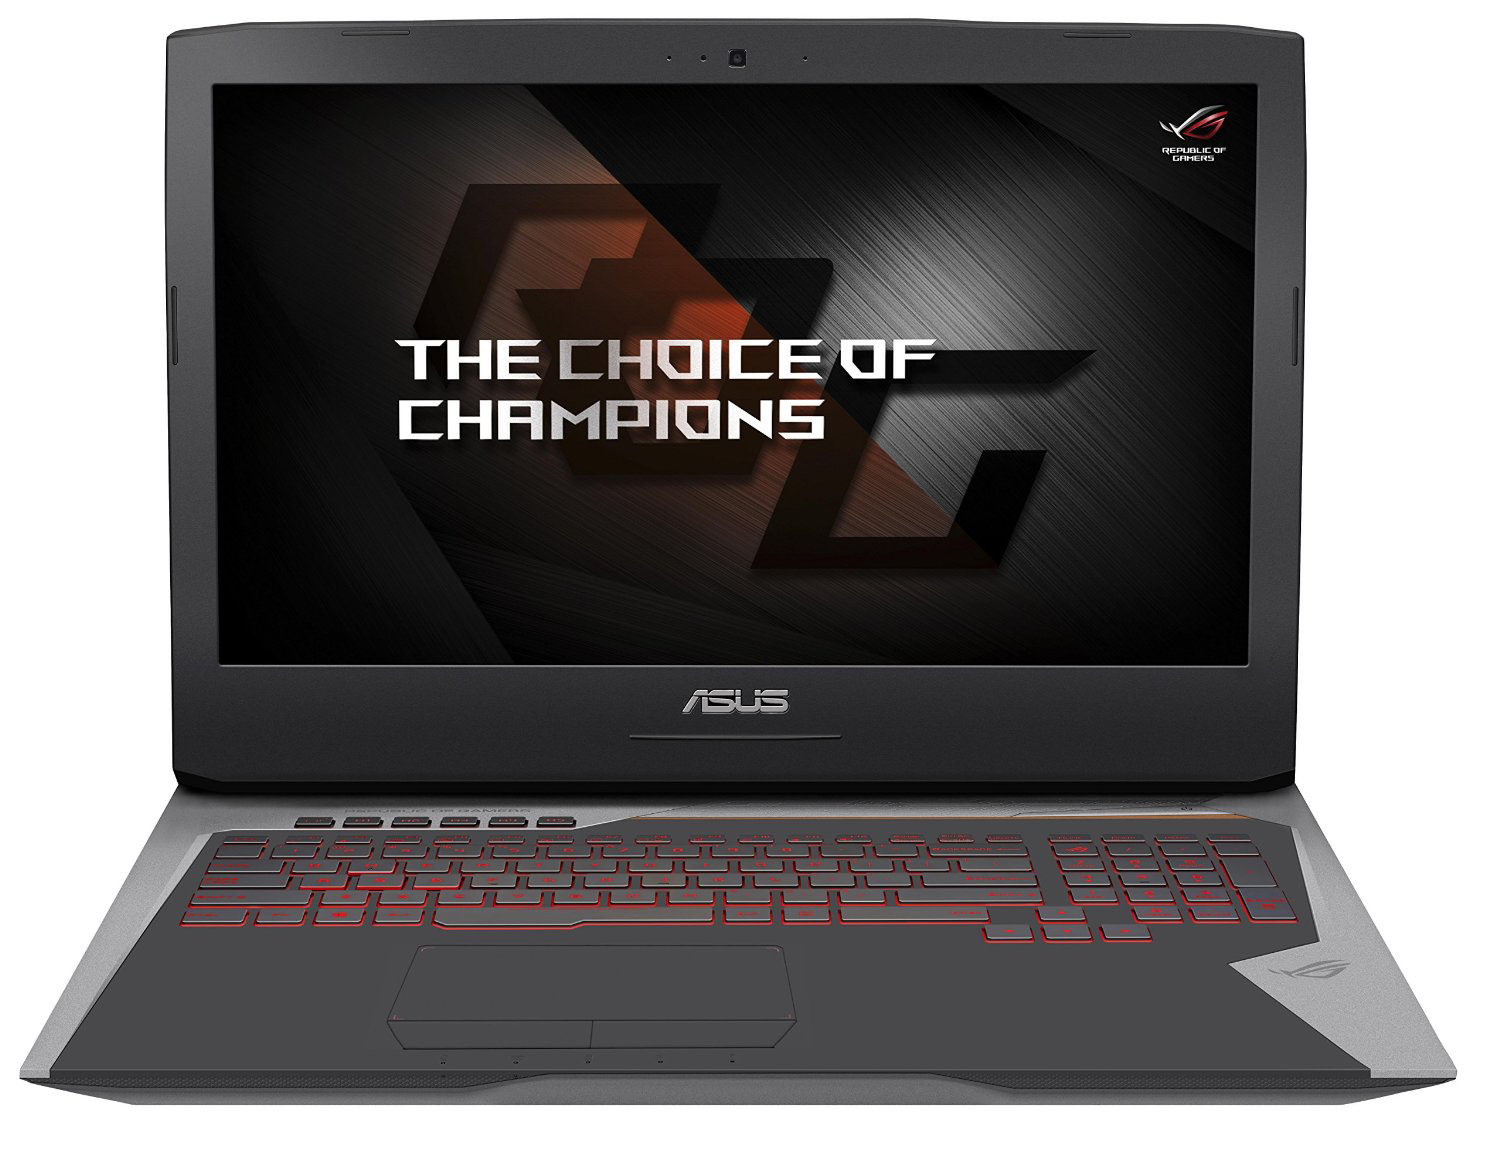
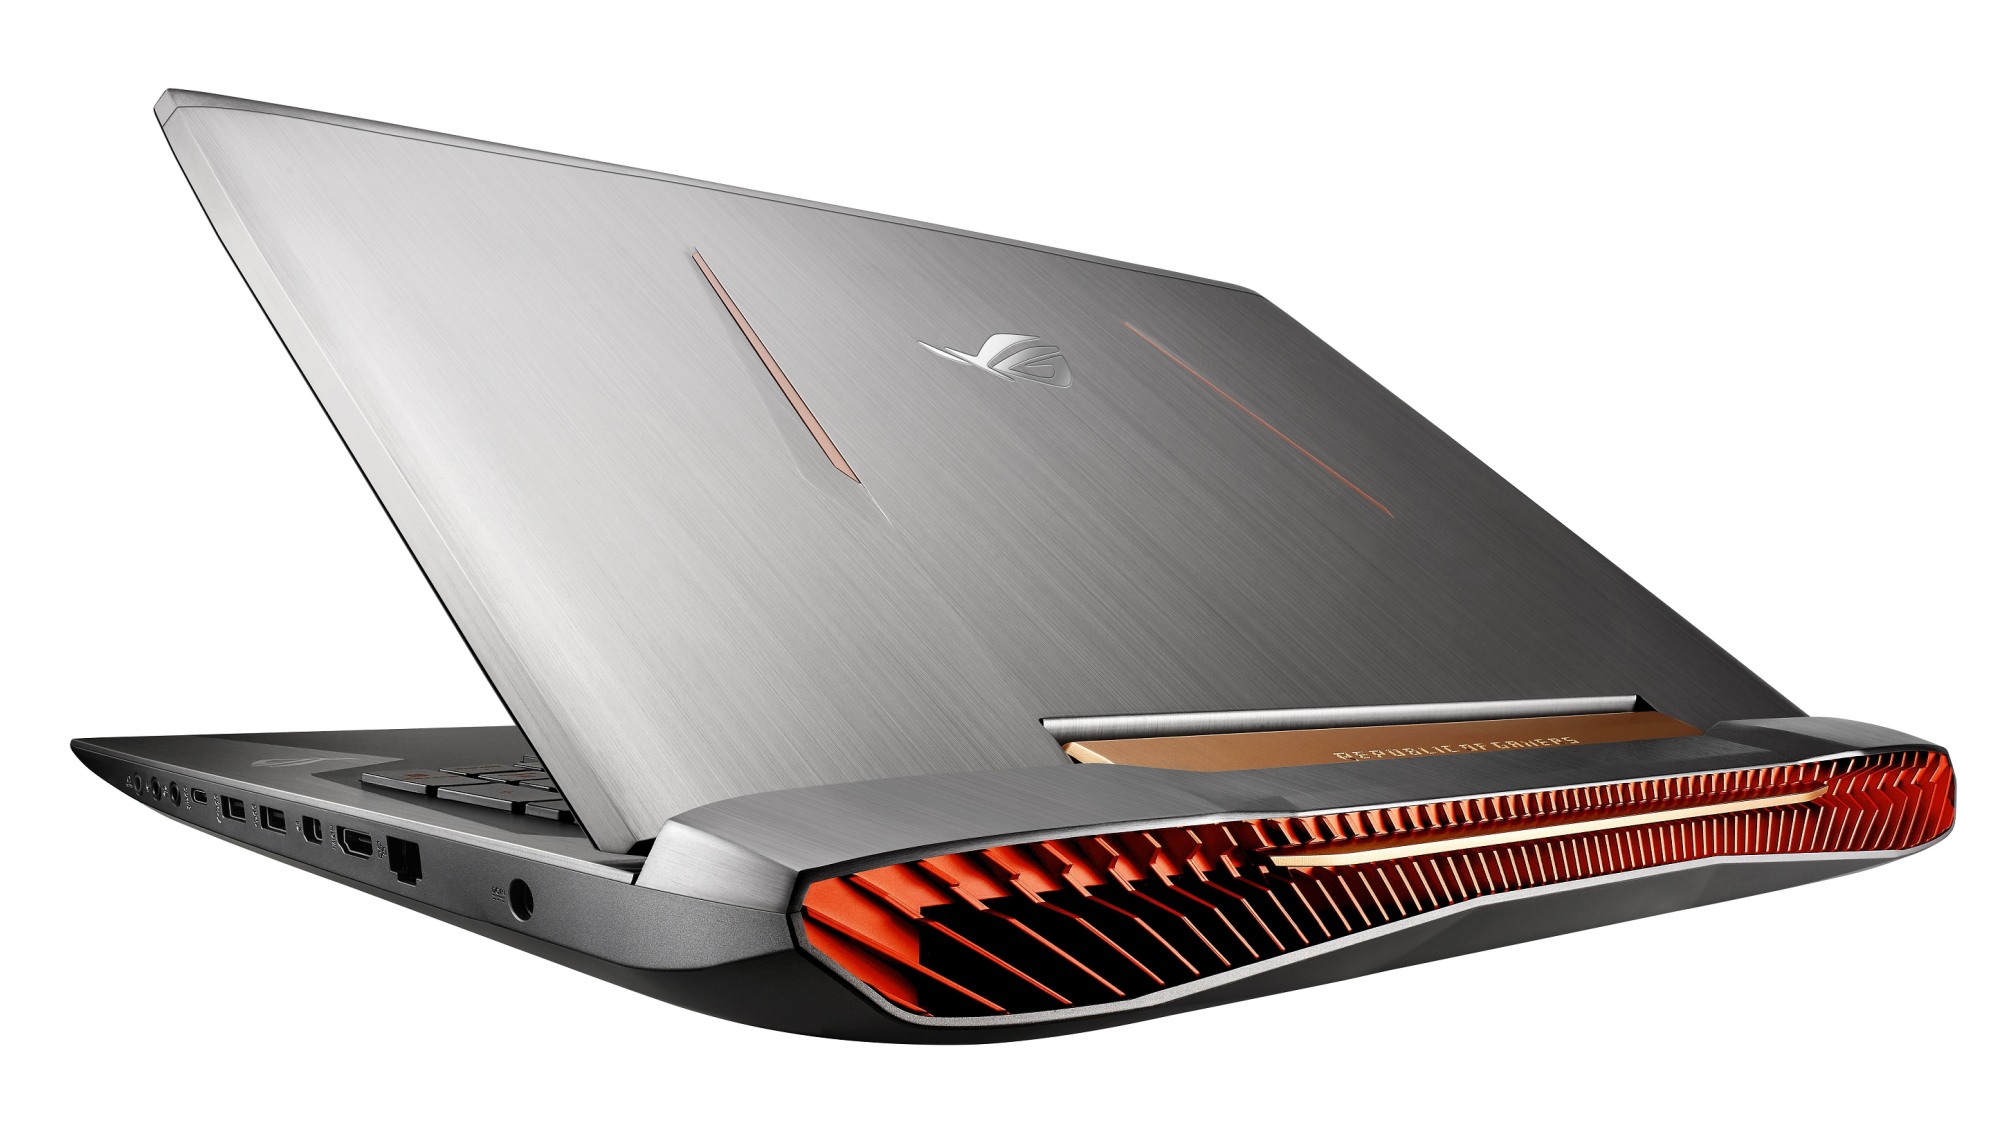
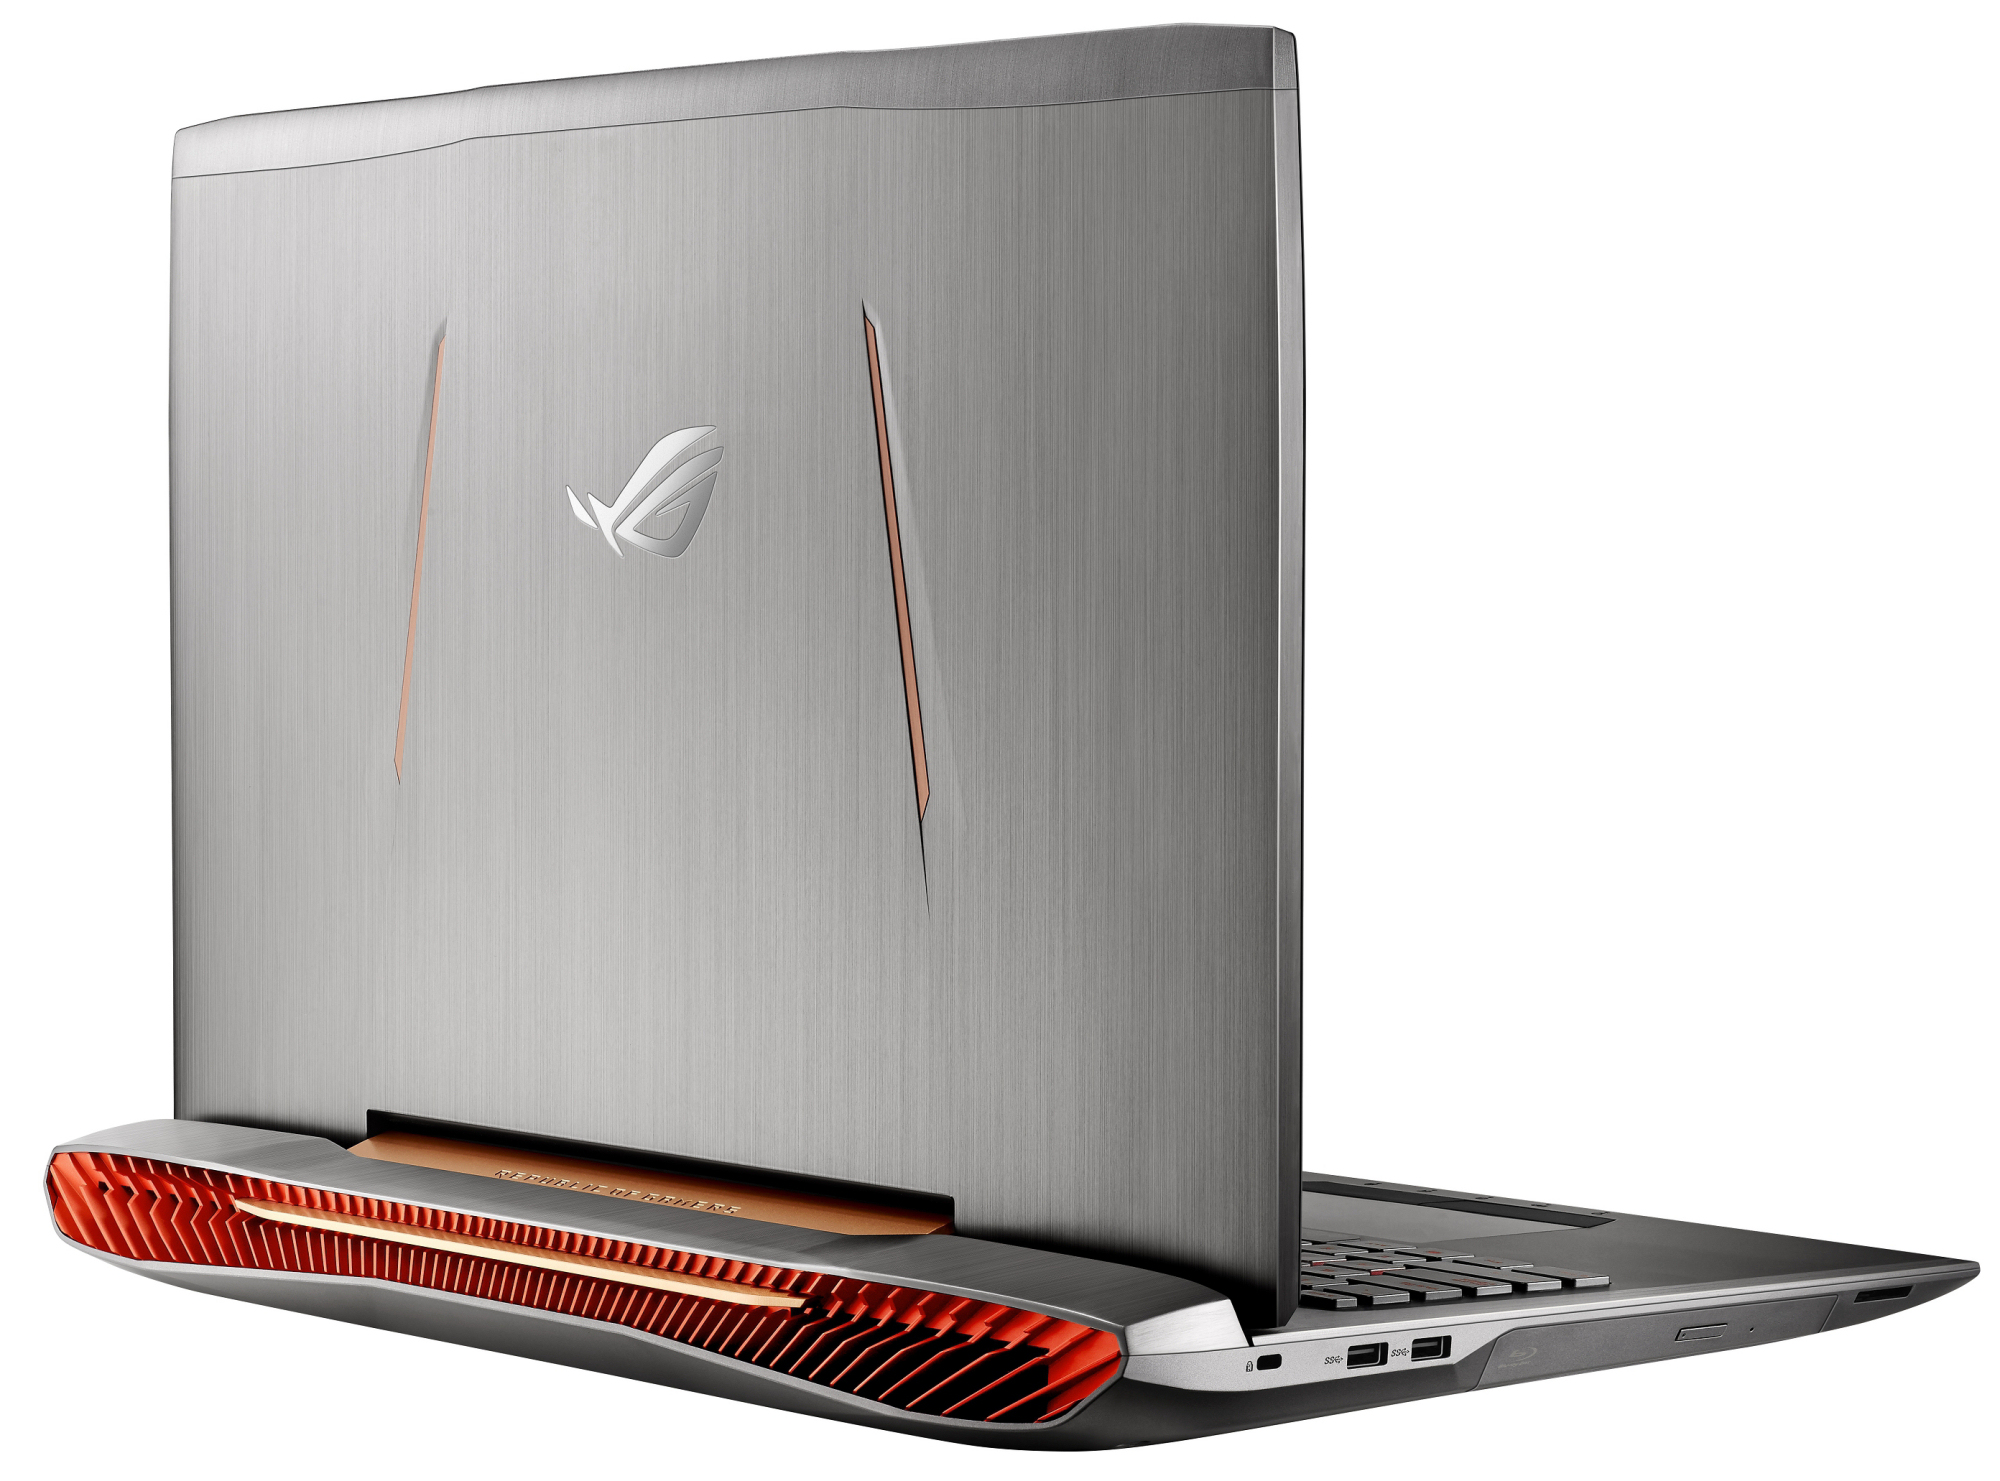
Asus G752VS-BA338T
-
05/30/2017 v6(old)
Sascha Mölck
Pricecompare
