 Deutsch
 English
 Español
 Français
 Italiano
 Nederlands
 Polski
 Português
 Русский
 Türkçe
 Svenska
 Chinese
 Magyar
戴尔 Precision 7710 工作站简短评测


| |||||||||||||||||||||||||
Brightness Distribution: 83 %
Center on Battery: 335 cd/m²
Contrast: 1006:1 (Black: 0.33 cd/m²)
ΔE Color 3 | 0.5-29.43 Ø5
ΔE Greyscale 4 | 0.57-98 Ø5.3
97% sRGB (Argyll 1.6.3 3D)
62% AdobeRGB 1998 (Argyll 1.6.3 3D)
68.6% AdobeRGB 1998 (Argyll 2.2.0 3D)
96.9% sRGB (Argyll 2.2.0 3D)
66.6% Display P3 (Argyll 2.2.0 3D)
Gamma: 2
| Display | |
| Display P3 Coverage (sort by value) | |
| Dell Precision 7710 | |
| Lenovo ThinkPad P70 | |
| SCHENKER W706 | |
| MSI WT72-6QM | |
| sRGB Coverage (sort by value) | |
| Dell Precision 7710 | |
| Lenovo ThinkPad P70 | |
| SCHENKER W706 | |
| MSI WT72-6QM | |
| AdobeRGB 1998 Coverage (sort by value) | |
| Dell Precision 7710 | |
| Lenovo ThinkPad P70 | |
| SCHENKER W706 | |
| MSI WT72-6QM | |
| Response Times | |
| Response Time Grey 50% / Grey 80% (sort by value) | |
| Dell Precision 7710 (17, 33) | |
| Lenovo ThinkPad P70 (17.2, 26.8) | |
| SCHENKER W706 (17.2, 26.8) | |
| MSI WT72-6QM (13, 29) | |
| Response Time Black / White (sort by value) | |
| Dell Precision 7710 (11, 25) | |
| Lenovo ThinkPad P70 (4.8, 22.8) | |
| SCHENKER W706 (8.4, 20.8) | |
| MSI WT72-6QM (7, 19) | |
| PWM Frequency (sort by value) | |
| Dell Precision 7710 (25) | |
| Lenovo ThinkPad P70 (95) | |
| SCHENKER W706 | |
| MSI WT72-6QM (10, 15) | |
* ... smaller is better
Display Response Times
| ↔ Response Time Black to White | ||
|---|---|---|
| 36 ms ... rise ↗ and fall ↘ combined | ↗ 11 ms rise | 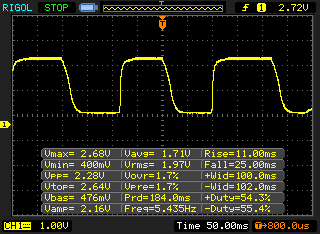 |
| ↘ 25 ms fall | ||
| The screen shows slow response rates in our tests and will be unsatisfactory for gamers. In comparison, all tested devices range from 0.1 (minimum) to 240 (maximum) ms. » 93 % of all devices are better. This means that the measured response time is worse than the average of all tested devices (21.5 ms). | ||
| ↔ Response Time 50% Grey to 80% Grey | ||
| 50 ms ... rise ↗ and fall ↘ combined | ↗ 17 ms rise | 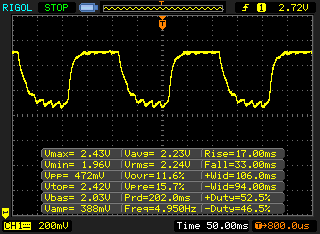 |
| ↘ 33 ms fall | ||
| The screen shows slow response rates in our tests and will be unsatisfactory for gamers. In comparison, all tested devices range from 0.2 (minimum) to 636 (maximum) ms. » 84 % of all devices are better. This means that the measured response time is worse than the average of all tested devices (33.7 ms). | ||
Screen Flickering / PWM (Pulse-Width Modulation)
| Screen flickering / PWM detected | 198 Hz | ≤ 25 % brightness setting | 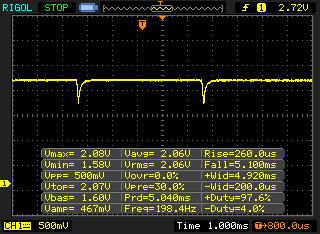 |
The display backlight flickers at 198 Hz (worst case, e.g., utilizing PWM) Flickering detected at a brightness setting of 25 % and below. There should be no flickering or PWM above this brightness setting. The frequency of 198 Hz is relatively low, so sensitive users will likely notice flickering and experience eyestrain at the stated brightness setting and below. In comparison: 53 % of all tested devices do not use PWM to dim the display. If PWM was detected, an average of 17900 (minimum: 5 - maximum: 3846000) Hz was measured. | |||
| Cinebench R15 | |
| CPU Single 64Bit (sort by value) | |
| Dell Precision 7710 | |
| Lenovo ThinkPad P70 | |
| Acer Aspire V5-591G-50NC | |
| CPU Multi 64Bit (sort by value) | |
| Dell Precision 7710 | |
| Lenovo ThinkPad P70 | |
| Acer Aspire V5-591G-50NC | |
| Super Pi Mod 1.5 XS 32M - 32M (sort by value) | |
| Dell Precision 7710 | |
| Lenovo ThinkPad P70 | |
| Acer Aspire V5-591G-50NC | |
| wPrime 2.10 - 1024m (sort by value) | |
| Dell Precision 7710 | |
| Lenovo ThinkPad P70 | |
| Acer Aspire V5-591G-50NC | |
* ... smaller is better
| PCMark 8 | |
| Home Score Accelerated v2 (sort by value) | |
| Dell Precision 7710 | |
| Lenovo ThinkPad P70 | |
| SCHENKER W706 | |
| MSI WT72-6QM | |
| Creative Score Accelerated v2 (sort by value) | |
| Dell Precision 7710 | |
| SCHENKER W706 | |
| Work Score Accelerated v2 (sort by value) | |
| Dell Precision 7710 | |
| Lenovo ThinkPad P70 | |
| SCHENKER W706 | |
| MSI WT72-6QM | |
| PCMark 7 Score | 5072 points | |
| PCMark 8 Home Score Accelerated v2 | 4770 points | |
| PCMark 8 Creative Score Accelerated v2 | 5668 points | |
| PCMark 8 Work Score Accelerated v2 | 5417 points | |
Help | ||

| LuxMark v2.0 64Bit | |
| Room GPUs-only (sort by value) | |
| Dell Precision 7710 | |
| Lenovo ThinkPad P70 | |
| Dell Precision 5510 | |
| Sala GPUs-only (sort by value) | |
| Dell Precision 7710 | |
| Lenovo ThinkPad P70 | |
| Dell Precision 5510 | |
| SiSoft Sandra 2016 | |
| Image Processing (sort by value) | |
| Dell Precision 7710 | |
| Lenovo ThinkPad P70 | |
| Dell Precision 5510 | |
| GP Cryptography (Higher Security AES256+SHA2-512) (sort by value) | |
| Dell Precision 7710 | |
| Lenovo ThinkPad P70 | |
| Dell Precision 5510 | |
| GP Financial Analysis (FP High/Double Precision) (sort by value) | |
| Dell Precision 7710 | |
| Lenovo ThinkPad P70 | |
| Dell Precision 5510 | |
| Unigine Heaven 3.0 | |
| 1920x1080 OpenGL, Normal Tessellation, High Shaders AA:Off AF:Off (sort by value) | |
| Dell Precision 7710 | |
| Lenovo ThinkPad P70 | |
| Dell Precision 5510 | |
| 1920x1080 DX 11, Normal Tessellation, High Shaders AA:Off AF:Off (sort by value) | |
| Dell Precision 7710 | |
| Lenovo ThinkPad P70 | |
| Dell Precision 5510 | |
| Unigine Valley 1.0 | |
| 1920x1080 Extreme HD DirectX AA:x8 (sort by value) | |
| Dell Precision 7710 | |
| Lenovo ThinkPad P70 | |
| Dell Precision 5510 | |
| 1920x1080 Extreme HD Preset OpenGL AA:x8 (sort by value) | |
| Dell Precision 7710 | |
| Lenovo ThinkPad P70 | |
| Dell Precision 5510 | |
| 3DMark 06 Standard Score | 28430 points | |
| 3DMark Vantage P Result | 26345 points | |
| 3DMark 11 Performance | 9580 points | |
| 3DMark Ice Storm Standard Score | 95675 points | |
| 3DMark Cloud Gate Standard Score | 21612 points | |
| 3DMark Fire Strike Score | 6180 points | |
Help | ||
| low | med. | high | ultra | |
| Tomb Raider (2013) | 375 | 224 | 167 | 51 |
| BioShock Infinite (2013) | 220 | 178 | 158 | 66 |
| Metro: Last Light (2013) | 120 | 112 | 94 | 44 |
| Company of Heroes 2 (2013) | 57 | 56 | 55 | 28 |
| Total War: Rome II (2013) | 185 | 162 | 153 | 36 |
| Thief (2014) | 62 | 57 | 57 | 40 |
| GRID: Autosport (2014) | 232 | 116 | 99 | 67 |
| Middle-earth: Shadow of Mordor (2014) | 177 | 126 | 70 | 52 |
| Ryse: Son of Rome (2014) | 101 | 93 | 43 | 15 |
| F1 2014 (2014) | 132 | 111 | 95 | 74 |
| Dirt Rally (2015) | 278 | 187 | 89 | 63 |
| The Witcher 3 (2015) | 97 | 72 | 31 | 23 |
| Anno 2205 (2015) | 146 | 93 | 43 | 20 |
Noise Level
| Idle |
| 30 / 30 / 30 dB(A) |
| HDD |
| 33.2 dB(A) |
| Load |
| 43.2 / 47.13 dB(A) |
 | ||
30 dB silent 40 dB(A) audible 50 dB(A) loud |
||
min: | ||
(+) The maximum temperature on the upper side is 35.6 °C / 96 F, compared to the average of 38.1 °C / 101 F, ranging from 22.2 to 69.8 °C for the class Workstation.
(-) The bottom heats up to a maximum of 55 °C / 131 F, compared to the average of 41.3 °C / 106 F
(+) In idle usage, the average temperature for the upper side is 27 °C / 81 F, compared to the device average of 32 °C / 90 F.
(+) The palmrests and touchpad are cooler than skin temperature with a maximum of 27 °C / 80.6 F and are therefore cool to the touch.
(±) The average temperature of the palmrest area of similar devices was 27.8 °C / 82 F (+0.8 °C / 1.4 F).
| Off / Standby | |
| Idle | |
| Load |
|
Pros
Cons
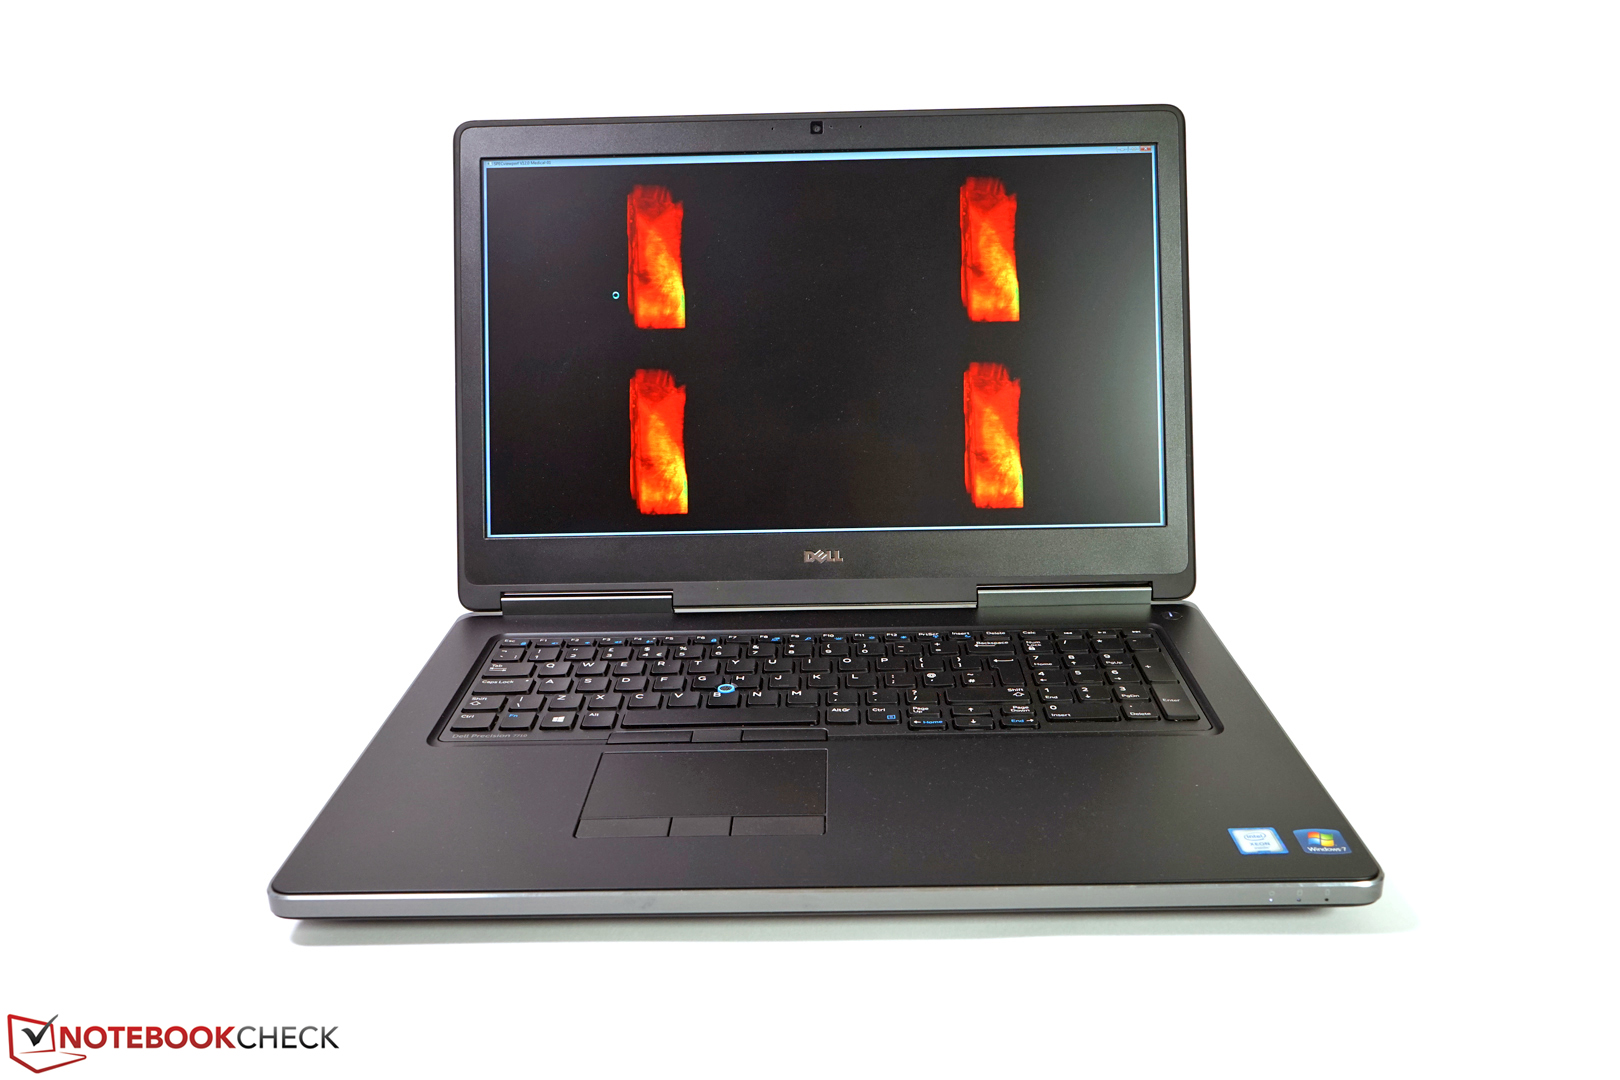
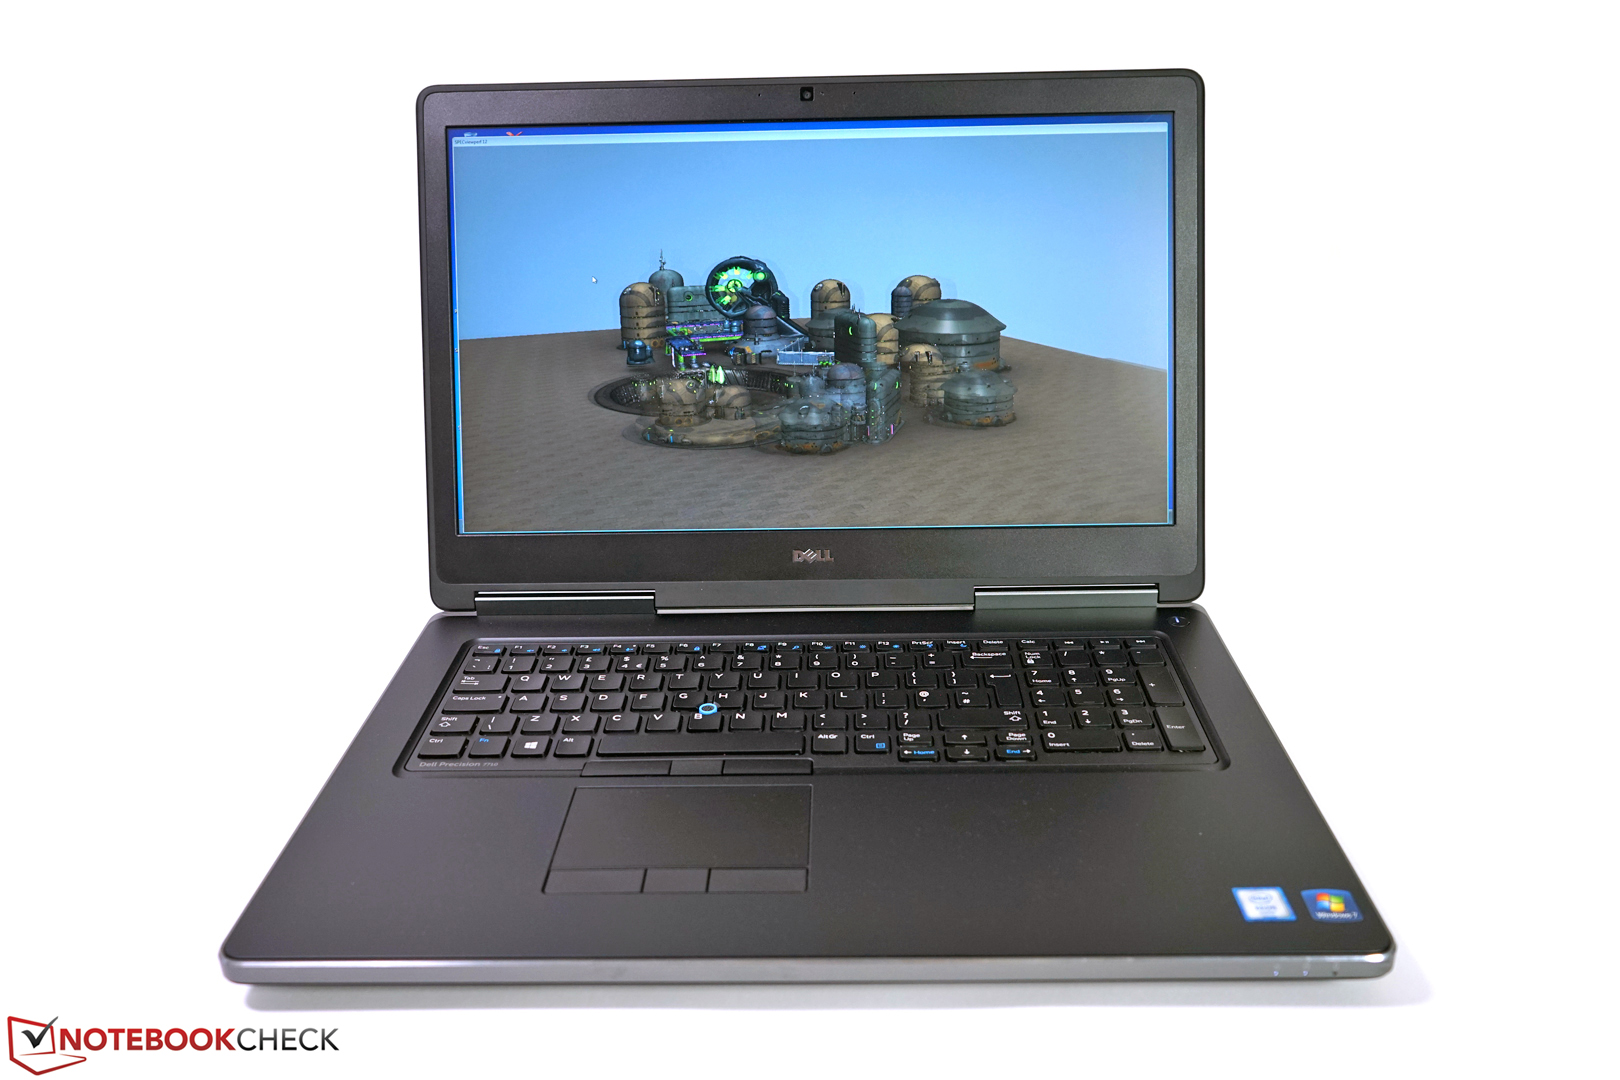
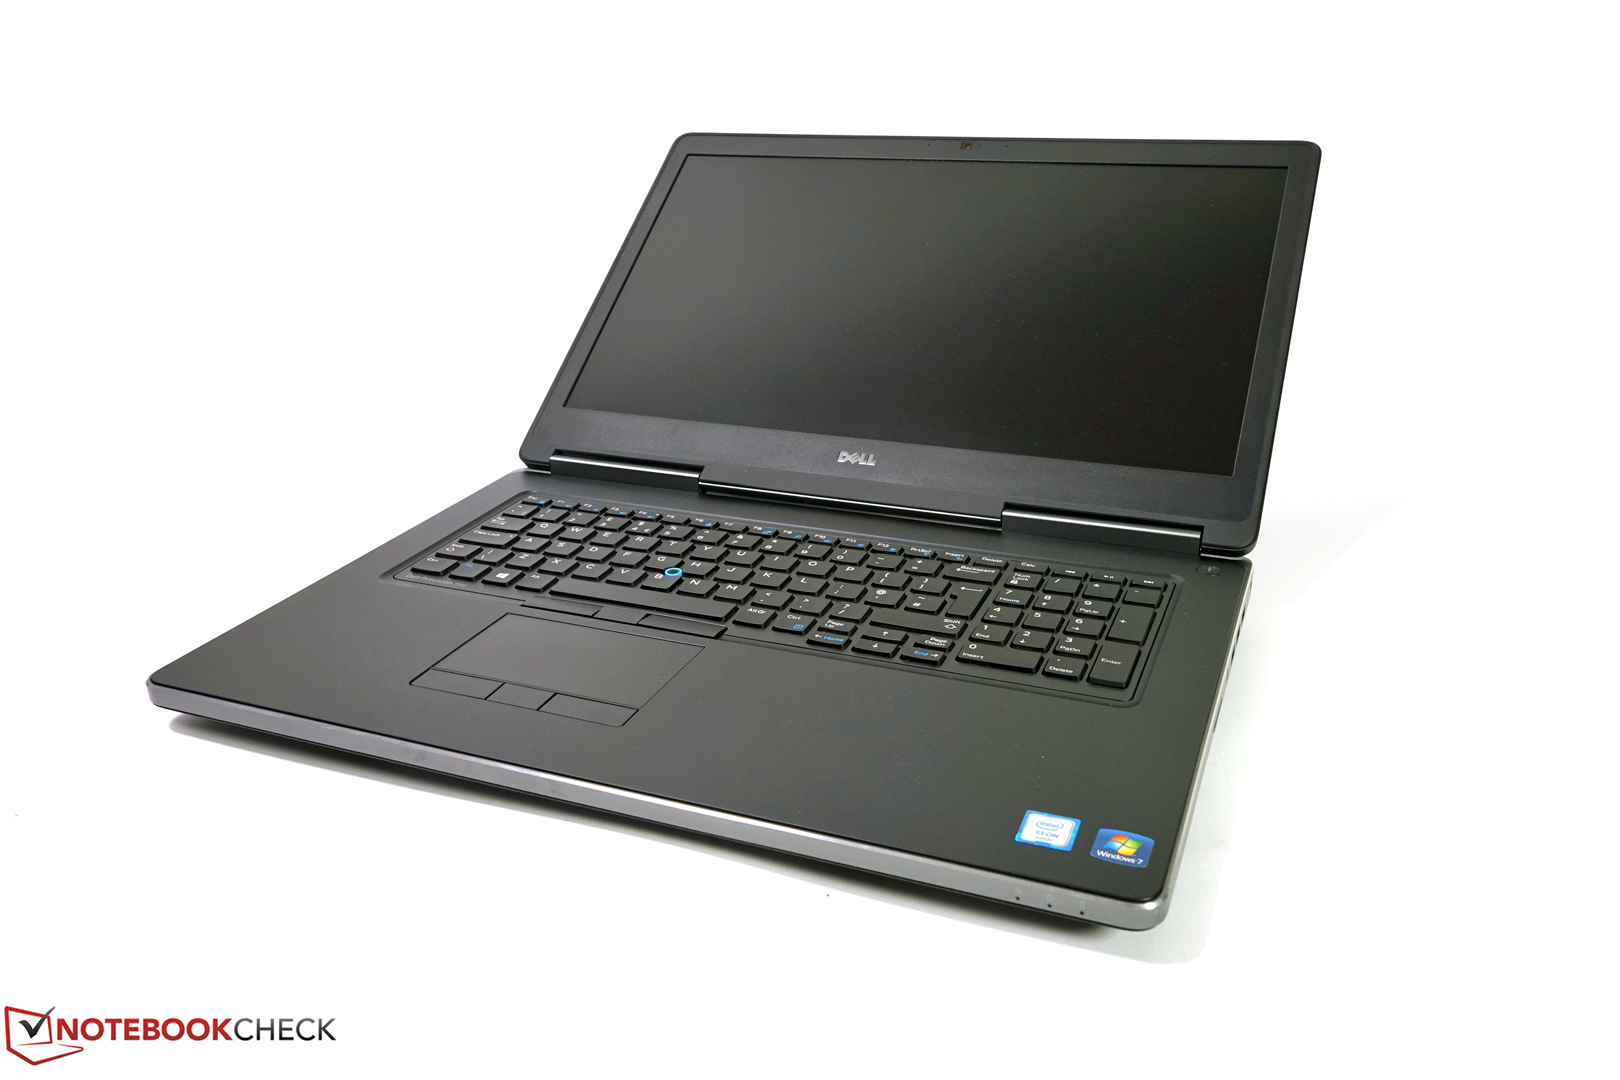
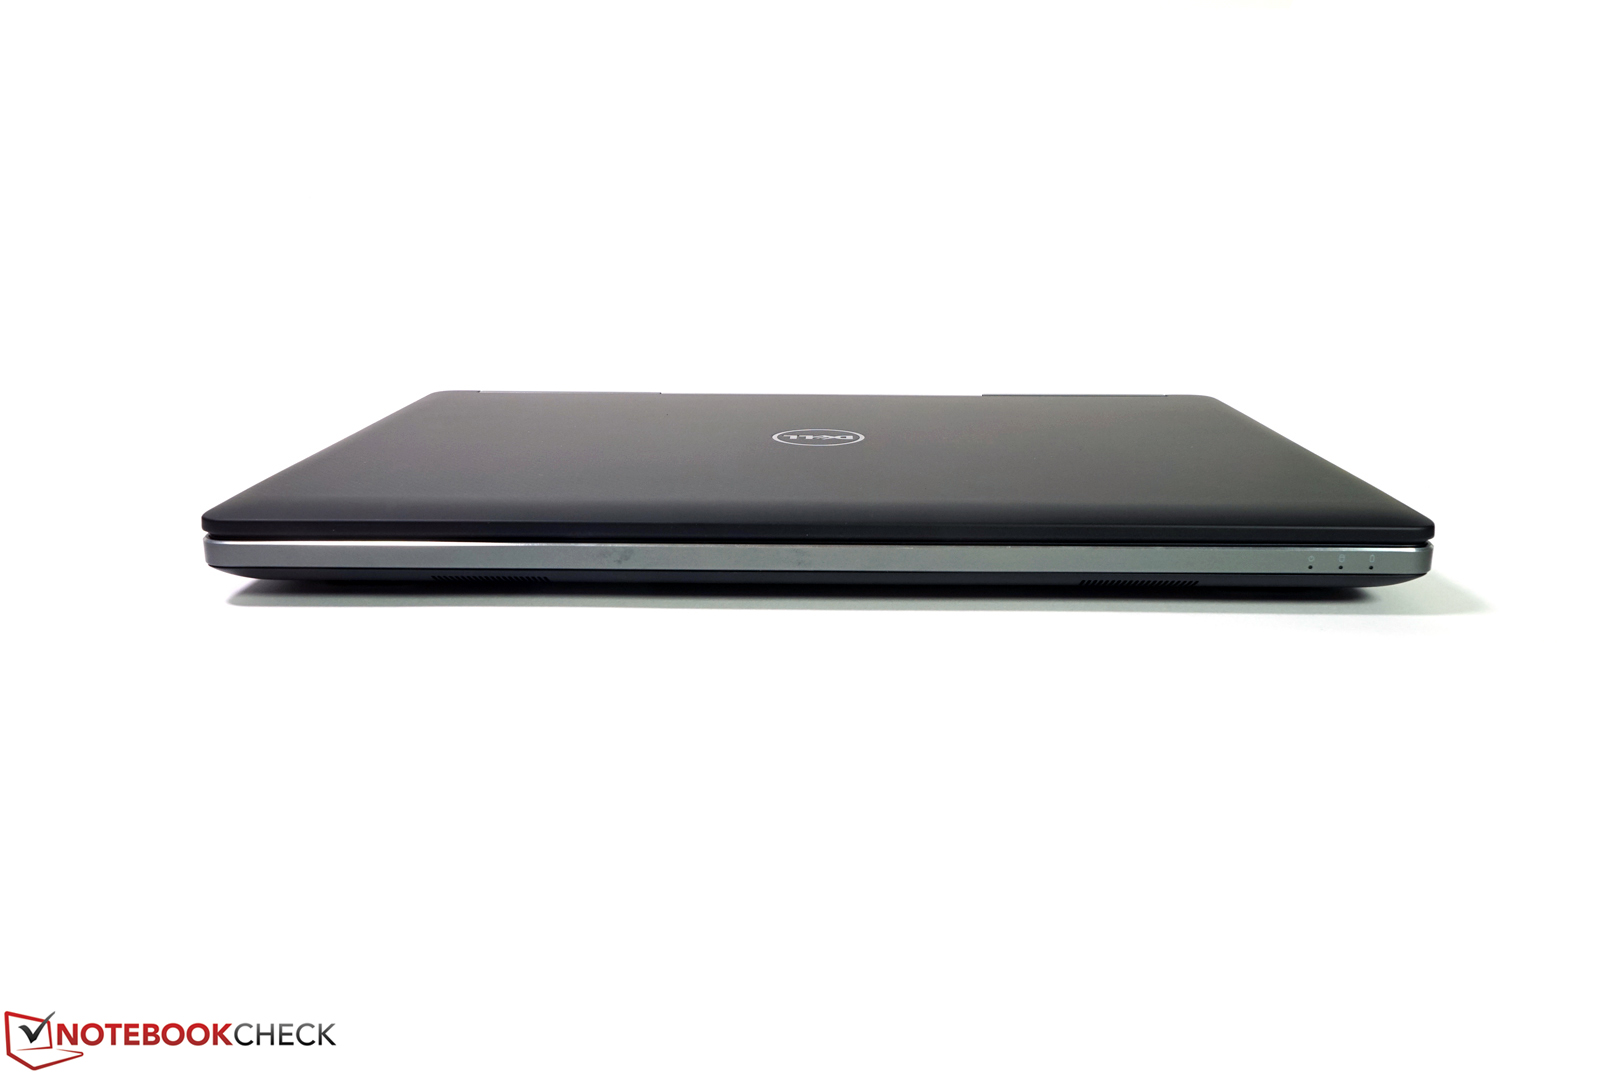
戴尔Precision 7710在许多主要方面都得到了更新。
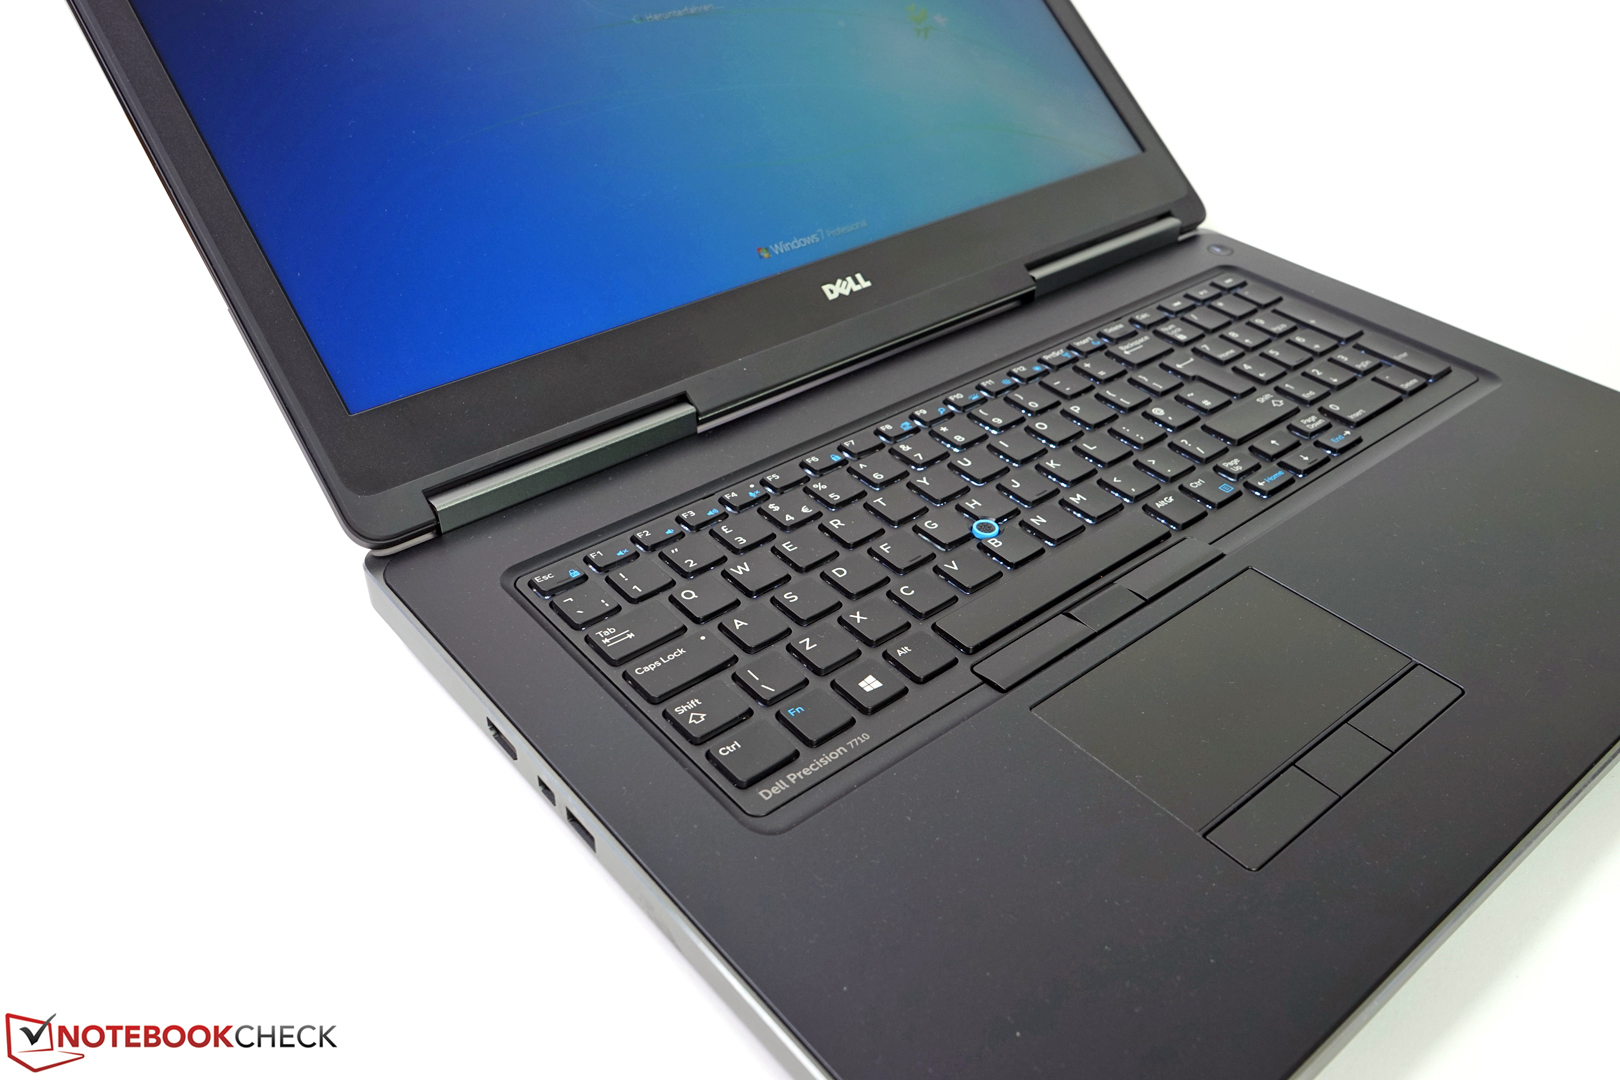
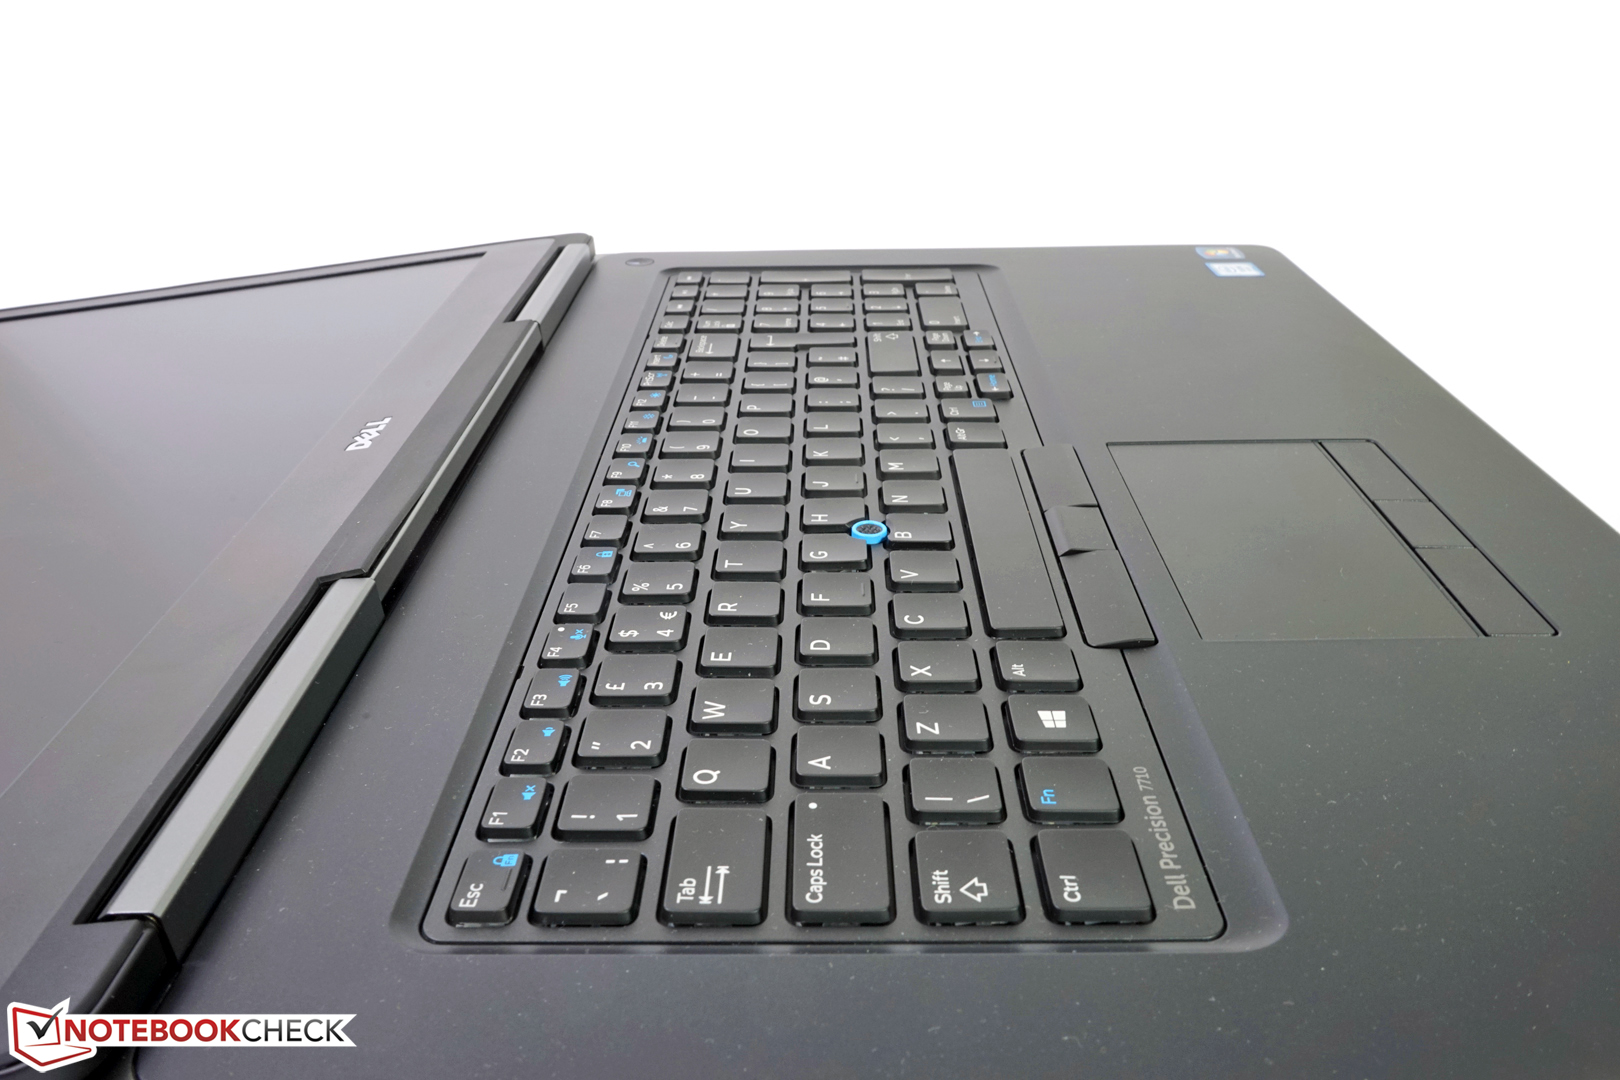
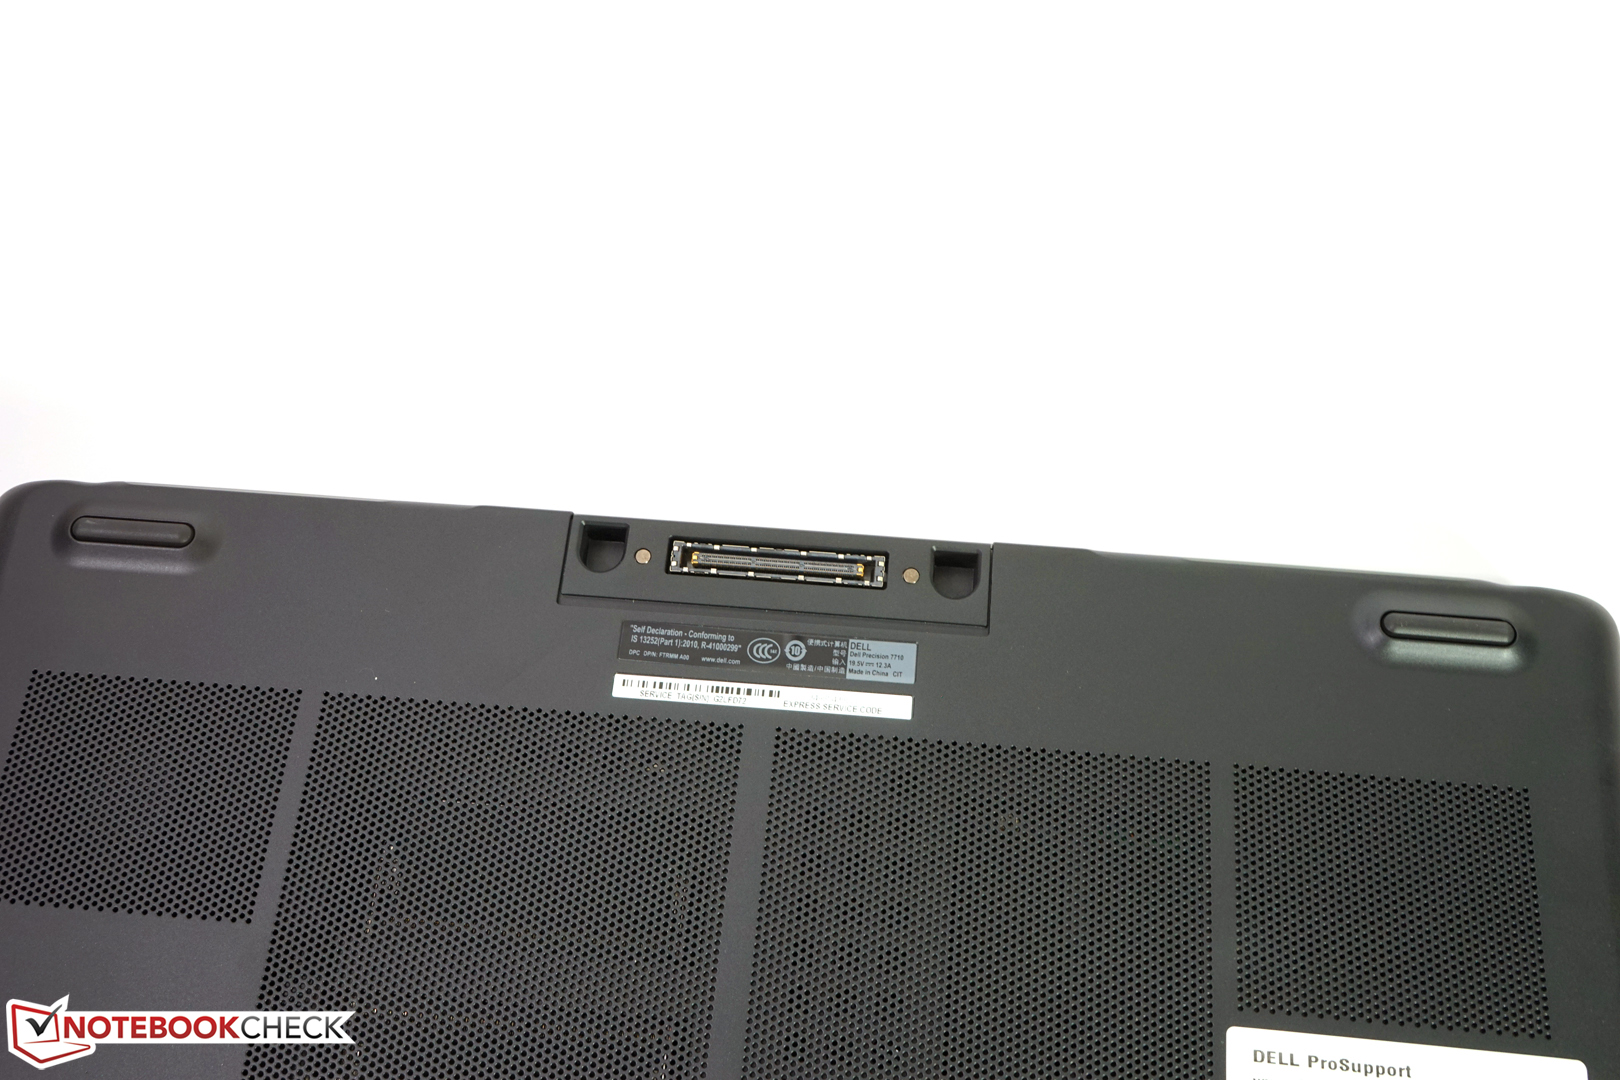
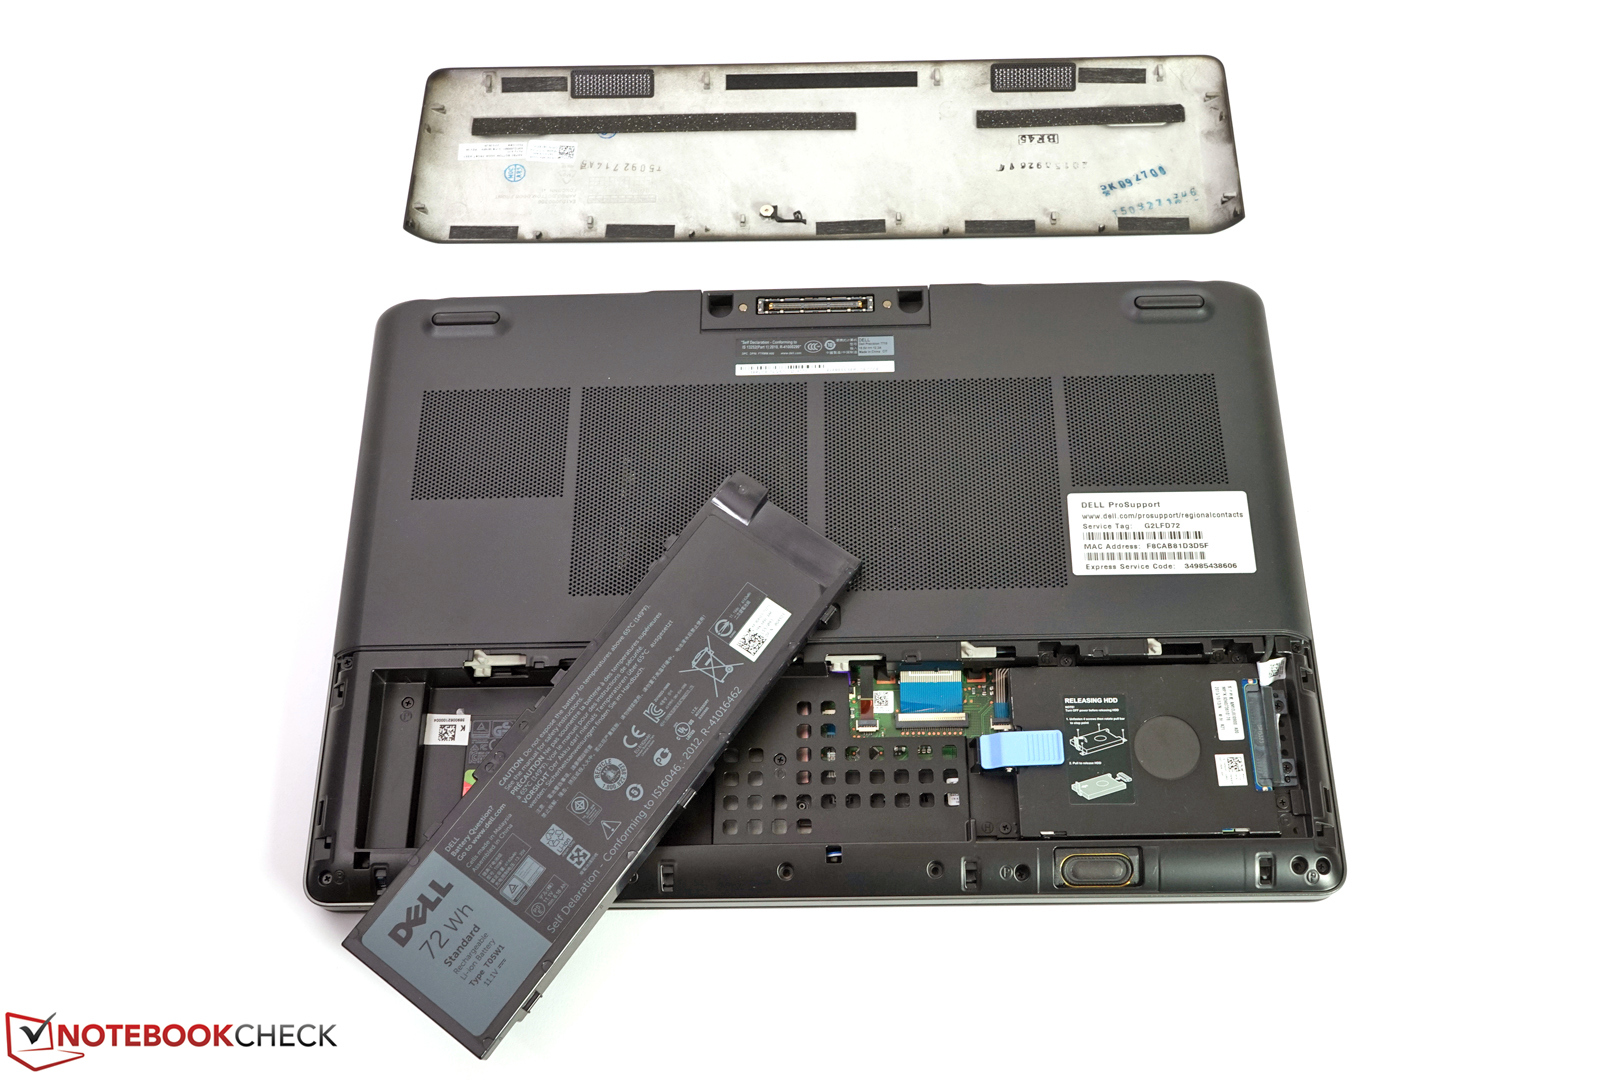
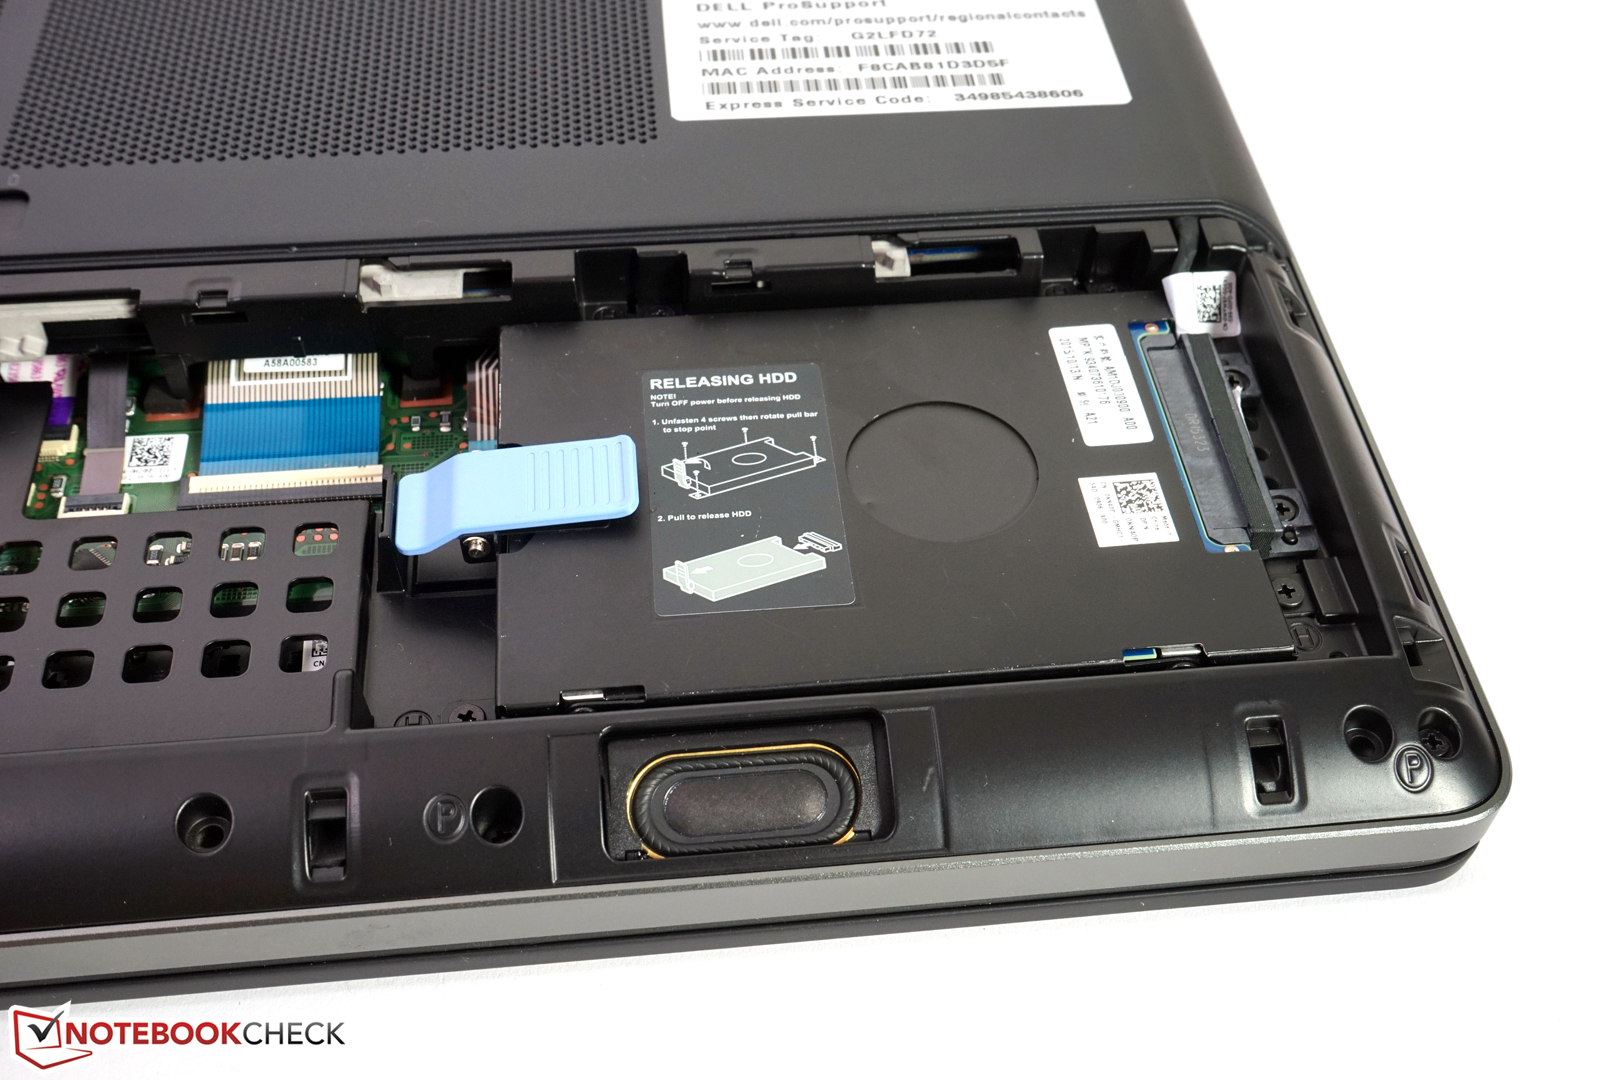
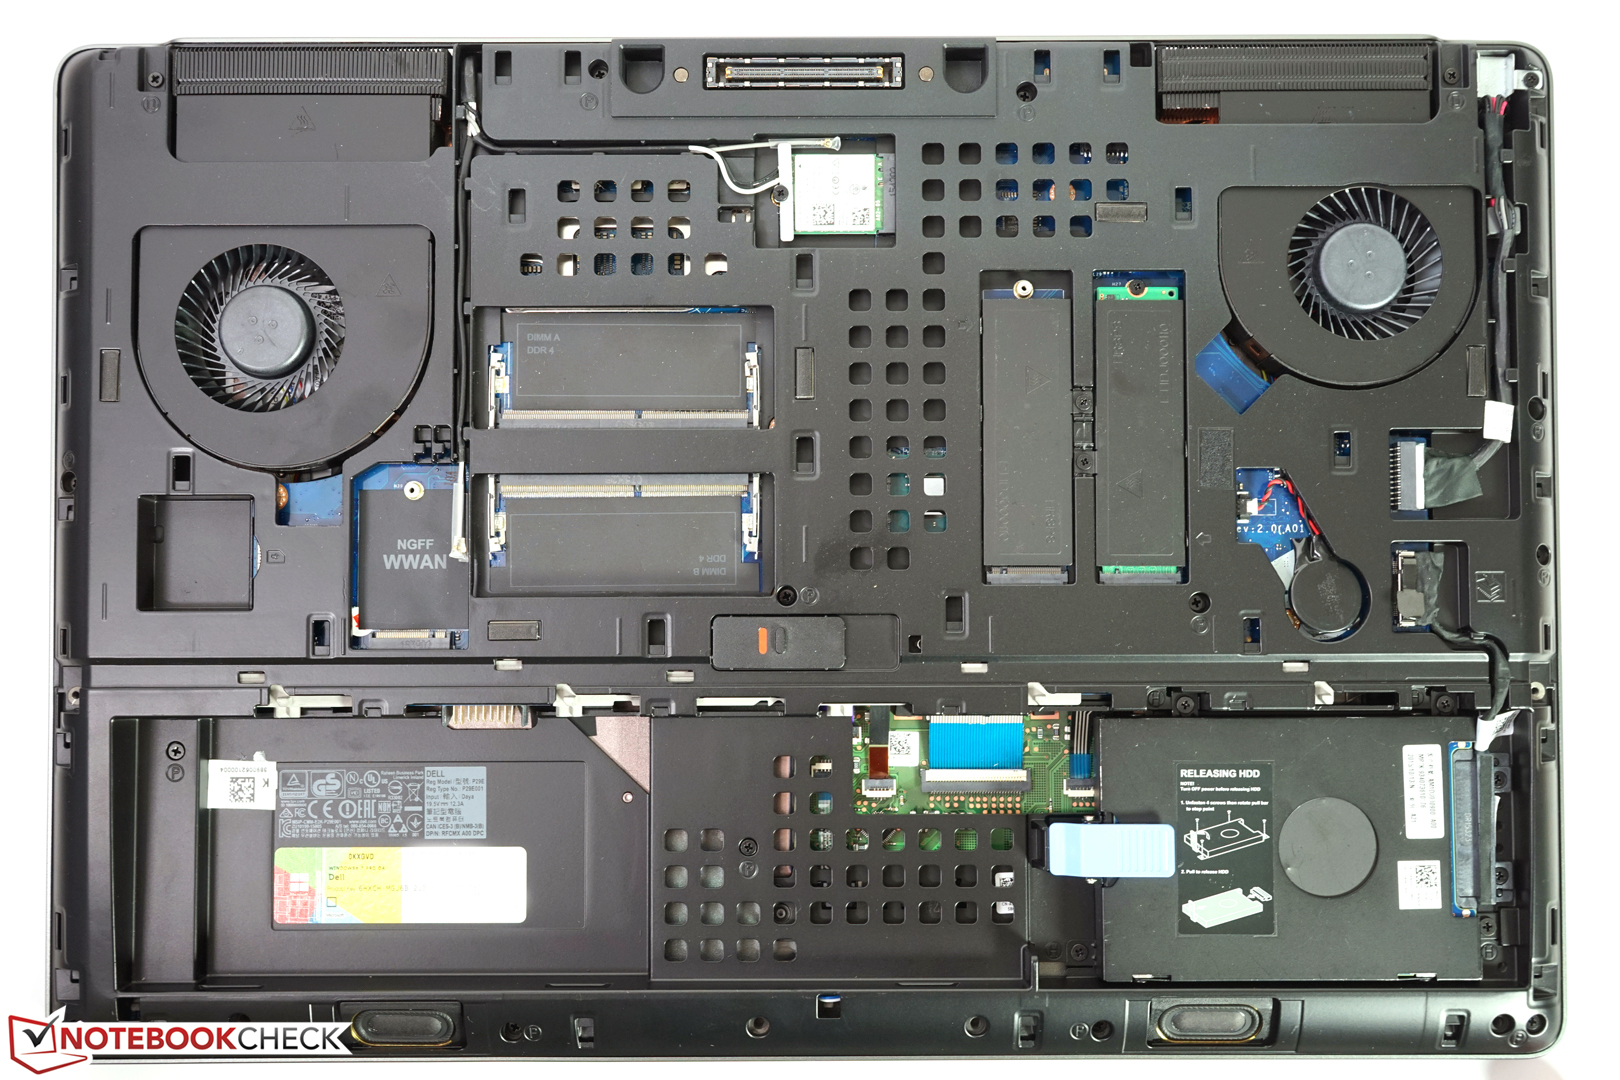
用户可以得到一台具备非常优秀的性能、易用输入设备、高端全高清屏幕,易于维护的移动工作站,可以适合新一年的专业工作用途。
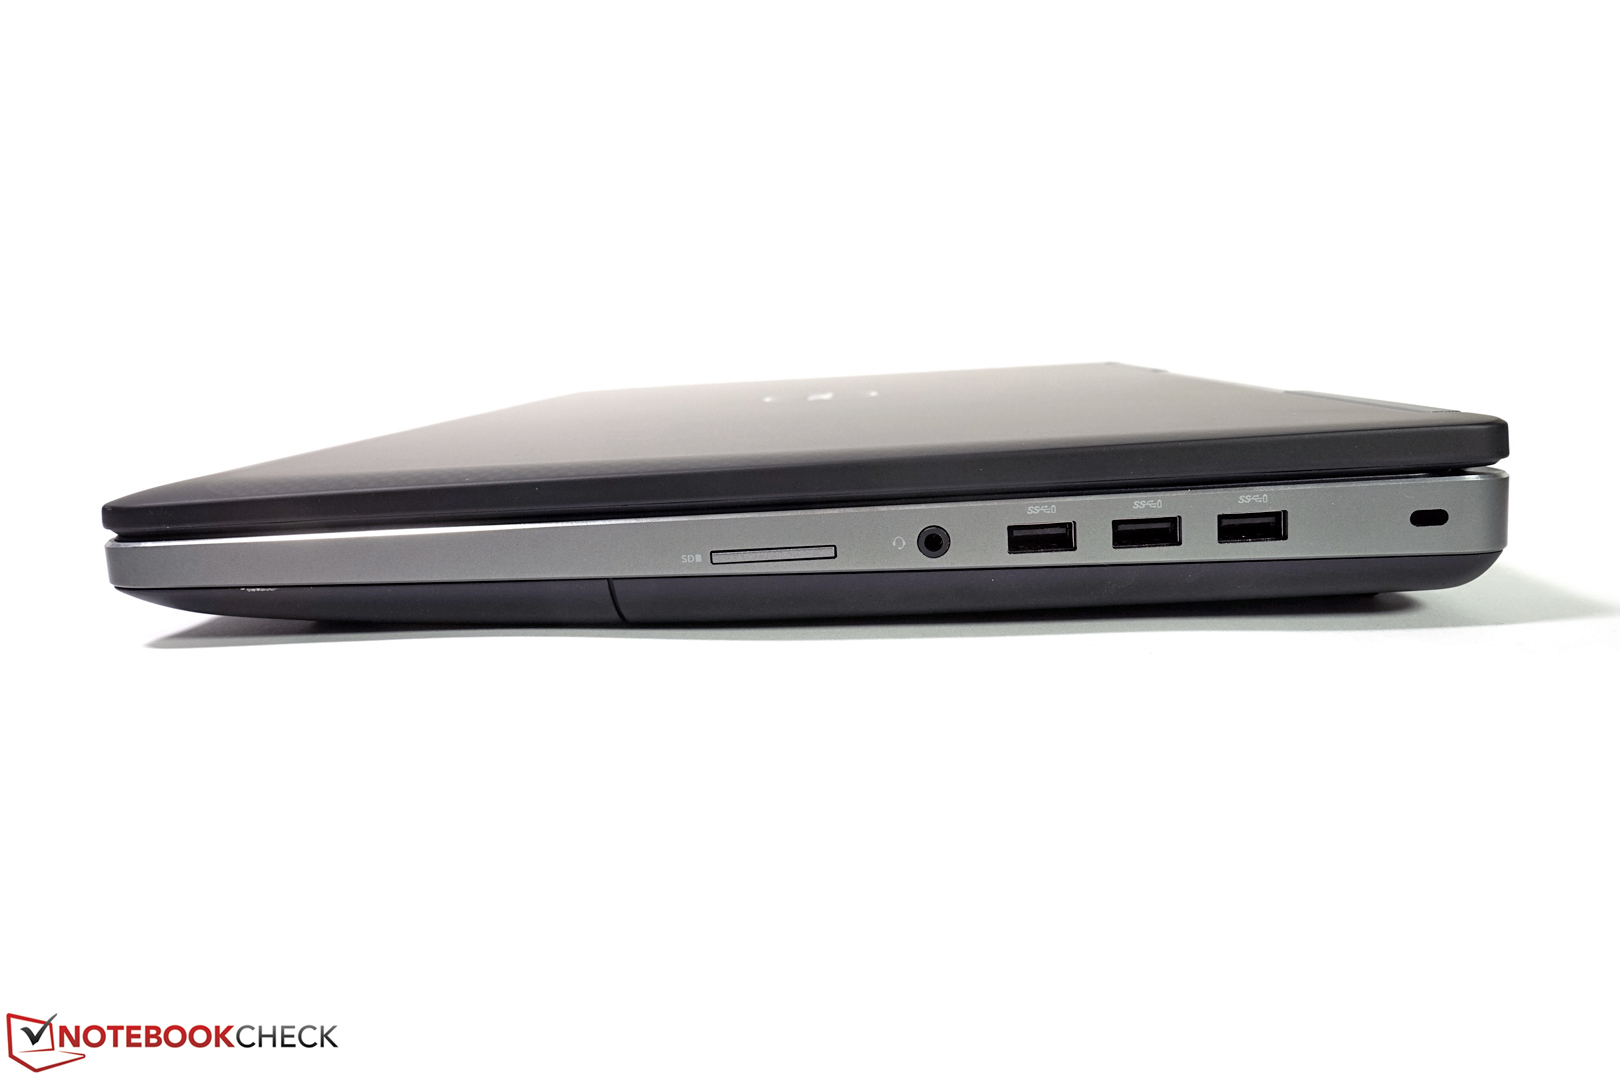
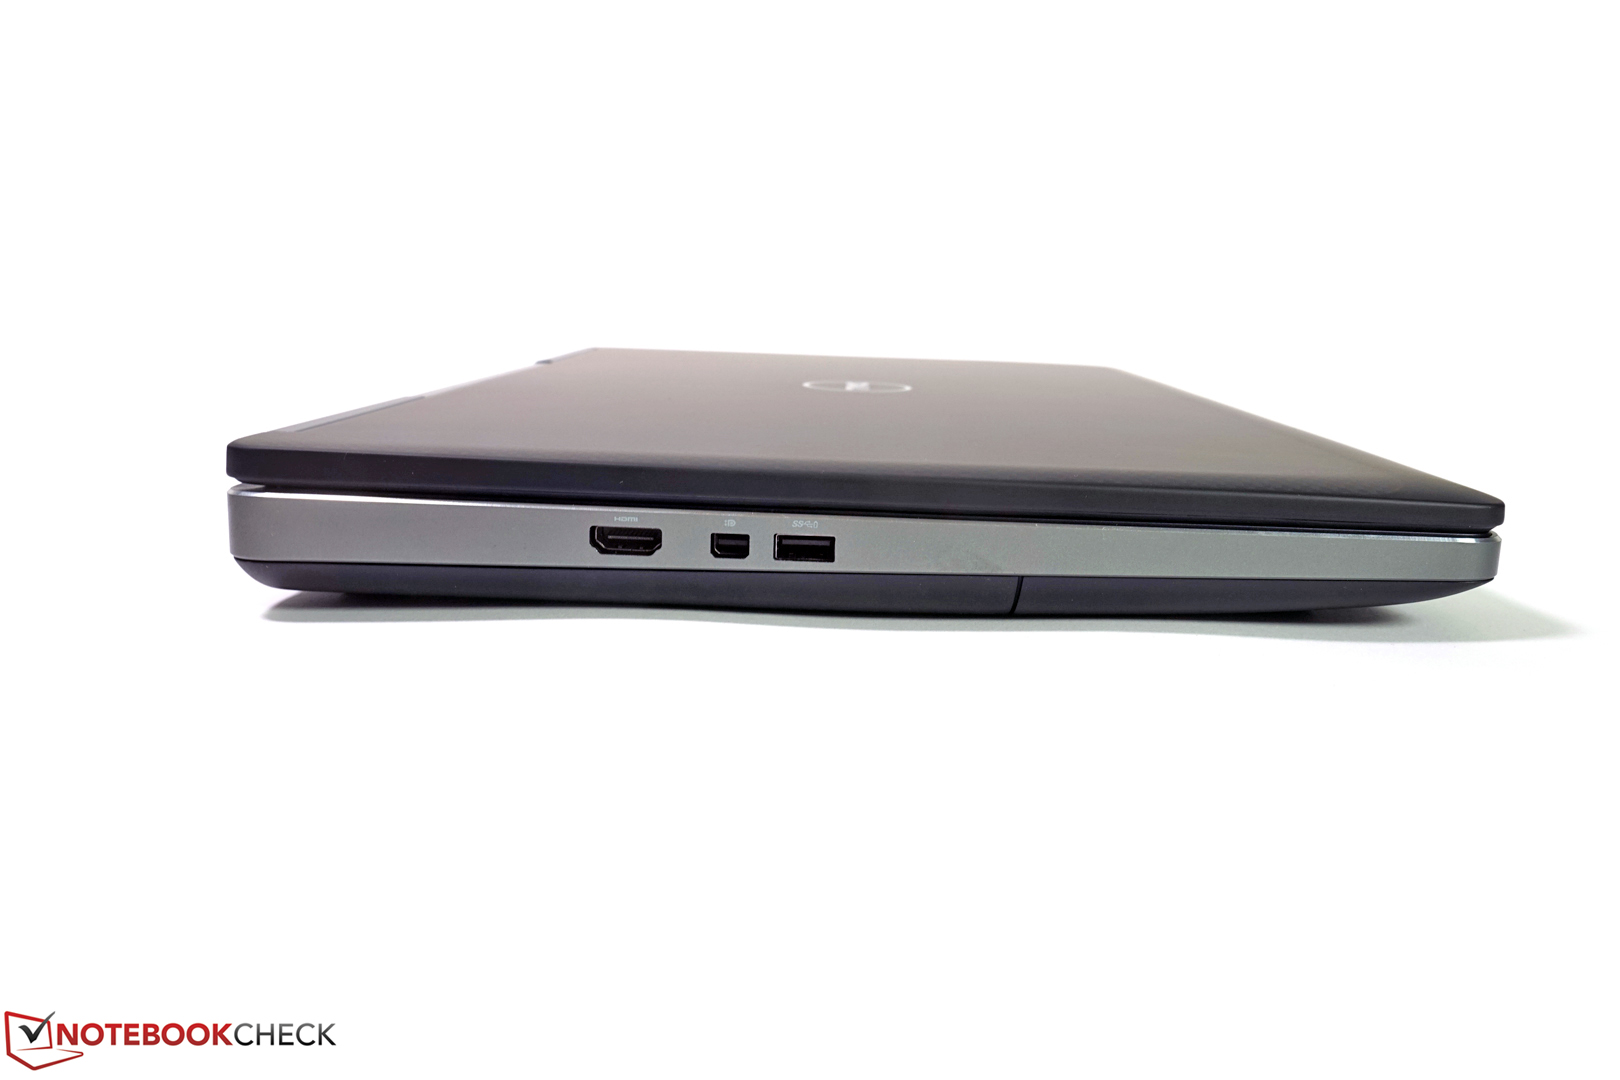
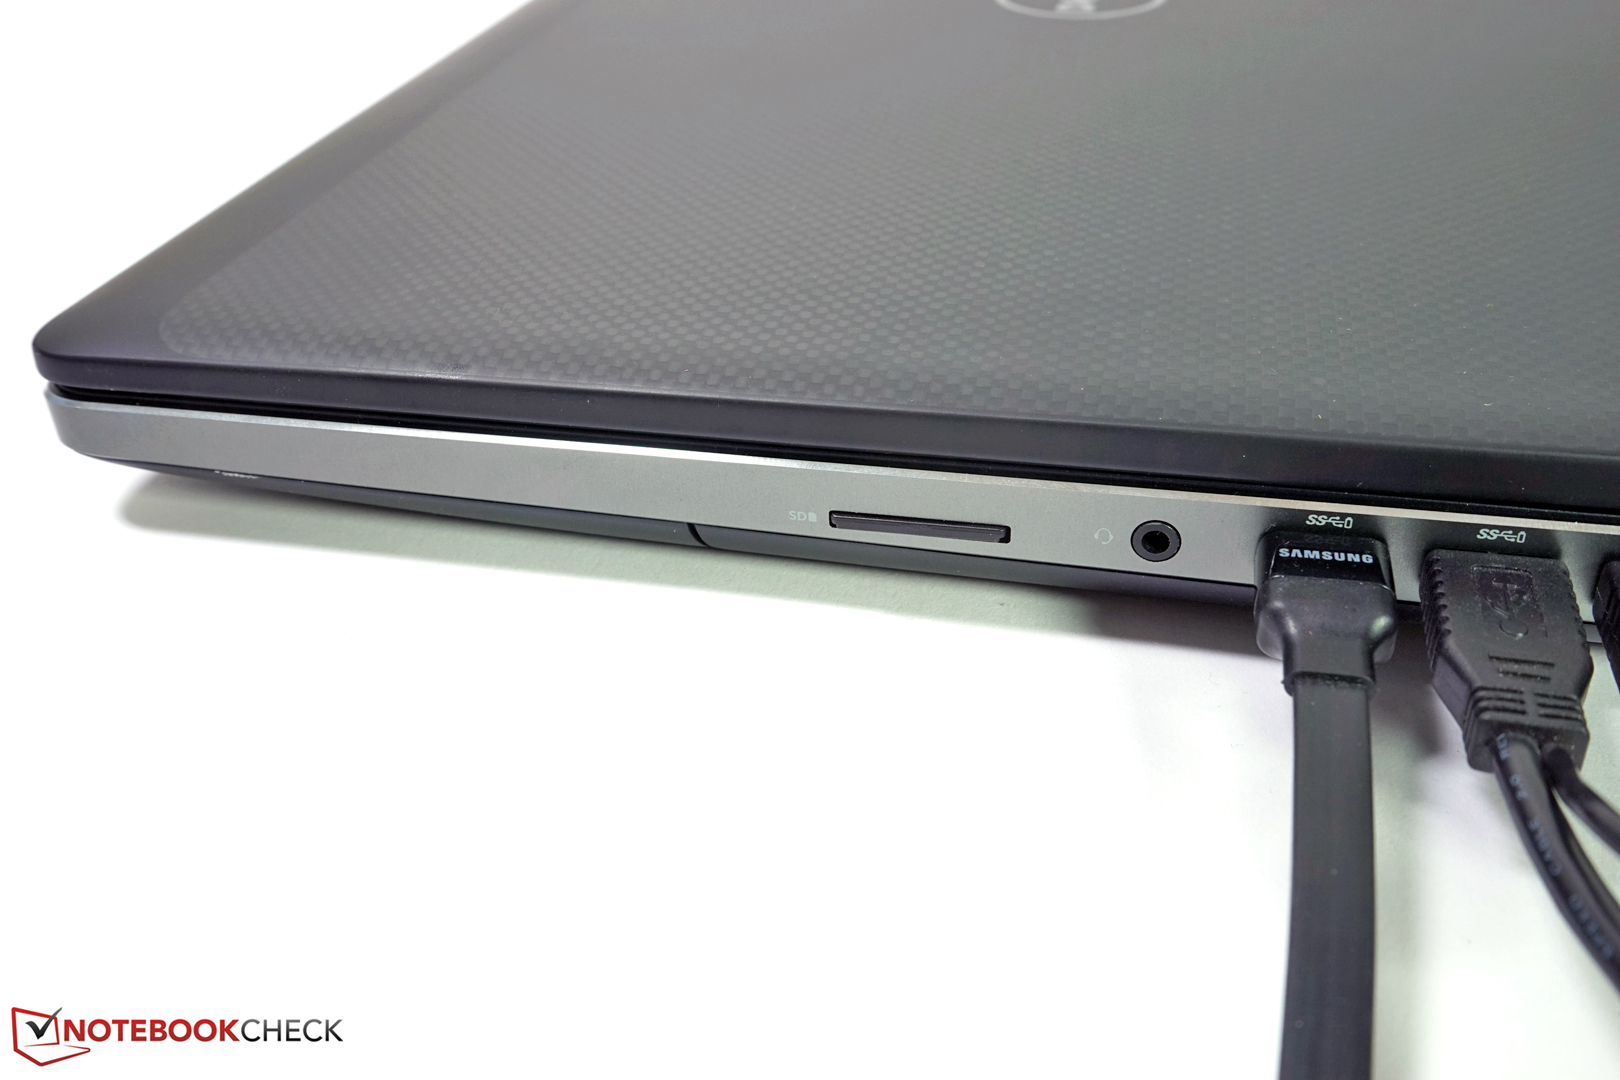
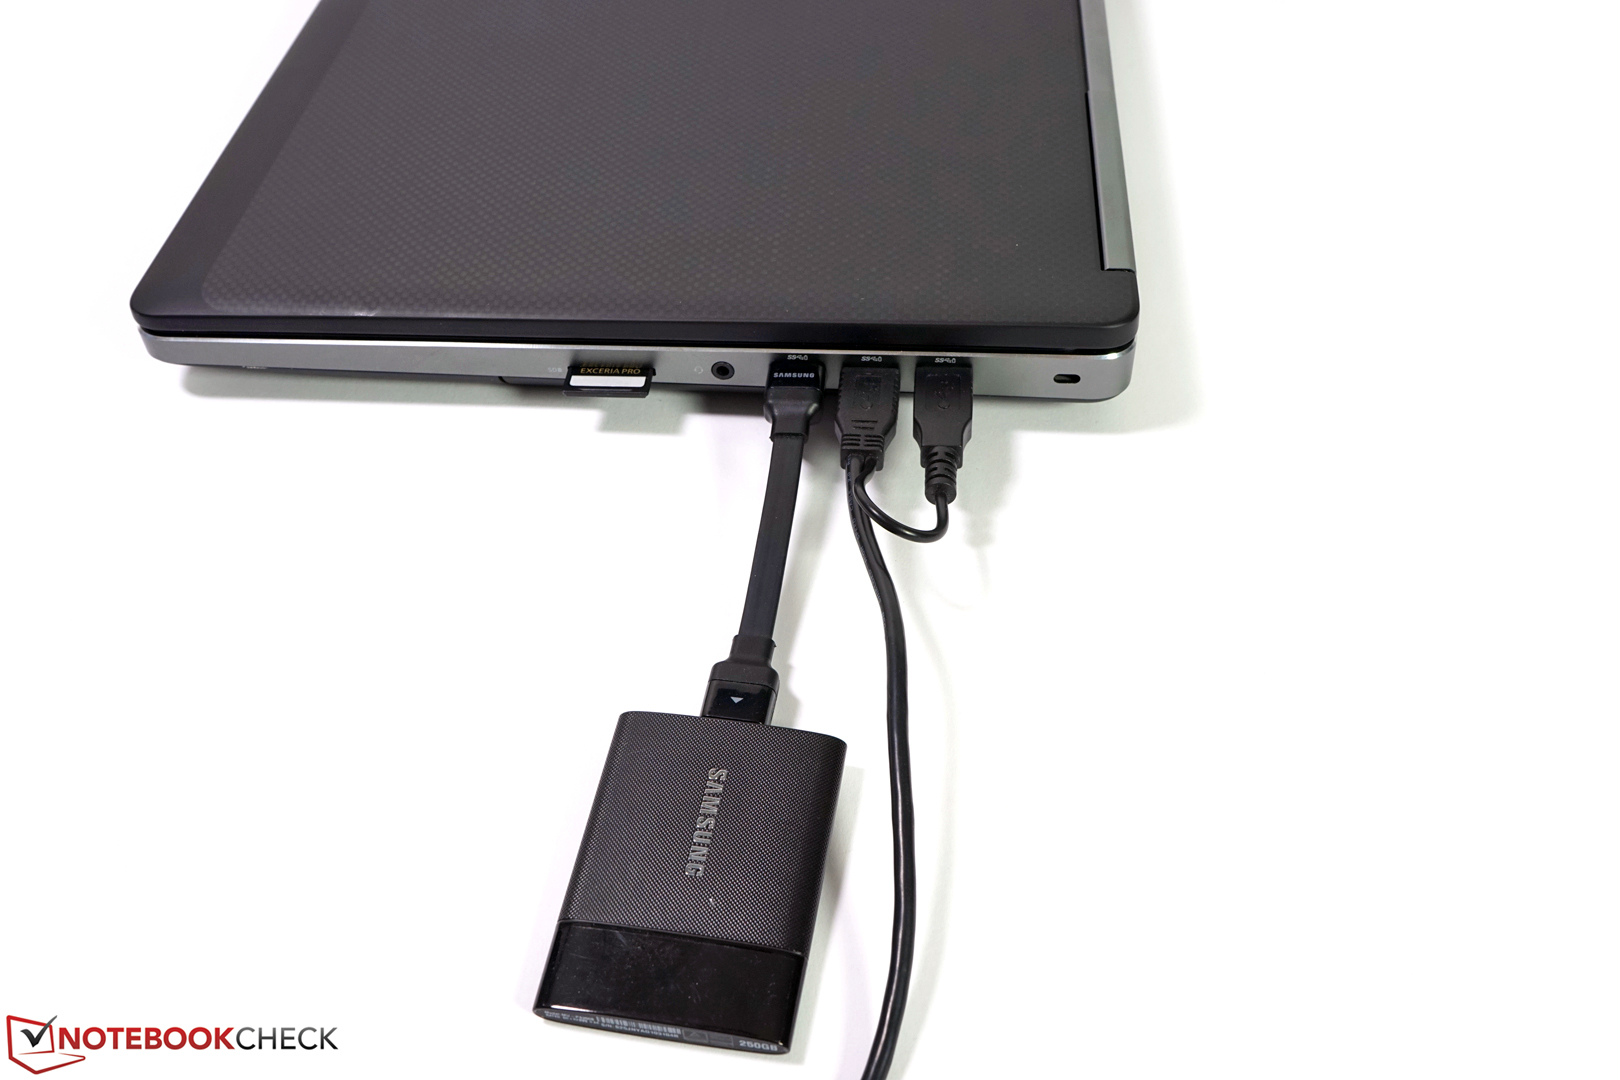
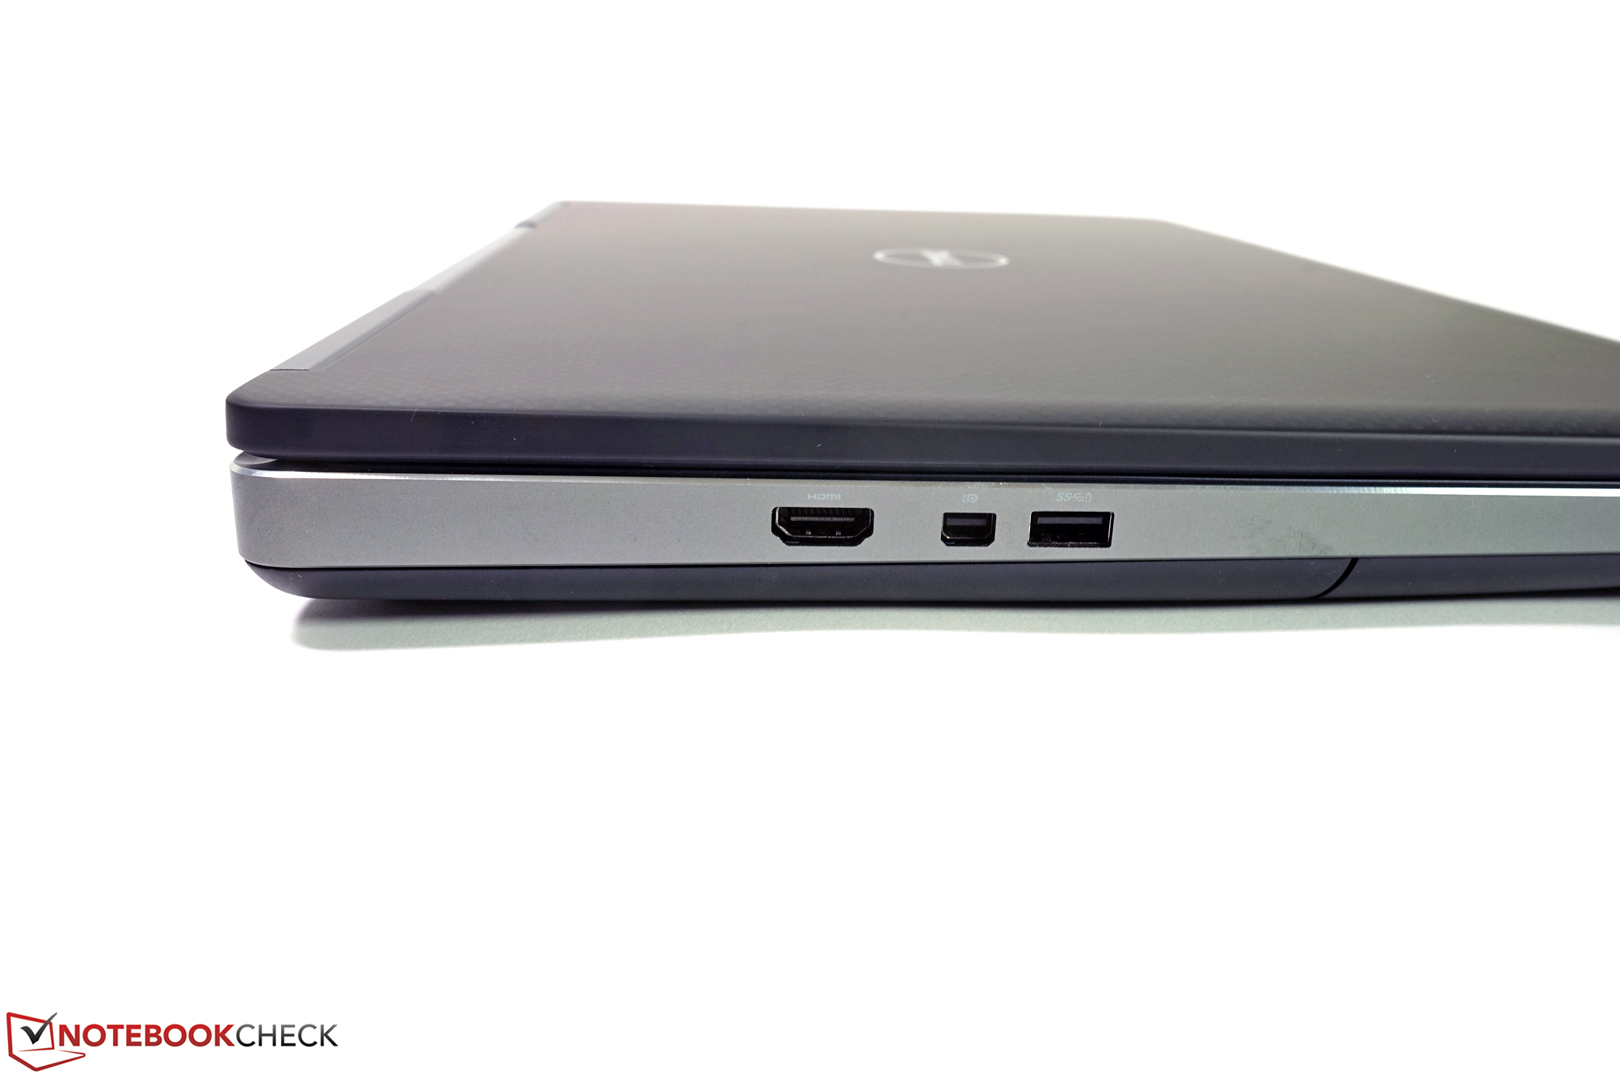
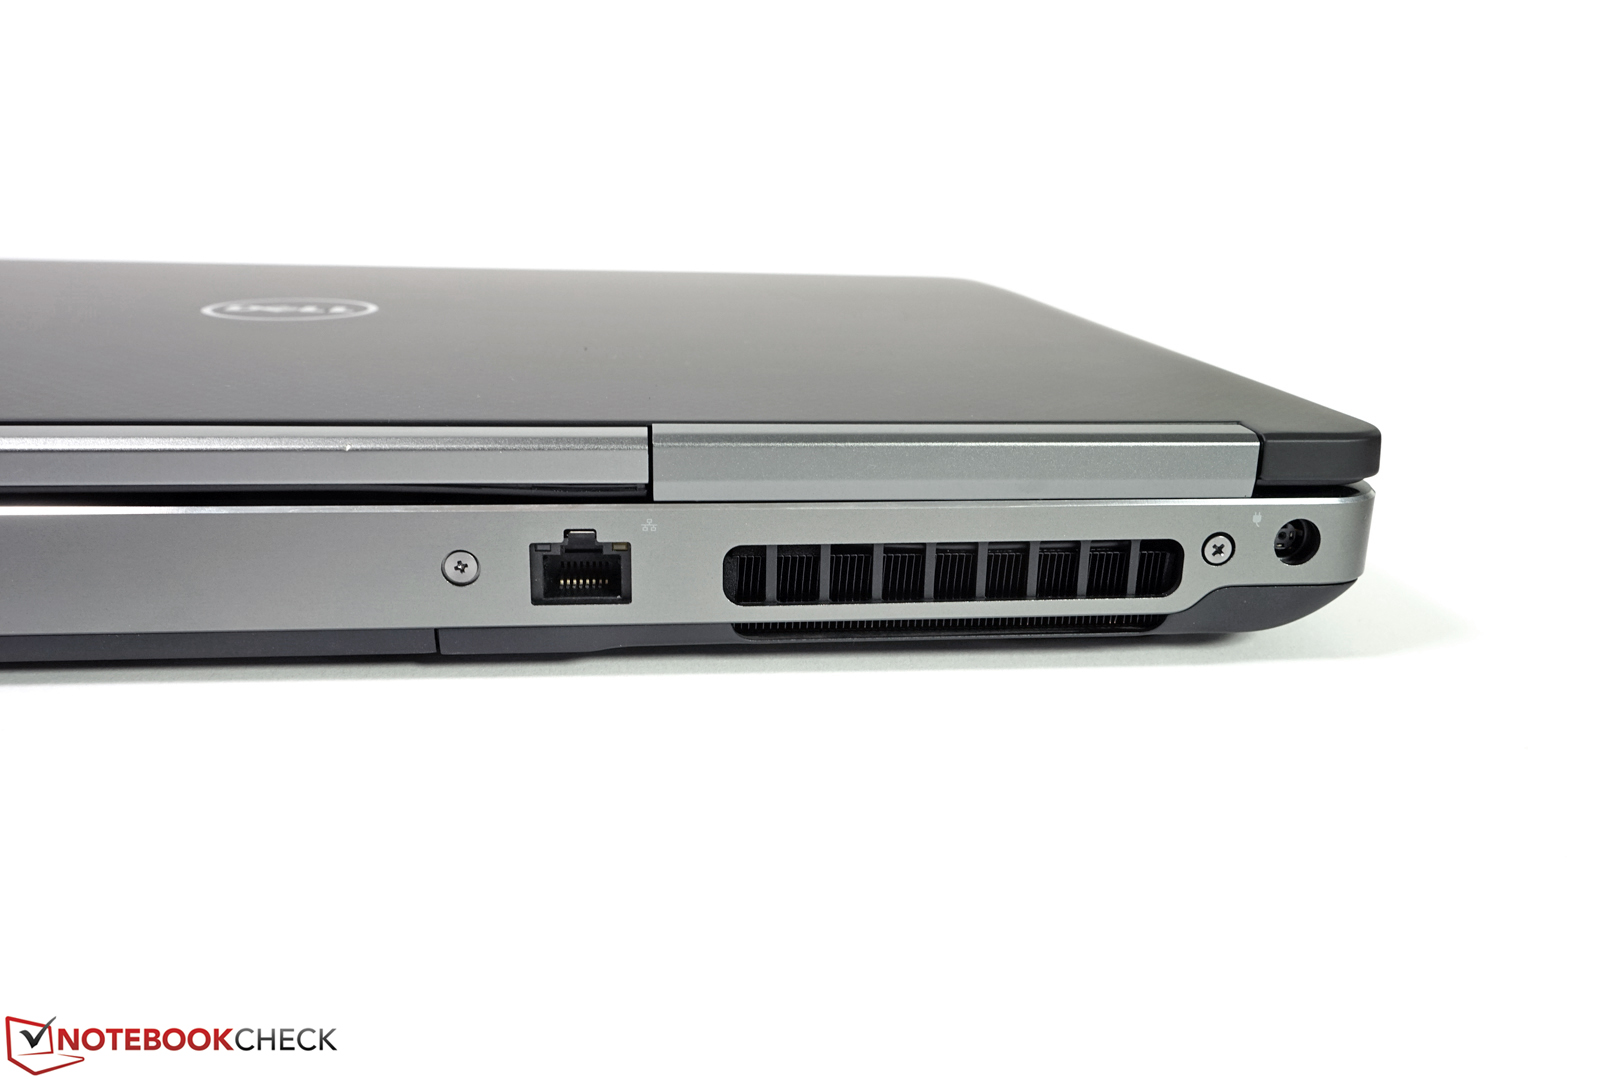
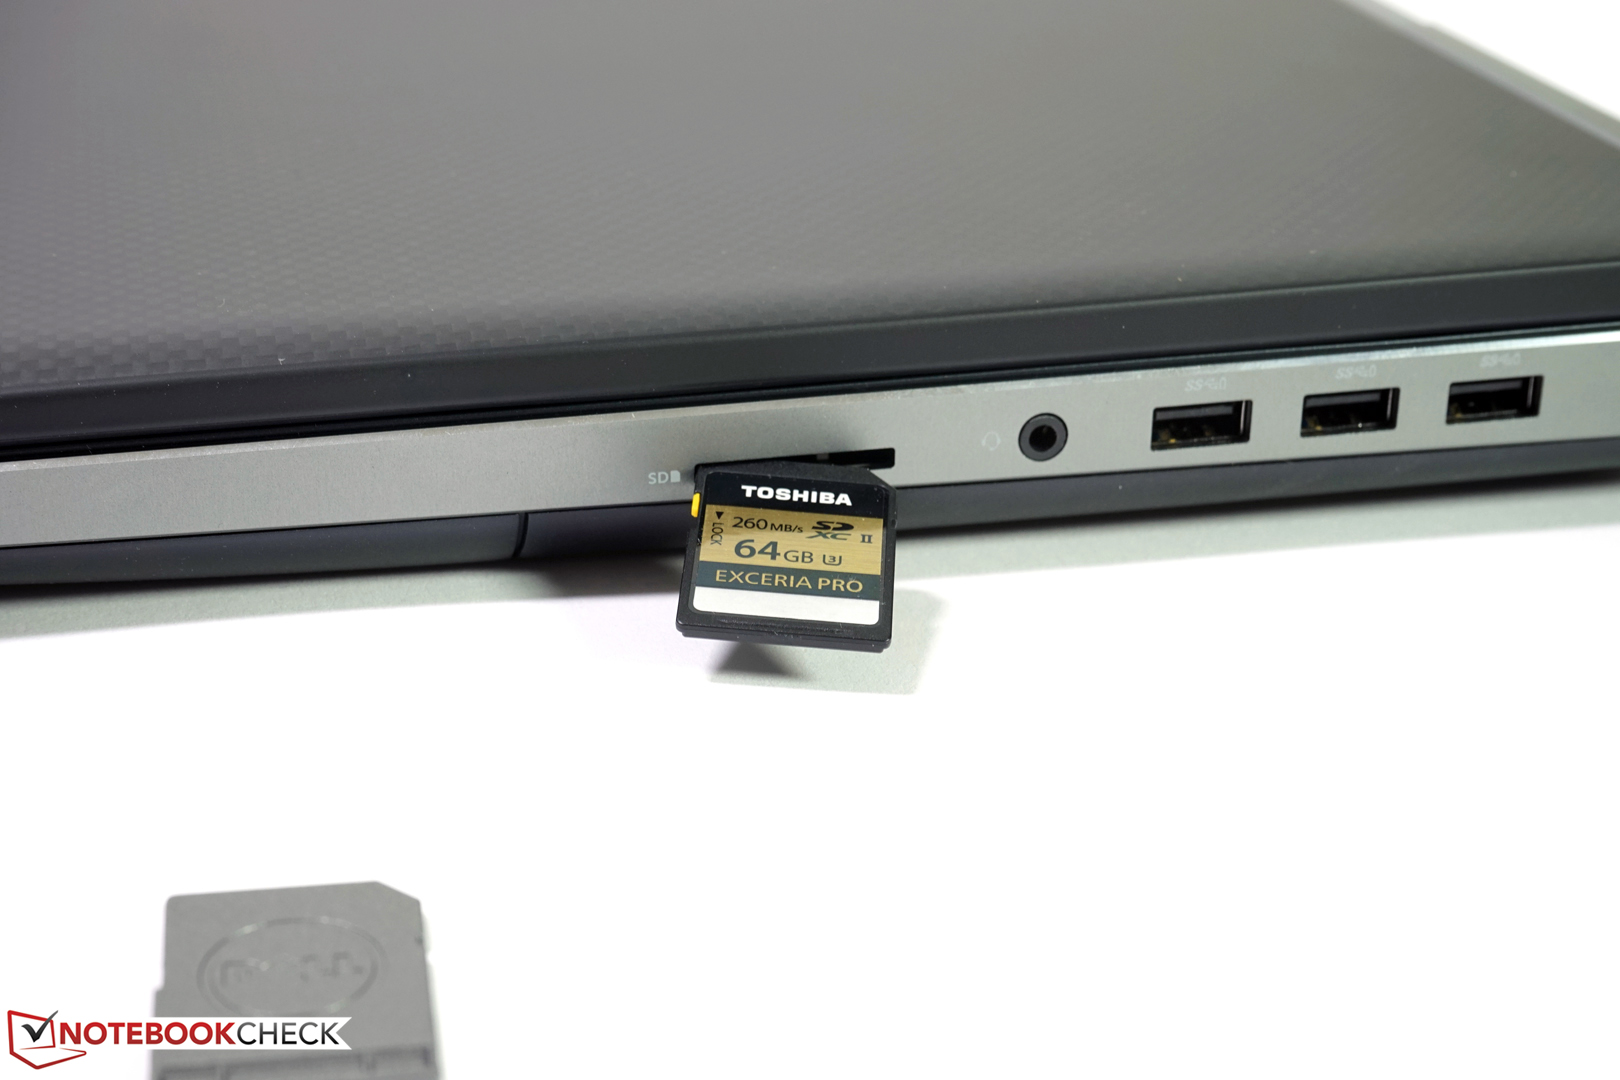
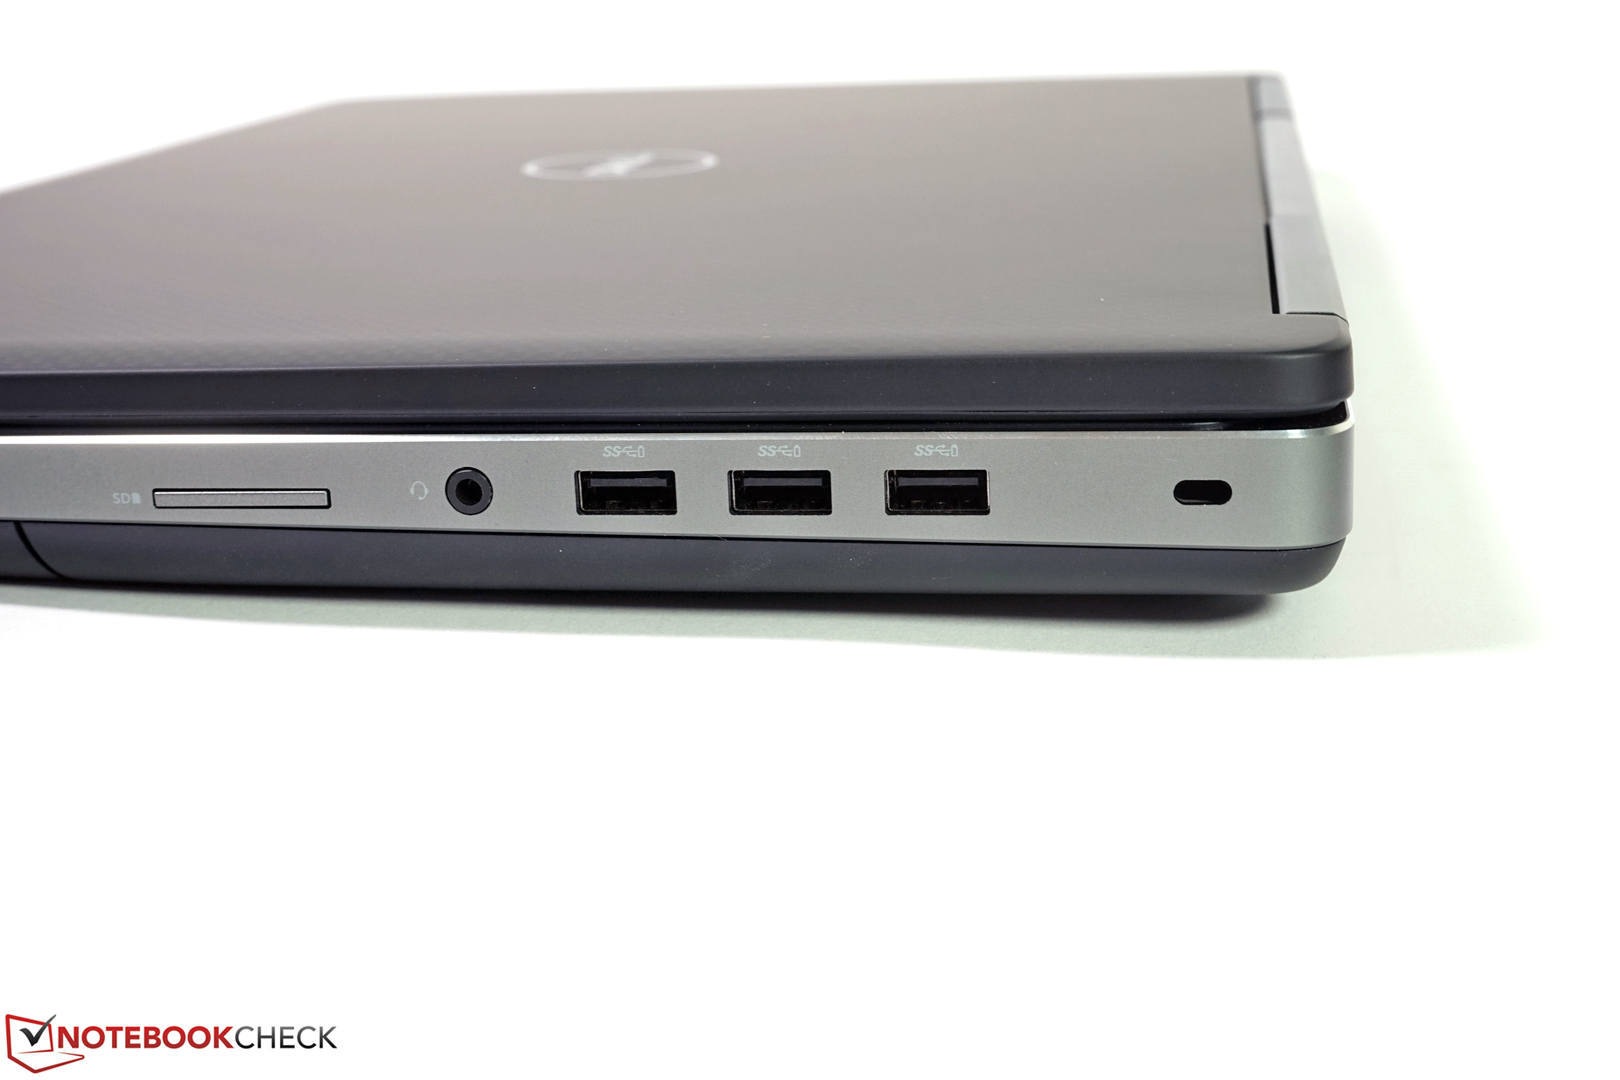
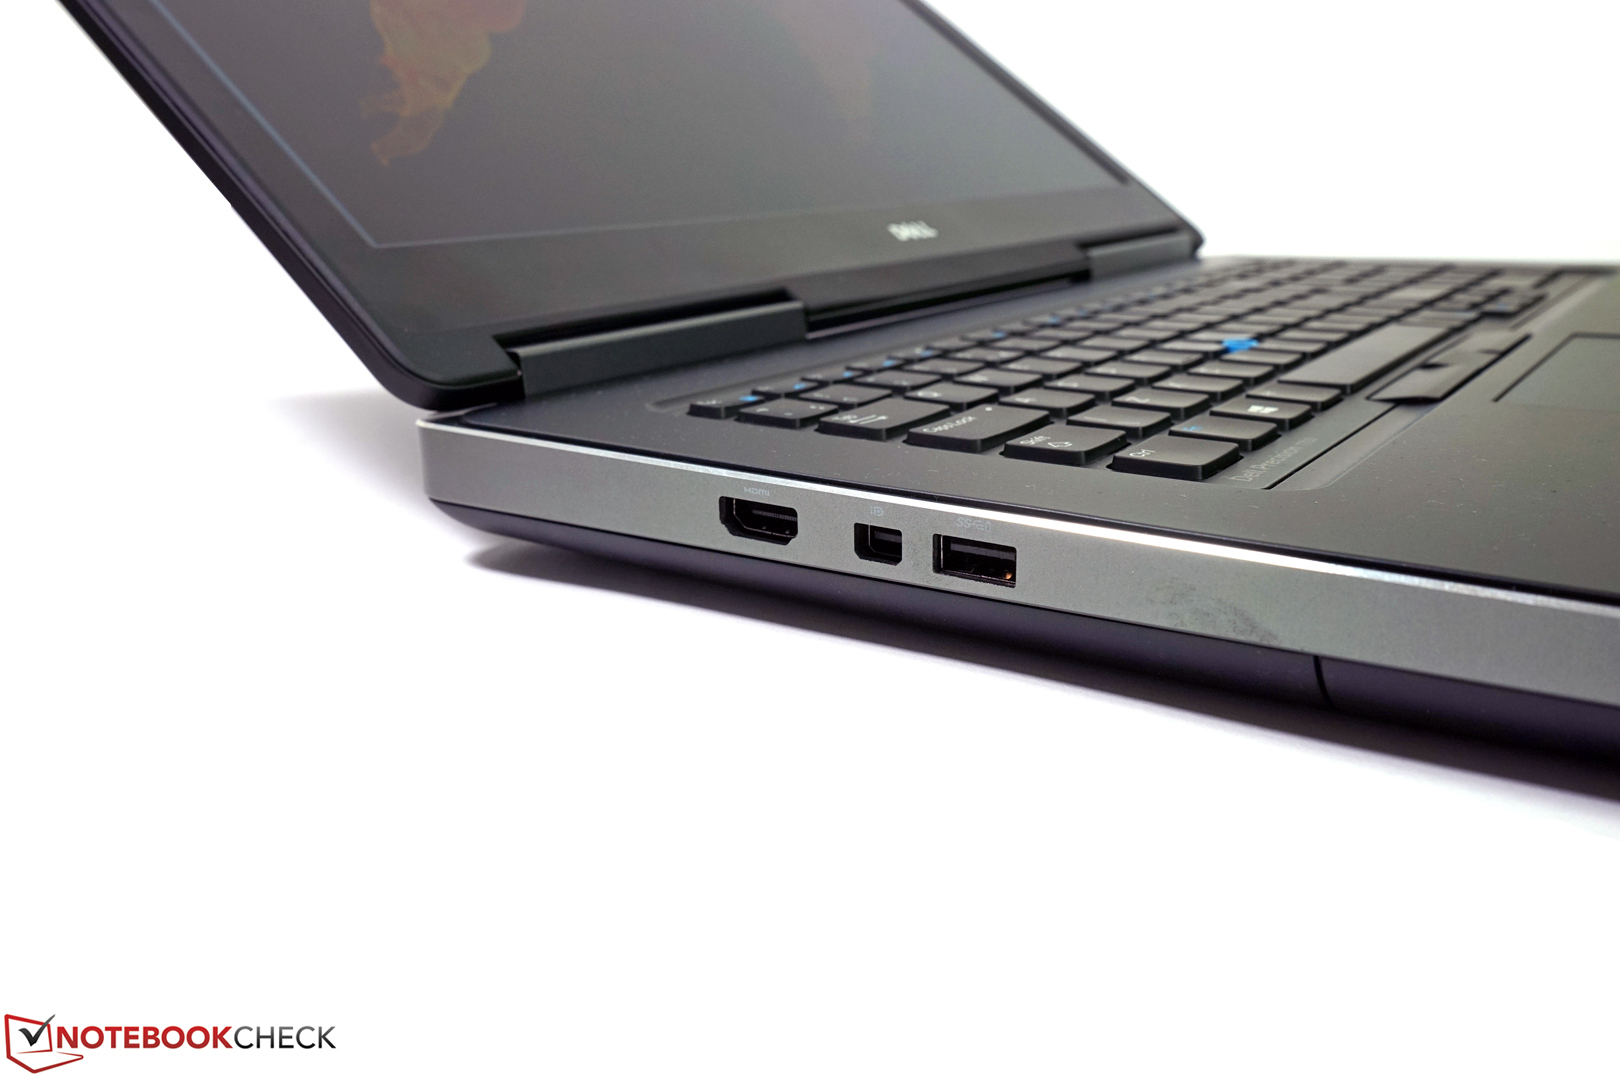
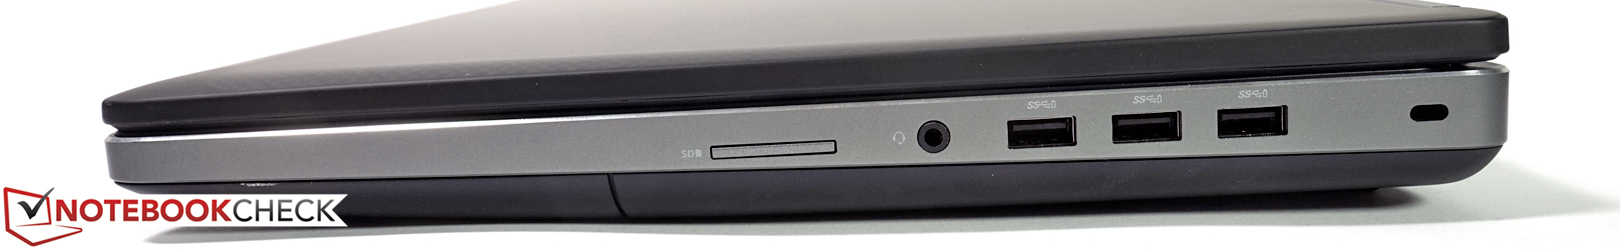
和我们所熟悉的一样,戴尔提供了许多配置型号,质保选项以及扩展服务。不过,我们对它的可连接性并不完全满意,一台得到全面更新的17寸工作站应该可以做得更好。较老的接口应该取消,而它仍然没有支持最新标准如USB 3.1第二代,Thunderbolt 3.0(仅可选)或者HDMI 2.0。除此之外,你需要接受没有光驱或者第二个2.5寸硬盘槽。而且这台测试机的显卡性能在负载下或使用电池时会显著下降。作为用于繁重运算工作的移动工作站,这有些说不过去。
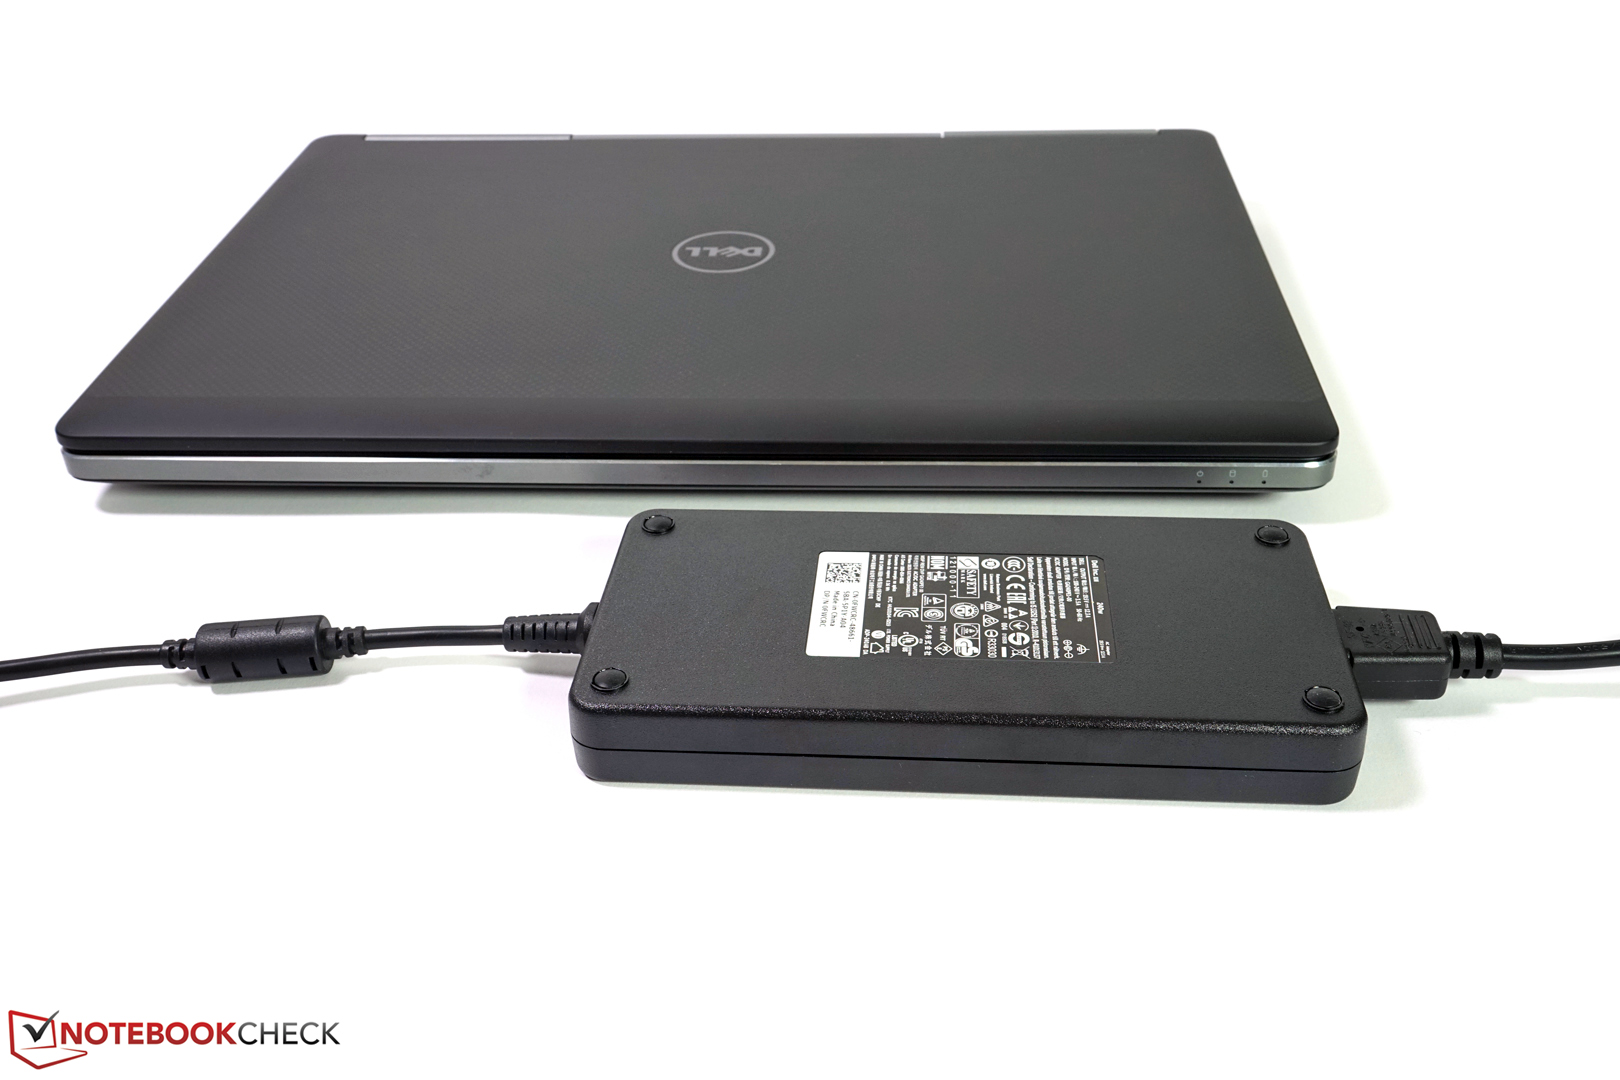
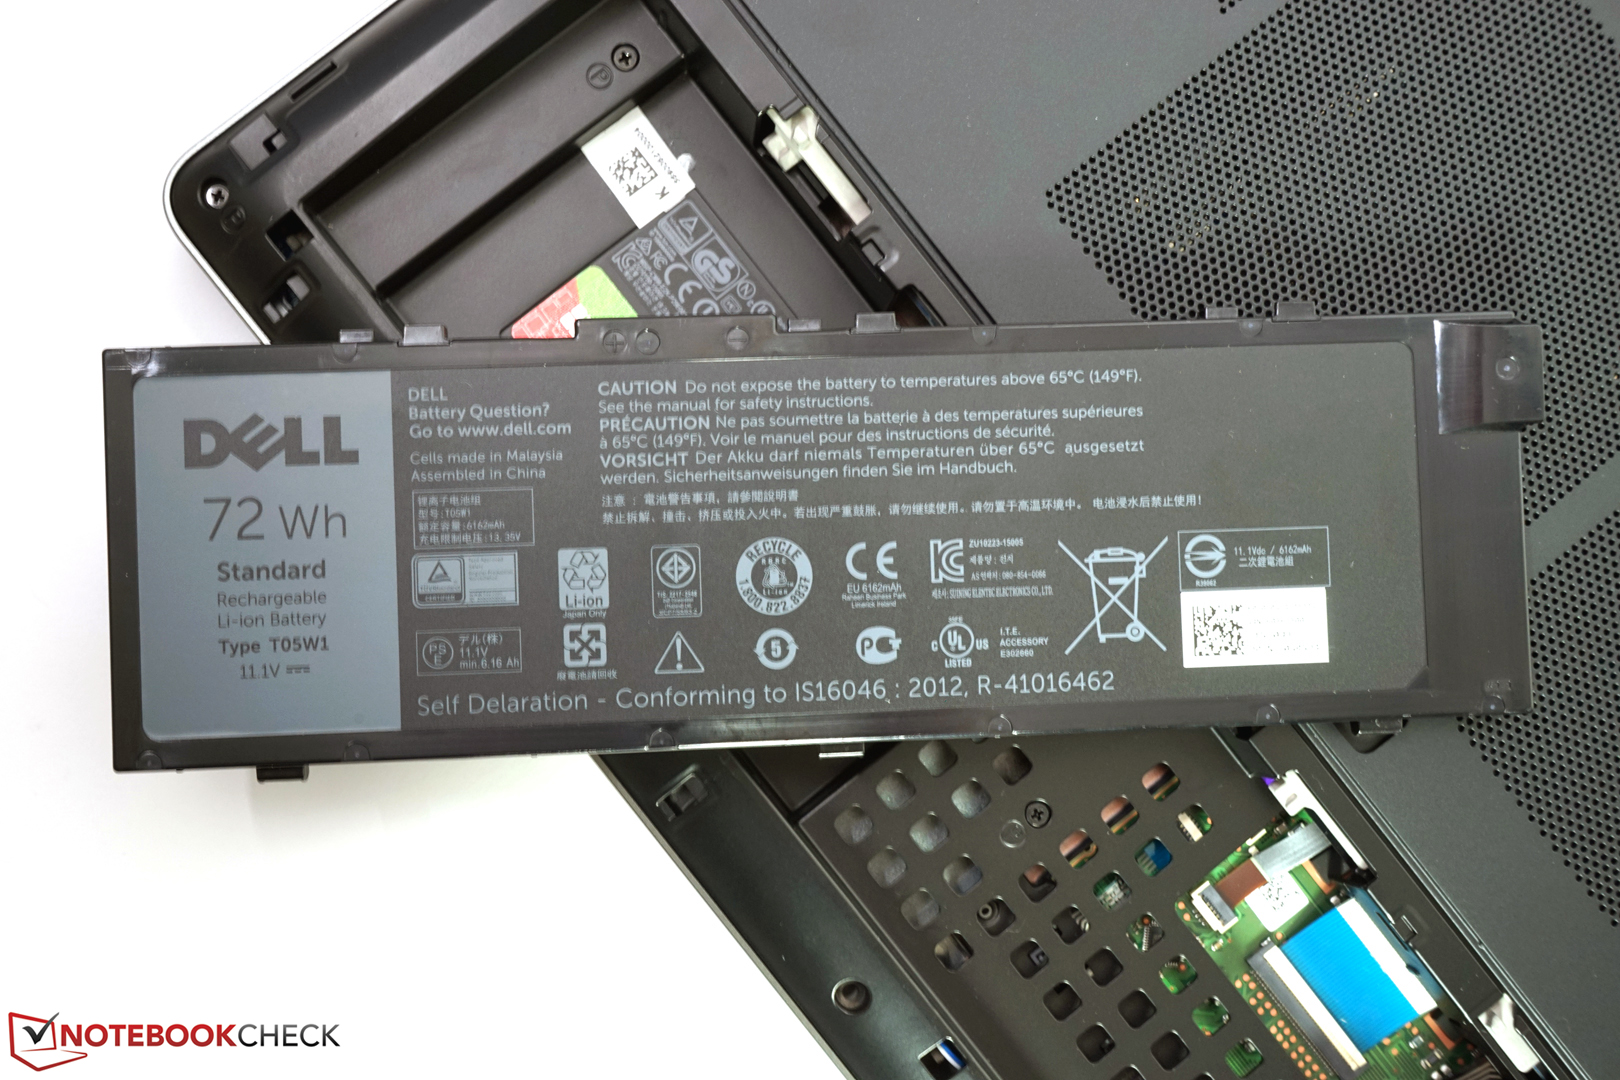
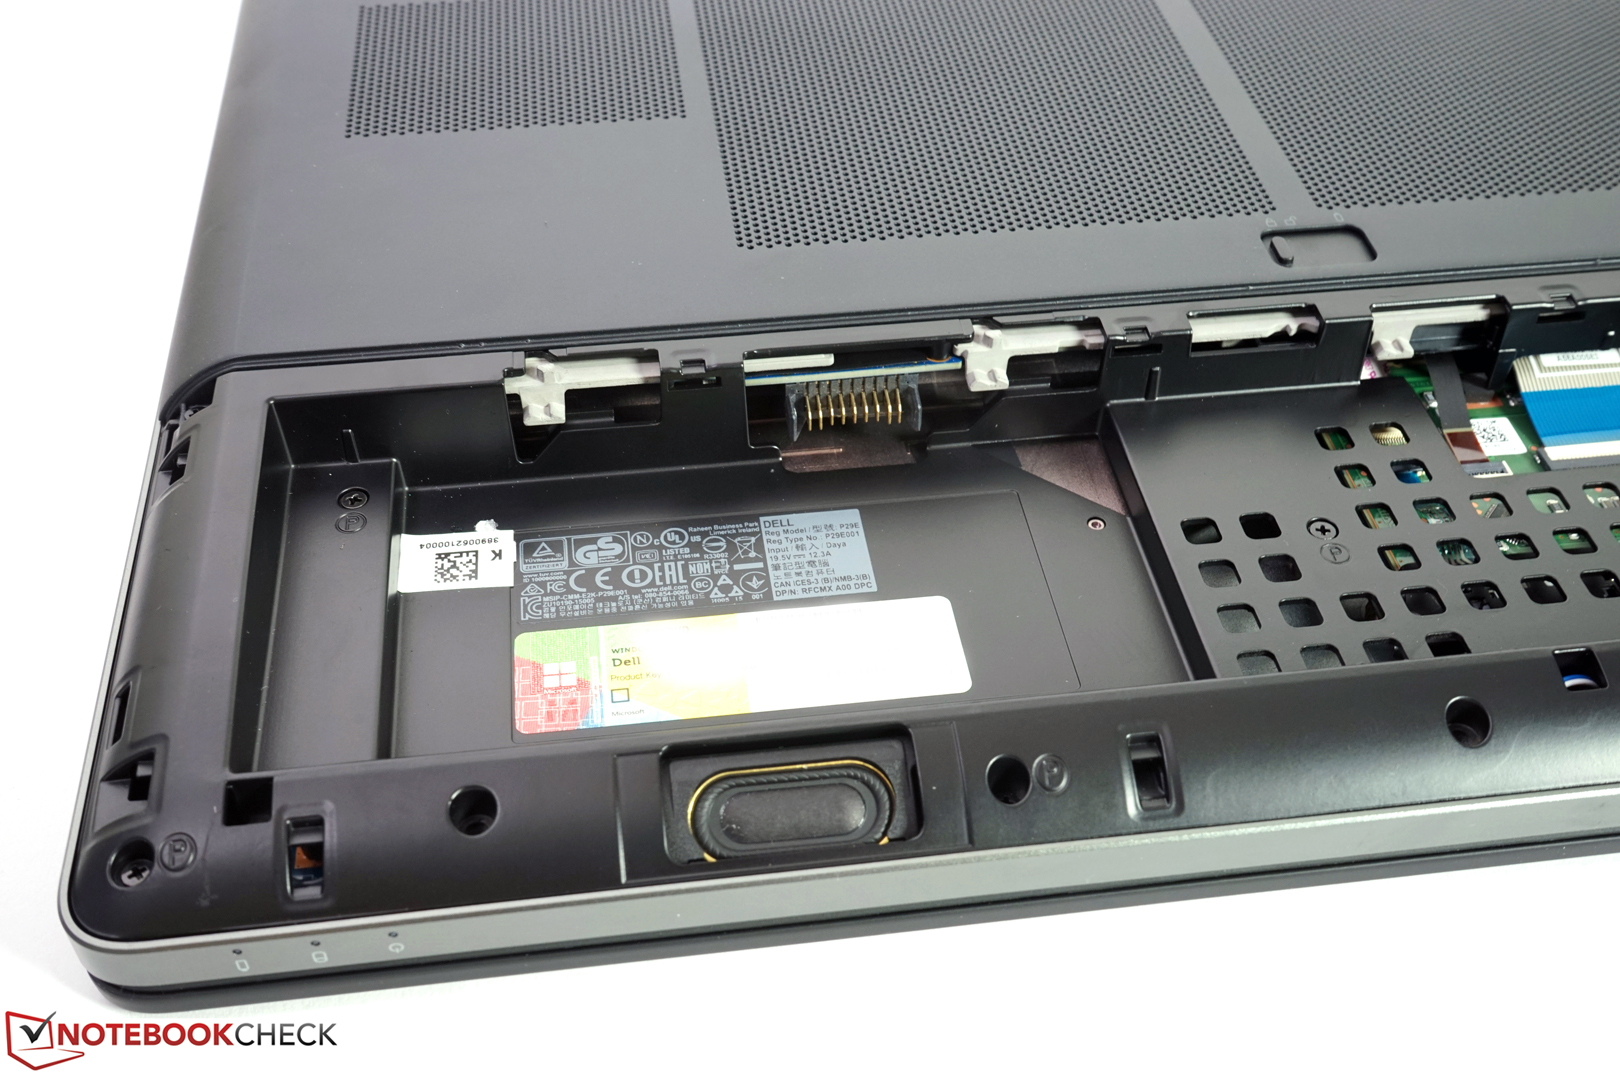
戴尔用低系统噪音以及低发热量稍微弥补了这个缺憾。尽管搭配了容量较小的72瓦时电池,它的续航时间十分出色,可以保证长时间的移动使用。
考虑到各个方面,支付3730欧元(约27372人民币),你可以得到一台优秀的移动工作站。我们的测试机型包括36个月的专业支持以及现场维护支持。不过,它需要用户划出更多的预算。
注:本文是基于完整评测的缩减版本,阅读完整的英文评测,请点击这里。
Dell Precision 7710
-
03/17/2016 v5(old)
Tobias Winkler