 Deutsch
 English
 Español
 Français
 Italiano
 Nederlands
 Polski
 Português
 Русский
 Türkçe
 Svenska
 Chinese
 Magyar
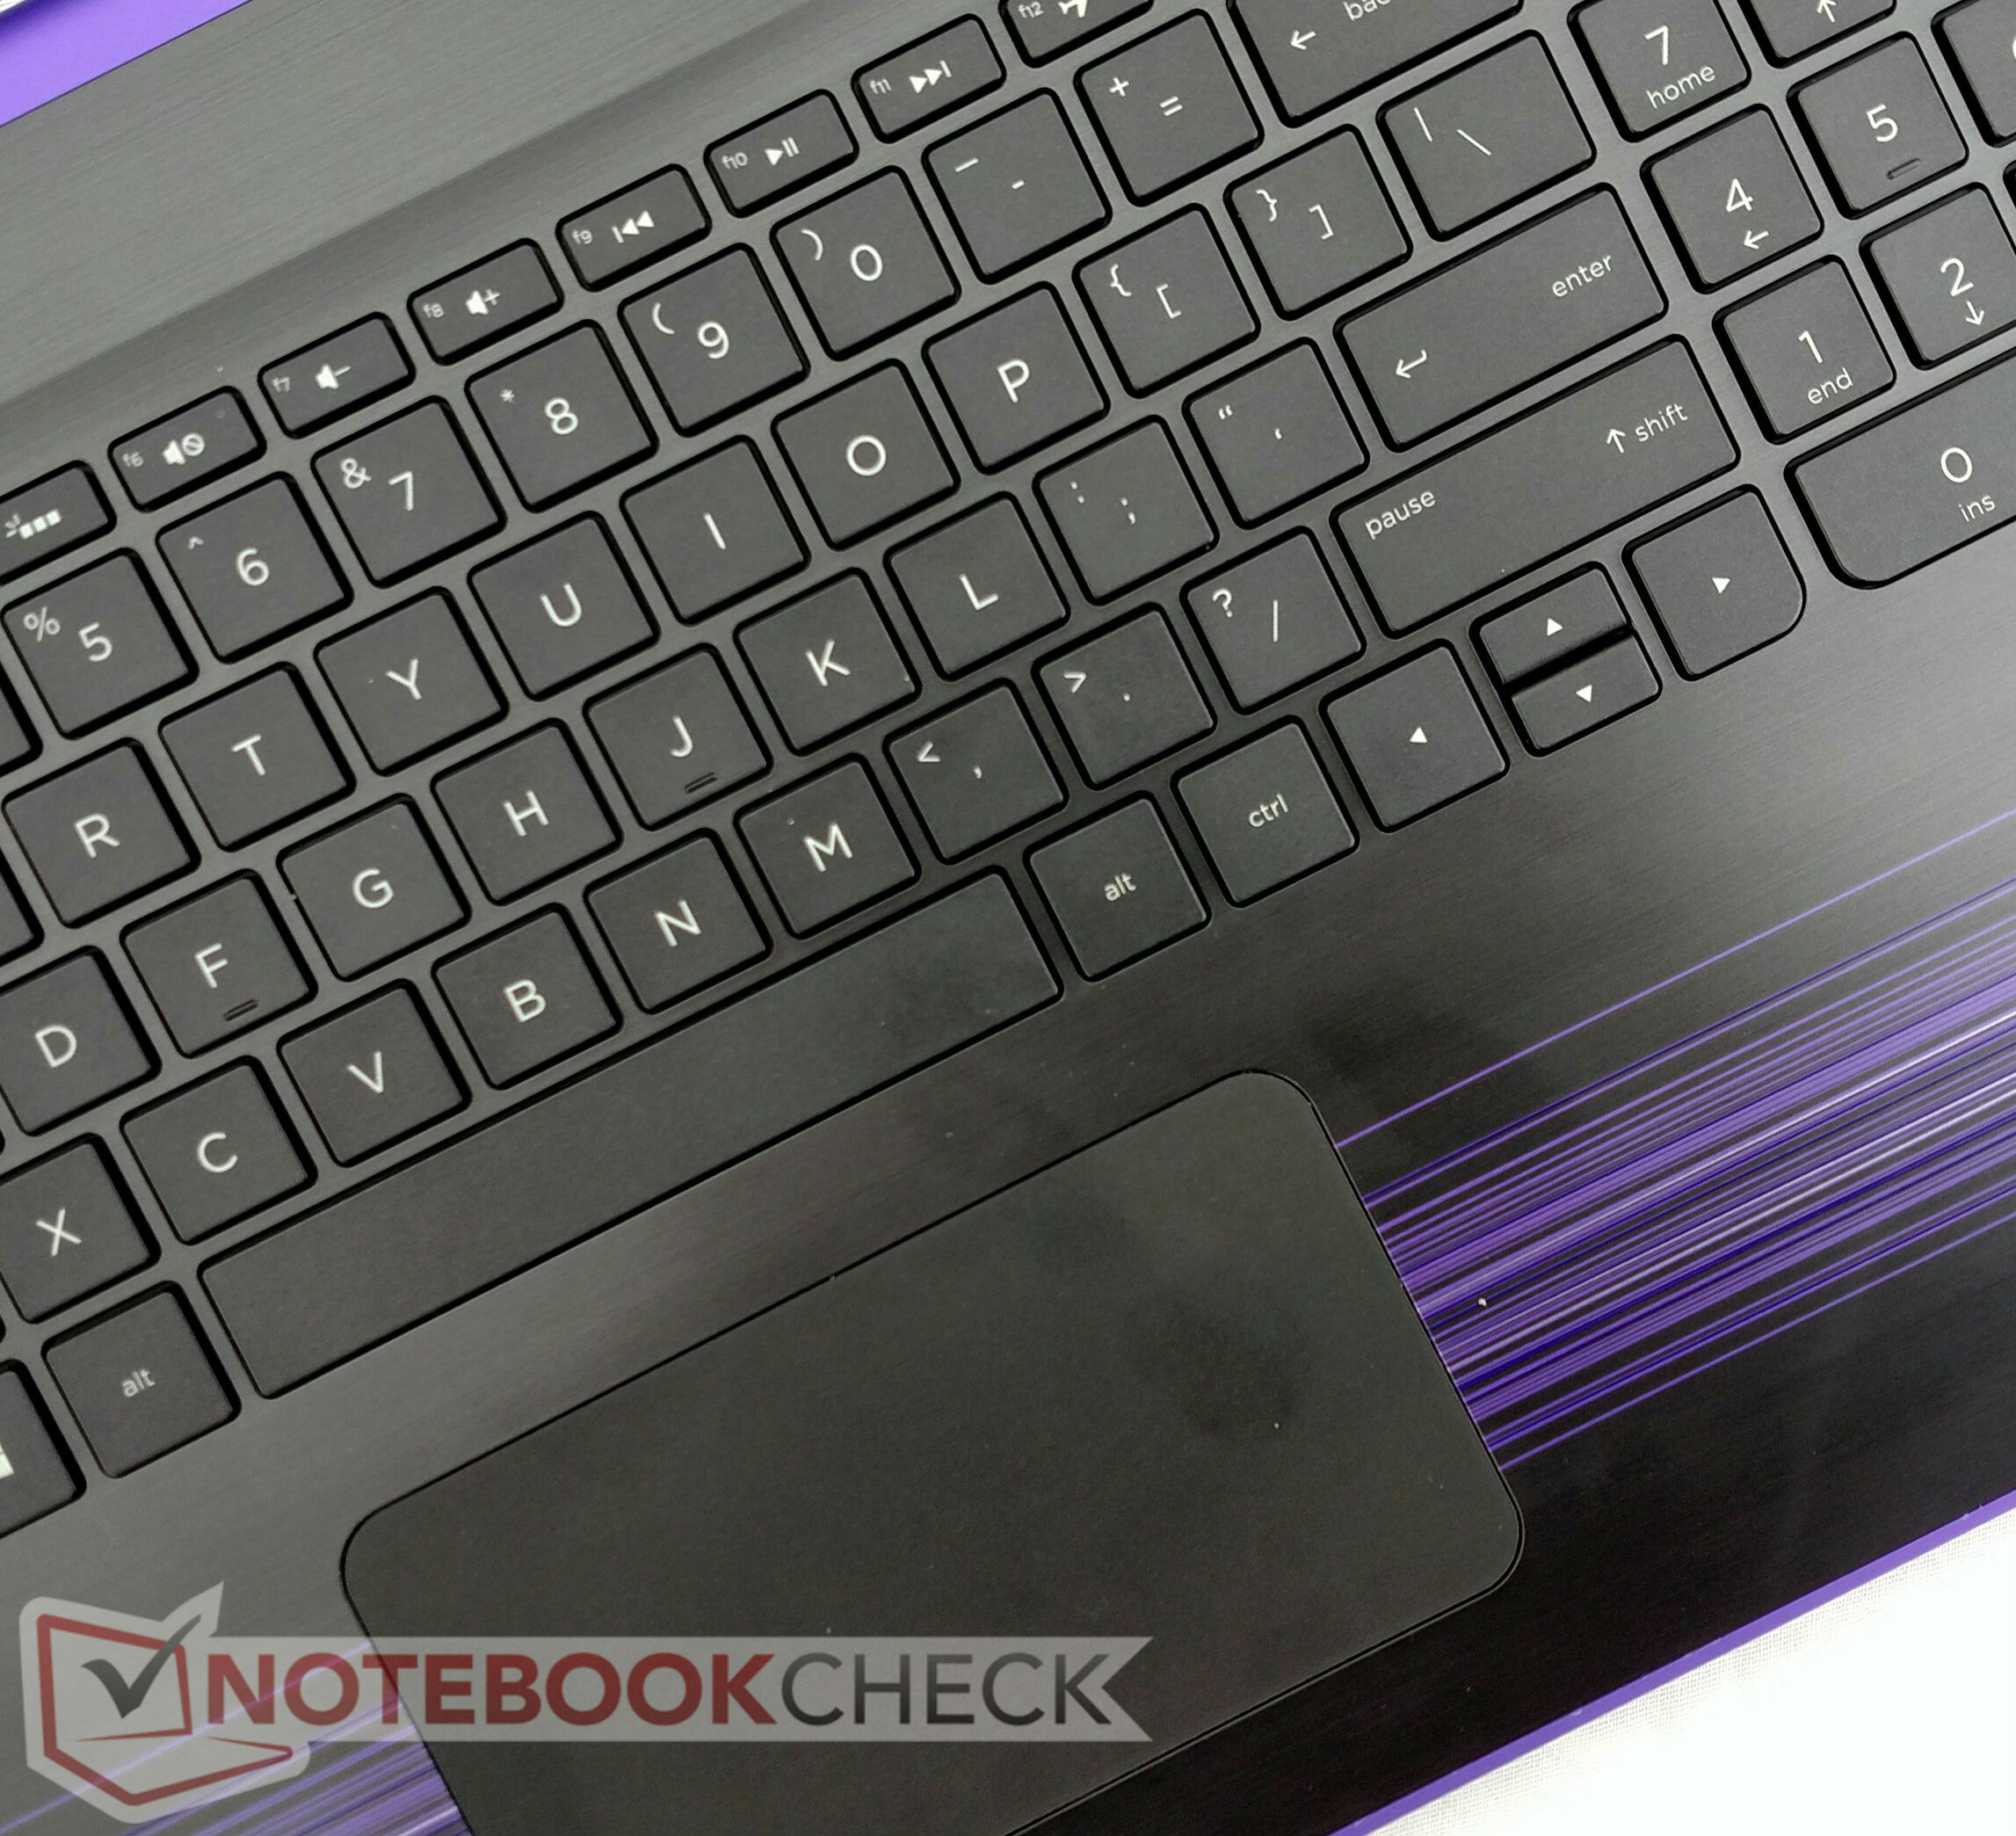
惠普 Pavilion x360 15t X3W72AV 变形本简短评测

| SD Card Reader | |
| average JPG Copy Test (av. of 3 runs) | |
| HP Pavilion 15-bk001ng x360 | |
| Lenovo Yoga 510-15IKB 80VC000XGE | |
| HP Pavilion x360 15t X3W72AV | |
| Lenovo Yoga 710-14IKB 80V4002HGE | |
| Dell Inspiron 15 5568 | |
| maximum AS SSD Seq Read Test (1GB) | |
| HP Pavilion x360 15t X3W72AV | |
| Lenovo Yoga 510-15IKB 80VC000XGE | |
| HP Pavilion 15-bk001ng x360 | |
| Lenovo Yoga 710-14IKB 80V4002HGE | |
| Dell Inspiron 15 5568 | |
| Networking | |
| iperf3 transmit AX12 | |
| Dell XPS 13 9360 FHD i5 | |
| HP Pavilion x360 15t X3W72AV | |
| HP ProBook 455 T1B79UT | |
| iperf3 receive AX12 | |
| Dell XPS 13 9360 FHD i5 | |
| HP Pavilion x360 15t X3W72AV | |
| HP ProBook 455 T1B79UT | |
| |||||||||||||||||||||||||
Brightness Distribution: 84 %
Contrast: 641:1 (Black: 0.36 cd/m²)
ΔE Color 4.58 | 0.5-29.43 Ø5
ΔE Greyscale 2.94 | 0.57-98 Ø5.3
64% sRGB (Argyll 1.6.3 3D)
41% AdobeRGB 1998 (Argyll 1.6.3 3D)
44.3% AdobeRGB 1998 (Argyll 2.2.0 3D)
63.8% sRGB (Argyll 2.2.0 3D)
42.8% Display P3 (Argyll 2.2.0 3D)
Gamma: 2.18
| HP Pavilion x360 15t X3W72AV Chi Mei CHMN15D3, IPS, 15.60, 1920x1080 | HP Pavilion 15-bk001ng x360 Chi Mey CHMN15D3, IPS, 15.60, 1920x1080 | Lenovo Yoga 510-15IKB 80VC000XGE BOE HF NV156FHM-N42, IPS, 15.60, 1920x1080 | Lenovo Yoga 710-14IKB 80V4002HGE AU Optronics B140HAN03.0, a-Si WLED TFT, IPS, 14.00, 1920x1080 | Dell Inspiron 15 5568 AU Optronics B156HW01 V0, IPS, 15.60, 1920x1080 | |
|---|---|---|---|---|---|
| Display | -2% | -2% | 43% | -11% | |
| Display P3 Coverage | 42.8 | 41.84 -2% | 41.92 -2% | 62 45% | 38.04 -11% |
| sRGB Coverage | 63.8 | 62.7 -2% | 62.9 -1% | 89.5 40% | 57.1 -11% |
| AdobeRGB 1998 Coverage | 44.3 | 43.25 -2% | 43.32 -2% | 63.3 43% | 39.3 -11% |
| Response Times | 11% | -39% | -47% | 2% | |
| Response Time Grey 50% / Grey 80% * | 36.8 ? | 30.8 ? 16% | 53 ? -44% | 53 ? -44% | 42 ? -14% |
| Response Time Black / White * | 26.8 ? | 22 ? 18% | 26 ? 3% | 33 ? -23% | 22 ? 18% |
| PWM Frequency | 201.6 ? | 200 ? -1% | 50 ? -75% | 50 ? -75% | |
| Screen | 13% | 20% | 0% | 9% | |
| Brightness middle | 230.8 | 225 -3% | 236 2% | 340 47% | 266 15% |
| Brightness | 211 | 210 0% | 212 0% | 302 43% | 249 18% |
| Brightness Distribution | 84 | 85 1% | 78 -7% | 77 -8% | 85 1% |
| Black Level * | 0.36 | 0.22 39% | 0.18 50% | 0.31 14% | 0.26 28% |
| Contrast | 641 | 1023 60% | 1311 105% | 1097 71% | 1023 60% |
| Colorchecker dE 2000 * | 4.58 | 4.13 10% | 3.92 14% | 6.75 -47% | 4.98 -9% |
| Colorchecker dE 2000 max. * | 11.23 | 9.36 17% | 9.2 18% | 12.4 -10% | 11.82 -5% |
| Greyscale dE 2000 * | 2.94 | 2.53 14% | 2.35 20% | 8.47 -188% | 2.68 9% |
| Gamma | 2.18 101% | 2.6 85% | 2.34 94% | 2.22 99% | 2.27 97% |
| CCT | 6233 104% | 6360 102% | 6161 106% | 6557 99% | 6583 99% |
| Color Space (Percent of AdobeRGB 1998) | 41 | 39.8 -3% | 40 -2% | 58 41% | 36 -12% |
| Color Space (Percent of sRGB) | 64 | 62.5 -2% | 63 -2% | 89 39% | 57 -11% |
| Total Average (Program / Settings) | 7% /
10% | -7% /
5% | -1% /
-1% | 0% /
4% |
* ... smaller is better
Display Response Times
| ↔ Response Time Black to White | ||
|---|---|---|
| 26.8 ms ... rise ↗ and fall ↘ combined | ↗ 6 ms rise | 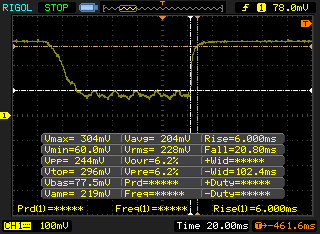 |
| ↘ 20.8 ms fall | ||
| The screen shows relatively slow response rates in our tests and may be too slow for gamers. In comparison, all tested devices range from 0.1 (minimum) to 240 (maximum) ms. » 62 % of all devices are better. This means that the measured response time is worse than the average of all tested devices (21.5 ms). | ||
| ↔ Response Time 50% Grey to 80% Grey | ||
| 36.8 ms ... rise ↗ and fall ↘ combined | ↗ 13.2 ms rise | 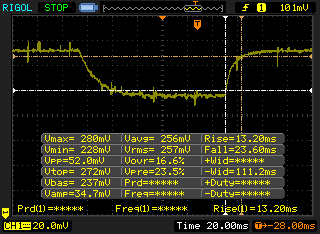 |
| ↘ 23.6 ms fall | ||
| The screen shows slow response rates in our tests and will be unsatisfactory for gamers. In comparison, all tested devices range from 0.2 (minimum) to 636 (maximum) ms. » 47 % of all devices are better. This means that the measured response time is similar to the average of all tested devices (33.7 ms). | ||
Screen Flickering / PWM (Pulse-Width Modulation)
| Screen flickering / PWM detected | 201.6 Hz | ≤ 99 % brightness setting | 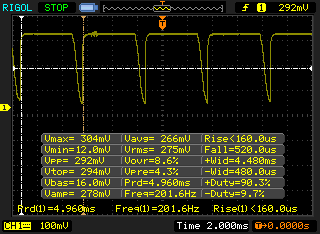 |
The display backlight flickers at 201.6 Hz (worst case, e.g., utilizing PWM) Flickering detected at a brightness setting of 99 % and below. There should be no flickering or PWM above this brightness setting. The frequency of 201.6 Hz is relatively low, so sensitive users will likely notice flickering and experience eyestrain at the stated brightness setting and below. In comparison: 53 % of all tested devices do not use PWM to dim the display. If PWM was detected, an average of 17900 (minimum: 5 - maximum: 3846000) Hz was measured. | |||
| Cinebench R10 | |
| Rendering Multiple CPUs 32Bit | |
| Lenovo Yoga 510-15IKB 80VC000XGE | |
| HP Pavilion x360 15t X3W72AV | |
| HP Pavilion 15-bk001ng x360 | |
| Rendering Single 32Bit | |
| Lenovo Yoga 510-15IKB 80VC000XGE | |
| HP Pavilion x360 15t X3W72AV | |
| HP Pavilion 15-bk001ng x360 | |
| Cinebench R11.5 | |
| CPU Single 64Bit | |
| HP Pavilion x360 15t X3W72AV | |
| HP Pavilion 15-bk001ng x360 | |
| CPU Multi 64Bit | |
| HP Pavilion x360 15t X3W72AV | |
| HP Pavilion 15-bk001ng x360 | |
| wPrime 2.10 - 1024m | |
| HP Pavilion x360 15t X3W72AV | |
| Super Pi Mod 1.5 XS 32M - 32M | |
| HP Pavilion x360 15t X3W72AV | |
* ... smaller is better
| PCMark 8 | |
| Home Score Accelerated v2 | |
| Lenovo Yoga 510-15IKB 80VC000XGE | |
| Dell Inspiron 15 5568 | |
| Lenovo Yoga 710-14IKB 80V4002HGE | |
| HP Pavilion x360 15t X3W72AV | |
| HP Pavilion 15-bk001ng x360 | |
| Work Score Accelerated v2 | |
| Dell Inspiron 15 5568 | |
| HP Pavilion x360 15t X3W72AV | |
| Creative Score Accelerated v2 | |
| Lenovo Yoga 710-14IKB 80V4002HGE | |
| HP Pavilion x360 15t X3W72AV | |
| PCMark 7 Score | 2897 points | |
| PCMark 8 Home Score Accelerated v2 | 3258 points | |
| PCMark 8 Creative Score Accelerated v2 | 3828 points | |
| PCMark 8 Work Score Accelerated v2 | 4130 points | |
Help | ||
| HP Pavilion x360 15t X3W72AV | HP Pavilion 15-bk001ng x360 WDC Slim WD10SPCX-21KHST0 | Lenovo Yoga 510-15IKB 80VC000XGE Samsung MZYTY256HDHP | Lenovo Yoga 710-14IKB 80V4002HGE Samsung MZYTY256HDHP | Dell Inspiron 15 5568 Toshiba THNSNK256GCS8 | |
|---|---|---|---|---|---|
| CrystalDiskMark 3.0 | -12% | 8296% | 6987% | 6240% | |
| Read Seq | 104.5 | 106.9 2% | 529 406% | 490.5 369% | 458.6 339% |
| Write Seq | 110.1 | 106 -4% | 508 361% | 452.3 311% | 270 145% |
| Read 512 | 41.38 | 33.01 -20% | 409.8 890% | 386.2 833% | 397.4 860% |
| Write 512 | 61.5 | 51.2 -17% | 316.5 415% | 219.9 258% | 242 293% |
| Read 4k | 0.5 | 0.373 -25% | 36.01 7102% | 34.35 6770% | 19.88 3876% |
| Write 4k | 1.09 | 1.097 1% | 106.7 9689% | 91.2 8267% | 86.7 7854% |
| Read 4k QD32 | 1.52 | 1.029 -32% | 384.8 25216% | 378.9 24828% | 275.3 18012% |
| Write 4k QD32 | 1.06 | 1.055 0% | 237.3 22287% | 152.2 14258% | 197.6 18542% |

| 3DMark | |
| 1280x720 Cloud Gate Standard Graphics | |
| Dell Inspiron 15 5568 | |
| Lenovo Yoga 710-14IKB 80V4002HGE | |
| HP Pavilion x360 15t X3W72AV | |
| HP Pavilion 15-bk001ng x360 | |
| 1920x1080 Fire Strike Graphics | |
| Lenovo Yoga 710-14IKB 80V4002HGE | |
| HP Pavilion x360 15t X3W72AV | |
| HP Pavilion 15-bk001ng x360 | |
| 1920x1080 Ice Storm Extreme Graphics | |
| Lenovo Yoga 710-14IKB 80V4002HGE | |
| HP Pavilion x360 15t X3W72AV | |
| 3DMark Ice Storm Standard Score | 44091 points | |
| 3DMark Cloud Gate Standard Score | 5040 points | |
| 3DMark Fire Strike Score | 616 points | |
Help | ||
Noise Level
| Idle |
| 31 / 31.1 / 31.1 dB(A) |
| Load |
| 38.5 / 44 dB(A) |
 | ||
30 dB silent 40 dB(A) audible 50 dB(A) loud |
||
min: | ||
| HP Pavilion x360 15t X3W72AV HD Graphics 620, i5-7200U | HP Pavilion 15-bk001ng x360 HD Graphics 520, 6200U, WDC Slim WD10SPCX-21KHST0 | Lenovo Yoga 510-15IKB 80VC000XGE Radeon R7 M460, i5-7200U, Samsung MZYTY256HDHP | Lenovo Yoga 710-14IKB 80V4002HGE HD Graphics 620, i5-7200U, Samsung MZYTY256HDHP | Dell Inspiron 15 5568 HD Graphics 520, 6500U, Toshiba THNSNK256GCS8 | |
|---|---|---|---|---|---|
| Noise | 4% | 3% | 4% | -0% | |
| off / environment * | 29.8 | 28.9 3% | 30.15 -1% | 30.16 -1% | 31.2 -5% |
| Idle Minimum * | 31 | 29.6 5% | 30.2 3% | 30.16 3% | 32.8 -6% |
| Idle Average * | 31.1 | 29.6 5% | 30.2 3% | 30.16 3% | 32.8 -5% |
| Idle Maximum * | 31.1 | 30.2 3% | 31 -0% | 30.5 2% | 33.8 -9% |
| Load Average * | 38.5 | 39 -1% | 38 1% | 37.2 3% | 36.3 6% |
| Load Maximum * | 44 | 39.9 9% | 38.6 12% | 37 16% | 36.3 17% |
* ... smaller is better
(+) The maximum temperature on the upper side is 33.2 °C / 92 F, compared to the average of 36.9 °C / 98 F, ranging from 21.1 to 71 °C for the class Multimedia.
(+) The bottom heats up to a maximum of 39 °C / 102 F, compared to the average of 39.1 °C / 102 F
(+) In idle usage, the average temperature for the upper side is 24.3 °C / 76 F, compared to the device average of 31.2 °C / 88 F.
(+) The palmrests and touchpad are cooler than skin temperature with a maximum of 25.6 °C / 78.1 F and are therefore cool to the touch.
(+) The average temperature of the palmrest area of similar devices was 28.8 °C / 83.8 F (+3.2 °C / 5.7 F).
HP Pavilion x360 15t X3W72AV audio analysis
(-) | not very loud speakers (71.4 dB)
Bass 100 - 315 Hz
(±) | reduced bass - on average 14.3% lower than median
(-) | bass is not linear (15.6% delta to prev. frequency)
Mids 400 - 2000 Hz
(+) | balanced mids - only 3.7% away from median
(±) | linearity of mids is average (9.9% delta to prev. frequency)
Highs 2 - 16 kHz
(+) | balanced highs - only 3.9% away from median
(+) | highs are linear (6% delta to prev. frequency)
Overall 100 - 16.000 Hz
(±) | linearity of overall sound is average (24% difference to median)
Compared to same class
» 83% of all tested devices in this class were better, 6% similar, 11% worse
» The best had a delta of 5%, average was 18%, worst was 45%
Compared to all devices tested
» 68% of all tested devices were better, 7% similar, 25% worse
» The best had a delta of 4%, average was 25%, worst was 134%
Lenovo Yoga 510-15IKB 80VC000XGE audio analysis
(±) | speaker loudness is average but good (72 dB)
Bass 100 - 315 Hz
(-) | nearly no bass - on average 25.5% lower than median
(±) | linearity of bass is average (11.2% delta to prev. frequency)
Mids 400 - 2000 Hz
(+) | balanced mids - only 2% away from median
(±) | linearity of mids is average (7.5% delta to prev. frequency)
Highs 2 - 16 kHz
(+) | balanced highs - only 0.7% away from median
(+) | highs are linear (2.3% delta to prev. frequency)
Overall 100 - 16.000 Hz
(±) | linearity of overall sound is average (19.5% difference to median)
Compared to same class
» 59% of all tested devices in this class were better, 8% similar, 33% worse
» The best had a delta of 5%, average was 18%, worst was 45%
Compared to all devices tested
» 43% of all tested devices were better, 7% similar, 50% worse
» The best had a delta of 4%, average was 25%, worst was 134%
| Off / Standby | |
| Idle | |
| Load |
|
| HP Pavilion x360 15t X3W72AV i5-7200U, HD Graphics 620, , IPS, 1920x1080, 15.60 | HP Pavilion 15-bk001ng x360 6200U, HD Graphics 520, WDC Slim WD10SPCX-21KHST0, IPS, 1920x1080, 15.60 | Lenovo Yoga 510-15IKB 80VC000XGE i5-7200U, Radeon R7 M460, Samsung MZYTY256HDHP, IPS, 1920x1080, 15.60 | Lenovo Yoga 710-14IKB 80V4002HGE i5-7200U, HD Graphics 620, Samsung MZYTY256HDHP, a-Si WLED TFT, IPS, 1920x1080, 14.00 | Dell Inspiron 15 5568 6500U, HD Graphics 520, Toshiba THNSNK256GCS8, IPS, 1920x1080, 15.60 | |
|---|---|---|---|---|---|
| Power Consumption | -2% | -11% | 7% | 2% | |
| Idle Minimum * | 5.3 | 4.3 19% | 3.9 26% | 3.7 30% | 4.34 18% |
| Idle Average * | 7.9 | 8.2 -4% | 7.8 1% | 7.16 9% | 7.5 5% |
| Idle Maximum * | 9.7 | 9 7% | 8.4 13% | 8.3 14% | 8.4 13% |
| Load Average * | 25.4 | 29.8 -17% | 37 -46% | 30.4 -20% | 30.4 -20% |
| Load Maximum * | 31.2 | 36.4 -17% | 46 -47% | 30.3 3% | 32.5 -4% |
* ... smaller is better
| HP Pavilion x360 15t X3W72AV i5-7200U, HD Graphics 620, 48 Wh | HP Pavilion 15-bk001ng x360 6200U, HD Graphics 520, 48 Wh | Lenovo Yoga 510-15IKB 80VC000XGE i5-7200U, Radeon R7 M460, 35 Wh | Lenovo Yoga 710-14IKB 80V4002HGE i5-7200U, HD Graphics 620, 53 Wh | Dell Inspiron 15 5568 6500U, HD Graphics 520, 42 Wh | |
|---|---|---|---|---|---|
| Battery Runtime | 10% | -13% | 40% | -20% | |
| Reader / Idle | 646 | 957 48% | 449 -30% | ||
| WiFi v1.3 | 366 | 401 10% | 320 -13% | 561 53% | 299 -18% |
| Load | 105 | 126 20% | 93 -11% |
Pros
Cons

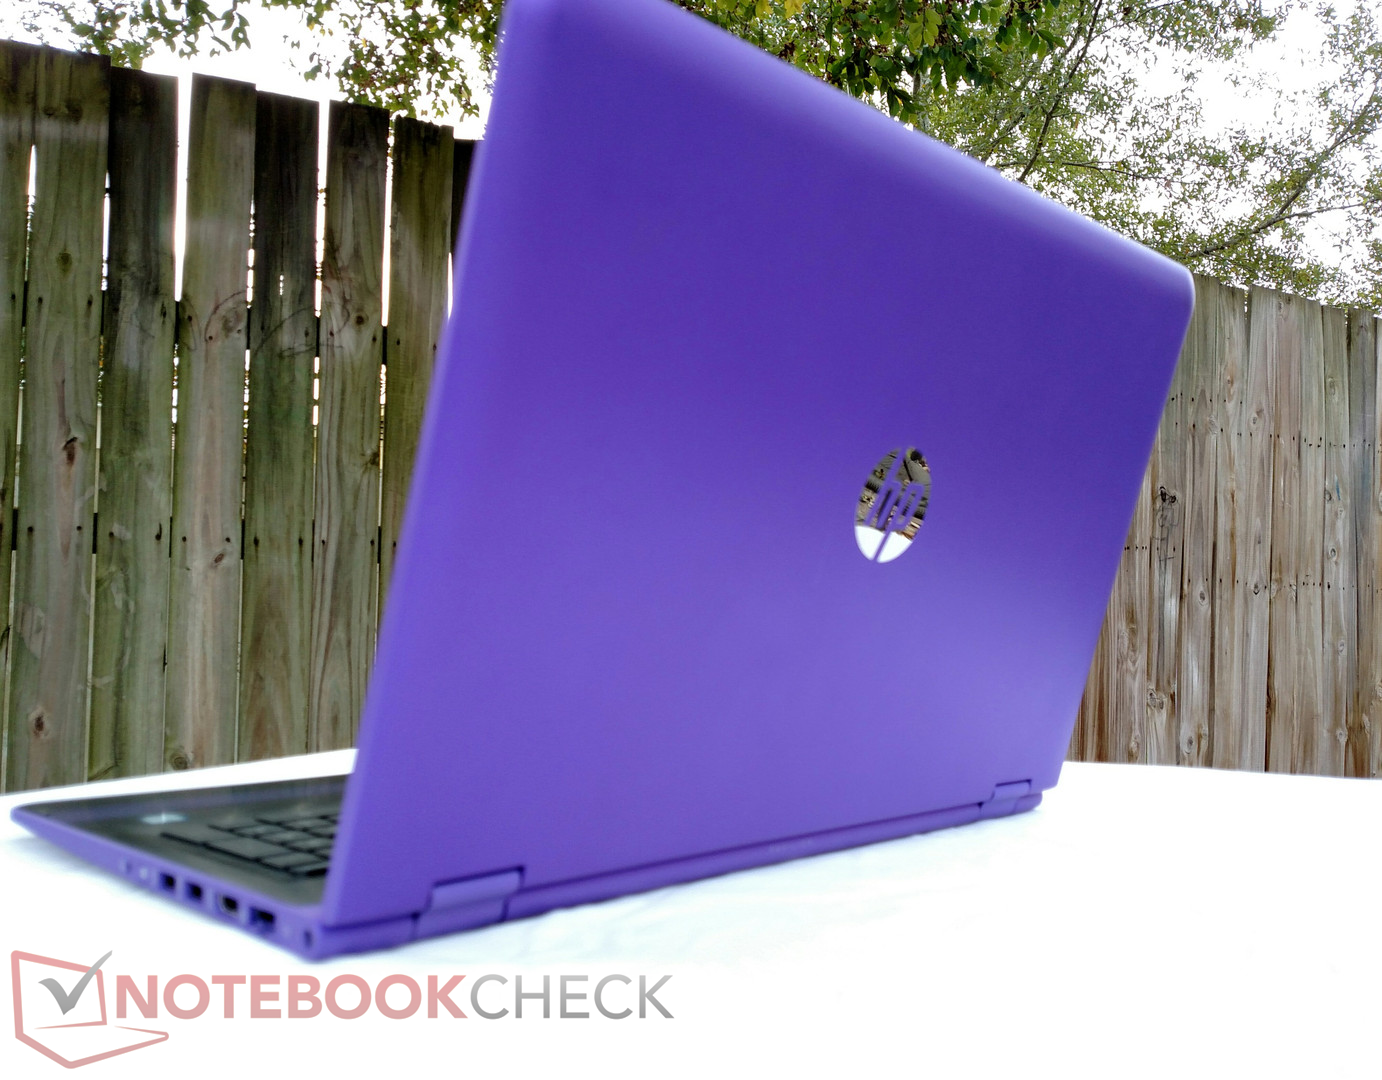
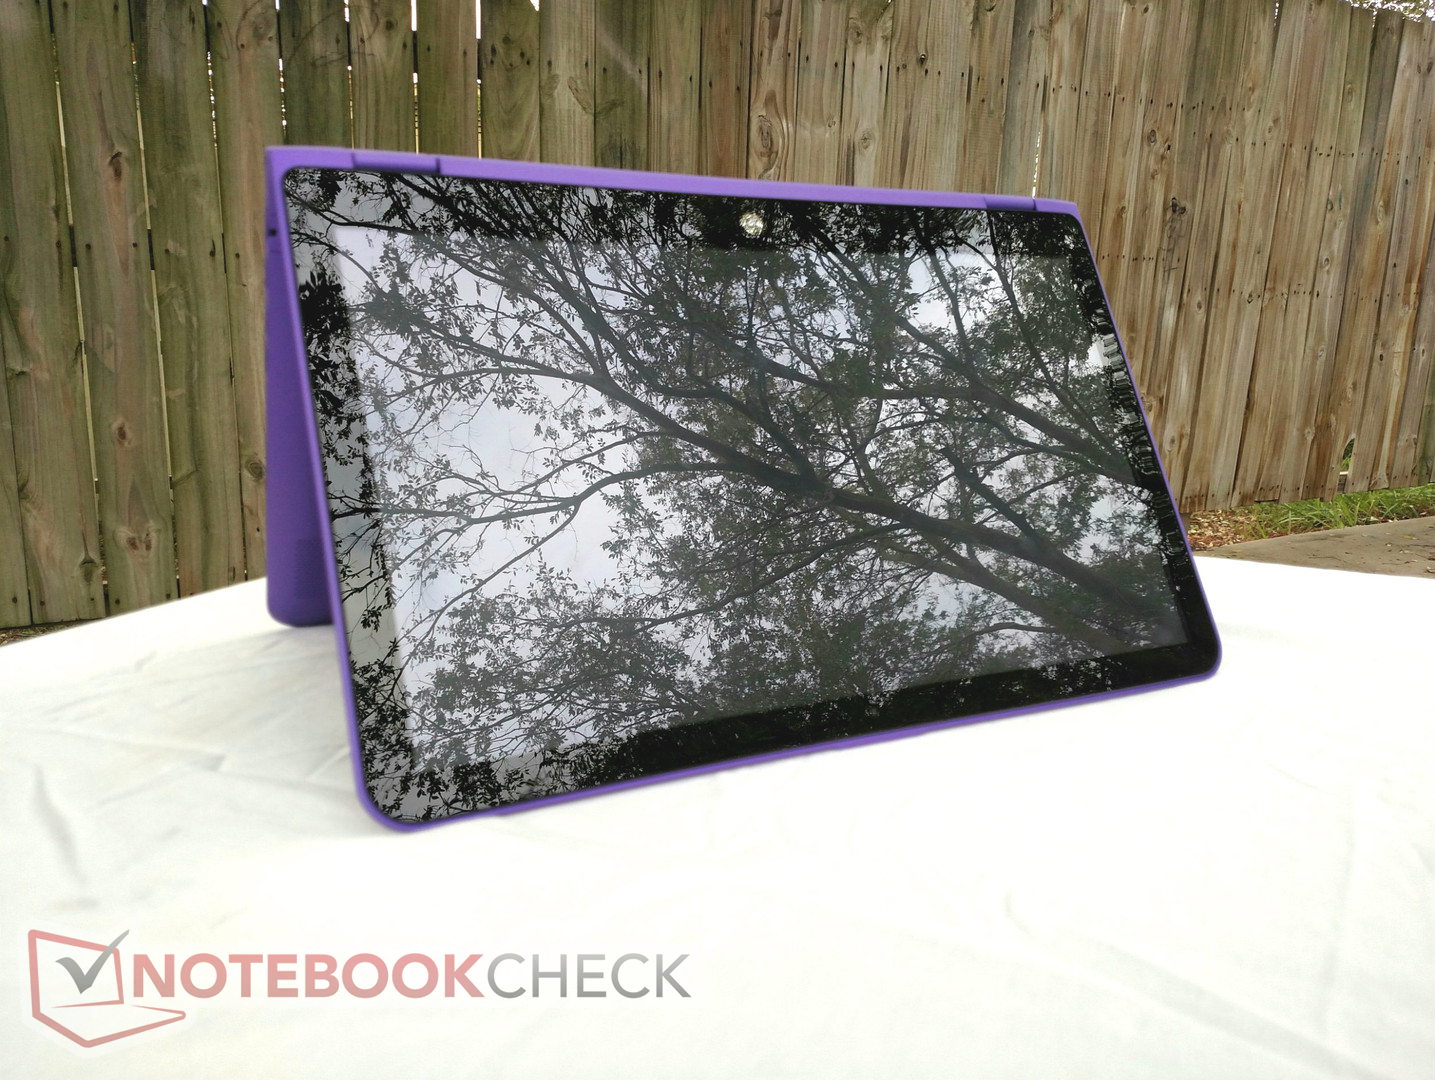
新一代的HP Pavilion X360好坏参半,虽然在键盘和处理器上有着明显的改进,但在屏幕和续航能力上却有所退步。Pavilion意在作为一台出色的办公设备,因为其搭载的Core i5处理器比处理基本的工作和多任务外有着更强的性能。然而对于多媒体应用来说,糟糕的屏幕仅仅是能用且不适用于长时间的视频观看。虽然有着2合1的功能,但Pavilion过大过重的机身使得长时间使用平板模式变成了不可能。所以变形能力感觉只是一个附加功能,不是太实用。
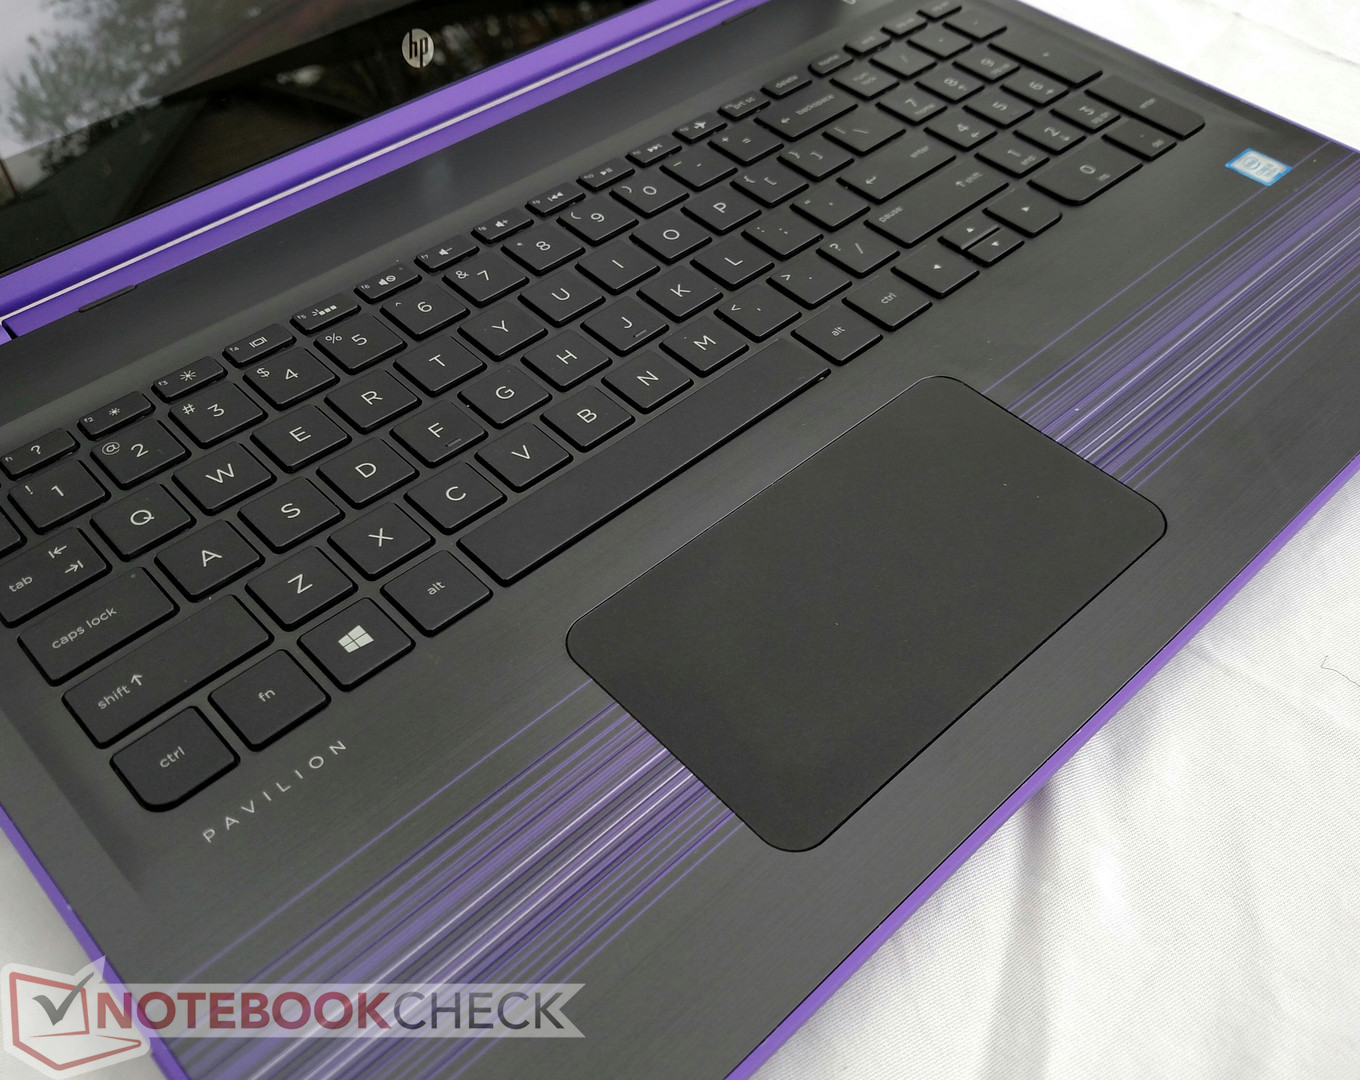
最大的问题在于低下的硬盘速度。5400RPM的机械硬盘对于今天的标准来说早已过时而且足以将任何一台出色的笔记本电脑拖到平均水平。再加上糟糕的触摸板,低亮度不出彩的屏幕以及难以进行维护,我们很难推荐Pavilion。它大多的优点都在于纯粹的外观上,而在真正重要的部分做的并不好。在同一个价位上,竞品提供了相同的Kaby Lake处理器,但有着更快的SSD,在同等的支出水平下,这些竞品是更好的选择。
在800美元的价位上,惠普 Pavilion并不是一个值得选择的产品。诚然升级到Kaby Lake处理器是十分受欢迎的,但这无法成为购买它的理由。用于应该考虑其他的2合1设备,比如联想Yoga 710-14IKB。
注:本文是基于完整评测的缩减版本,阅读完整的英文评测,请点击这里。
HP Pavilion x360 15t X3W72AV
-
12/22/2016 v6(old)
Sam Medley
Pricecompare
