 Deutsch
 English
 Español
 Français
 Italiano
 Nederlands
 Polski
 Português
 Русский
 Türkçe
 Svenska
 Chinese
 Magyar
微星 PX60 6QD Prestige iBuyPower版笔记本电脑简短评测


| |||||||||||||||||||||||||
Brightness Distribution: 80 %
Center on Battery: 221.1 cd/m²
Contrast: 361:1 (Black: 0.612 cd/m²)
ΔE Color 10.96 | 0.5-29.43 Ø5
ΔE Greyscale 11.8 | 0.57-98 Ø5.3
99.76% sRGB (Argyll 1.6.3 3D)
73.9% AdobeRGB 1998 (Argyll 1.6.3 3D)
83.1% AdobeRGB 1998 (Argyll 2.2.0 3D)
99.8% sRGB (Argyll 2.2.0 3D)
84.5% Display P3 (Argyll 2.2.0 3D)
Gamma: 2.17
| MSI PX60 6QD 15.60, 1920x1080 | MSI PX60 QD-034US 15.60, 1920x1080 | Lenovo ThinkPad T560 20FH001APB 15.60, 1920x1080 | HP ZBook 15 G3 15.60, 1920x1080 | Apple MacBook Pro Retina 15 inch 2015-05 15.40, 2880x1800 | Dell XPS 15-9550 i7 15.60, 3840x2160 | |
|---|---|---|---|---|---|---|
| Display | -13% | -47% | -14% | -20% | 8% | |
| Display P3 Coverage | 84.5 | 67 -21% | 40.93 -52% | 66.8 -21% | 61.4 -27% | 87.8 4% |
| sRGB Coverage | 99.8 | 97.7 -2% | 59.6 -40% | 95.5 -4% | 90.8 -9% | 100 0% |
| AdobeRGB 1998 Coverage | 83.1 | 69.2 -17% | 42.55 -49% | 69 -17% | 62.9 -24% | 99.4 20% |
| Response Times | -18% | -30% | ||||
| Response Time Grey 50% / Grey 80% * | 44.4 ? | 54 ? -22% | 58 ? -31% | |||
| Response Time Black / White * | 27.2 ? | 35.6 ? -31% | 35 ? -29% | |||
| PWM Frequency | 200 ? | 198 ? -1% | ||||
| Screen | 43% | 63% | 40% | 55% | 52% | |
| Brightness middle | 221.1 | 300.9 36% | 307.3 39% | 306 38% | 341 54% | 361 63% |
| Brightness | 208 | 285 37% | 285 37% | 289 39% | 315 51% | 344 65% |
| Brightness Distribution | 80 | 86 8% | 85 6% | 85 6% | 82 3% | 90 13% |
| Black Level * | 0.612 | 0.431 30% | 0.3 51% | 0.34 44% | 0.34 44% | 0.38 38% |
| Contrast | 361 | 698 93% | 1024 184% | 900 149% | 1003 178% | 950 163% |
| Colorchecker dE 2000 * | 10.96 | 1.79 84% | 5.1 53% | 2.07 81% | 5.34 51% | |
| Colorchecker dE 2000 max. * | 19.39 | 3.96 80% | 9.9 49% | 3.27 83% | ||
| Greyscale dE 2000 * | 11.8 | 2.19 81% | 7.4 37% | 1.9 84% | 4.84 59% | |
| Gamma | 2.17 101% | 2.29 96% | 2.37 93% | 2.62 84% | 2.21 100% | |
| CCT | 15654 42% | 6724 97% | 7263 89% | 6514 100% | 7395 88% | |
| Color Space (Percent of AdobeRGB 1998) | 73.9 | 63.1 -15% | 63 -15% | 58 -22% | 89 20% | |
| Color Space (Percent of sRGB) | 99.76 | 97.8 -2% | 95 -5% | 91 -9% | 100 0% | |
| Total Average (Program / Settings) | 15% /
30% | 8% /
22% | 3% /
19% | 18% /
37% | 10% /
31% |
* ... smaller is better
Display Response Times
| ↔ Response Time Black to White | ||
|---|---|---|
| 27.2 ms ... rise ↗ and fall ↘ combined | ↗ 9.2 ms rise | 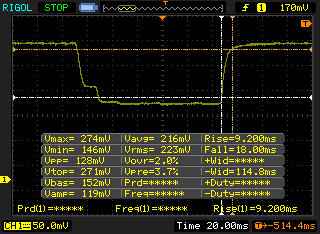 |
| ↘ 18 ms fall | ||
| The screen shows relatively slow response rates in our tests and may be too slow for gamers. In comparison, all tested devices range from 0.1 (minimum) to 240 (maximum) ms. » 65 % of all devices are better. This means that the measured response time is worse than the average of all tested devices (21.5 ms). | ||
| ↔ Response Time 50% Grey to 80% Grey | ||
| 44.4 ms ... rise ↗ and fall ↘ combined | ↗ 22.8 ms rise | 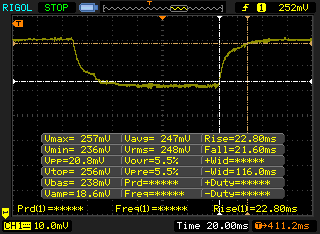 |
| ↘ 21.6 ms fall | ||
| The screen shows slow response rates in our tests and will be unsatisfactory for gamers. In comparison, all tested devices range from 0.2 (minimum) to 636 (maximum) ms. » 72 % of all devices are better. This means that the measured response time is worse than the average of all tested devices (33.7 ms). | ||
Screen Flickering / PWM (Pulse-Width Modulation)
| Screen flickering / PWM detected | 200 Hz | ≤ 99 % brightness setting |  |
The display backlight flickers at 200 Hz (worst case, e.g., utilizing PWM) Flickering detected at a brightness setting of 99 % and below. There should be no flickering or PWM above this brightness setting. The frequency of 200 Hz is relatively low, so sensitive users will likely notice flickering and experience eyestrain at the stated brightness setting and below. In comparison: 53 % of all tested devices do not use PWM to dim the display. If PWM was detected, an average of 17924 (minimum: 5 - maximum: 3846000) Hz was measured. | |||
| Cinebench R11.5 | |
| CPU Single 64Bit (sort by value) | |
| MSI PX60 6QD | |
| MSI PX60 QD-034US | |
| Lenovo ThinkPad T560 20FH001APB | |
| HP ZBook 15 G3 | |
| Apple MacBook Pro Retina 15 inch 2015-05 | |
| Apple MacBook Pro Retina 15 inch 2015-05 | |
| Dell XPS 15-9550 i7 | |
| Dell Precision 5510 | |
| CPU Multi 64Bit (sort by value) | |
| MSI PX60 6QD | |
| MSI PX60 QD-034US | |
| Lenovo ThinkPad T560 20FH001APB | |
| HP ZBook 15 G3 | |
| Apple MacBook Pro Retina 15 inch 2015-05 | |
| Apple MacBook Pro Retina 15 inch 2015-05 | |
| Dell XPS 15-9550 i7 | |
| Dell Precision 5510 | |
| Cinebench R15 | |
| CPU Single 64Bit (sort by value) | |
| MSI PX60 6QD | |
| MSI PX60 QD-034US | |
| Lenovo ThinkPad T560 20FH001APB | |
| HP ZBook 15 G3 | |
| Apple MacBook Pro Retina 15 inch 2015-05 | |
| Apple MacBook Pro Retina 15 inch 2015-05 | |
| Dell XPS 15-9550 i7 | |
| Dell Precision 5510 | |
| CPU Multi 64Bit (sort by value) | |
| MSI PX60 6QD | |
| MSI PX60 QD-034US | |
| Lenovo ThinkPad T560 20FH001APB | |
| HP ZBook 15 G3 | |
| Apple MacBook Pro Retina 15 inch 2015-05 | |
| Apple MacBook Pro Retina 15 inch 2015-05 | |
| Dell XPS 15-9550 i7 | |
| Dell Precision 5510 | |
| PCMark 8 Home Score Accelerated v2 | 3590 points | |
| PCMark 8 Creative Score Accelerated v2 | 4426 points | |
| PCMark 8 Work Score Accelerated v2 | 4703 points | |
Help | ||

| 3DMark 11 - 1280x720 Performance (sort by value) | |
| MSI PX60 6QD | |
| MSI PX60 QD-034US | |
| Lenovo ThinkPad T560 20FH001APB | |
| HP ZBook 15 G3 | |
| Apple MacBook Pro Retina 15 inch 2015-05 | |
| Dell XPS 15-9550 i7 | |
| Dell Precision 5510 | |
| 3DMark | |
| 1920x1080 Fire Strike Score (sort by value) | |
| MSI PX60 6QD | |
| MSI PX60 QD-034US | |
| Lenovo ThinkPad T560 20FH001APB | |
| HP ZBook 15 G3 | |
| Apple MacBook Pro Retina 15 inch 2015-05 | |
| Dell XPS 15-9550 i7 | |
| Dell Precision 5510 | |
| 1280x720 Cloud Gate Standard Score (sort by value) | |
| MSI PX60 6QD | |
| MSI PX60 QD-034US | |
| Lenovo ThinkPad T560 20FH001APB | |
| HP ZBook 15 G3 | |
| Apple MacBook Pro Retina 15 inch 2015-05 | |
| Dell XPS 15-9550 i7 | |
| Dell Precision 5510 | |
| 1280x720 Ice Storm Standard Score (sort by value) | |
| MSI PX60 6QD | |
| MSI PX60 QD-034US | |
| Lenovo ThinkPad T560 20FH001APB | |
| HP ZBook 15 G3 | |
| Apple MacBook Pro Retina 15 inch 2015-05 | |
| Dell XPS 15-9550 i7 | |
| Dell Precision 5510 | |
| 3DMark 06 Standard Score | 23380 points | |
| 3DMark Vantage P Result | 18030 points | |
| 3DMark 11 Performance | 4740 points | |
| 3DMark Ice Storm Standard Score | 85864 points | |
| 3DMark Cloud Gate Standard Score | 16389 points | |
| 3DMark Fire Strike Score | 3448 points | |
Help | ||
| low | med. | high | ultra | QHD | 4K | |
| BioShock Infinite (2013) | 166 | 112 | 104 | 39 | ||
| World of Tanks enCore (2018) | 246.4 | 75.1 | 26 | 19 | 8.9 | |
| Hitman 2 (2018) | 29.8 | 18.6 | 15.7 | 13.4 | ||
| Fallout 76 (2018) | 55.7 | 30.2 | 25.9 | 25 | ||
| Battlefield V (2018) | 68.1 | 31 | 25.7 | 19.8 | ||
| Farming Simulator 19 (2018) | 122.1 | 58.5 | 35.9 | 26.5 | ||
| Darksiders III (2018) | 124 | 51 | 43 | 29 | ||
| Just Cause 4 (2018) | 39.8 | 24.4 | 19.4 | 18.8 | ||
| Far Cry New Dawn (2019) | 26 | 22 | 20 | 19 | ||
| Metro Exodus (2019) | 29.67 | 13.93 | ||||
| Dirt Rally 2.0 (2019) | 67.9 | 37.34 | 32.48 | |||
| The Division 2 (2019) | 49 | 24 | 17 | 12 | ||
| Anno 1800 (2019) | 52.8 | 26.7 | 15.9 | |||
| Rage 2 (2019) | 22.4 | 13.1 | ||||
| Total War: Three Kingdoms (2019) | 101.4 | 31.2 | 19.1 | 13.2 | ||
| League of Legends (2019) | 110.3 | 81 | 75.5 | 75.9 | 60.9 | 40.4 |
| F1 2019 (2019) | 84 | 38.8 | 34.3 | 19 | 14.5 | 7.5 |
| Control (2019) | 49.4 | 14.4 | ||||
| Borderlands 3 (2019) | 48.9 | 47.4 | 13.9 | 10.3 | ||
| Star Wars Jedi Fallen Order (2019) | 48 | 37.7 | 33.2 | 18.6 | 18.4 | |
| Gears Tactics (2020) | 98.1 | 37.5 | 20.5 | 14.8 | 10 | |
| F1 2020 (2020) | 79.9 | 38.4 | 28.8 | 18.5 | 12.6 |
| MSI PX60 6QD GeForce GTX 950M, 6700HQ | MSI PX60 QD-034US GeForce GTX 950M, 5700HQ, HGST Travelstar 7K1000 HTS721010A9E630 | Lenovo ThinkPad T560 20FH001APB HD Graphics 520, 6600U, Samsung SSD PM871 MZ7LN256HCHP | HP ZBook 15 G3 Quadro M2000M, E3-1505M v5, Samsung SM951 MZVPV512HDGL m.2 PCI-e | Apple MacBook Pro Retina 15 inch 2015-05 Radeon R9 M370X, 4870HQ, Apple SSD SM0512G | Dell XPS 15-9550 i7 GeForce GTX 960M, 6700HQ, Samsung PM951 NVMe 512 GB | |
|---|---|---|---|---|---|---|
| Noise | -4% | 15% | 4% | 8% | 3% | |
| off / environment * | 30 | 30 -0% | ||||
| Idle Minimum * | 35 | 34.8 1% | 30 14% | 30 14% | 28.9 17% | 31.4 10% |
| Idle Average * | 35.2 | 37.2 -6% | 30.7 13% | 30 15% | 28.9 18% | 32.5 8% |
| Idle Maximum * | 35.2 | 37.4 -6% | 31.4 11% | 30 15% | 28.9 18% | 33.6 5% |
| Load Average * | 38.8 | 41.8 -8% | 33.8 13% | 45.3 -17% | 46 -19% | 45.2 -16% |
| Load Maximum * | 48.8 | 49.4 -1% | 38 22% | 49.7 -2% | 46 6% | 46 6% |
* ... smaller is better
Noise Level
| Idle |
| 35 / 35.2 / 35.2 dB(A) |
| Load |
| 38.8 / 48.8 dB(A) |
 | ||
30 dB silent 40 dB(A) audible 50 dB(A) loud |
||
min: | ||
(±) The maximum temperature on the upper side is 42.6 °C / 109 F, compared to the average of 34.2 °C / 94 F, ranging from 21.2 to 62.5 °C for the class Office.
(-) The bottom heats up to a maximum of 60.4 °C / 141 F, compared to the average of 36.7 °C / 98 F
(+) In idle usage, the average temperature for the upper side is 29.9 °C / 86 F, compared to the device average of 29.5 °C / 85 F.
(+) The palmrests and touchpad are reaching skin temperature as a maximum (33.4 °C / 92.1 F) and are therefore not hot.
(-) The average temperature of the palmrest area of similar devices was 27.7 °C / 81.9 F (-5.7 °C / -10.2 F).
| Off / Standby | |
| Idle | |
| Load |
|
| MSI PX60 6QD GeForce GTX 950M, 6700HQ | Lenovo ThinkPad T560 20FH001APB HD Graphics 520, 6600U, Samsung SSD PM871 MZ7LN256HCHP | HP ZBook 15 G3 Quadro M2000M, E3-1505M v5, Samsung SM951 MZVPV512HDGL m.2 PCI-e | Apple MacBook Pro Retina 15 inch 2015-05 Radeon R9 M370X, 4870HQ, Apple SSD SM0512G | Dell XPS 15-9550 i7 GeForce GTX 960M, 6700HQ, Samsung PM951 NVMe 512 GB | Dell Precision 5510 Quadro M1000M, E3-1505M v5, SK hynix SC920 512 GB | |
|---|---|---|---|---|---|---|
| Power Consumption | 53% | 19% | 25% | -9% | 8% | |
| Idle Minimum * | 15 | 3.8 75% | 5.7 62% | 6 60% | 12.5 17% | 8.6 43% |
| Idle Average * | 18.6 | 10.2 45% | 12.2 34% | 12.8 31% | 19.6 -5% | 16.2 13% |
| Idle Maximum * | 19.7 | 15.6 21% | 12.6 36% | 13.3 32% | 22.8 -16% | 16.7 15% |
| Load Average * | 64.6 | 30.8 52% | 83.1 -29% | 82.4 -28% | 102 -58% | 82.6 -28% |
| Load Maximum * | 129 | 33.9 74% | 138.2 -7% | 91.8 29% | 107 17% | 131.8 -2% |
* ... smaller is better
Pros
Cons
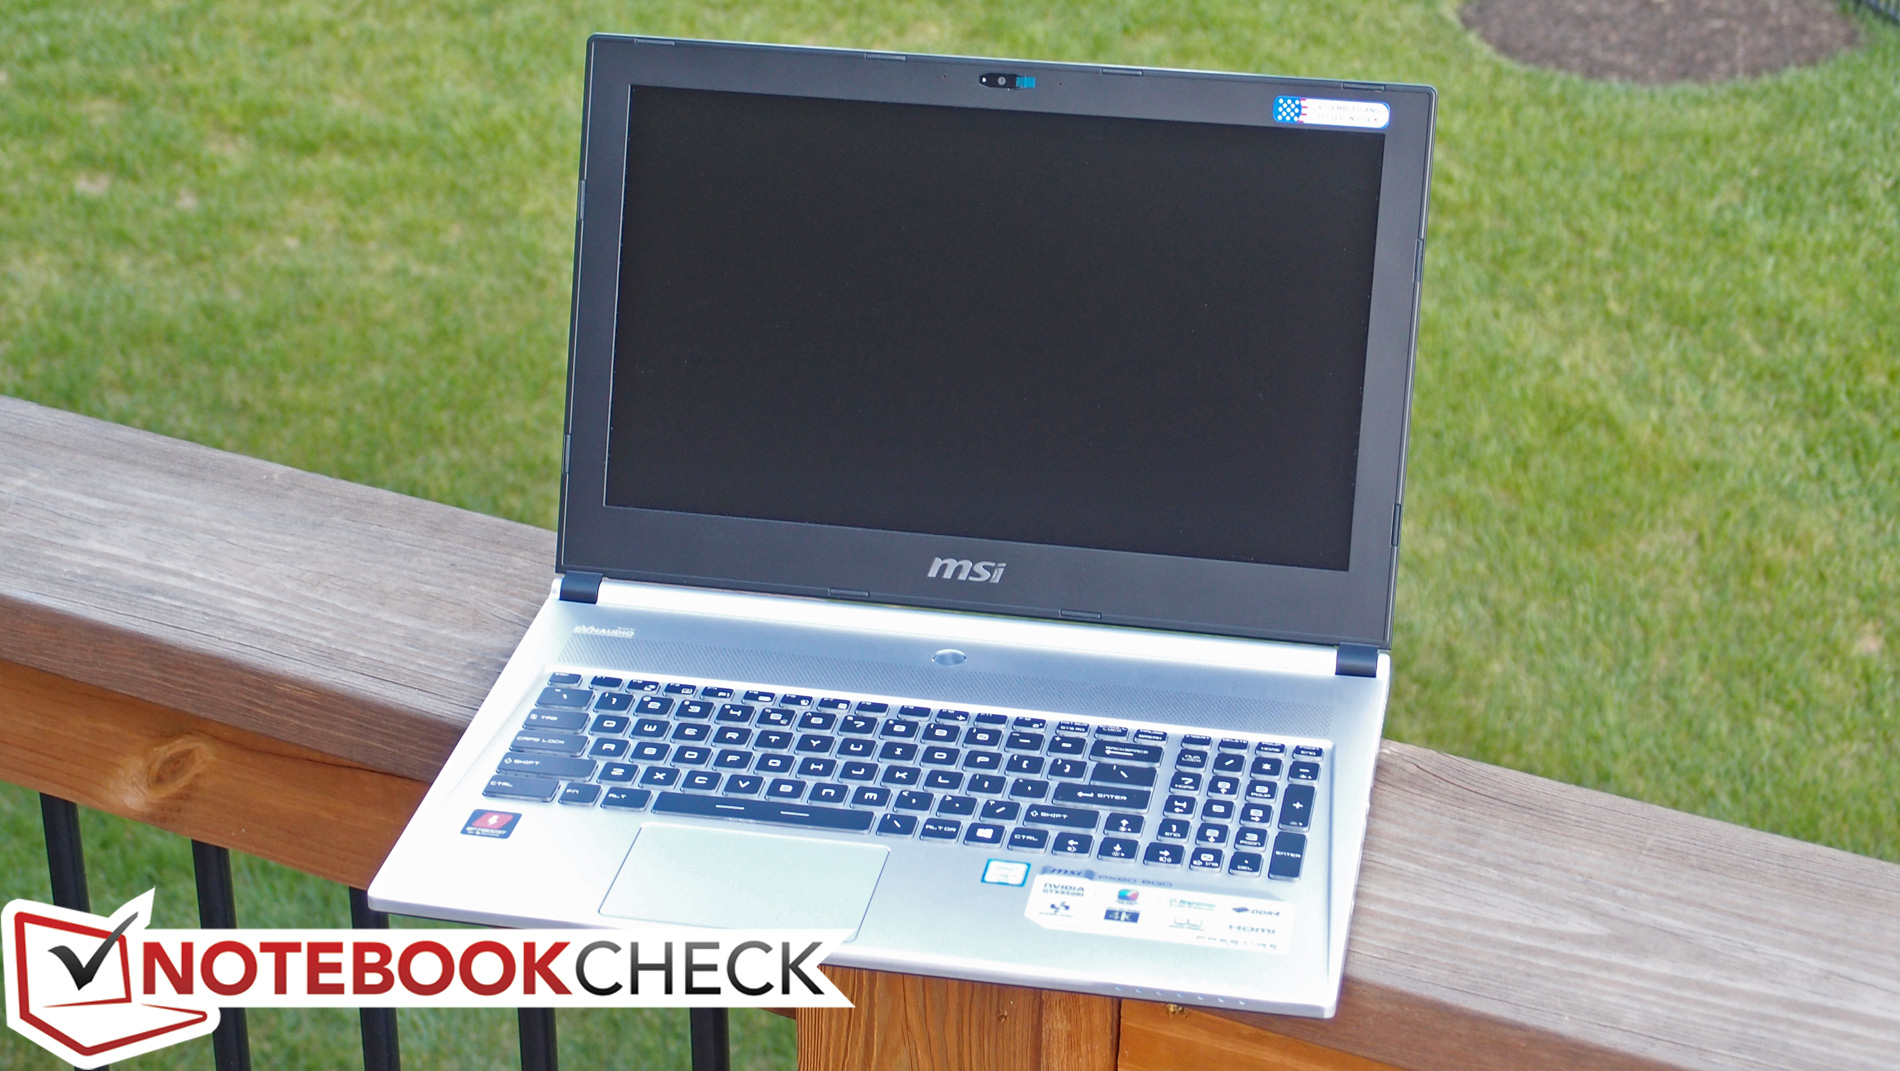
尽管我们的评分系统依然在改进,同时市场竞争也在自主优化,我们对PX60的评价相比去年的Broadwell机型几乎没有改变。如果前代设备没有什么致命缺陷那么这不会是个让人十分失望的结果,但我们也在测试过程中找到了它的很多优点——Skylake架构的PX60似乎对一些问题熟视无睹,相比前代架构只有些许的改进(如芯片组、处理器架构和电池续航)。
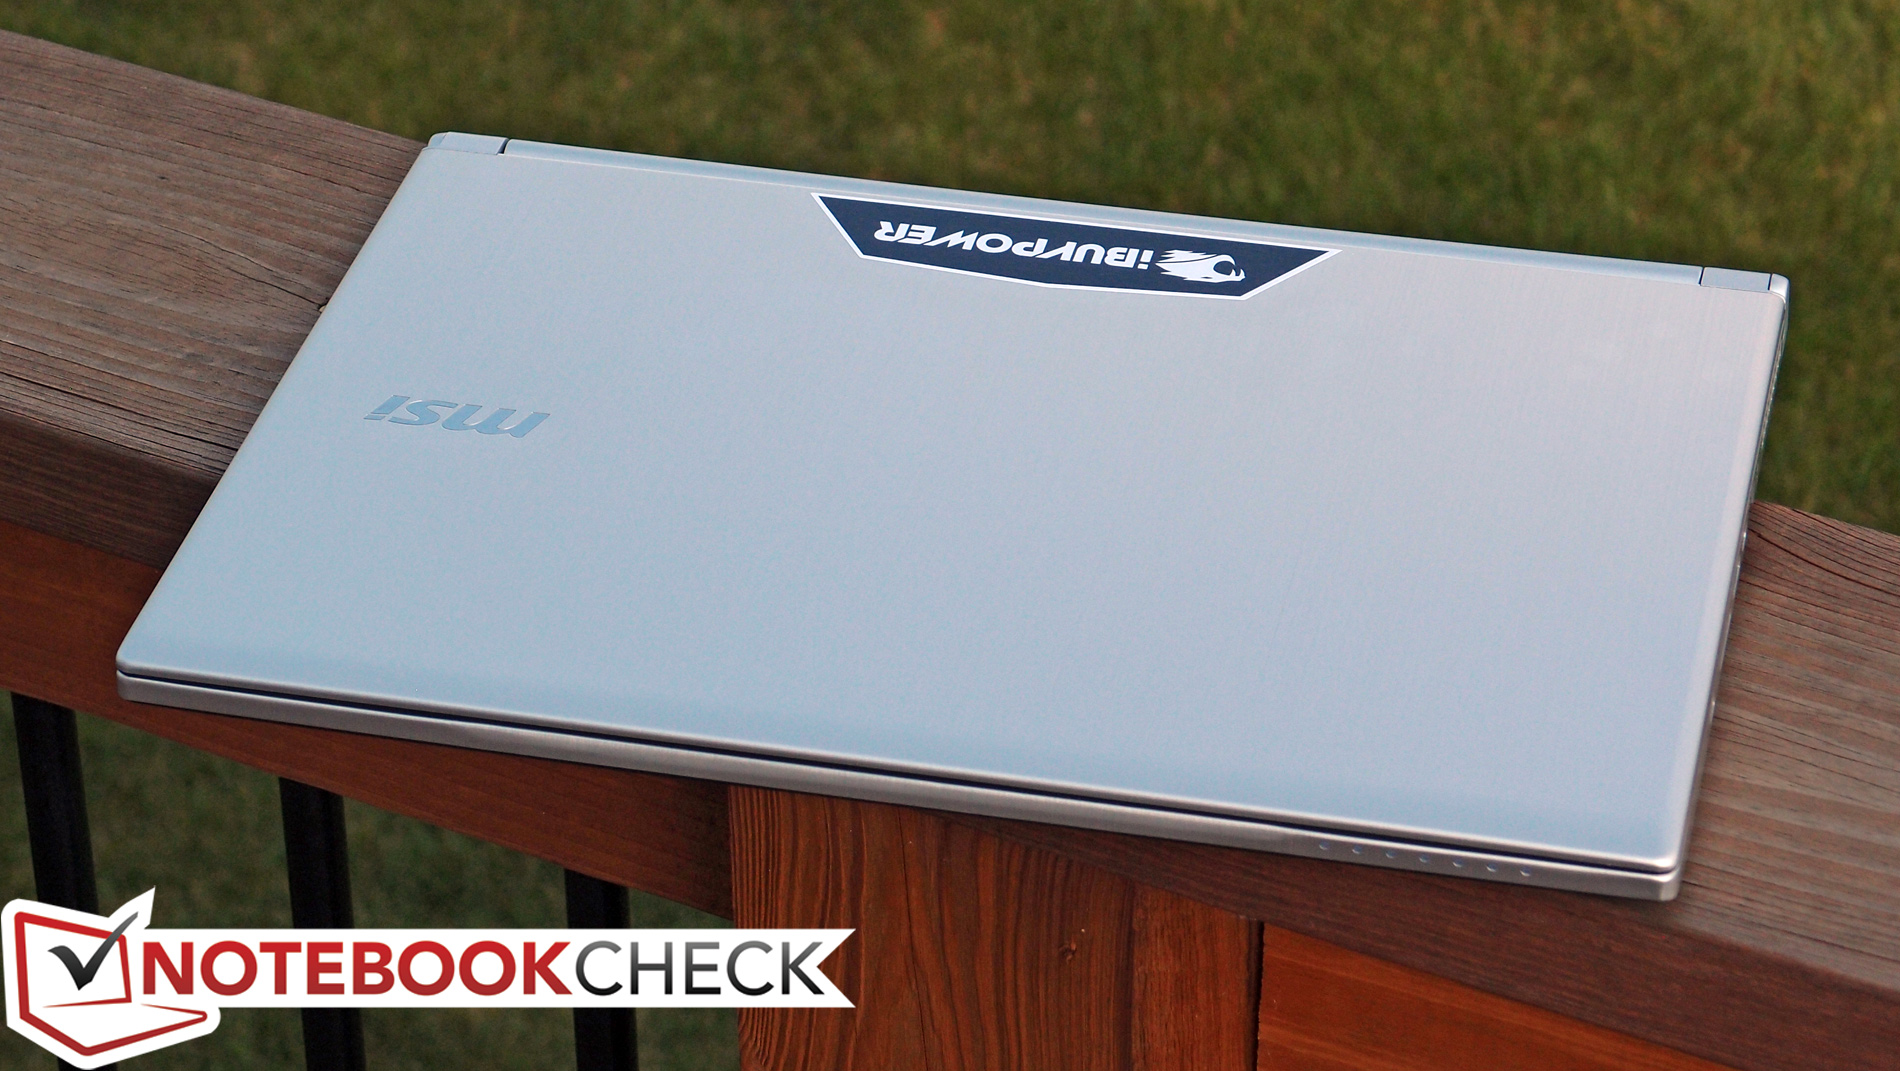
结果就是另外一台更像是中端游戏设备的“商务笔记本电脑”,除了采用了金属银灰色的外观之外。它在重新设计GS60以满足商务用途方面收效甚微。问题的根源可能在于它的定位,商务计算机市场竞争激烈,也有自己的核心理念,如实用性高于一切。在电池续航,可维护性和如输入设备(例如触控板)等方面表现不佳让它失去了核心竞争力,如果要真的和其他产品竞争的话它需要革新性的改变。说实话,它需要变成一台完全不同的笔记本电脑。
在另一方面,如果作为一台更低调的游戏本,它则有更高的价值。
它仍然有一些缺陷,但如果你不把它当作ThinkPad或者Latitude考虑的话,PX60可以作为一台低价的台式笔记本电脑(便携但电池续航过短),吸引预算有限的游戏玩家。商务用户则有无数更好的选择了。
注:本文是基于完整评测的缩减版本,阅读完整的英文评测,请点击这里。
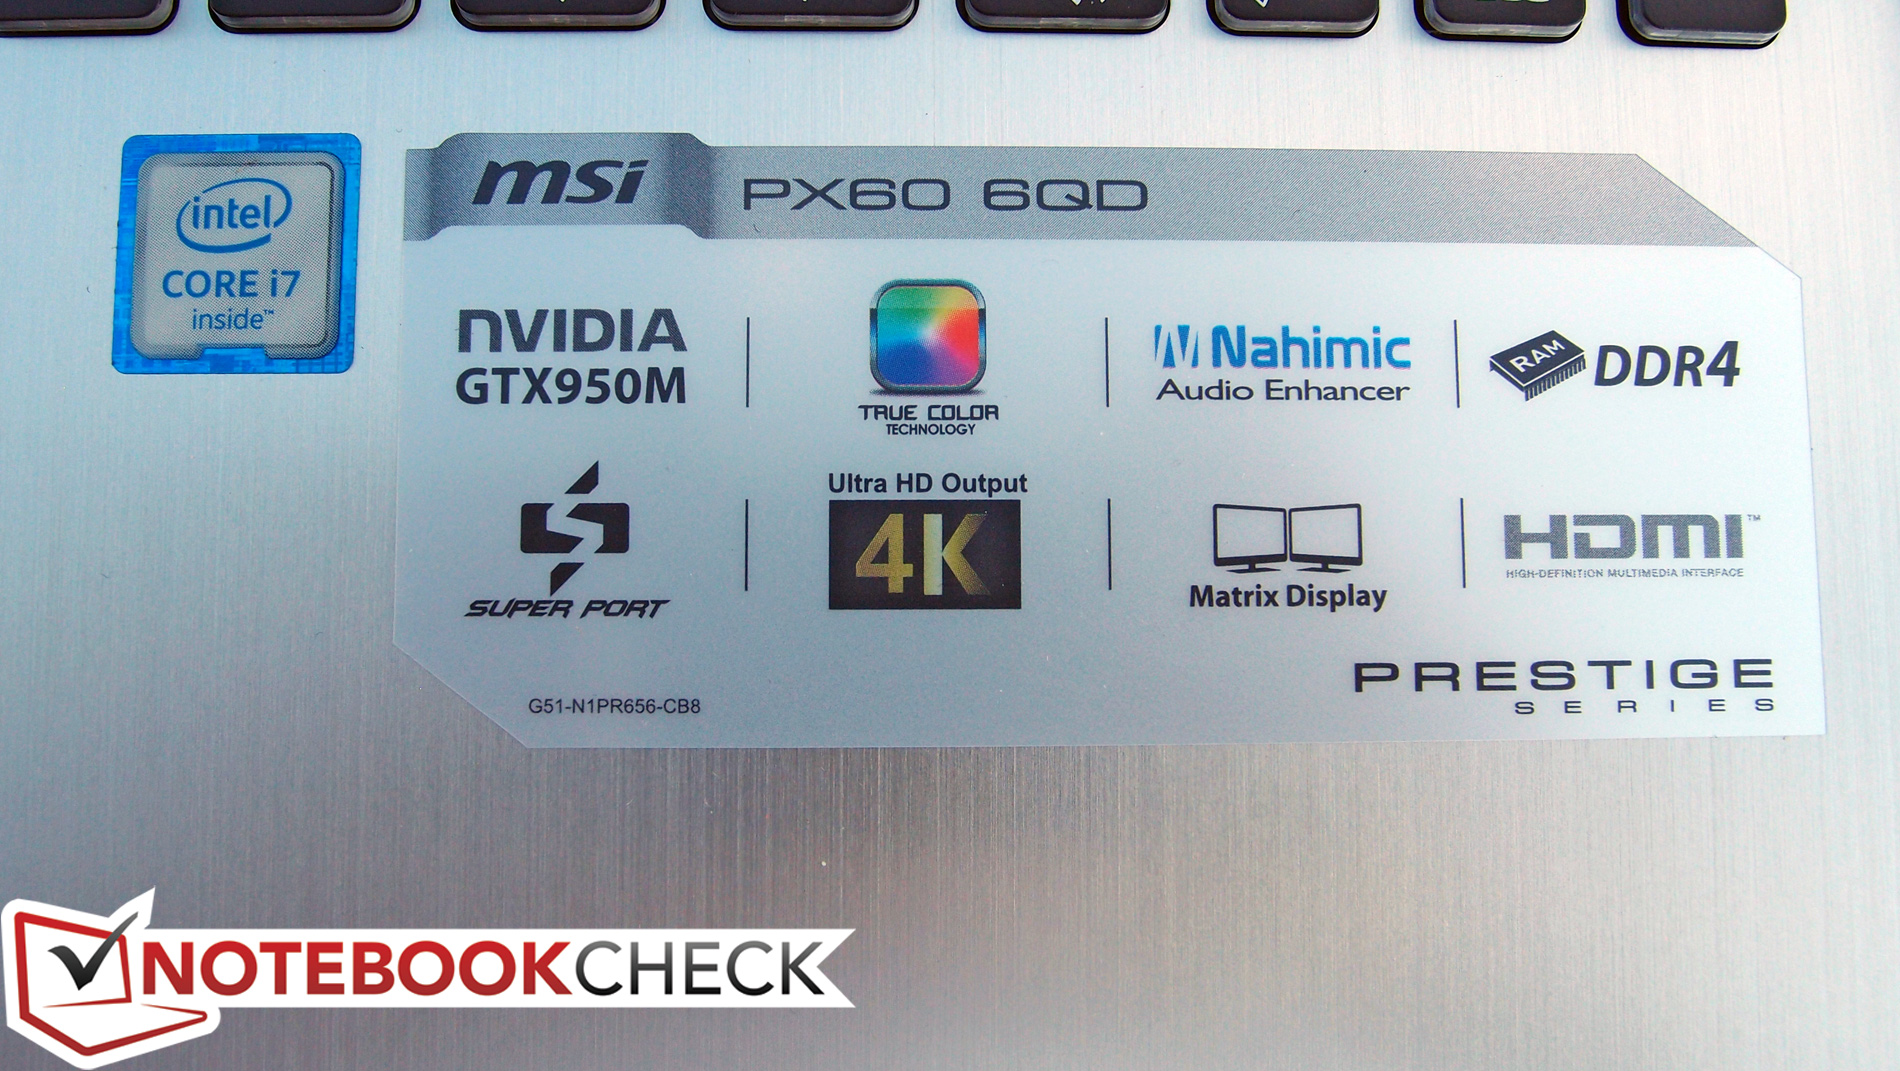
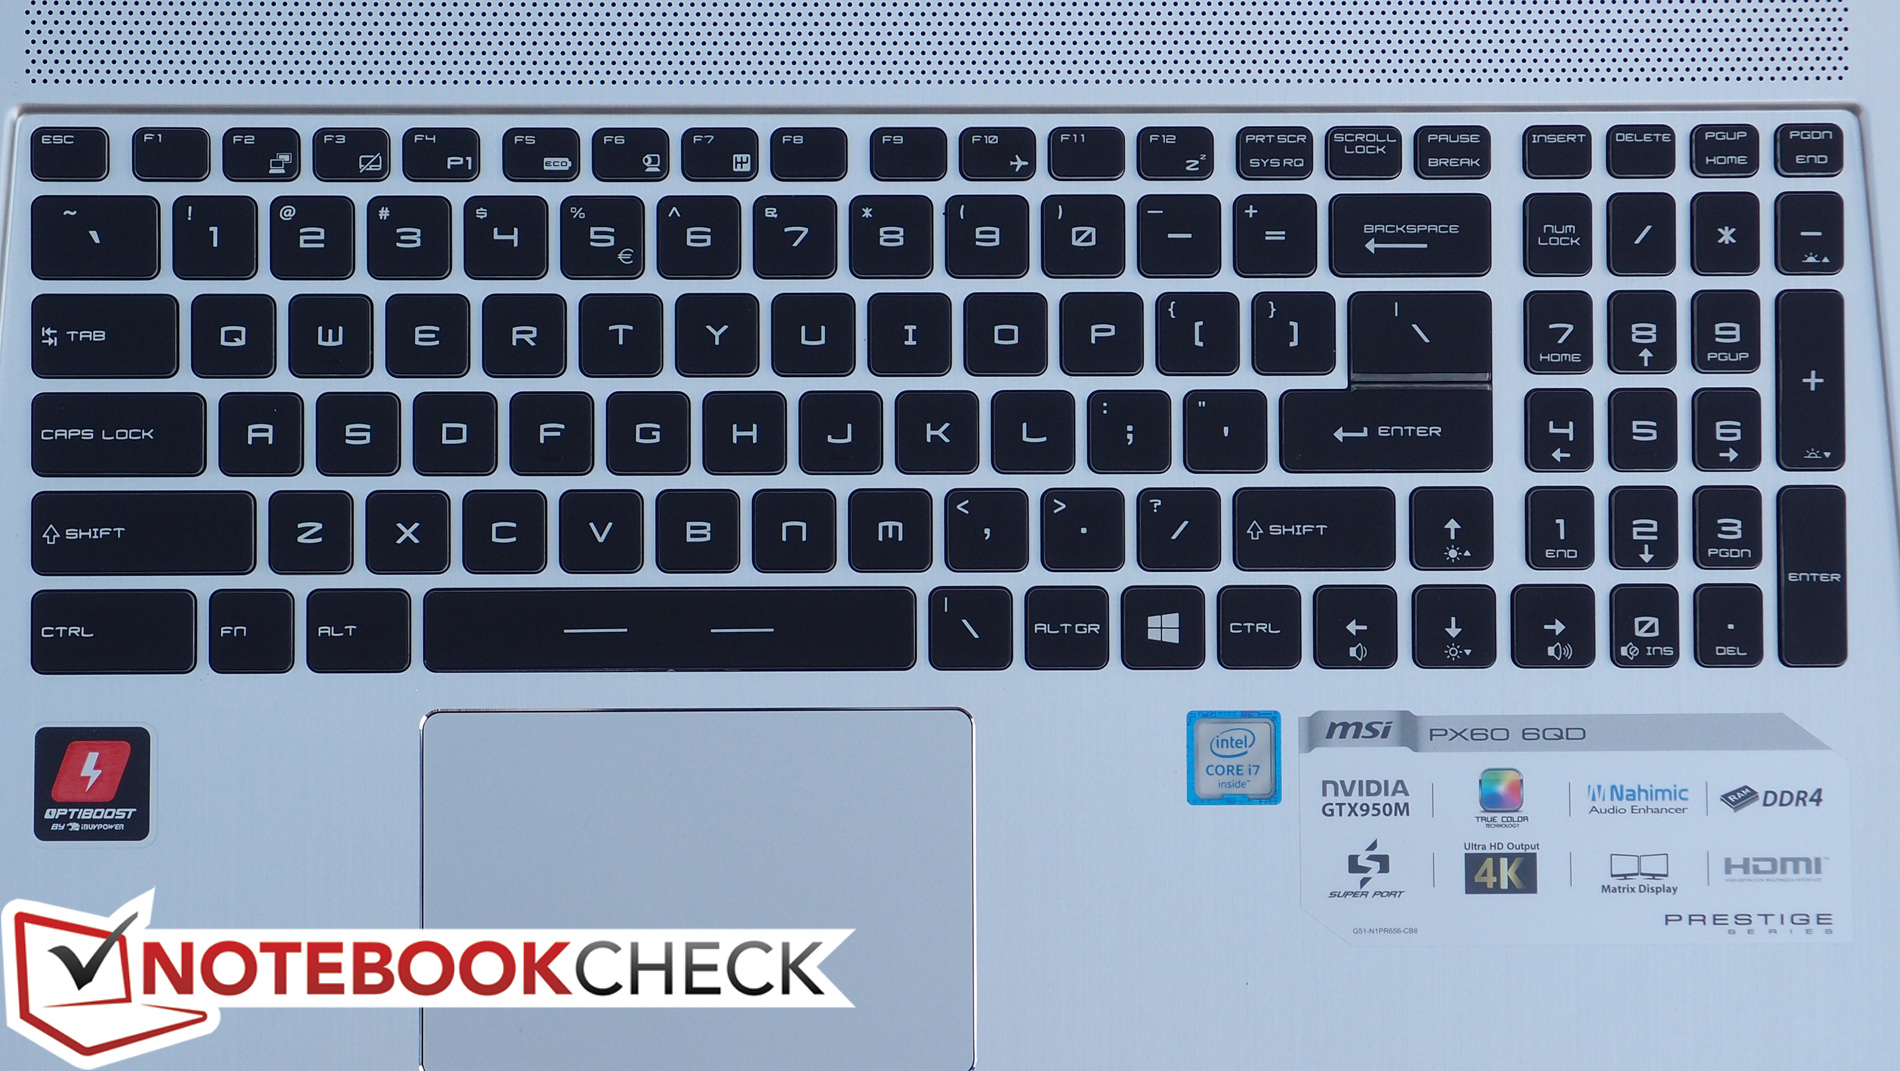
MSI PX60 6QD
-
05/03/2016 v5.1(old)
Steve Schardein
Pricecompare
