 Deutsch
 English
 Español
 Français
 Italiano
 Nederlands
 Polski
 Português
 Русский
 Türkçe
 Svenska
 Chinese
 Magyar
技嘉 P55W v7 笔记本简短评测

| SD Card Reader | |
| average JPG Copy Test (av. of 3 runs) | |
| SCHENKER XMG P507 | |
| Gigabyte P55W v7 | |
| Asus Strix GL502VM-FY039T | |
| Gigabyte P55W v6 | |
| MSI GE62VR 6RF-001US | |
| maximum AS SSD Seq Read Test (1GB) | |
| Gigabyte P55W v7 | |
| Gigabyte P55W v6 | |
| SCHENKER XMG P507 | |
| Asus Strix GL502VM-FY039T | |
| MSI GE62VR 6RF-001US | |
| Networking | |
| iperf3 transmit AX12 | |
| Asus Strix GL502VM-FY039T | |
| Gigabyte P55W v6 | |
| Gigabyte P55W v7 | |
| iperf3 receive AX12 | |
| Asus Strix GL502VM-FY039T | |
| Gigabyte P55W v7 | |
| Gigabyte P55W v6 | |
| |||||||||||||||||||||||||
Brightness Distribution: 87 %
Center on Battery: 287 cd/m²
Contrast: 990:1 (Black: 0.29 cd/m²)
ΔE Color 4.92 | 0.5-29.43 Ø5
ΔE Greyscale 3.66 | 0.57-98 Ø5.3
82% sRGB (Argyll 1.6.3 3D)
54% AdobeRGB 1998 (Argyll 1.6.3 3D)
59.9% AdobeRGB 1998 (Argyll 2.2.0 3D)
82% sRGB (Argyll 2.2.0 3D)
63.5% Display P3 (Argyll 2.2.0 3D)
Gamma: 2.32
| Gigabyte P55W v7 LG Philips LP156WF6 (LGD046F), 1920x1080, 15.60 | Asus Strix GL502VM-FY039T LG Philips LP156WF6-SPB6 (LGD046F), 1920x1080, 15.60 | MSI GE62VR 6RF-001US 1920x1080, 15.60 | SCHENKER XMG P507 LG Philips LP156WF6 (LGD046F), 1920x1080, 15.60 | Gigabyte P55W v6 LG Philips LP156WF4 (LGD040E), 1920x1080, 15.60 | |
|---|---|---|---|---|---|
| Display | 2% | 3% | 2% | -1% | |
| Display P3 Coverage | 63.5 | 64.5 2% | 65.6 3% | 64.5 2% | 63.2 0% |
| sRGB Coverage | 82 | 83.4 2% | 84.3 3% | 83.4 2% | 80.6 -2% |
| AdobeRGB 1998 Coverage | 59.9 | 60.9 2% | 61.7 3% | 61 2% | 59 -2% |
| Response Times | -4% | -3% | 6% | -38% | |
| Response Time Grey 50% / Grey 80% * | 37 ? | 40 ? -8% | 36.8 ? 1% | 36 ? 3% | 56 ? -51% |
| Response Time Black / White * | 25 ? | 25 ? -0% | 26.4 ? -6% | 23 ? 8% | 31 ? -24% |
| PWM Frequency | |||||
| Screen | 3% | 16% | -1% | -6% | |
| Brightness middle | 287 | 321 12% | 302 5% | 288 0% | 280 -2% |
| Brightness | 289 | 296 2% | 303 5% | 292 1% | 294 2% |
| Brightness Distribution | 87 | 88 1% | 87 0% | 87 0% | 82 -6% |
| Black Level * | 0.29 | 0.33 -14% | 0.169 42% | 0.3 -3% | 0.46 -59% |
| Contrast | 990 | 973 -2% | 1787 81% | 960 -3% | 609 -38% |
| Colorchecker dE 2000 * | 4.92 | 4.42 10% | 4.61 6% | 5.1 -4% | 4.48 9% |
| Colorchecker dE 2000 max. * | 11 | 9.78 11% | 9.98 9% | 9.44 14% | 10.16 8% |
| Greyscale dE 2000 * | 3.66 | 3.34 9% | 3.32 9% | 4.43 -21% | 2.69 27% |
| Gamma | 2.32 95% | 2.4 92% | 2.24 98% | 2.46 89% | 2.37 93% |
| CCT | 6482 100% | 6213 105% | 6358 102% | 6687 97% | 6455 101% |
| Color Space (Percent of AdobeRGB 1998) | 54 | 55 2% | 55.4 3% | 55 2% | 53 -2% |
| Color Space (Percent of sRGB) | 82 | 83 1% | 84.4 3% | 83 1% | 80 -2% |
| Total Average (Program / Settings) | 0% /
2% | 5% /
11% | 2% /
0% | -15% /
-9% |
* ... smaller is better
Display Response Times
| ↔ Response Time Black to White | ||
|---|---|---|
| 25 ms ... rise ↗ and fall ↘ combined | ↗ 5 ms rise | 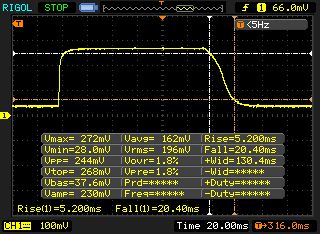 |
| ↘ 20 ms fall | ||
| The screen shows relatively slow response rates in our tests and may be too slow for gamers. In comparison, all tested devices range from 0.1 (minimum) to 240 (maximum) ms. » 53 % of all devices are better. This means that the measured response time is worse than the average of all tested devices (21.5 ms). | ||
| ↔ Response Time 50% Grey to 80% Grey | ||
| 37 ms ... rise ↗ and fall ↘ combined | ↗ 15 ms rise | 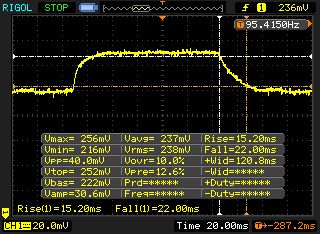 |
| ↘ 22 ms fall | ||
| The screen shows slow response rates in our tests and will be unsatisfactory for gamers. In comparison, all tested devices range from 0.2 (minimum) to 636 (maximum) ms. » 47 % of all devices are better. This means that the measured response time is similar to the average of all tested devices (33.7 ms). | ||
Screen Flickering / PWM (Pulse-Width Modulation)
| Screen flickering / PWM not detected | 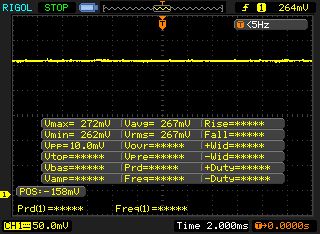 | ||
In comparison: 53 % of all tested devices do not use PWM to dim the display. If PWM was detected, an average of 17915 (minimum: 5 - maximum: 3846000) Hz was measured. | |||
| PCMark 8 | |
| Home Score Accelerated v2 | |
| Asus Strix GL502VM-FY039T | |
| MSI GE62VR 6RF-001US | |
| Gigabyte P55W v6 | |
| Gigabyte P55W v7 | |
| Work Score Accelerated v2 | |
| Gigabyte P55W v7 | |
| Asus Strix GL502VM-FY039T | |
| MSI GE62VR 6RF-001US | |
| Gigabyte P55W v6 | |
| PCMark 8 Home Score Accelerated v2 | 4013 points | |
| PCMark 8 Work Score Accelerated v2 | 5317 points | |
Help | ||
| Gigabyte P55W v7 Liteonit CV3-8D256 | Asus Strix GL502VM-FY039T Micron SSD 1100 (MTFDDAV256TBN) | MSI GE62VR 6RF-001US Samsung SM951 MZVPV512HDGL m.2 PCI-e | SCHENKER XMG P507 Samsung SM951 MZVPV256HDGL m.2 PCI-e | Gigabyte P55W v6 Transcend MTS800 128GB M.2 (TS128GMTS800) | |
|---|---|---|---|---|---|
| CrystalDiskMark 3.0 | 28% | 249% | 227% | -6% | |
| Read Seq | 466.2 | 462.5 -1% | 1696 264% | 1857 298% | 511 10% |
| Write Seq | 261.9 | 462.7 77% | 1584 505% | 1240 373% | 161.1 -38% |
| Read 512 | 252.5 | 335 33% | 1044 313% | 971 285% | 338 34% |
| Write 512 | 254.8 | 407.1 60% | 1562 513% | 1239 386% | 160.8 -37% |
| Read 4k | 25.4 | 25.61 1% | 50.8 100% | 54.1 113% | 26.2 3% |
| Write 4k | 55 | 86.3 57% | 139.2 153% | 167.4 204% | 76.7 39% |
| Read 4k QD32 | 358.5 | 246.7 -31% | 591 65% | 695 94% | 264.7 -26% |
| Write 4k QD32 | 240.1 | 301.5 26% | 422.8 76% | 386.8 61% | 160.3 -33% |

| 3DMark - 1920x1080 Fire Strike Graphics | |
| MSI GE62VR 6RF-001US | |
| Asus Strix GL502VM-FY039T | |
| Gigabyte P55W v7 | |
| Gigabyte P55W v6 | |
| SCHENKER XMG P507 | |
| 3DMark 11 - 1280x720 Performance GPU | |
| MSI GE62VR 6RF-001US | |
| Asus Strix GL502VM-FY039T | |
| Gigabyte P55W v6 | |
| Gigabyte P55W v7 | |
| SCHENKER XMG P507 | |
| 3DMark 11 Performance | 11778 points | |
| 3DMark Cloud Gate Standard Score | 21839 points | |
| 3DMark Fire Strike Score | 9669 points | |
Help | ||
| low | med. | high | ultra | |
| The Witcher 3 (2015) | 70.4 | 38.4 | ||
| Rise of the Tomb Raider (2016) | 72.6 | 61.8 | ||
| Battlefield 1 (2016) | 77.6 | 73.6 | ||
| Dishonored 2 (2016) | 80.2 | 60.2 | 46.5 | |
| Resident Evil 7 (2017) | 98.5 | 83 |
Noise Level
| Idle |
| 33 / 34 / 35 dB(A) |
| HDD |
| 34 dB(A) |
| DVD |
| 37 / dB(A) |
| Load |
| 39 / 50 dB(A) |
 | ||
30 dB silent 40 dB(A) audible 50 dB(A) loud |
||
min: | ||
(-) The maximum temperature on the upper side is 49.6 °C / 121 F, compared to the average of 40.4 °C / 105 F, ranging from 21.2 to 68.8 °C for the class Gaming.
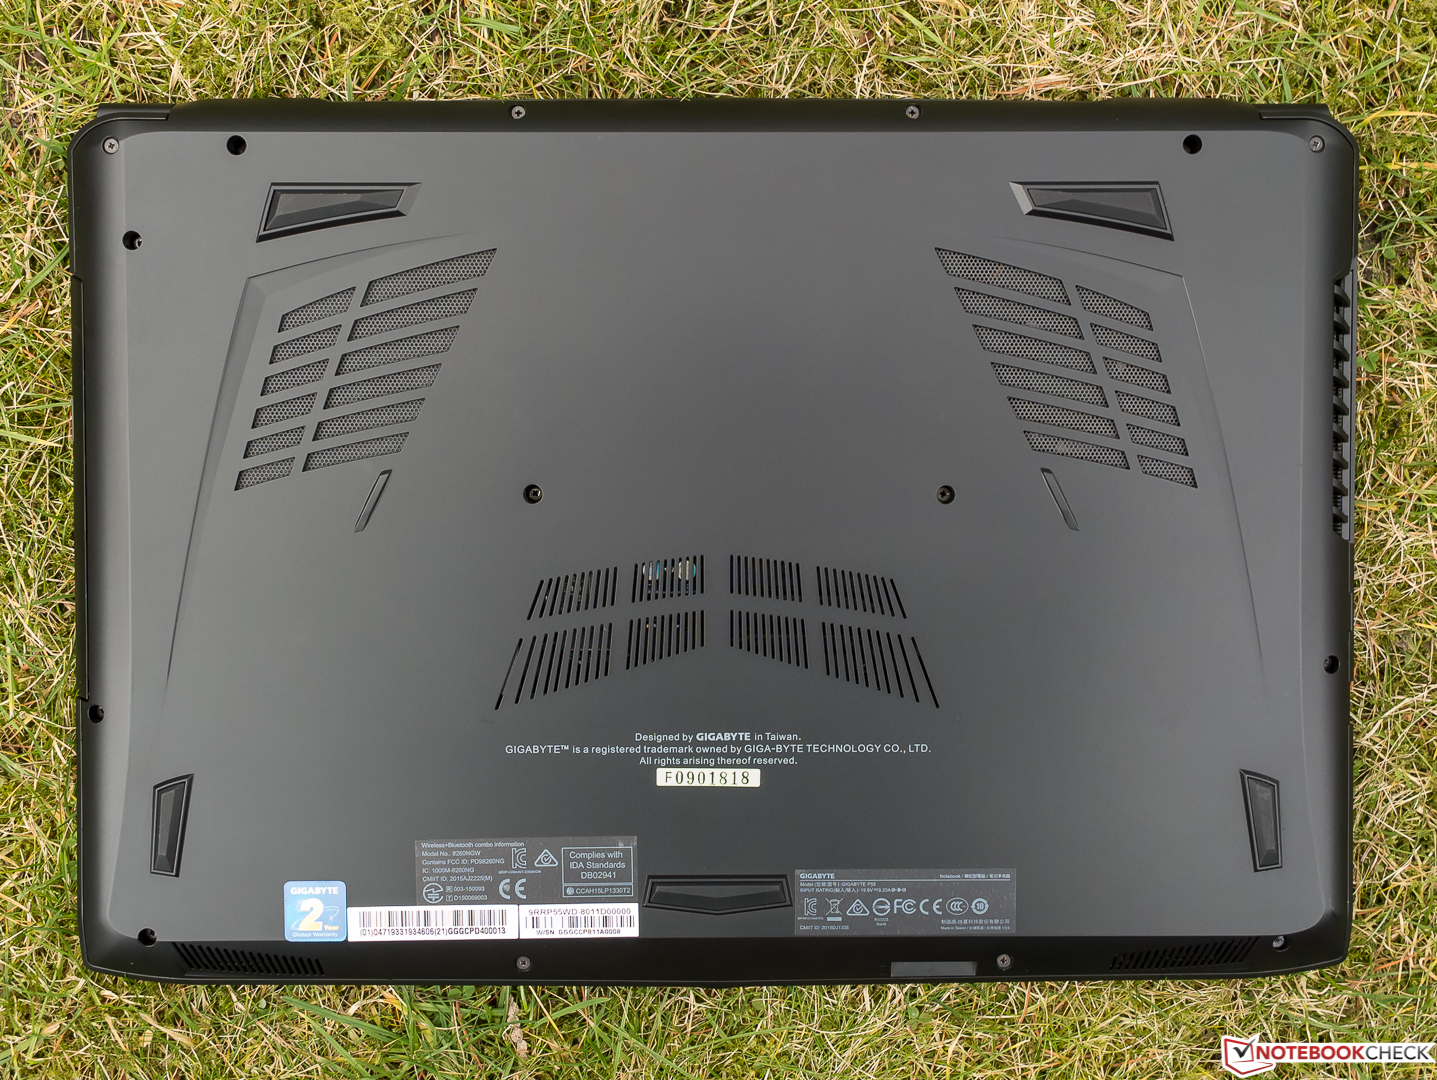
(-) The bottom heats up to a maximum of 47.7 °C / 118 F, compared to the average of 43.2 °C / 110 F
(+) In idle usage, the average temperature for the upper side is 22.8 °C / 73 F, compared to the device average of 33.8 °C / 93 F.
(-) The palmrests and touchpad can get very hot to the touch with a maximum of 45.1 °C / 113.2 F.
(-) The average temperature of the palmrest area of similar devices was 28.9 °C / 84 F (-16.2 °C / -29.2 F).
Gigabyte P55W v7 audio analysis
(±) | speaker loudness is average but good (79 dB)
Bass 100 - 315 Hz
(-) | nearly no bass - on average 15.9% lower than median
(±) | linearity of bass is average (11.3% delta to prev. frequency)
Mids 400 - 2000 Hz
(+) | balanced mids - only 4.7% away from median
(±) | linearity of mids is average (8.8% delta to prev. frequency)
Highs 2 - 16 kHz
(+) | balanced highs - only 3.6% away from median
(±) | linearity of highs is average (10.1% delta to prev. frequency)
Overall 100 - 16.000 Hz
(±) | linearity of overall sound is average (18.8% difference to median)
Compared to same class
» 59% of all tested devices in this class were better, 8% similar, 33% worse
» The best had a delta of 6%, average was 18%, worst was 132%
Compared to all devices tested
» 38% of all tested devices were better, 8% similar, 54% worse
» The best had a delta of 4%, average was 25%, worst was 134%
Asus Strix GL502VM-FY039T audio analysis
(±) | speaker loudness is average but good (76 dB)
Bass 100 - 315 Hz
(-) | nearly no bass - on average 19.1% lower than median
(-) | bass is not linear (18.1% delta to prev. frequency)
Mids 400 - 2000 Hz
(+) | balanced mids - only 2.9% away from median
(+) | mids are linear (4% delta to prev. frequency)
Highs 2 - 16 kHz
(±) | higher highs - on average 5.6% higher than median
(±) | linearity of highs is average (8% delta to prev. frequency)
Overall 100 - 16.000 Hz
(±) | linearity of overall sound is average (23% difference to median)
Compared to same class
» 81% of all tested devices in this class were better, 6% similar, 13% worse
» The best had a delta of 6%, average was 18%, worst was 132%
Compared to all devices tested
» 64% of all tested devices were better, 6% similar, 30% worse
» The best had a delta of 4%, average was 25%, worst was 134%
MSI GE62VR 6RF-001US audio analysis
(±) | speaker loudness is average but good (76.9 dB)
Bass 100 - 315 Hz
(±) | reduced bass - on average 13.1% lower than median
(±) | linearity of bass is average (12% delta to prev. frequency)
Mids 400 - 2000 Hz
(+) | balanced mids - only 3% away from median
(±) | linearity of mids is average (12% delta to prev. frequency)
Highs 2 - 16 kHz
(+) | balanced highs - only 4.4% away from median
(±) | linearity of highs is average (10.1% delta to prev. frequency)
Overall 100 - 16.000 Hz
(±) | linearity of overall sound is average (18.6% difference to median)
Compared to same class
» 57% of all tested devices in this class were better, 9% similar, 34% worse
» The best had a delta of 6%, average was 18%, worst was 132%
Compared to all devices tested
» 37% of all tested devices were better, 8% similar, 56% worse
» The best had a delta of 4%, average was 25%, worst was 134%
SCHENKER XMG P507 audio analysis
(±) | speaker loudness is average but good (75 dB)
Bass 100 - 315 Hz
(-) | nearly no bass - on average 20.7% lower than median
(±) | linearity of bass is average (8.8% delta to prev. frequency)
Mids 400 - 2000 Hz
(+) | balanced mids - only 2.2% away from median
(±) | linearity of mids is average (7.6% delta to prev. frequency)
Highs 2 - 16 kHz
(+) | balanced highs - only 2.3% away from median
(+) | highs are linear (5.3% delta to prev. frequency)
Overall 100 - 16.000 Hz
(±) | linearity of overall sound is average (19% difference to median)
Compared to same class
» 61% of all tested devices in this class were better, 8% similar, 31% worse
» The best had a delta of 6%, average was 18%, worst was 132%
Compared to all devices tested
» 39% of all tested devices were better, 8% similar, 53% worse
» The best had a delta of 4%, average was 25%, worst was 134%
| Off / Standby | |
| Idle | |
| Load |
|
| Gigabyte P55W v7 i7-7700HQ, GeForce GTX 1060 Mobile | Asus Strix GL502VM-FY039T 6700HQ, GeForce GTX 1060 Mobile | MSI GE62VR 6RF-001US 6700HQ, GeForce GTX 1060 Mobile | SCHENKER XMG P507 6700HQ, GeForce GTX 1060 Mobile | Gigabyte P55W v6 6700HQ, GeForce GTX 1060 Mobile | |
|---|---|---|---|---|---|
| Power Consumption | -35% | -97% | -21% | -0% | |
| Idle Minimum * | 8 | 16 -100% | 25.4 -218% | 11 -38% | 8 -0% |
| Idle Average * | 13 | 19 -46% | 30.3 -133% | 16 -23% | 13 -0% |
| Idle Maximum * | 18 | 23 -28% | 31.5 -75% | 21 -17% | 17 6% |
| Load Average * | 76 | 68 11% | 111.8 -47% | 80 -5% | 71 7% |
| Load Maximum * | 143 | 157 -10% | 163.2 -14% | 174 -22% | 165 -15% |
* ... smaller is better
| Gigabyte P55W v7 i7-7700HQ, GeForce GTX 1060 Mobile, 63 Wh | Asus Strix GL502VM-FY039T 6700HQ, GeForce GTX 1060 Mobile, 64 Wh | MSI GE62VR 6RF-001US 6700HQ, GeForce GTX 1060 Mobile, 51 Wh | SCHENKER XMG P507 6700HQ, GeForce GTX 1060 Mobile, 60 Wh | Gigabyte P55W v6 6700HQ, GeForce GTX 1060 Mobile, 63 Wh | |
|---|---|---|---|---|---|
| Battery Runtime | -36% | -73% | -14% | -8% | |
| Reader / Idle | 789 | 315 -60% | 137 -83% | 409 -48% | 610 -23% |
| WiFi v1.3 | 346 | 220 -36% | 101 -71% | 274 -21% | 352 2% |
| Load | 98 | 87 -11% | 35 -64% | 123 26% | 95 -3% |
| H.264 | 235 | 338 |
Pros
Cons
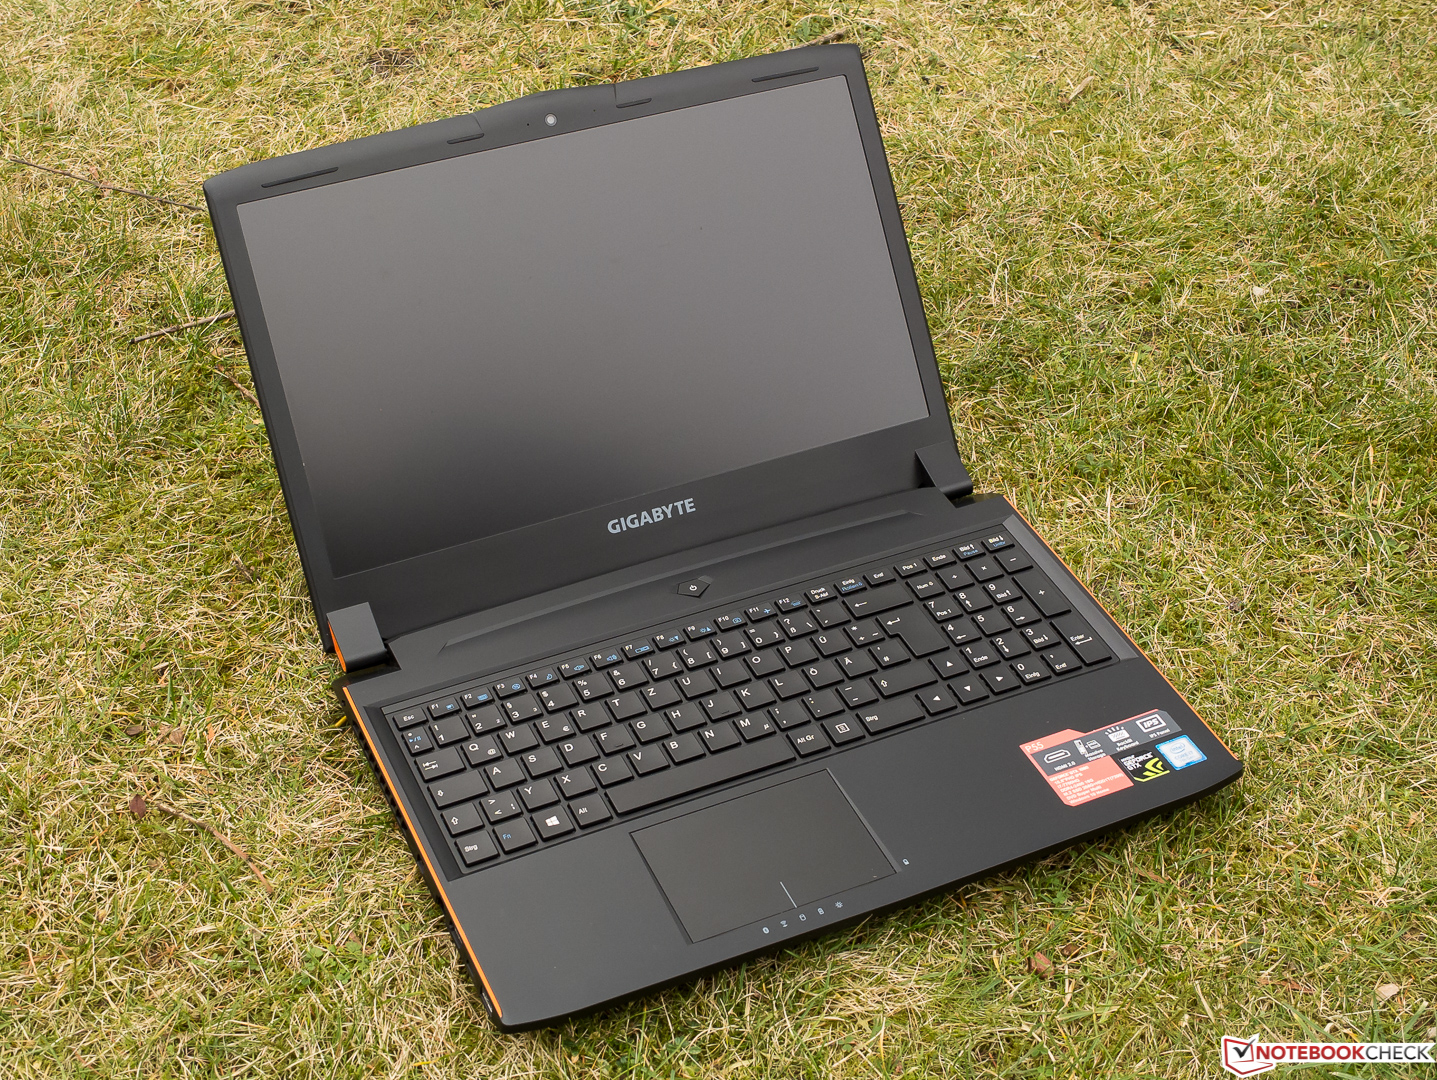
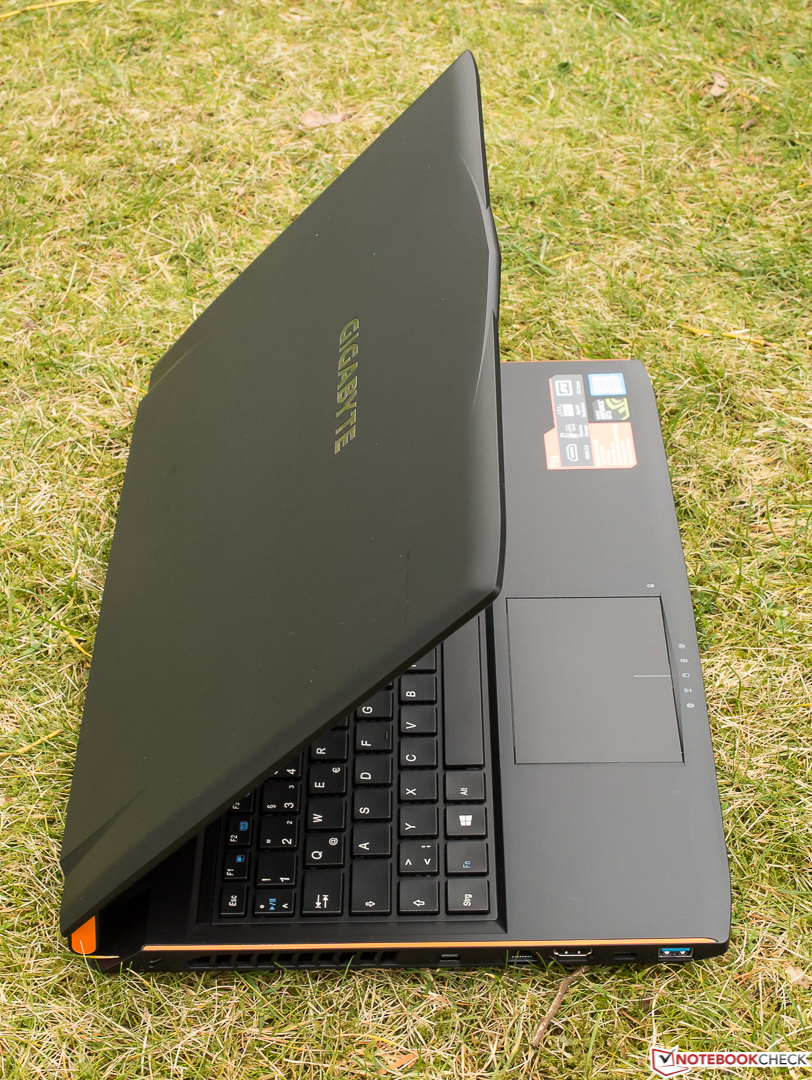
技嘉又一次在合适的地方做了一些缩减,让P55W v7这台总体上来说不错的笔记本电脑与其他游戏本相争。通过省去的特性诸如Thunderbolt 3与G-Sync让用户生下数百欧元----这些妥协无关性能。
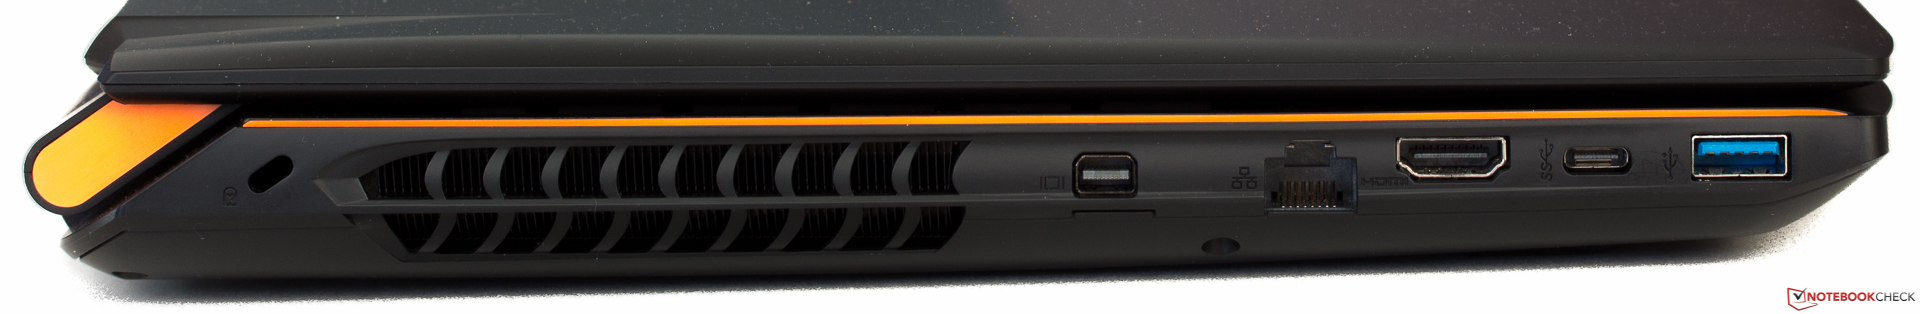
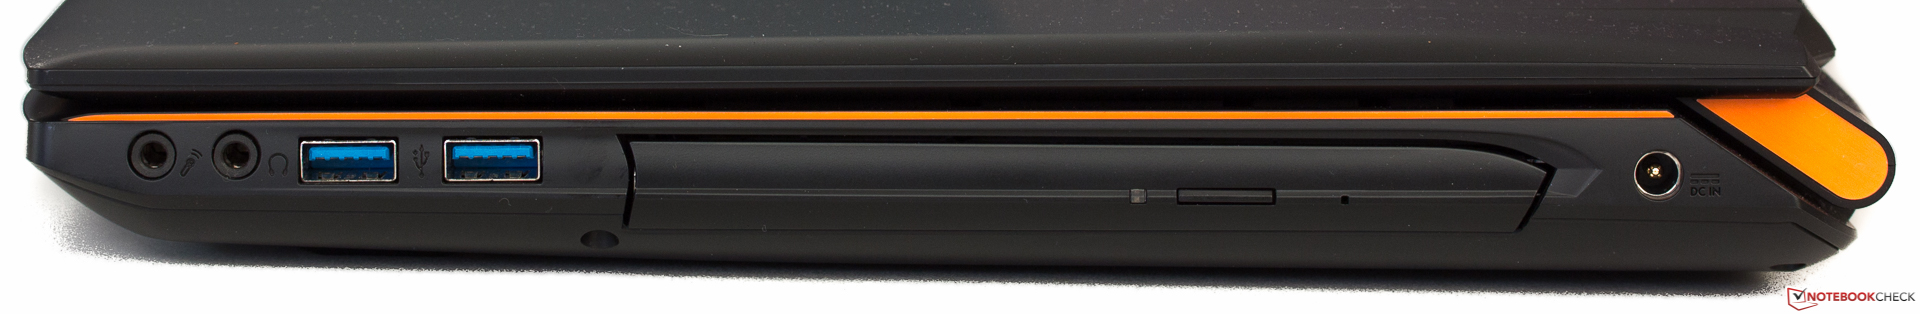
仅考虑相对较低的价格,我们对它的输入设备以及IPS屏幕十分满意,但后者有一些限制。同样对坚固的塑料外壳及易于移除的底壳我们也很满意。但接口的排布,相对较慢的屏幕响应时间以及和原来一样无法令人完全满意的SSD并不让人喜欢。高负载下的高频噪音是技嘉P55W v7的唯一真正缺点。但这个可能是特殊情况。因此,它值得推荐但需要注意噪声。
注:本文是基于完整评测的缩减版本,阅读完整的英文评测,请点击这里。
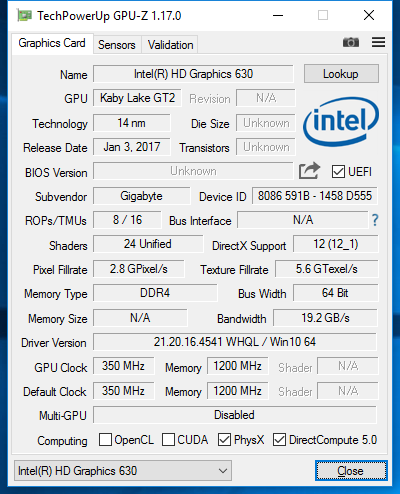
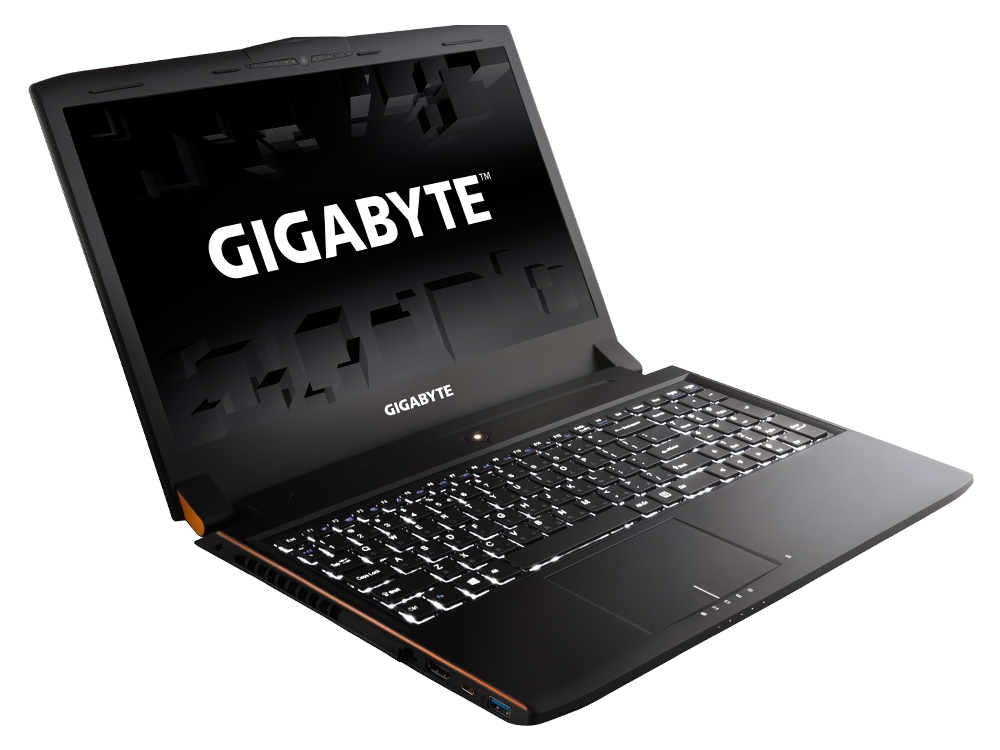
Gigabyte P55W v7
-
02/28/2017 v6(old)
Sven Kloevekorn