 Deutsch
 English
 Español
 Français
 Italiano
 Nederlands
 Polski
 Português
 Русский
 Türkçe
 Svenska
 Chinese
 Magyar
三星 Notebook 9 NP900X3N (i5-7200U, 全高清)笔记本电脑简短评测

| SD Card Reader | |
| average JPG Copy Test (av. of 3 runs) | |
| Dell XPS 13 9360 FHD i5 | |
| Samsung Notebook 9 NP900X5N-X01US | |
| Samsung Notebook 9 NP900X3N-K01US | |
| maximum AS SSD Seq Read Test (1GB) | |
| Dell XPS 13 9360 FHD i5 | |
| Samsung Notebook 9 NP900X3N-K01US | |
| Samsung Notebook 9 NP900X5N-X01US | |
| Networking | |
| iperf3 transmit AX12 | |
| HP Spectre 13-v131ng | |
| Dell XPS 13 9360 FHD i5 | |
| Samsung Notebook 9 NP900X3N-K01US | |
| iperf3 receive AX12 | |
| Samsung Notebook 9 NP900X3N-K01US | |
| Dell XPS 13 9360 FHD i5 | |
| HP Spectre 13-v131ng | |
| |||||||||||||||||||||||||
Brightness Distribution: 90 %
Center on Battery: 510.7 cd/m²
Contrast: 774:1 (Black: 0.66 cd/m²)
ΔE Color 2.4 | 0.5-29.43 Ø5
ΔE Greyscale 2.4 | 0.57-98 Ø5.3
88.1% sRGB (Argyll 1.6.3 3D)
57% AdobeRGB 1998 (Argyll 1.6.3 3D)
64% AdobeRGB 1998 (Argyll 2.2.0 3D)
88.6% sRGB (Argyll 2.2.0 3D)
63.4% Display P3 (Argyll 2.2.0 3D)
Gamma: 2.23
| Samsung Notebook 9 NP900X3N-K01US ID: BOE06E1, Name: NV133FHB-N31, IPS, 13.30, 1920x1080 | HP Spectre 13-v131ng CMN1374, IPS UWVA, 13.30, 1920x1080 | Dell XPS 13 9360 FHD i5 Sharp SHP1449 LQ133M1, IPS, 13.30, 1920x1080 | Apple MacBook Pro 13 2017 APPA033, IPS, 13.30, 2560x1600 | Lenovo Yoga 910-13IKB-80VF004CGE AU Optronics AUO323D / B139HAN03.2, IPS, 13.90, 3840x2160 | |
|---|---|---|---|---|---|
| Display | 1% | -20% | 35% | -0% | |
| Display P3 Coverage | 63.4 | 64.6 2% | 48.94 -23% | 99.2 56% | 62.2 -2% |
| sRGB Coverage | 88.6 | 88.8 0% | 73.3 -17% | 99.9 13% | 90.1 2% |
| AdobeRGB 1998 Coverage | 64 | 64.8 1% | 50.5 -21% | 87.1 36% | 63.5 -1% |
| Response Times | -4% | 12% | 6% | 9% | |
| Response Time Grey 50% / Grey 80% * | 41.6 ? | 46 ? -11% | 32.8 ? 21% | 42.8 ? -3% | 46 ? -11% |
| Response Time Black / White * | 34 ? | 33 ? 3% | 33.2 ? 2% | 28.8 ? 15% | 24 ? 29% |
| PWM Frequency | 210.1 ? | ||||
| Screen | -26% | -30% | 29% | -49% | |
| Brightness middle | 510.7 | 404 -21% | 351.2 -31% | 588 15% | 348 -32% |
| Brightness | 481 | 382 -21% | 325 -32% | 561 17% | 310 -36% |
| Brightness Distribution | 90 | 91 1% | 89 -1% | 92 2% | 80 -11% |
| Black Level * | 0.66 | 0.35 47% | 0.195 70% | 0.45 32% | 0.25 62% |
| Contrast | 774 | 1154 49% | 1801 133% | 1307 69% | 1392 80% |
| Colorchecker dE 2000 * | 2.4 | 5.37 -124% | 7.4 -208% | 1.7 29% | 7.86 -228% |
| Colorchecker dE 2000 max. * | 7.3 | 9.46 -30% | 9.08 -24% | 3.5 52% | 13.43 -84% |
| Greyscale dE 2000 * | 2.4 | 6.44 -168% | 6.71 -180% | 1.9 21% | 8.25 -244% |
| Gamma | 2.23 99% | 2.52 87% | 2.74 80% | 2.33 94% | 2.05 107% |
| CCT | 6747 96% | 6738 96% | 7222 90% | 6738 96% | 6834 95% |
| Color Space (Percent of AdobeRGB 1998) | 57 | 58 2% | 50.48 -11% | 77.92 37% | 58 2% |
| Color Space (Percent of sRGB) | 88.1 | 89 1% | 73.31 -17% | 99.94 13% | 90 2% |
| Total Average (Program / Settings) | -10% /
-18% | -13% /
-23% | 23% /
27% | -13% /
-31% |
* ... smaller is better
Display Response Times
| ↔ Response Time Black to White | ||
|---|---|---|
| 34 ms ... rise ↗ and fall ↘ combined | ↗ 20 ms rise | 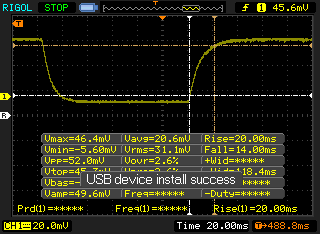 |
| ↘ 14 ms fall | ||
| The screen shows slow response rates in our tests and will be unsatisfactory for gamers. In comparison, all tested devices range from 0.1 (minimum) to 240 (maximum) ms. » 89 % of all devices are better. This means that the measured response time is worse than the average of all tested devices (21.5 ms). | ||
| ↔ Response Time 50% Grey to 80% Grey | ||
| 41.6 ms ... rise ↗ and fall ↘ combined | ↗ 22.8 ms rise |  |
| ↘ 18.8 ms fall | ||
| The screen shows slow response rates in our tests and will be unsatisfactory for gamers. In comparison, all tested devices range from 0.2 (minimum) to 636 (maximum) ms. » 62 % of all devices are better. This means that the measured response time is worse than the average of all tested devices (33.8 ms). | ||
Screen Flickering / PWM (Pulse-Width Modulation)
| Screen flickering / PWM detected | 210.1 Hz | ≤ 99 % brightness setting | 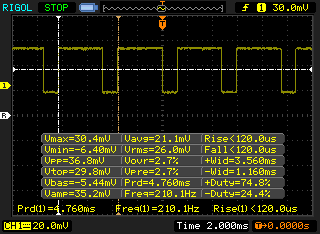 |
The display backlight flickers at 210.1 Hz (worst case, e.g., utilizing PWM) Flickering detected at a brightness setting of 99 % and below. There should be no flickering or PWM above this brightness setting. The frequency of 210.1 Hz is relatively low, so sensitive users will likely notice flickering and experience eyestrain at the stated brightness setting and below. In comparison: 53 % of all tested devices do not use PWM to dim the display. If PWM was detected, an average of 17933 (minimum: 5 - maximum: 3846000) Hz was measured. | |||
| wPrime 2.10 - 1024m | |
| Toshiba Tecra A50-C1510W10 | |
| Apple MacBook Pro 13 2017 Touchbar i5 | |
| Samsung Notebook 9 NP900X3N-K01US | |
| HP Envy 13-ad065nr | |
| Samsung Notebook 9 NP900X5N-X01US | |
* ... smaller is better
| PCMark 8 | |
| Home Score Accelerated v2 | |
| Samsung Notebook 9 NP900X5N-X01US | |
| HP Spectre 13-v131ng | |
| Samsung Notebook 9 NP900X3N-K01US | |
| Dell XPS 13 9360 FHD i5 | |
| Work Score Accelerated v2 | |
| HP Spectre 13-v131ng | |
| Samsung Notebook 9 NP900X5N-X01US | |
| Samsung Notebook 9 NP900X3N-K01US | |
| Dell XPS 13 9360 FHD i5 | |
| Creative Score Accelerated v2 | |
| Samsung Notebook 9 NP900X5N-X01US | |
| HP Spectre 13-v131ng | |
| Samsung Notebook 9 NP900X3N-K01US | |
| Dell XPS 13 9360 FHD i5 | |
| PCMark 8 Home Score Accelerated v2 | 3728 points | |
| PCMark 8 Creative Score Accelerated v2 | 4577 points | |
| PCMark 8 Work Score Accelerated v2 | 4786 points | |
| PCMark 10 Score | 3449 points | |
Help | ||
| Samsung Notebook 9 NP900X3N-K01US Samsung CM871a MZNTY256HDHP | HP Spectre 13-v131ng Samsung PM961 NVMe MZVLW512HMJP | Dell XPS 13 9360 FHD i5 Toshiba NVMe THNSN5256GPUK | Lenovo Yoga 910-13IKB-80VF004CGE Samsung PM951 NVMe MZVLV512 | Asus Zenbook 3 UX390UA-GS041T SK Hynix Canvas SC300 512GB M.2 (HFS512G39MND) | |
|---|---|---|---|---|---|
| AS SSD | 155% | 33% | 71% | -12% | |
| Copy Game MB/s | 186.8 | 397.9 113% | 390 109% | 189.4 1% | |
| Copy Program MB/s | 213 | 426 100% | 188 -12% | 204.3 -4% | |
| Copy ISO MB/s | 335.9 | 720 114% | 283.3 -16% | 293.5 -13% | |
| Score Total | 1057 | 3617 242% | 1607 52% | 1865 76% | 1056 0% |
| Score Write | 350 | 1115 219% | 327 -7% | 611 75% | 374 7% |
| Score Read | 463 | 1654 257% | 870 88% | 850 84% | 448 -3% |
| Access Time Write * | 0.053 | 0.026 51% | 0.035 34% | 0.028 47% | 0.11 -108% |
| Access Time Read * | 0.066 | 0.042 36% | 0.055 17% | 0.034 48% | 0.076 -15% |
| 4K-64 Write | 223.8 | 862 285% | 197.7 -12% | 422.2 89% | 271.4 21% |
| 4K-64 Read | 379.4 | 1465 286% | 723 91% | 671 77% | 370.3 -2% |
| 4K Write | 79.2 | 134.4 70% | 92 16% | 132.9 68% | 56.8 -28% |
| 4K Read | 31.24 | 56.4 81% | 29.52 -6% | 39.92 28% | 25.89 -17% |
| Seq Write | 466 | 1190 155% | 372.8 -20% | 560 20% | 463.4 -1% |
| Seq Read | 520 | 1325 155% | 1179 127% | 1389 167% | 514 -1% |
* ... smaller is better

| 3DMark 11 Performance | 1695 points | |
| 3DMark Ice Storm Standard Score | 64405 points | |
| 3DMark Cloud Gate Standard Score | 6418 points | |
| 3DMark Fire Strike Score | 892 points | |
| 3DMark Fire Strike Extreme Score | 411 points | |
Help | ||
| low | med. | high | ultra | |
| BioShock Infinite (2013) | 42.6 | 26 | 24.7 | 7.6 |
| Rise of the Tomb Raider (2016) | 20 |
Noise Level
| Idle |
| 28.4 / 28.4 / 28.4 dB(A) |
| Load |
| 33.2 / 35.2 dB(A) |
 | ||
30 dB silent 40 dB(A) audible 50 dB(A) loud |
||
min: | ||
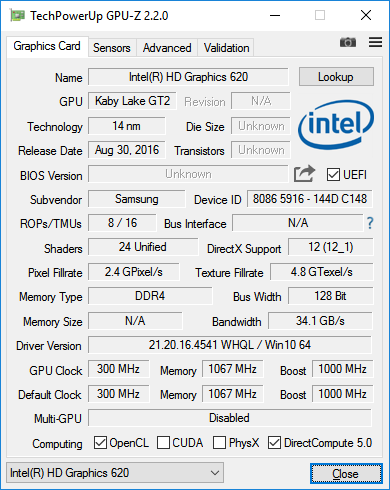
| Samsung Notebook 9 NP900X3N-K01US HD Graphics 620, i5-7200U, Samsung CM871a MZNTY256HDHP | HP Spectre 13-v131ng HD Graphics 620, i7-7500U, Samsung PM961 NVMe MZVLW512HMJP | Dell XPS 13 9360 FHD i5 HD Graphics 620, i5-7200U, Toshiba NVMe THNSN5256GPUK | Lenovo Yoga 910-13IKB-80VF004CGE HD Graphics 620, i7-7500U, Samsung PM951 NVMe MZVLV512 | Apple MacBook Pro 13 2017 Iris Plus Graphics 640, i5-7360U, Apple SSD AP0128 | Asus Zenbook 3 UX390UA-GS041T HD Graphics 620, i5-7200U, SK Hynix Canvas SC300 512GB M.2 (HFS512G39MND) | |
|---|---|---|---|---|---|---|
| Noise | -10% | 1% | -11% | -6% | -10% | |
| off / environment * | 28.4 | 30.4 -7% | 31.7 -12% | 30.2 -6% | 30.7 -8% | |
| Idle Minimum * | 28.4 | 30.4 -7% | 28.9 -2% | 31.7 -12% | 30.2 -6% | 30.7 -8% |
| Idle Average * | 28.4 | 30.4 -7% | 28.9 -2% | 31.7 -12% | 30.2 -6% | 30.7 -8% |
| Idle Maximum * | 28.4 | 30.4 -7% | 28.9 -2% | 31.7 -12% | 30.2 -6% | 30.9 -9% |
| Load Average * | 33.2 | 40 -20% | 30.9 7% | 38.4 -16% | 32.9 1% | 38.7 -17% |
| Load Maximum * | 35.2 | 40 -14% | 33.5 5% | 34.7 1% | 39.3 -12% | 38.9 -11% |
* ... smaller is better
(+) The maximum temperature on the upper side is 39.8 °C / 104 F, compared to the average of 35.9 °C / 97 F, ranging from 21.4 to 59 °C for the class Subnotebook.
(+) The bottom heats up to a maximum of 38.8 °C / 102 F, compared to the average of 39.4 °C / 103 F
(+) In idle usage, the average temperature for the upper side is 24.2 °C / 76 F, compared to the device average of 30.7 °C / 87 F.
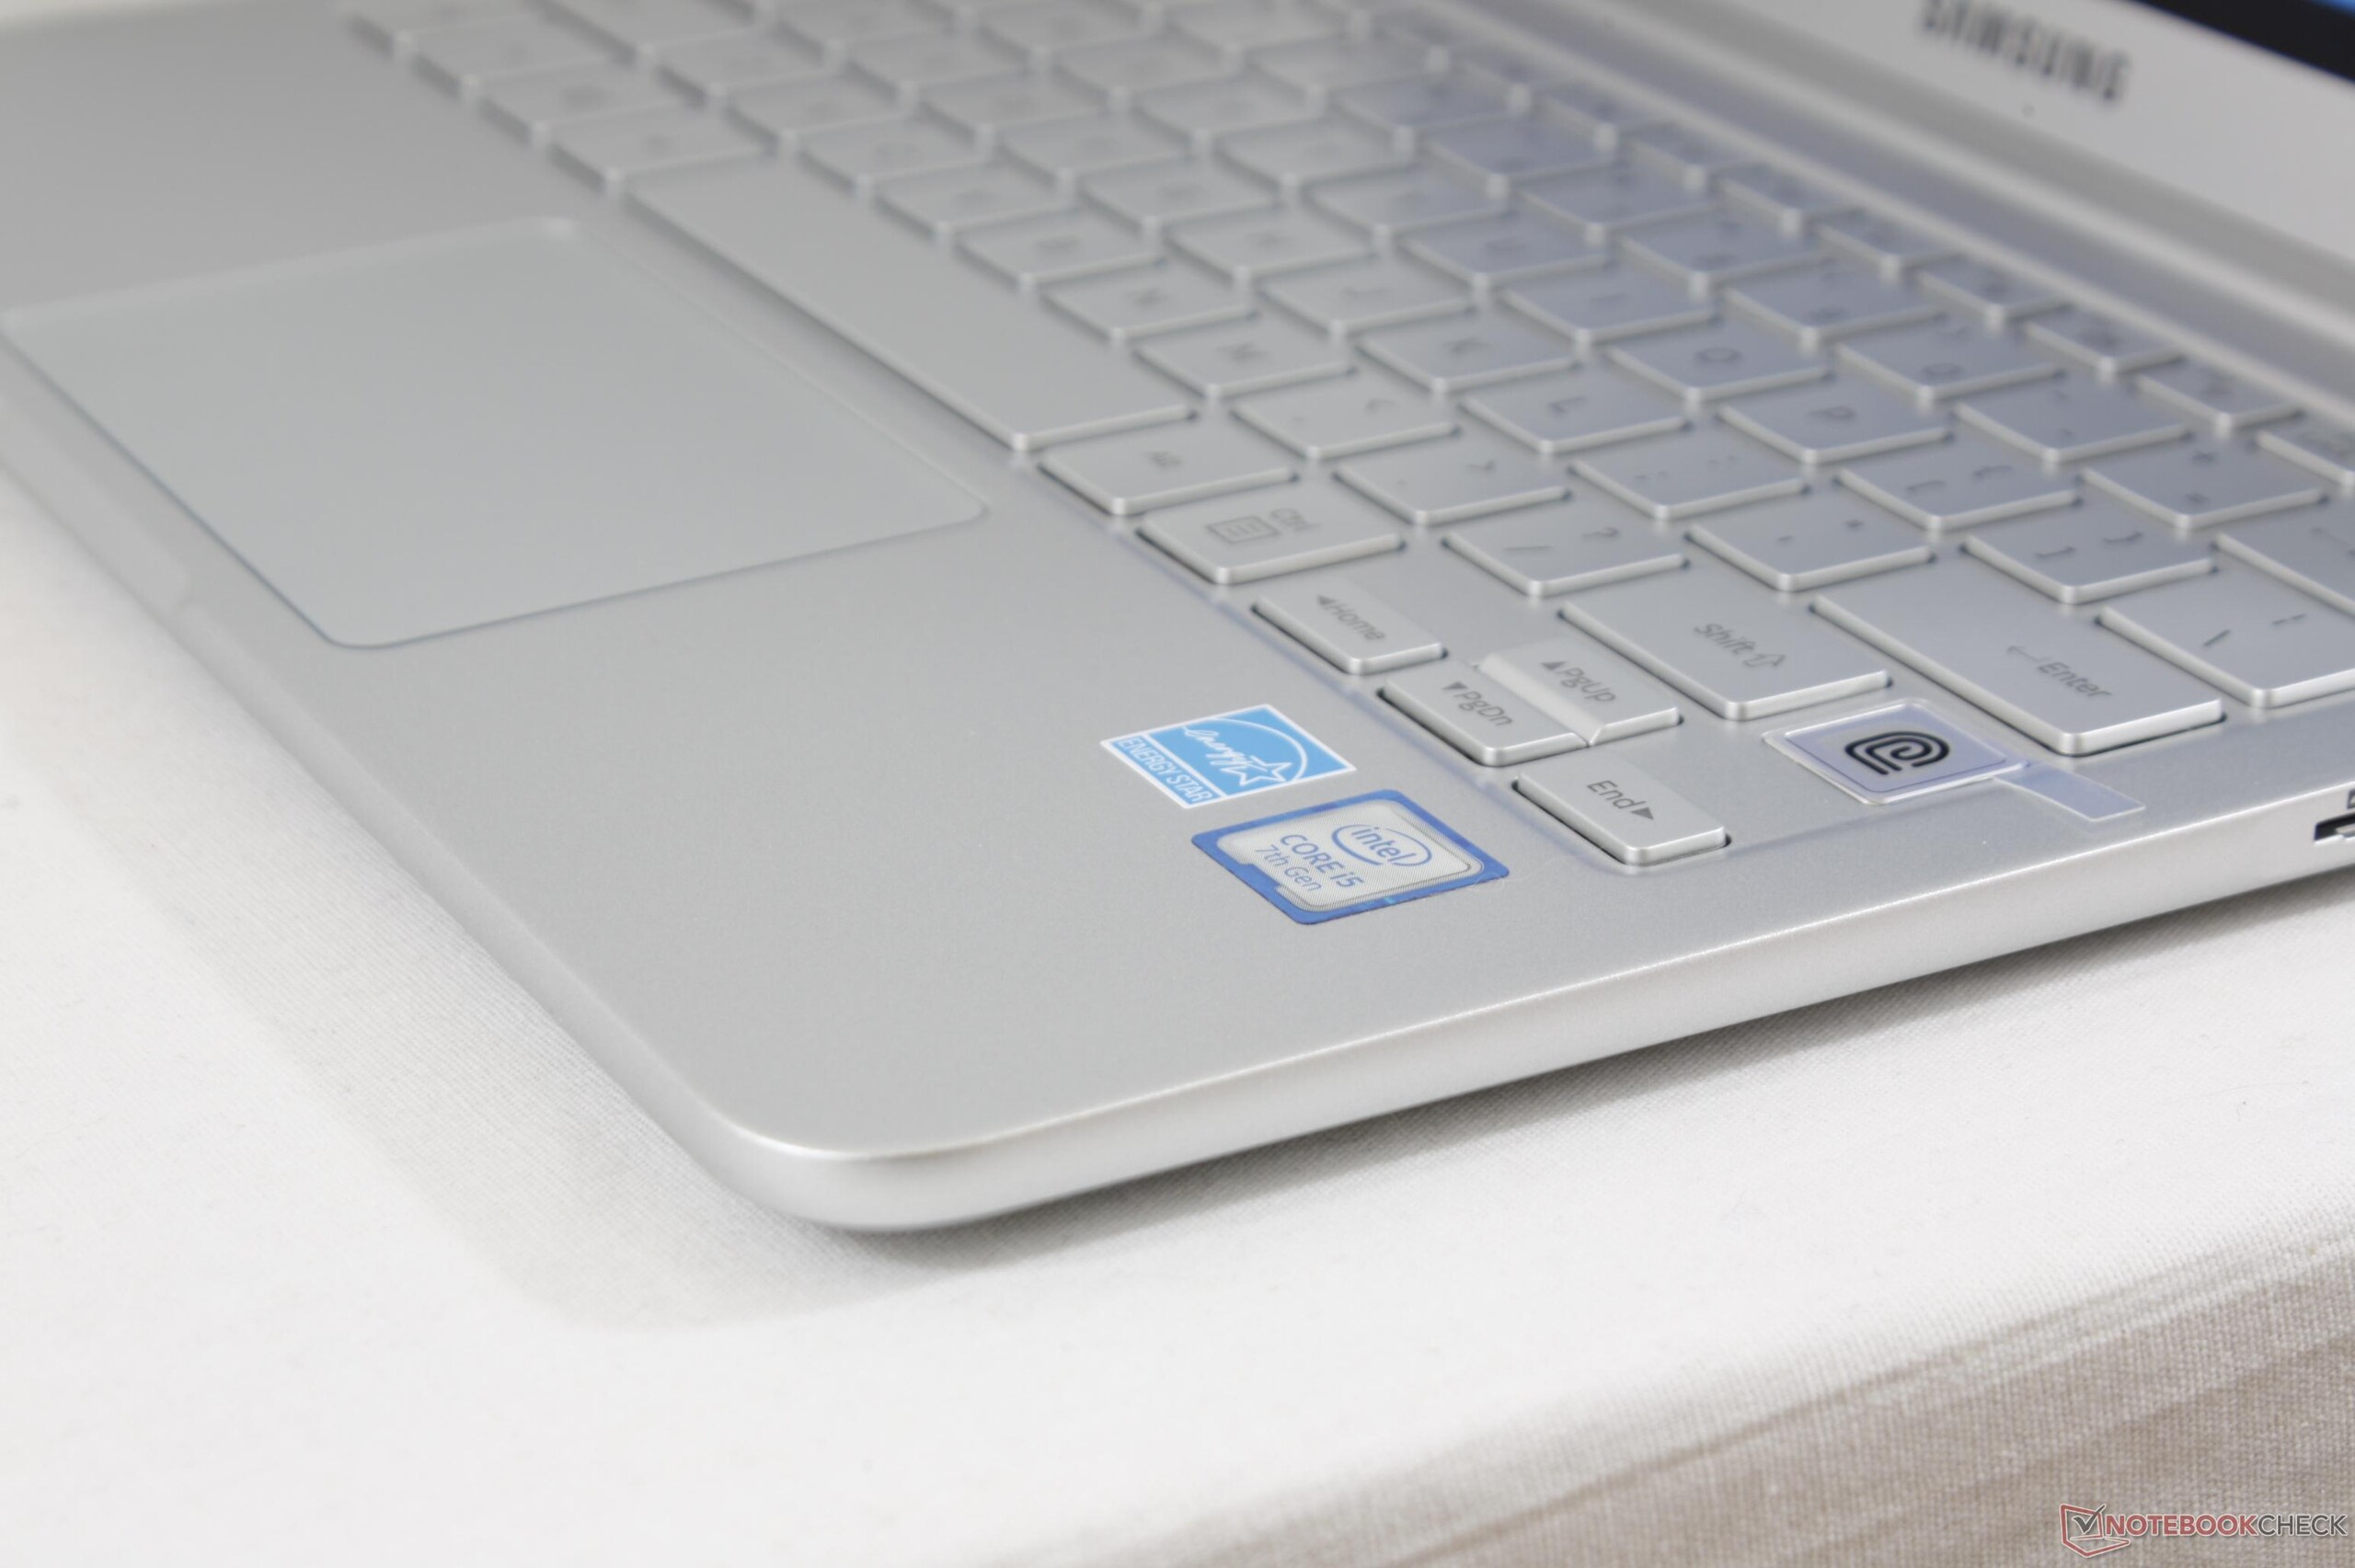
(+) The palmrests and touchpad are cooler than skin temperature with a maximum of 25.2 °C / 77.4 F and are therefore cool to the touch.
(+) The average temperature of the palmrest area of similar devices was 28.3 °C / 82.9 F (+3.1 °C / 5.5 F).
Samsung Notebook 9 NP900X3N-K01US audio analysis
(-) | not very loud speakers (61.9 dB)
Bass 100 - 315 Hz
(-) | nearly no bass - on average 19.4% lower than median
(±) | linearity of bass is average (12.6% delta to prev. frequency)
Mids 400 - 2000 Hz
(+) | balanced mids - only 3.5% away from median
(±) | linearity of mids is average (11.7% delta to prev. frequency)
Highs 2 - 16 kHz
(+) | balanced highs - only 2.7% away from median
(±) | linearity of highs is average (9% delta to prev. frequency)
Overall 100 - 16.000 Hz
(±) | linearity of overall sound is average (27.4% difference to median)
Compared to same class
» 86% of all tested devices in this class were better, 4% similar, 10% worse
» The best had a delta of 5%, average was 19%, worst was 53%
Compared to all devices tested
» 81% of all tested devices were better, 4% similar, 15% worse
» The best had a delta of 4%, average was 25%, worst was 134%
Apple MacBook 12 (Early 2016) 1.1 GHz audio analysis
(+) | speakers can play relatively loud (83.6 dB)
Bass 100 - 315 Hz
(±) | reduced bass - on average 11.3% lower than median
(±) | linearity of bass is average (14.2% delta to prev. frequency)
Mids 400 - 2000 Hz
(+) | balanced mids - only 2.4% away from median
(+) | mids are linear (5.5% delta to prev. frequency)
Highs 2 - 16 kHz
(+) | balanced highs - only 2% away from median
(+) | highs are linear (4.5% delta to prev. frequency)
Overall 100 - 16.000 Hz
(+) | overall sound is linear (10.2% difference to median)
Compared to same class
» 5% of all tested devices in this class were better, 2% similar, 93% worse
» The best had a delta of 5%, average was 19%, worst was 53%
Compared to all devices tested
» 3% of all tested devices were better, 1% similar, 96% worse
» The best had a delta of 4%, average was 25%, worst was 134%
| Off / Standby | |
| Idle | |
| Load |
|
| Samsung Notebook 9 NP900X3N-K01US i5-7200U, HD Graphics 620, Samsung CM871a MZNTY256HDHP, IPS, 1920x1080, 13.30 | HP Spectre 13-v131ng i7-7500U, HD Graphics 620, Samsung PM961 NVMe MZVLW512HMJP, IPS UWVA, 1920x1080, 13.30 | Dell XPS 13 9360 FHD i5 i5-7200U, HD Graphics 620, Toshiba NVMe THNSN5256GPUK, IPS, 1920x1080, 13.30 | Lenovo Yoga 910-13IKB-80VF004CGE i7-7500U, HD Graphics 620, Samsung PM951 NVMe MZVLV512, IPS, 3840x2160, 13.90 | Apple MacBook Pro 13 2017 i5-7360U, Iris Plus Graphics 640, Apple SSD AP0128, IPS, 2560x1600, 13.30 | Asus Zenbook 3 UX390UA-GS041T i5-7200U, HD Graphics 620, SK Hynix Canvas SC300 512GB M.2 (HFS512G39MND), IPS, 1920x1080, 12.50 | |
|---|---|---|---|---|---|---|
| Power Consumption | 16% | 34% | 16% | 7% | 23% | |
| Idle Minimum * | 3.8 | 3.6 5% | 4.1 -8% | 4.3 -13% | 3.7 3% | 3.3 13% |
| Idle Average * | 11 | 6.4 42% | 4.2 62% | 6.3 43% | 5.2 53% | 6.2 44% |
| Idle Maximum * | 11.3 | 9.2 19% | 5.1 55% | 9 20% | 7.6 33% | 10.4 8% |
| Load Average * | 35.6 | 34 4% | 22.1 38% | 32.7 8% | 41.6 -17% | 28 21% |
| Load Maximum * | 37.2 | 34.4 8% | 29.4 21% | 28.8 23% | 50.5 -36% | 25.7 31% |
* ... smaller is better
| Samsung Notebook 9 NP900X3N-K01US i5-7200U, HD Graphics 620, 30 Wh | HP Spectre 13-v131ng i7-7500U, HD Graphics 620, 38 Wh | Dell XPS 13 9360 FHD i5 i5-7200U, HD Graphics 620, 60 Wh | Lenovo Yoga 910-13IKB-80VF004CGE i7-7500U, HD Graphics 620, 78 Wh | Apple MacBook Pro 13 2017 i5-7360U, Iris Plus Graphics 640, 54.5 Wh | Asus Zenbook 3 UX390UA-GS041T i5-7200U, HD Graphics 620, 40 Wh | |
|---|---|---|---|---|---|---|
| Battery Runtime | 24% | 130% | 125% | 87% | 46% | |
| Reader / Idle | 695 | 718 3% | 1295 86% | 1069 54% | 844 21% | |
| WiFi v1.3 | 279 | 394 41% | 677 143% | 644 131% | 681 144% | 397 42% |
| Load | 60 | 77 28% | 157 162% | 174 190% | 78 30% | 105 75% |
Pros
Cons
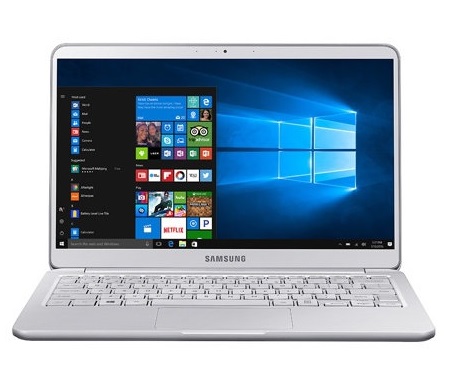
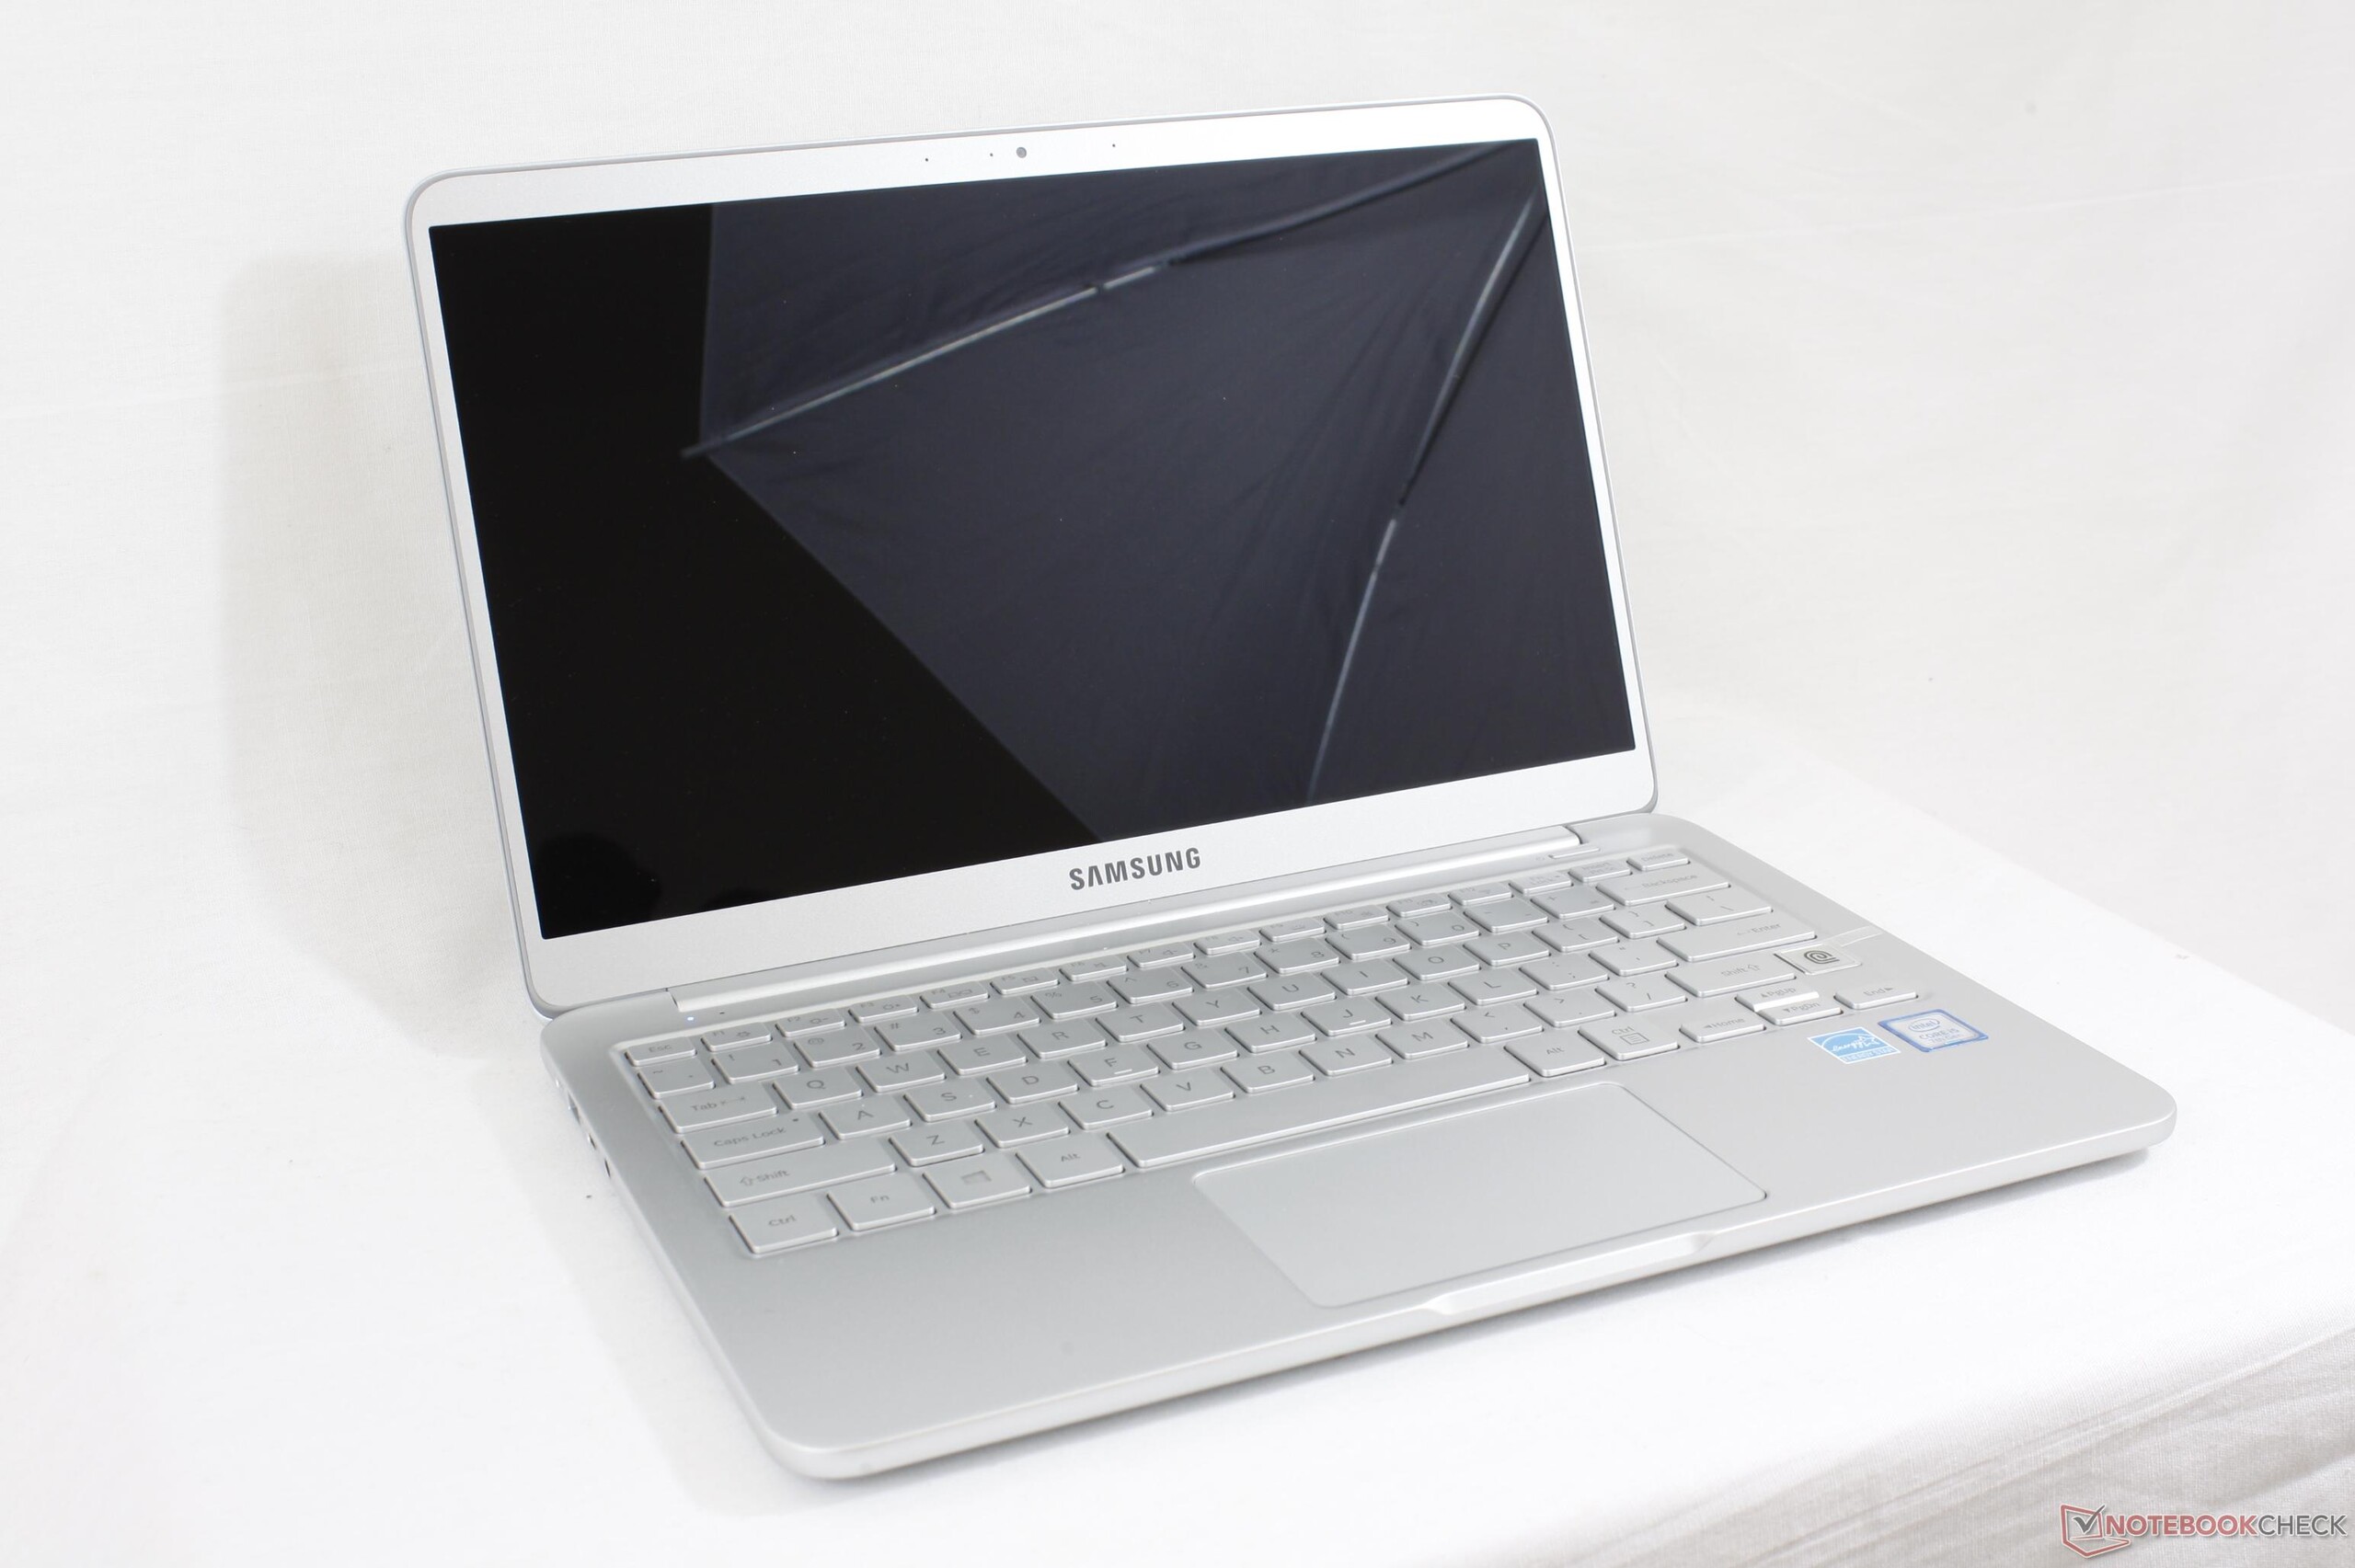
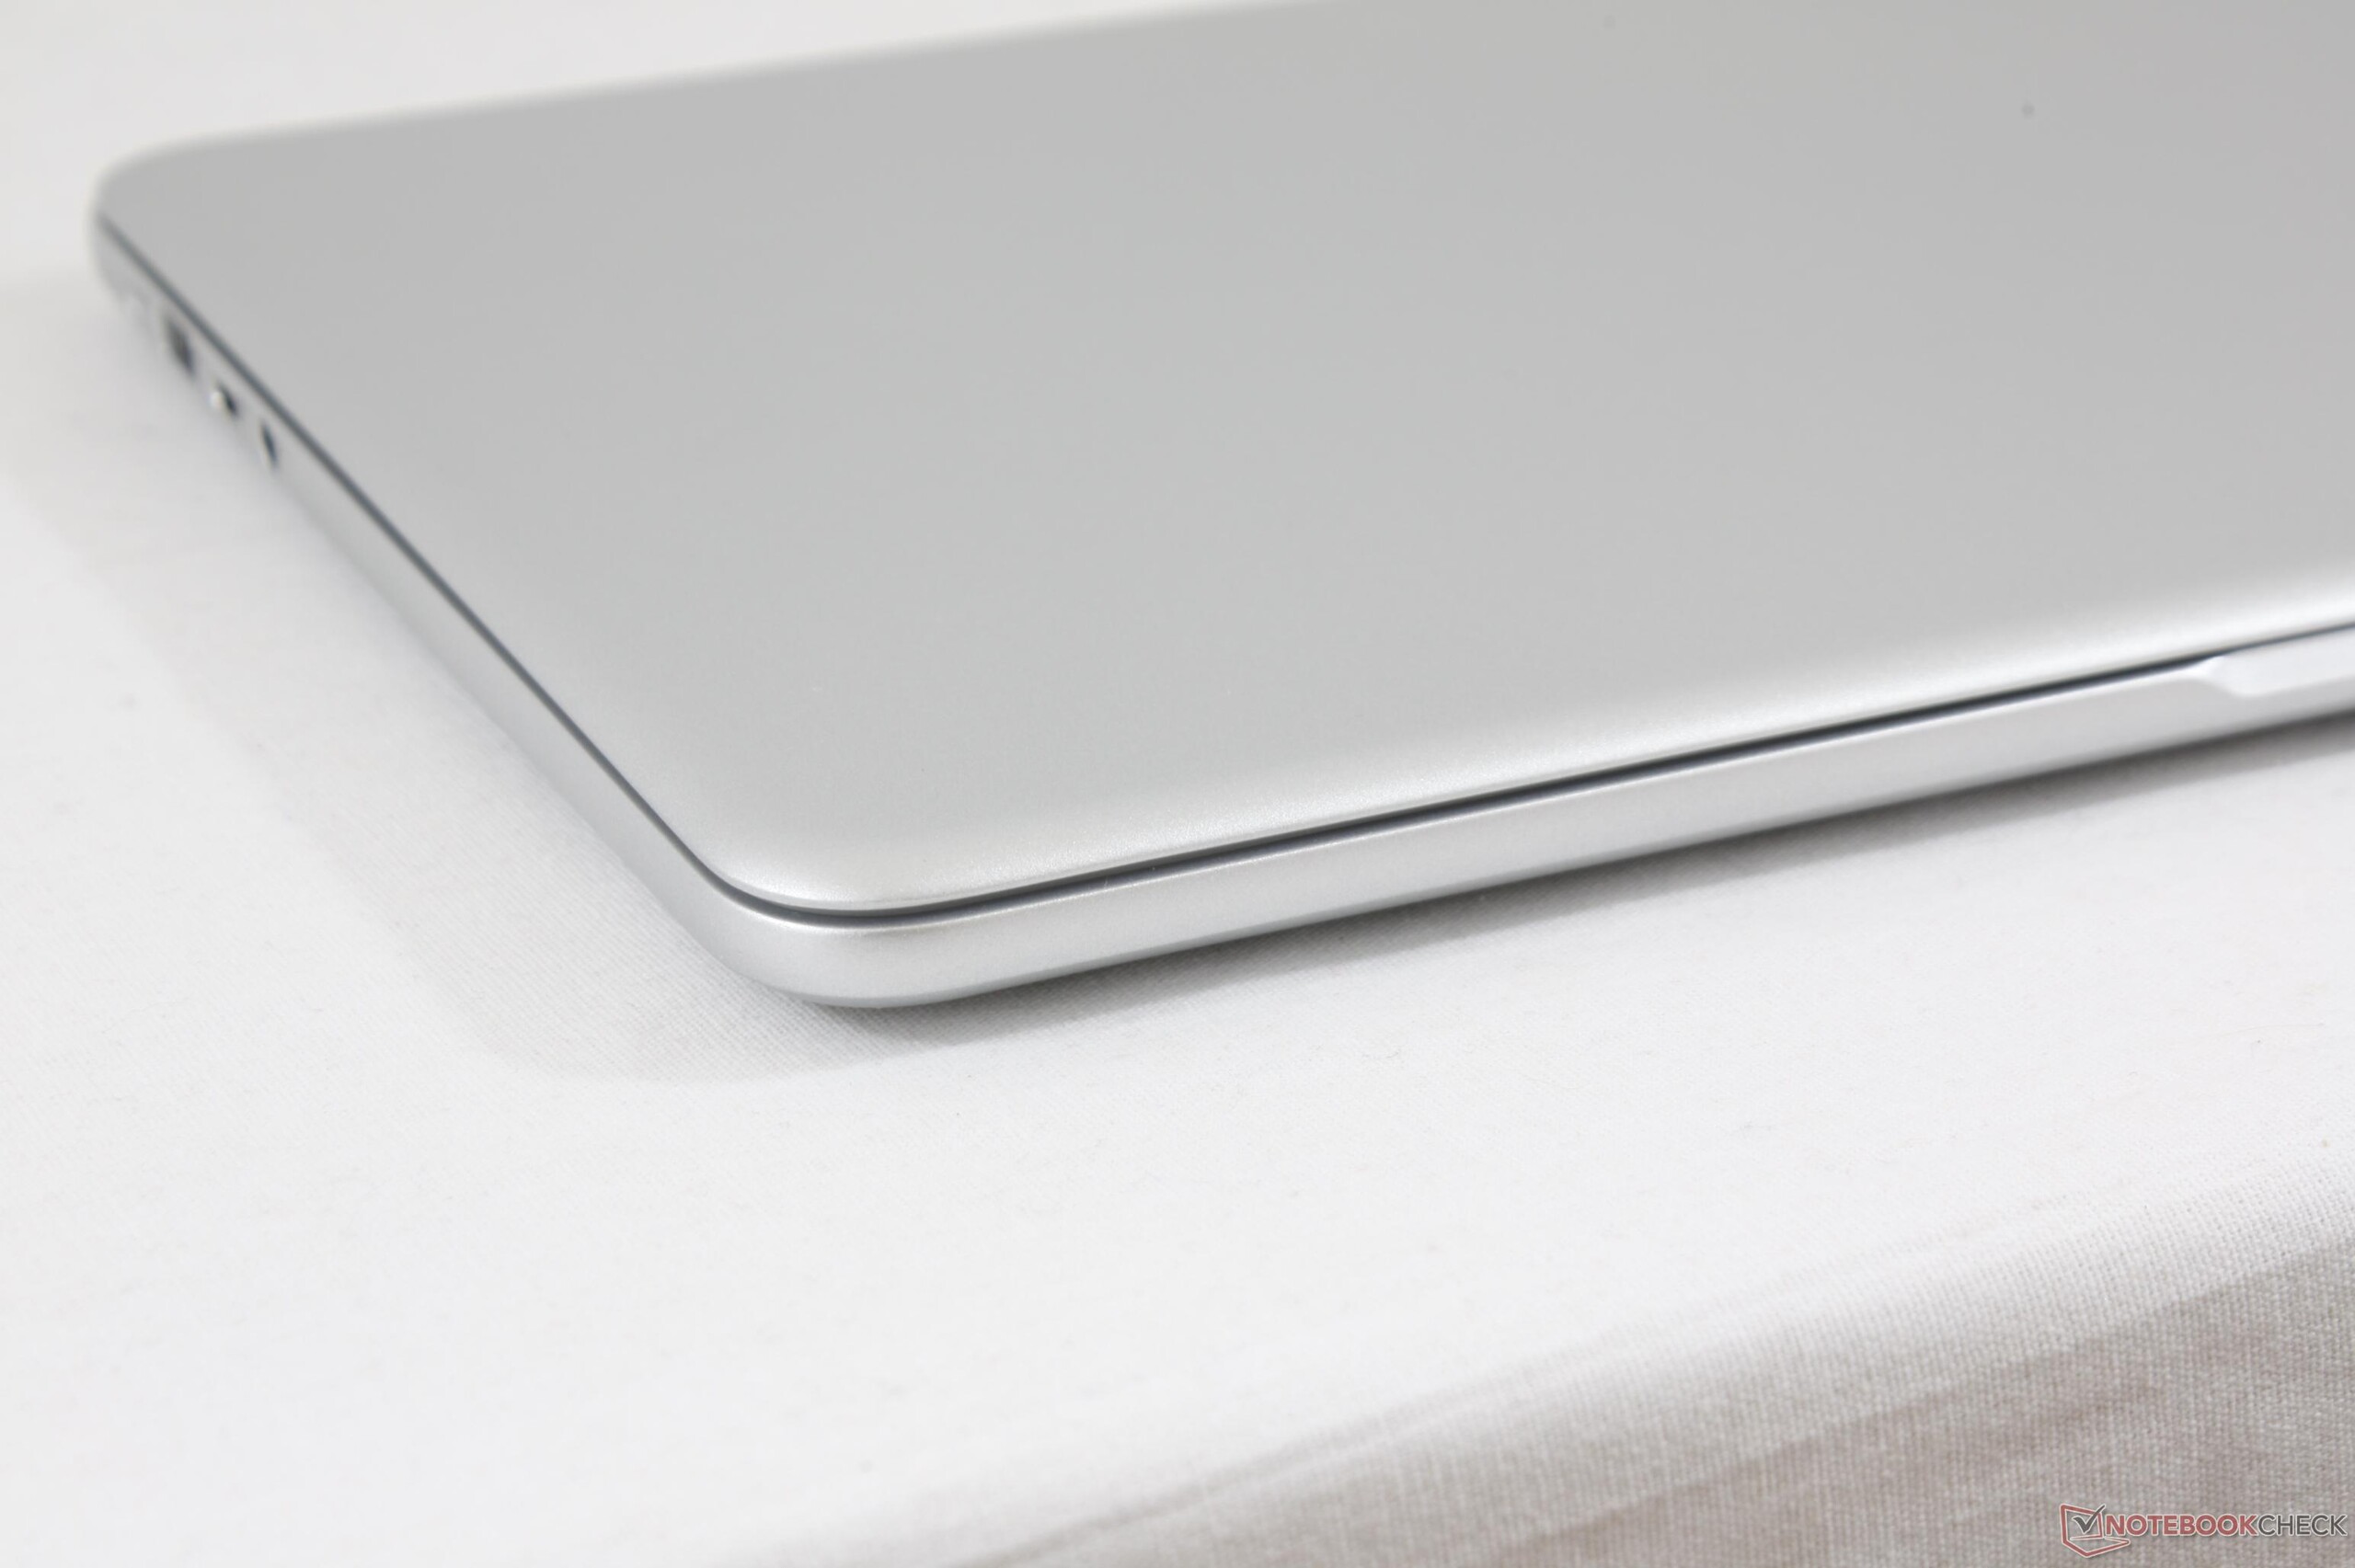
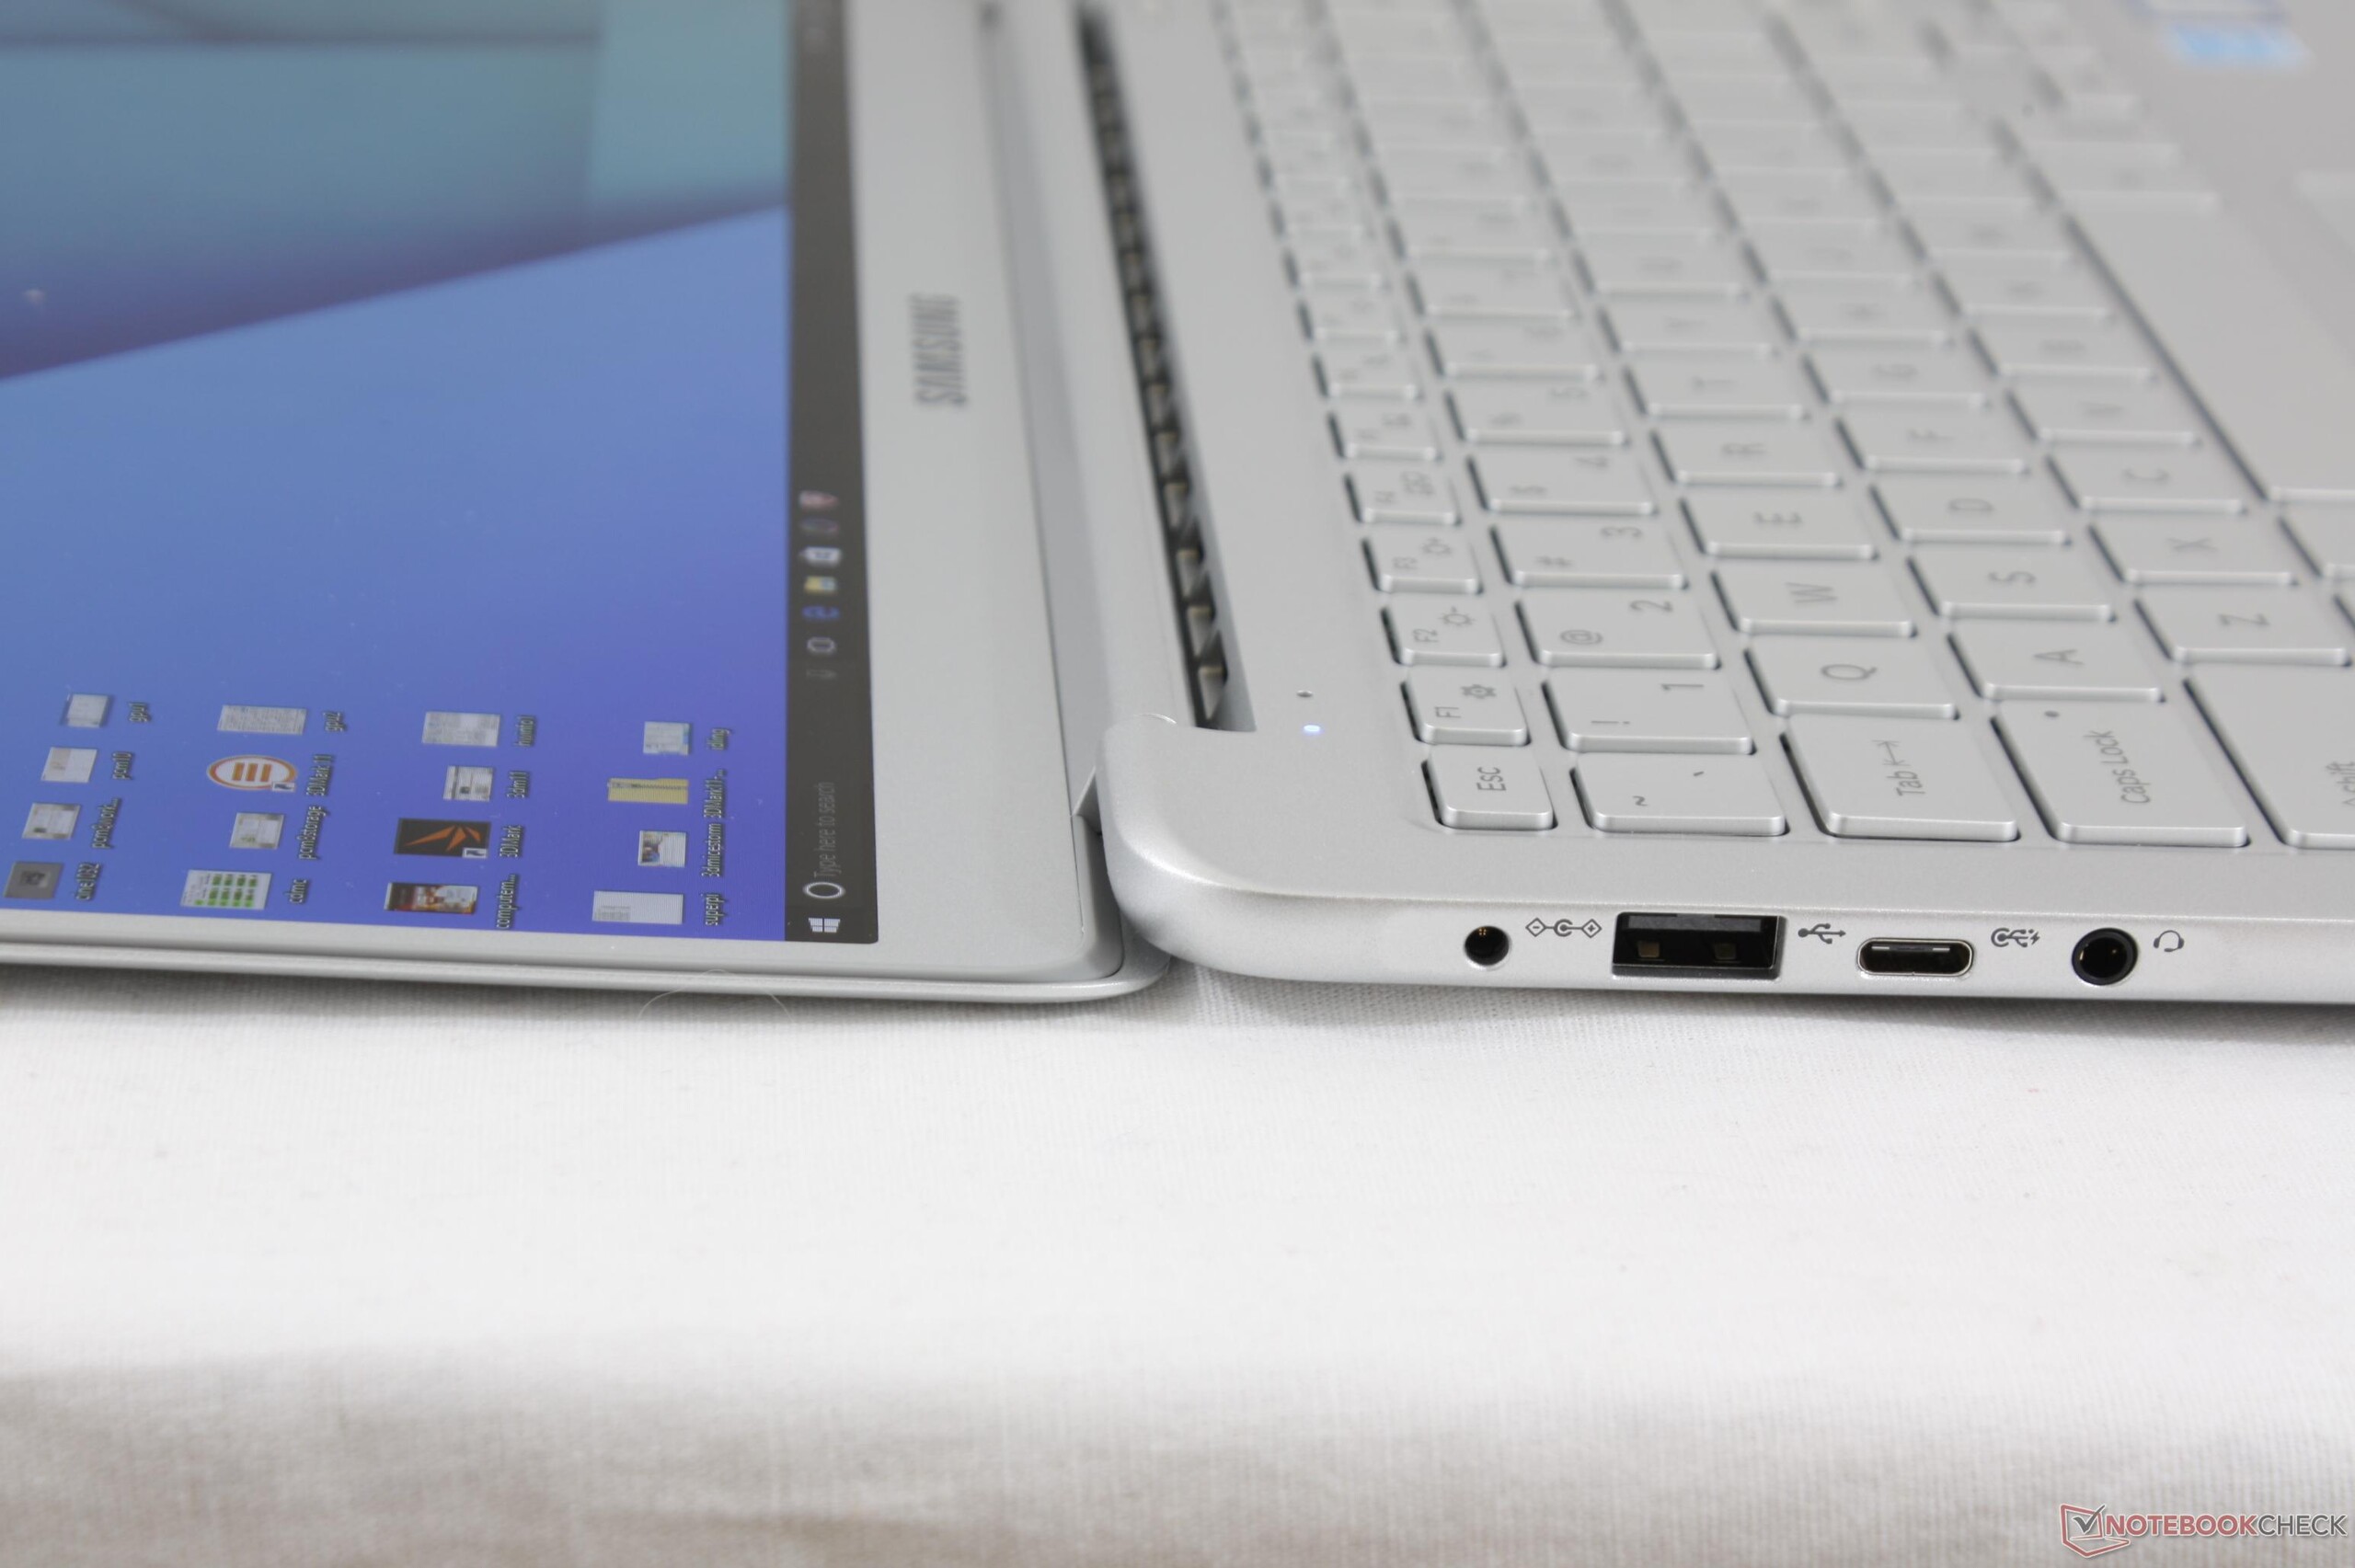
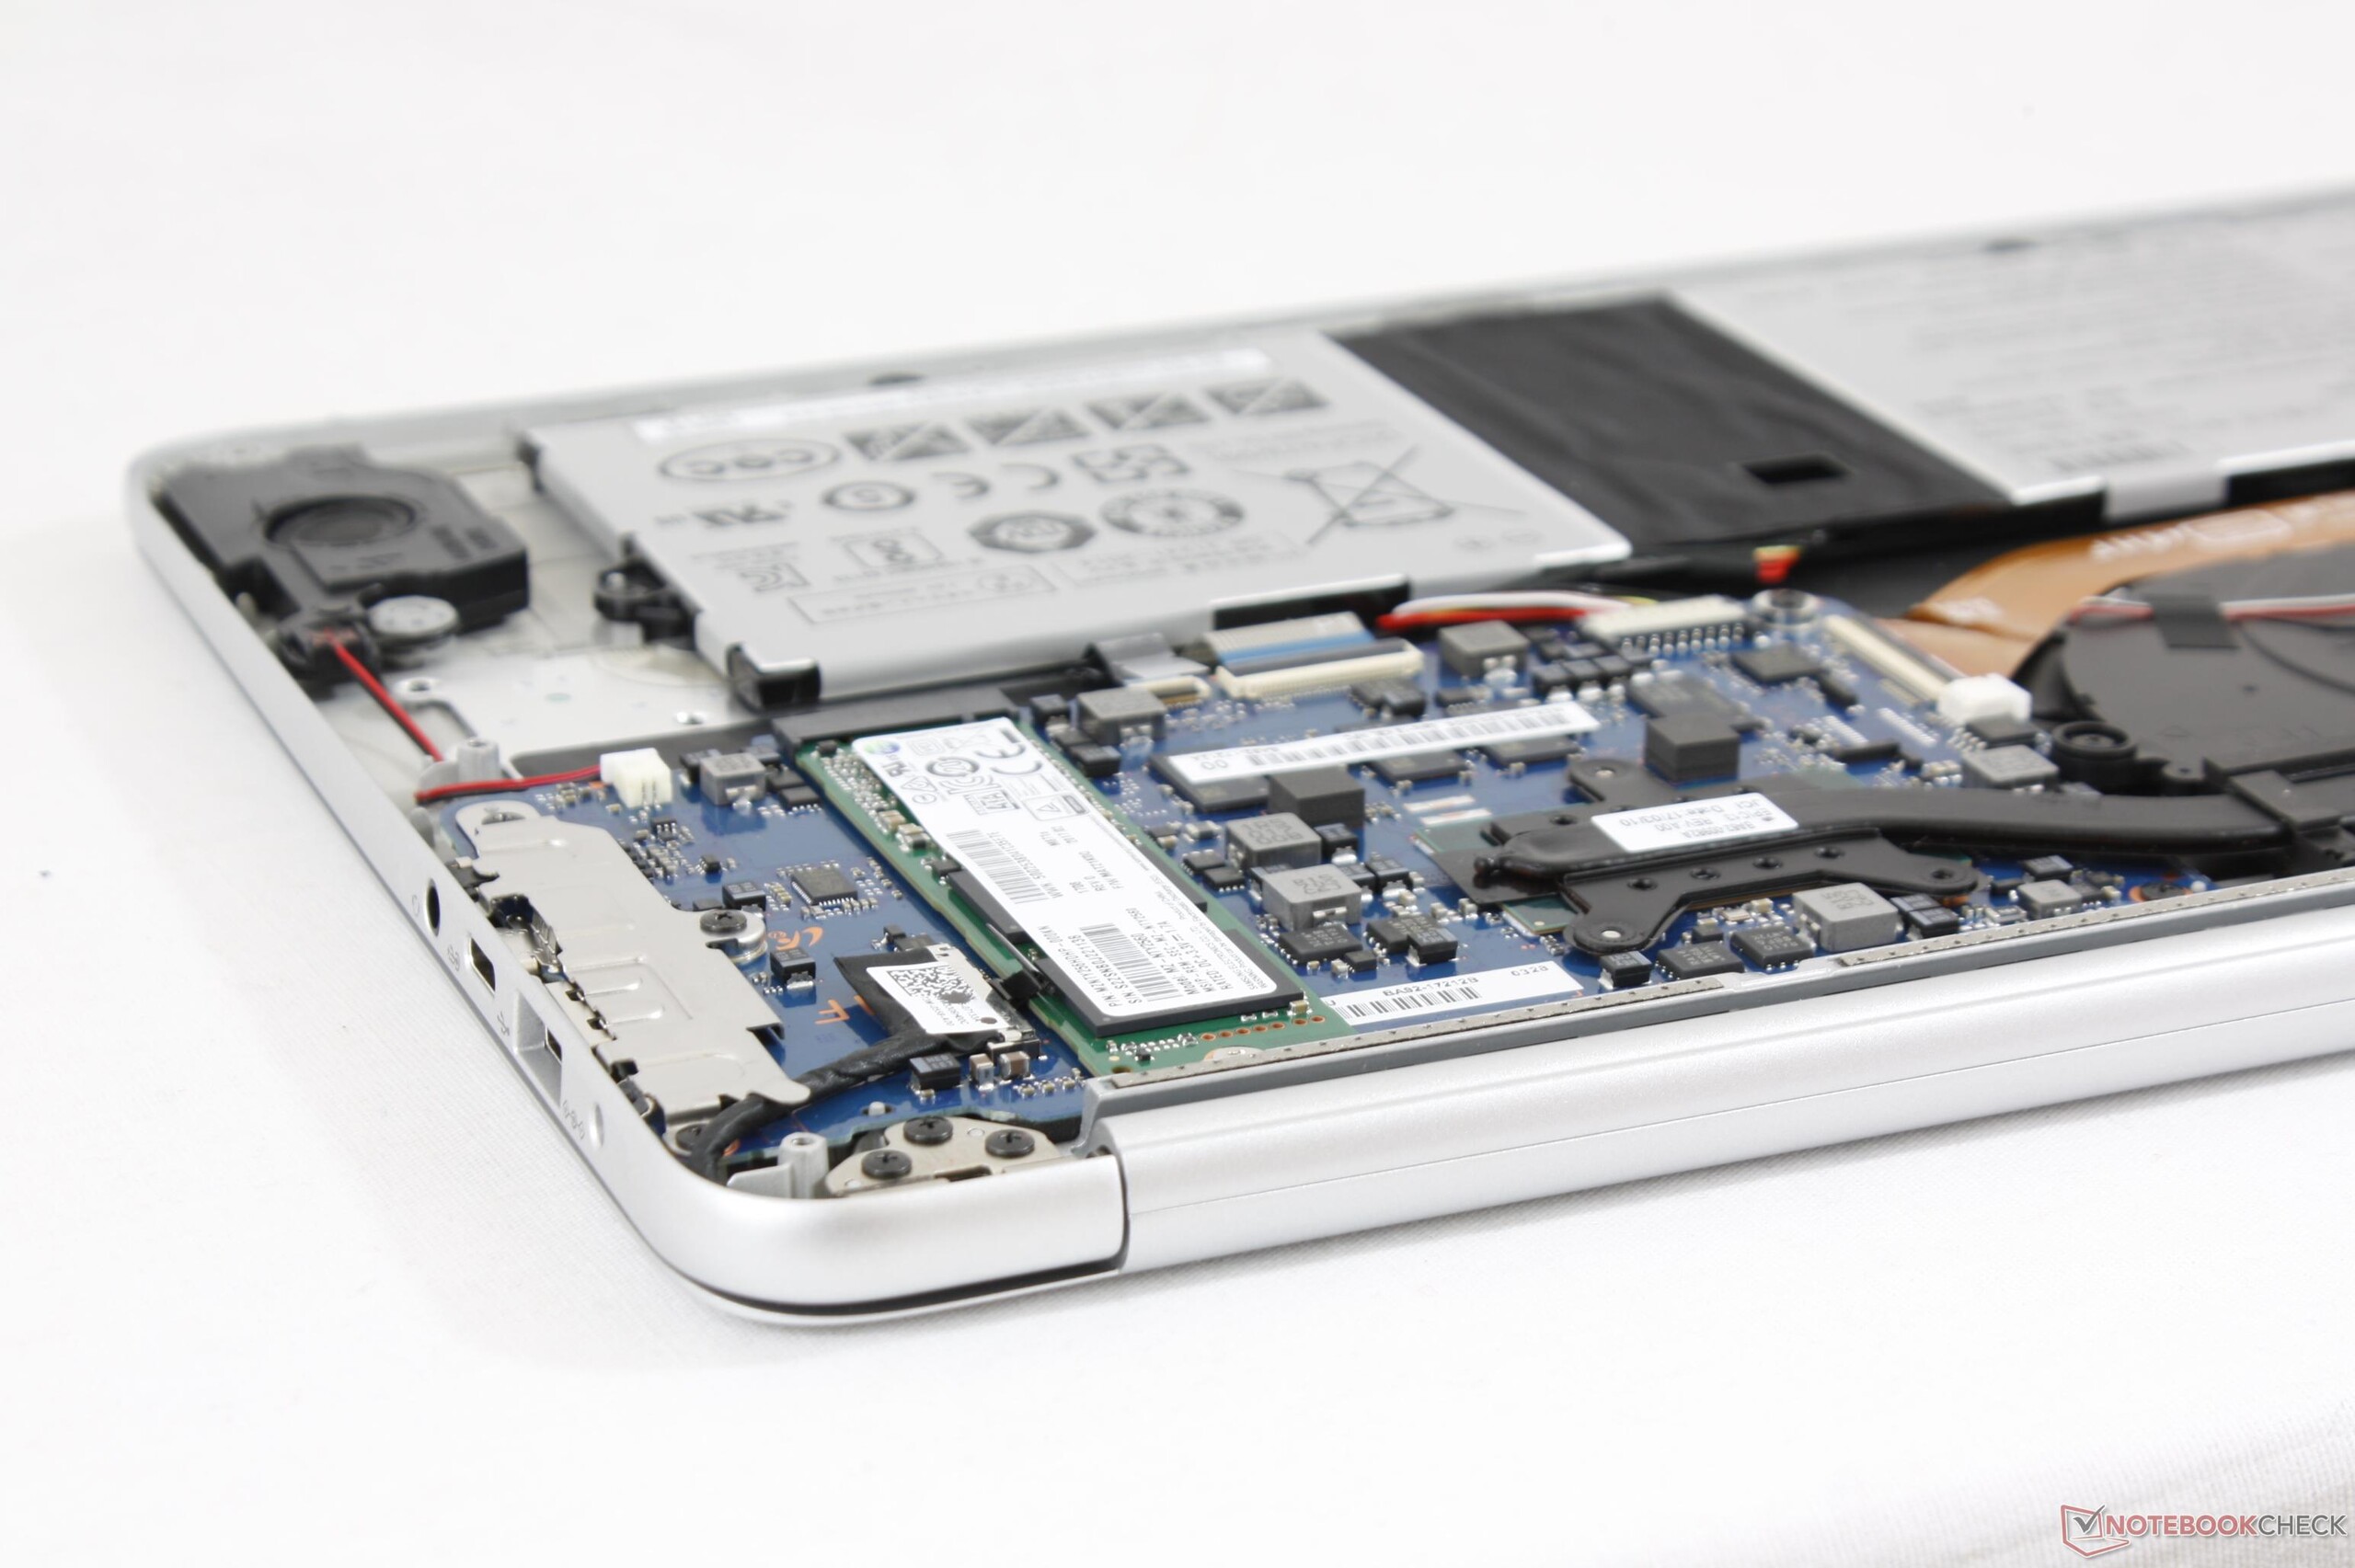
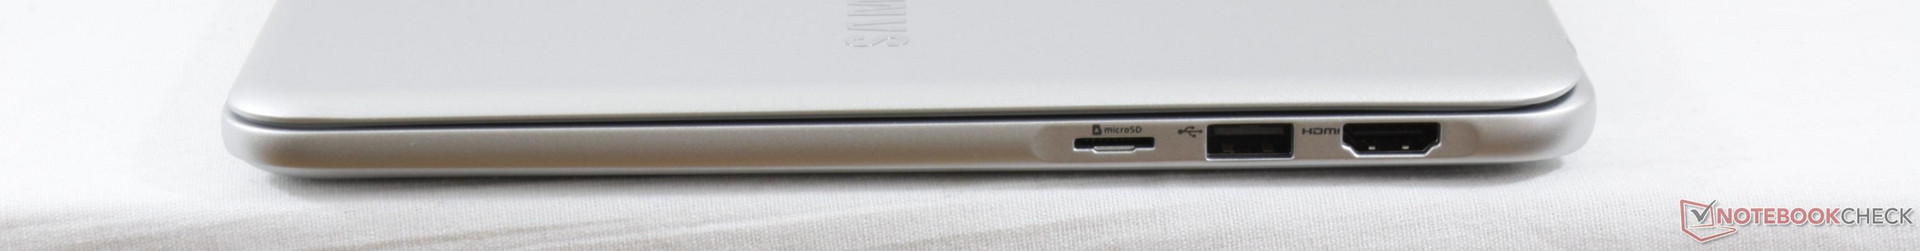
13英寸的Notebook 9为了一个目标而生——成为该尺寸下最小和最亮的超极本。在这方面,三星已经获得了成功,因为NP900X3N比第二名的机子明亮,重量轻很多。结合上安静的风扇,全尺寸的USB端口和优秀的键盘,可以说该机是最好的供旅行或者户外使用的13英寸超极本。
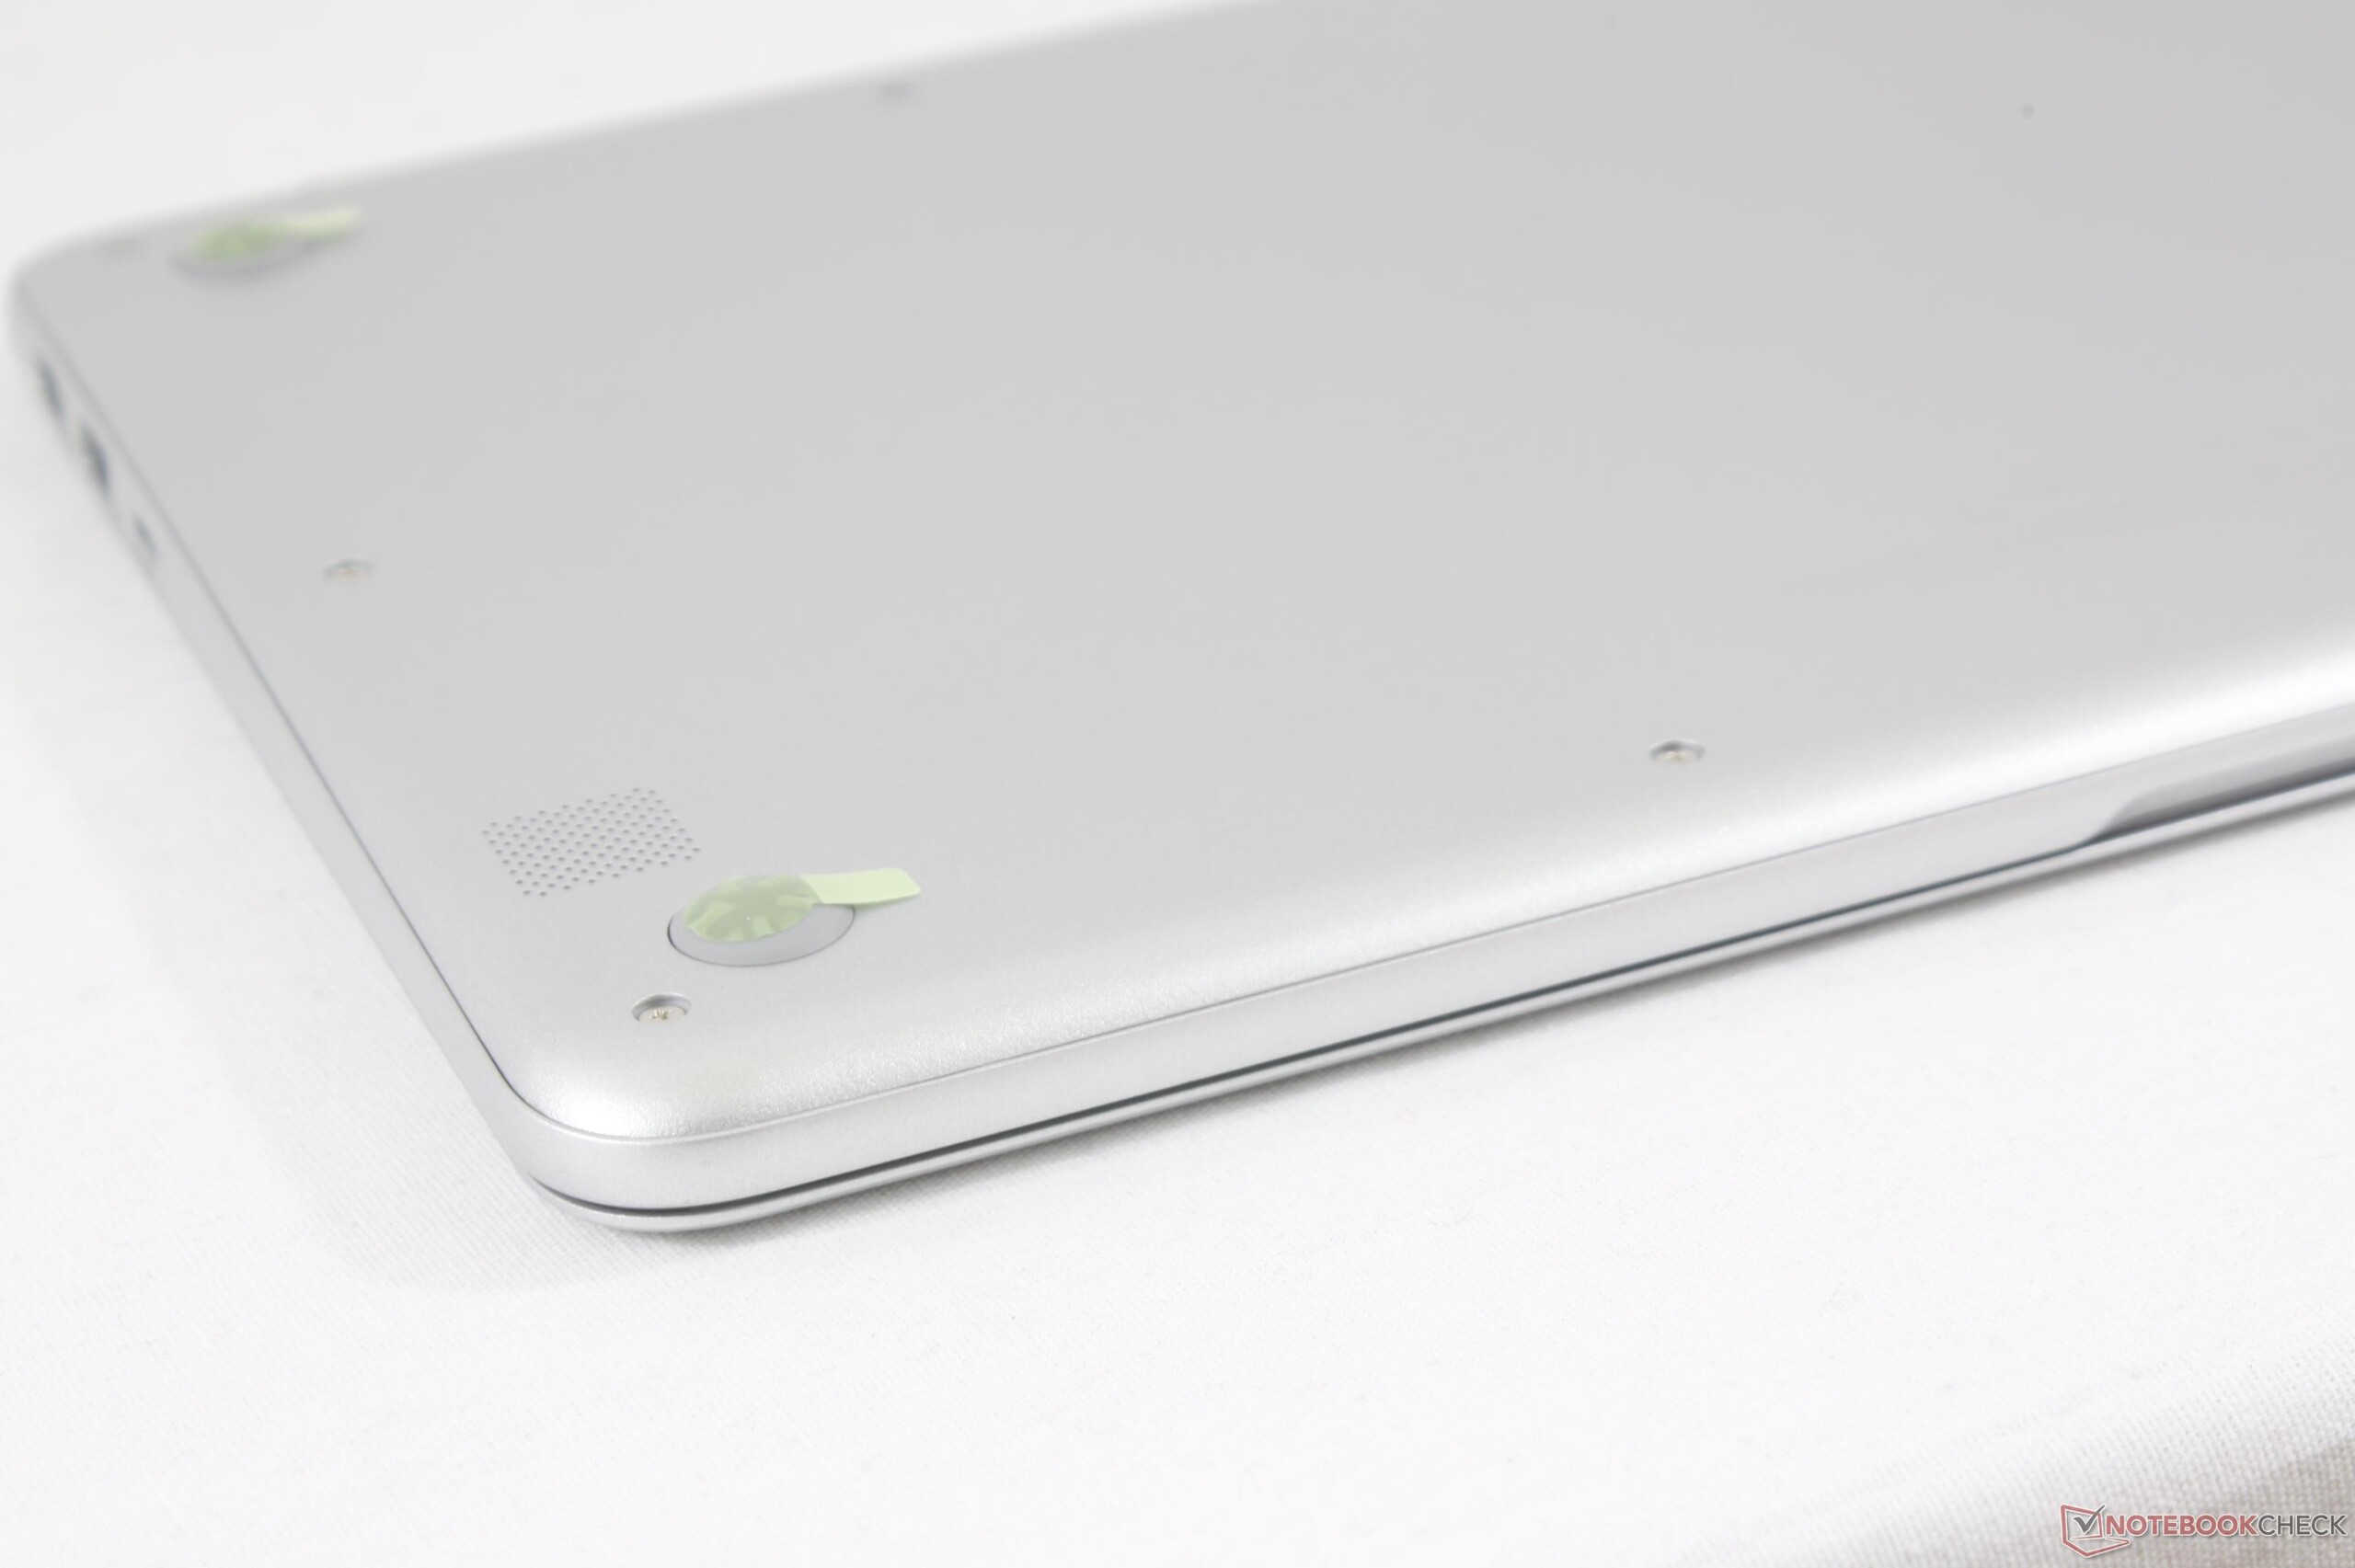
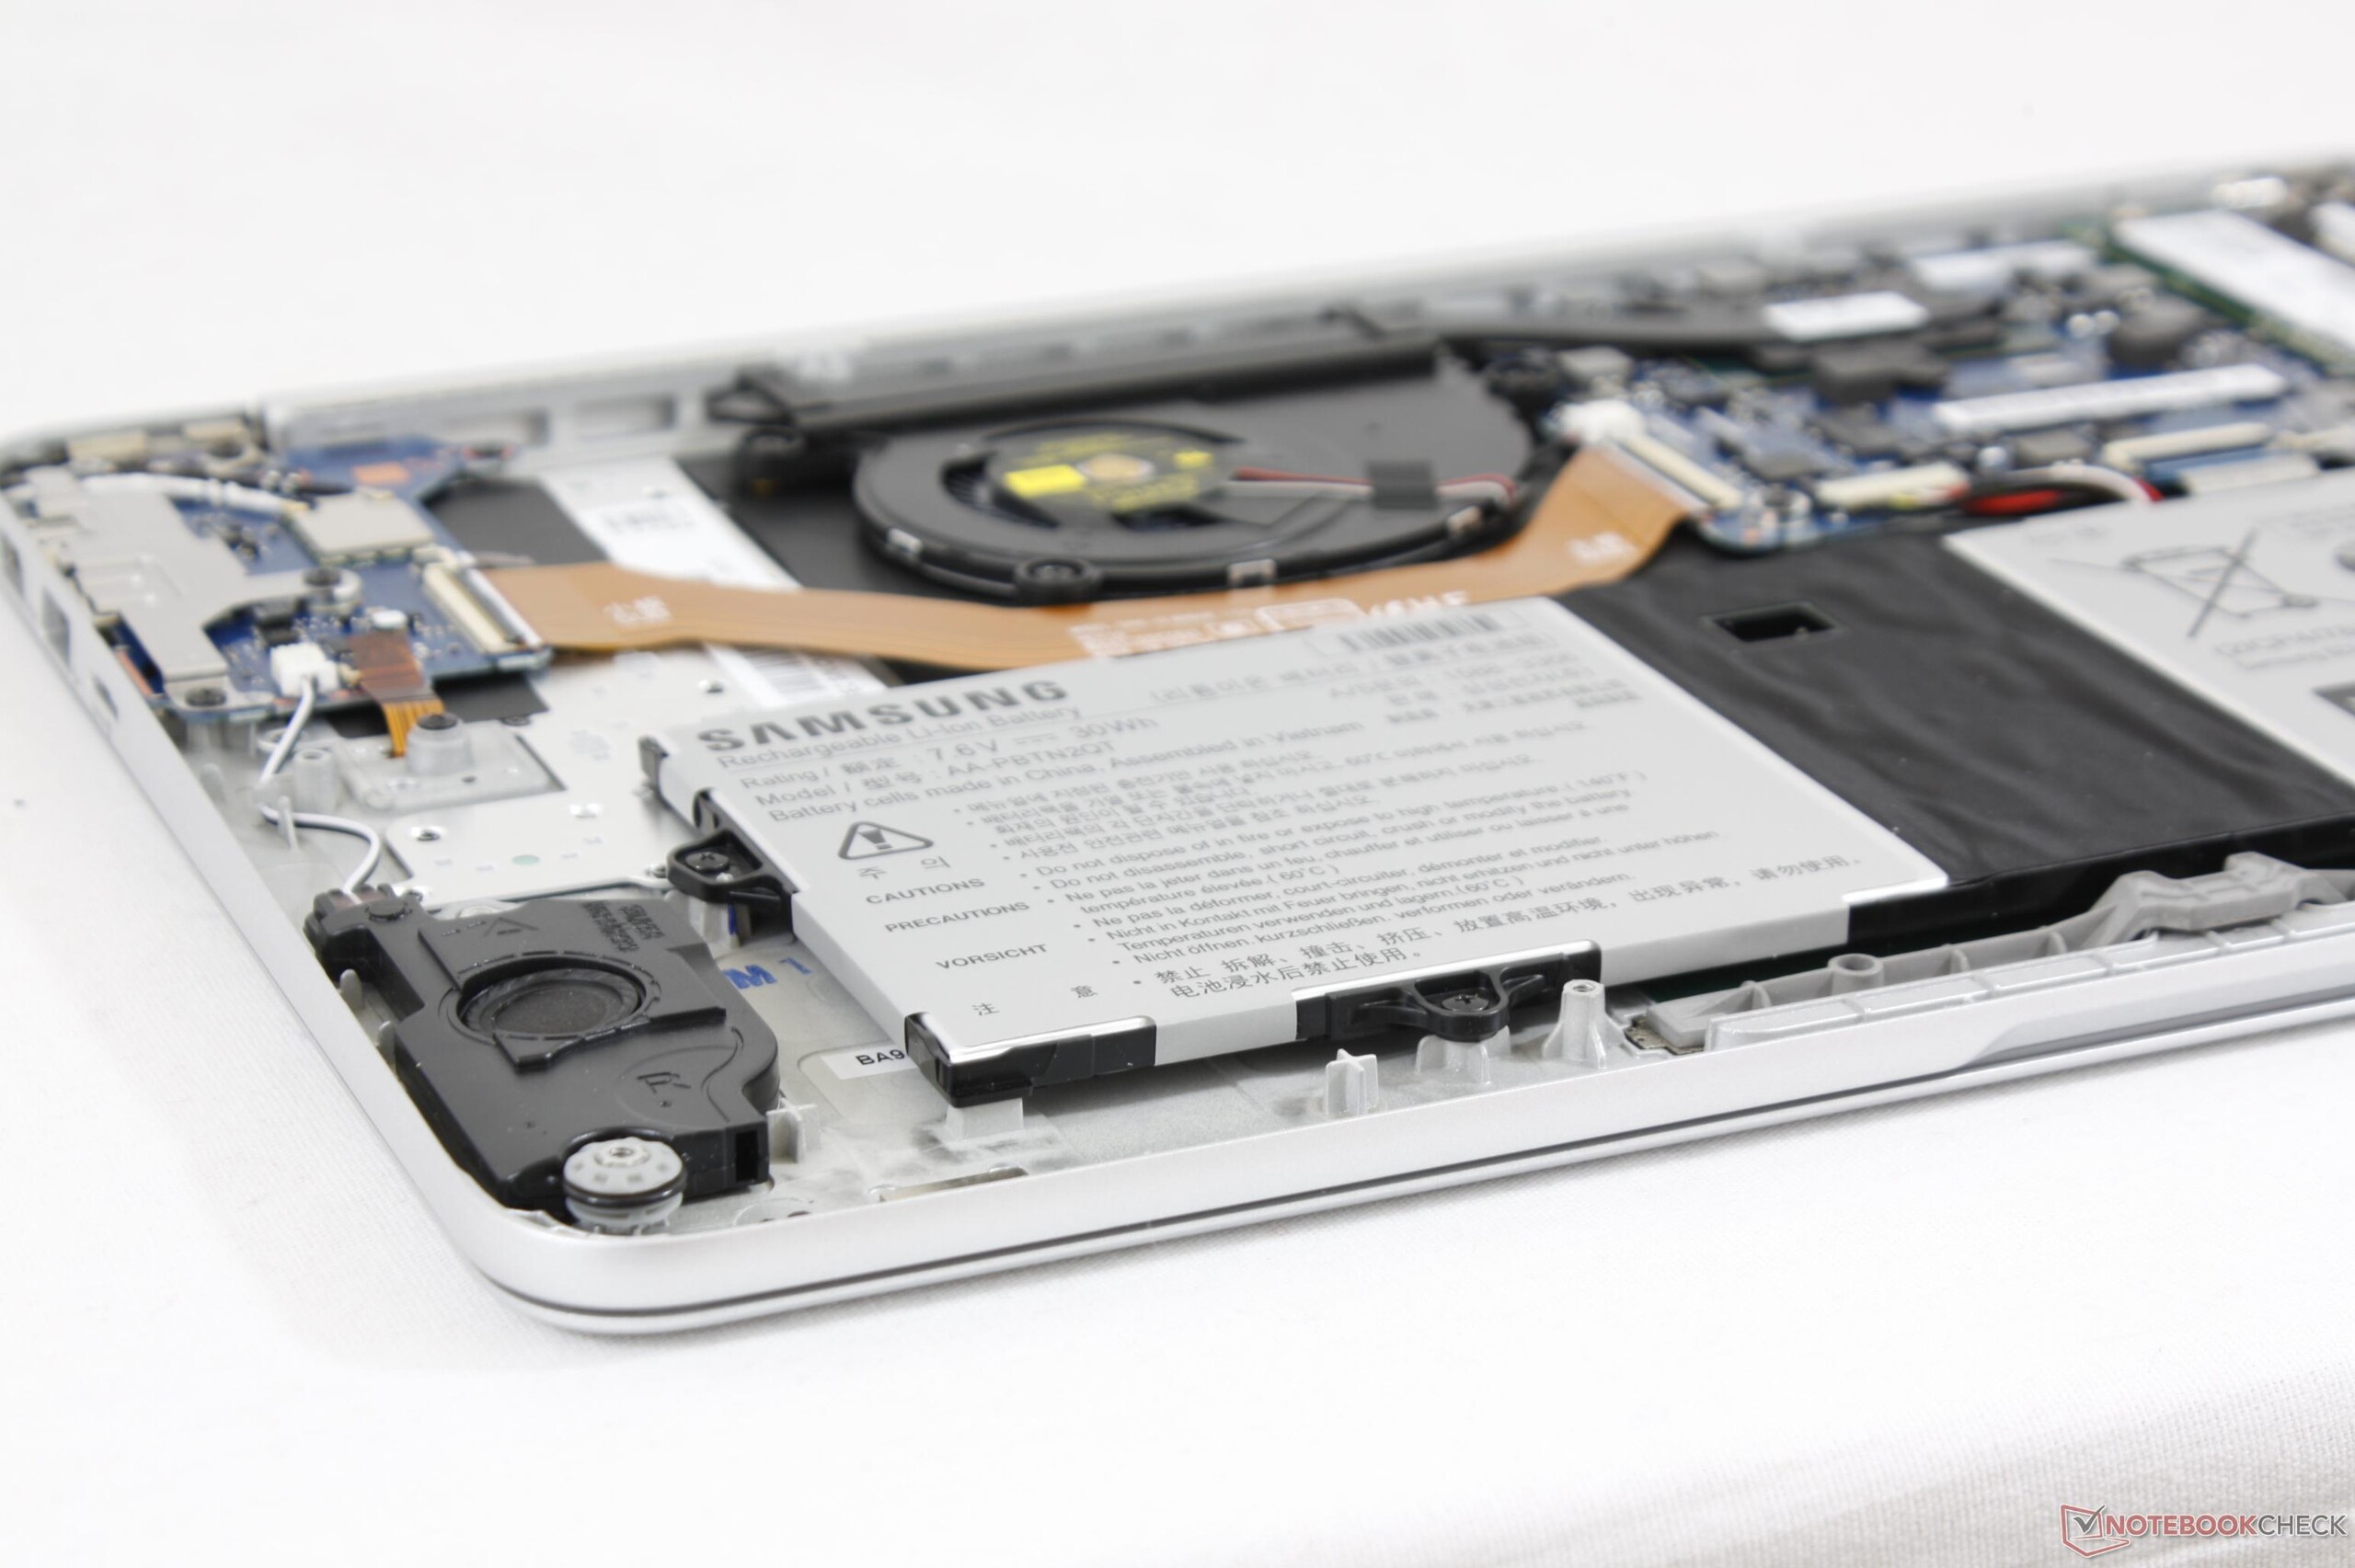
三星创造最轻的超极本的激烈方法,导致了一些性能牺牲。为了尽可能降低重量,该机缺少触摸屏和大猩猩玻璃选项,其冷却解决方案不佳和电池容量都相当小。特别是后者,导致笔记本电脑的平均电池续航时间低于其他户外使用的机型。底面强度虽然不错,但与XPS 13或MacBook Pro 13不在一个层次。
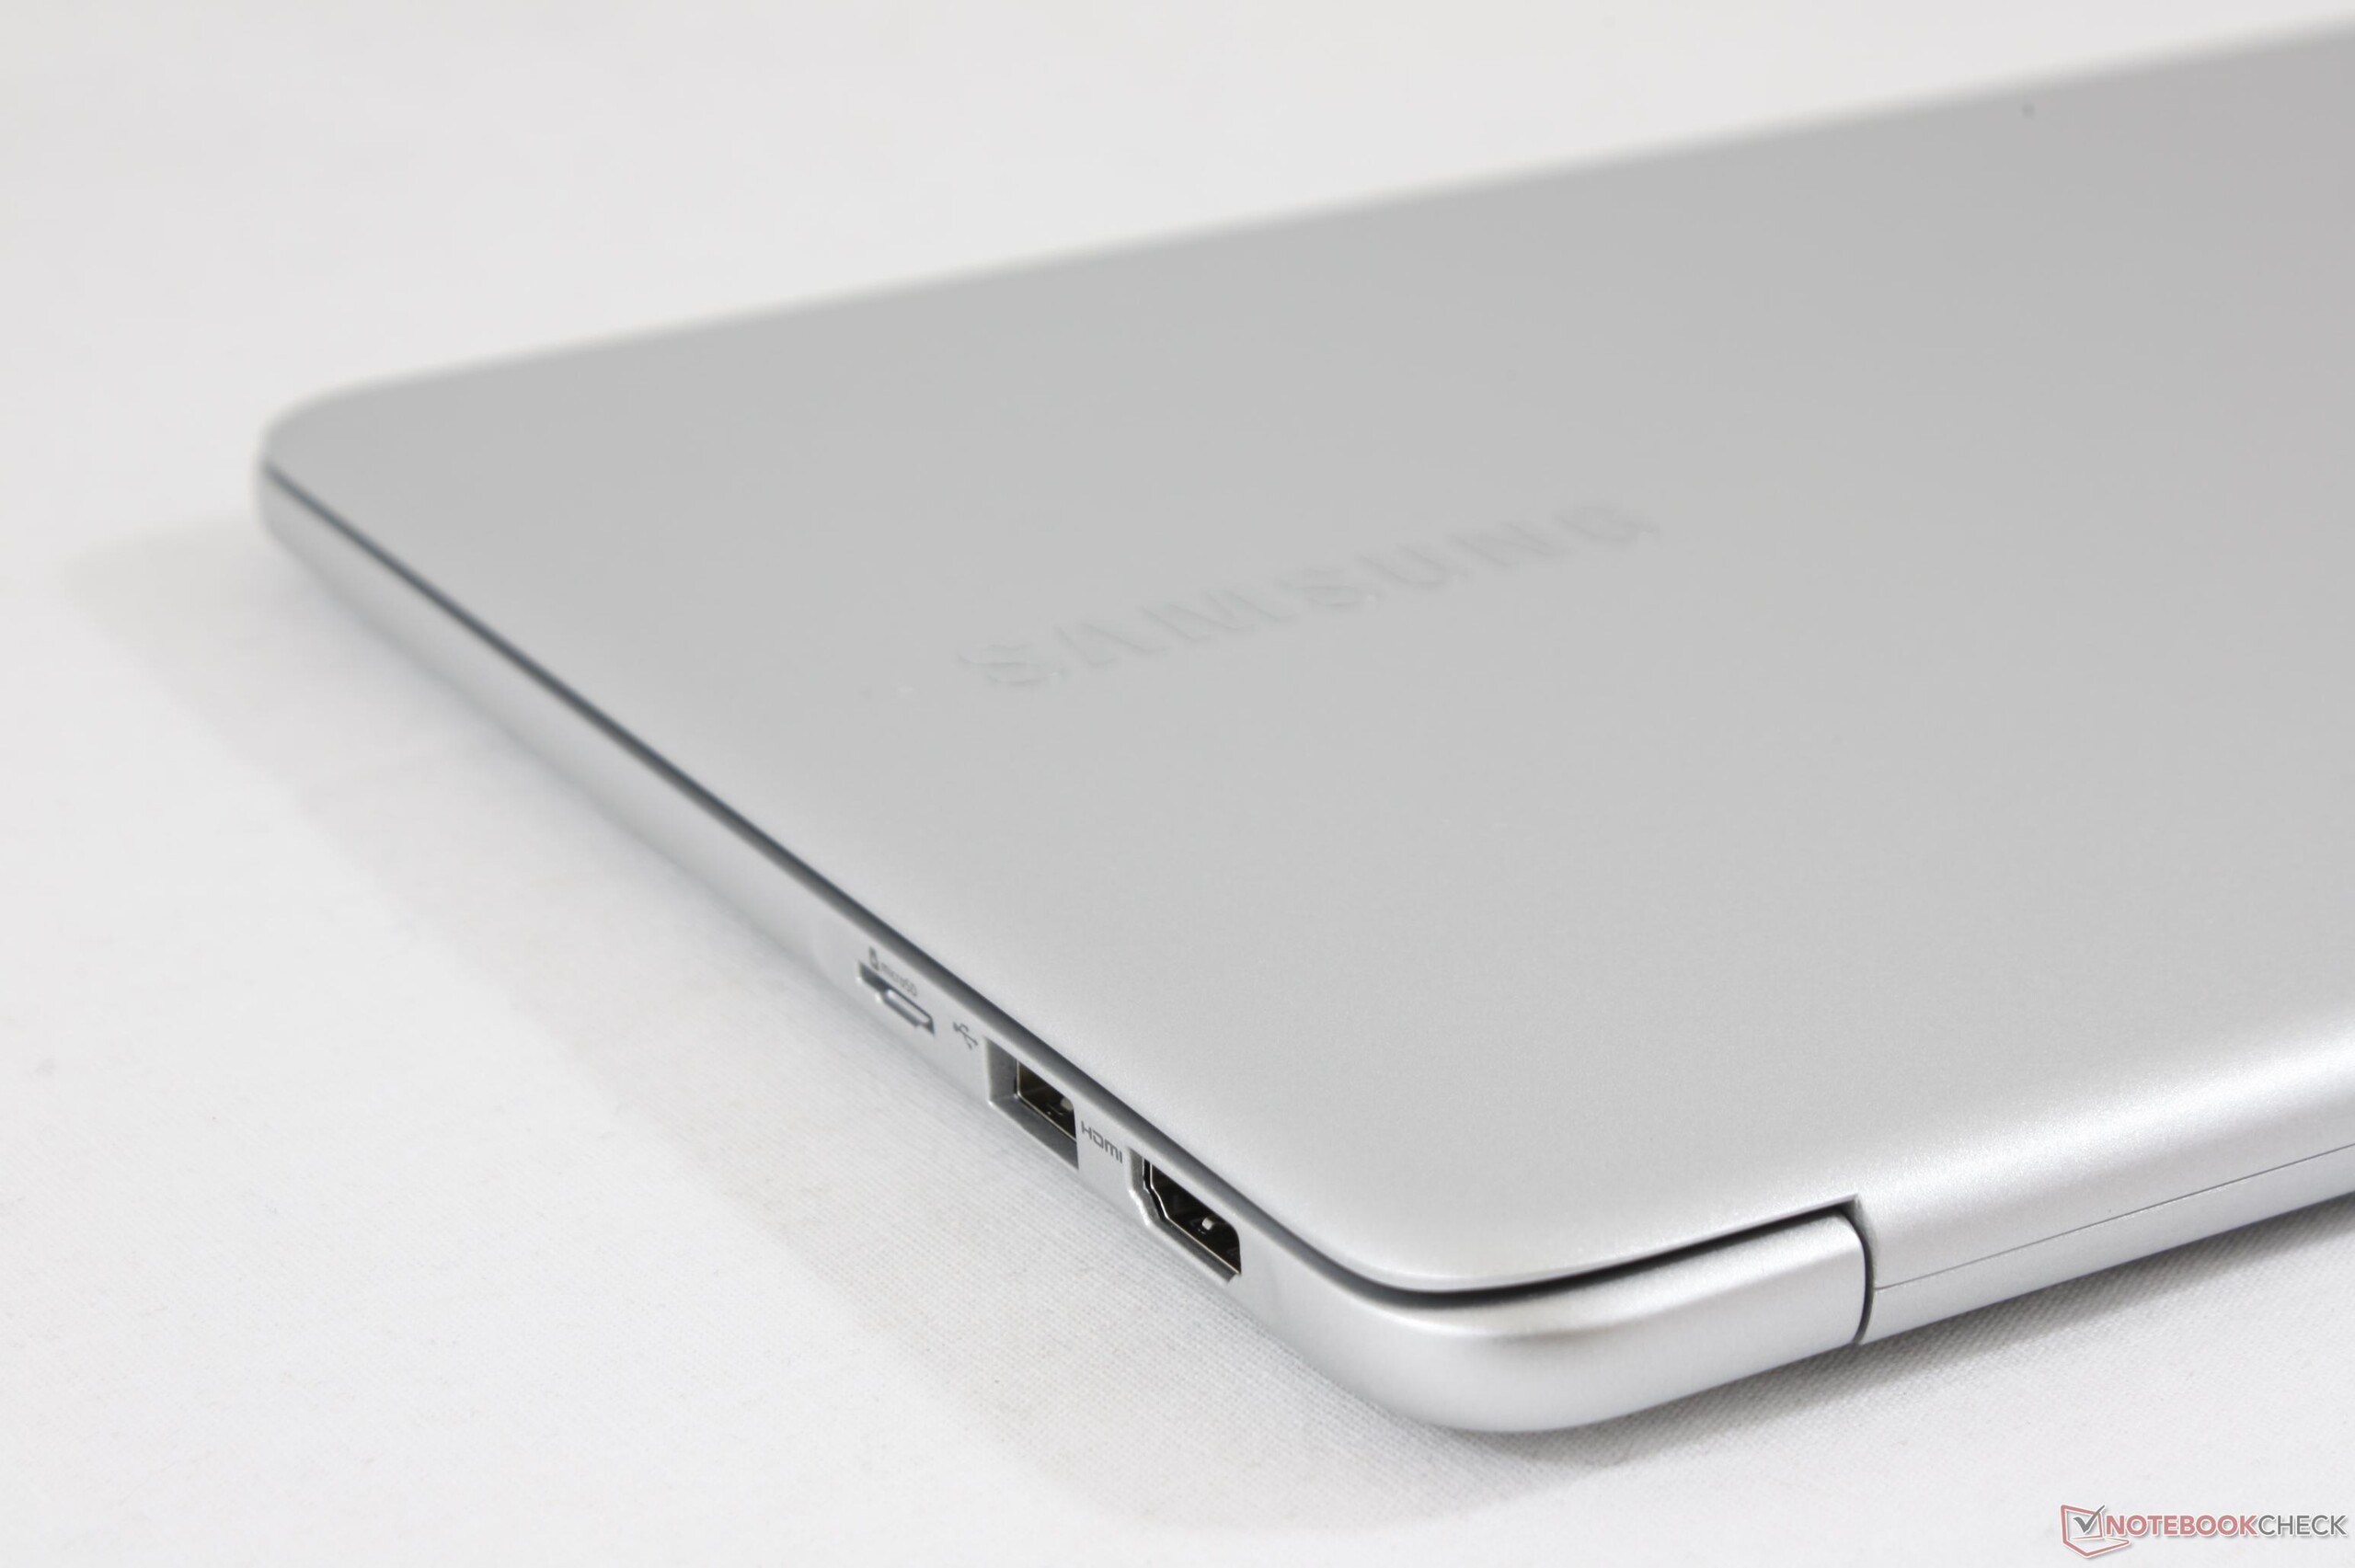
我们希望将来的升级版会添加雷电3,兼容SIM卡并有哑光面板选项,使得Notebook 9成为更好的旅行伴侣。在此之前,那些喜欢比XPS 13更轻更亮,而不牺牲全尺寸USB或HDMI端口(如Zenbook 3,Matebook X,Yoga 910或Spectre 13)机器的人,应该不会对三星感到失望。
超亮的显示和超轻的重量使得这款13英寸笔记本电脑值得推荐给所有人。如果电池续航和雷电3对你来说很重要,那么你还有很多更好的选择。
注:本文是基于完整评测的缩减版本,阅读完整的英文评测,请点击这里。
Samsung Notebook 9 NP900X3N-K01US
-
08/29/2017 v6(old)
Allen Ngo
Pricecompare
