 Deutsch
 English
 Español
 Français
 Italiano
 Nederlands
 Polski
 Português
 Русский
 Türkçe
 Svenska
 Chinese
 Magyar
联想 Miix 510 Pro 80U10006GE 变形本简短评测
| Networking | |
| iperf Server (receive) TCP 1 m | |
| Lenovo Miix 510 Pro 80U10006GE (jseb) | |
| Dell XPS 13 2016 9350 (FHD, i7-6560U) | |
| Huawei MateBook m5-6Y54 | |
| Asus Zenbook UX360UA-C4159T | |
| iperf Client (transmit) TCP 1 m | |
| Asus Zenbook UX360UA-C4159T | |
| Lenovo Miix 510 Pro 80U10006GE (jseb) | |
| Dell XPS 13 2016 9350 (FHD, i7-6560U) | |
| Huawei MateBook m5-6Y54 | |
| |||||||||||||||||||||||||
Brightness Distribution: 88 %
Center on Battery: 327 cd/m²
Contrast: 934:1 (Black: 0.35 cd/m²)
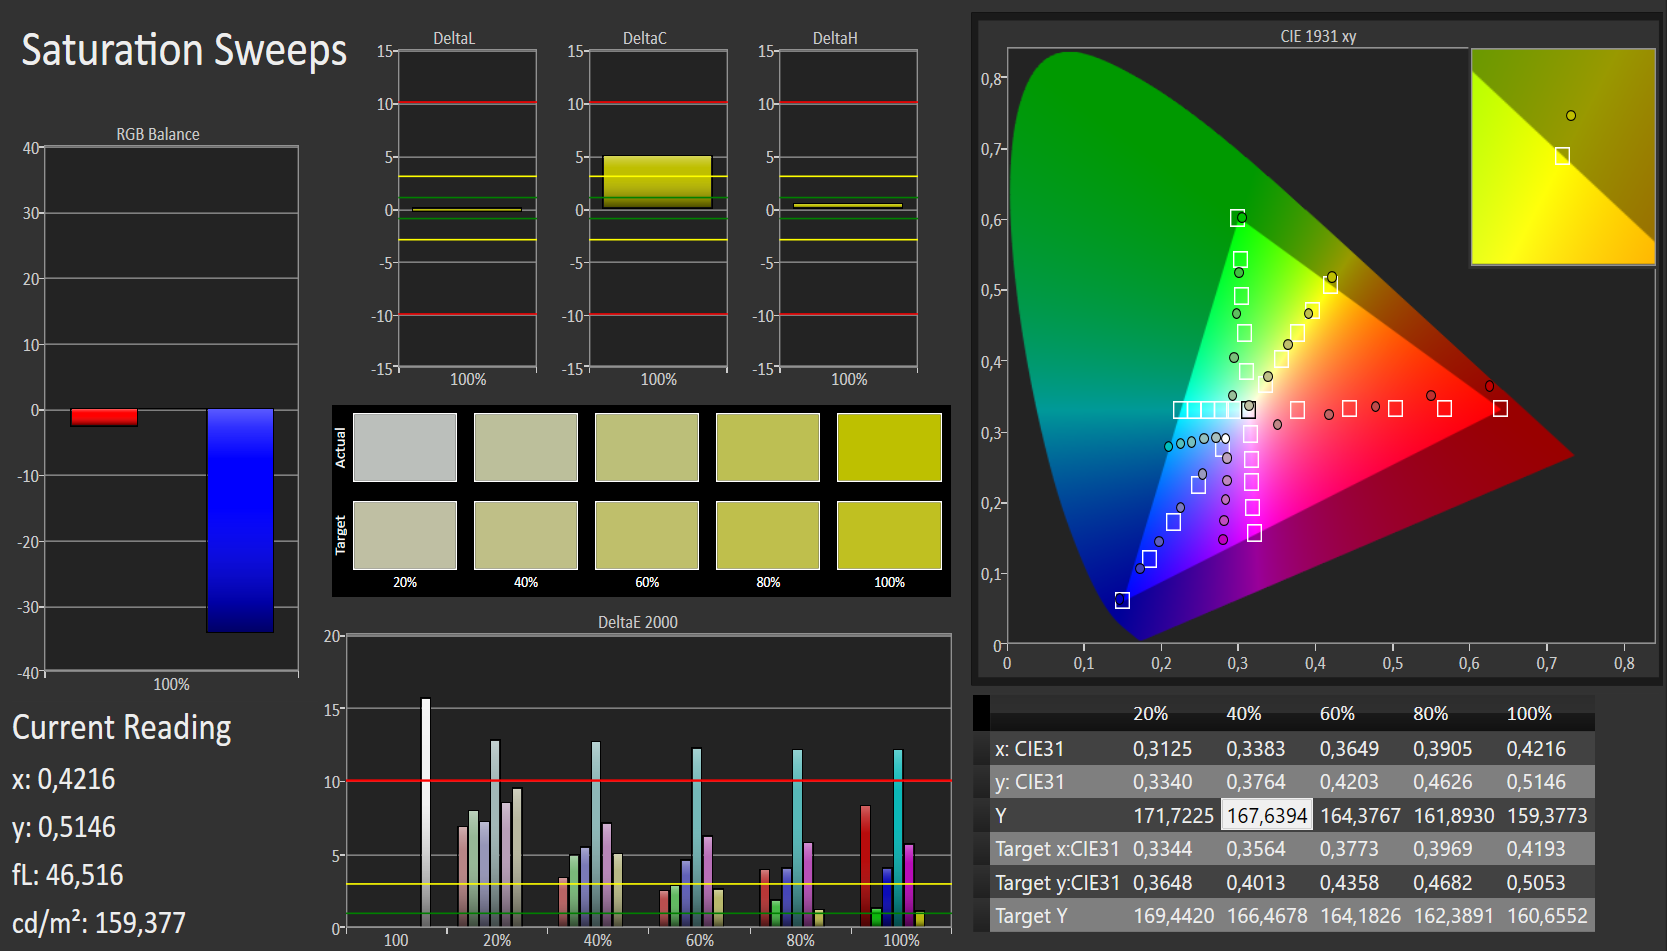
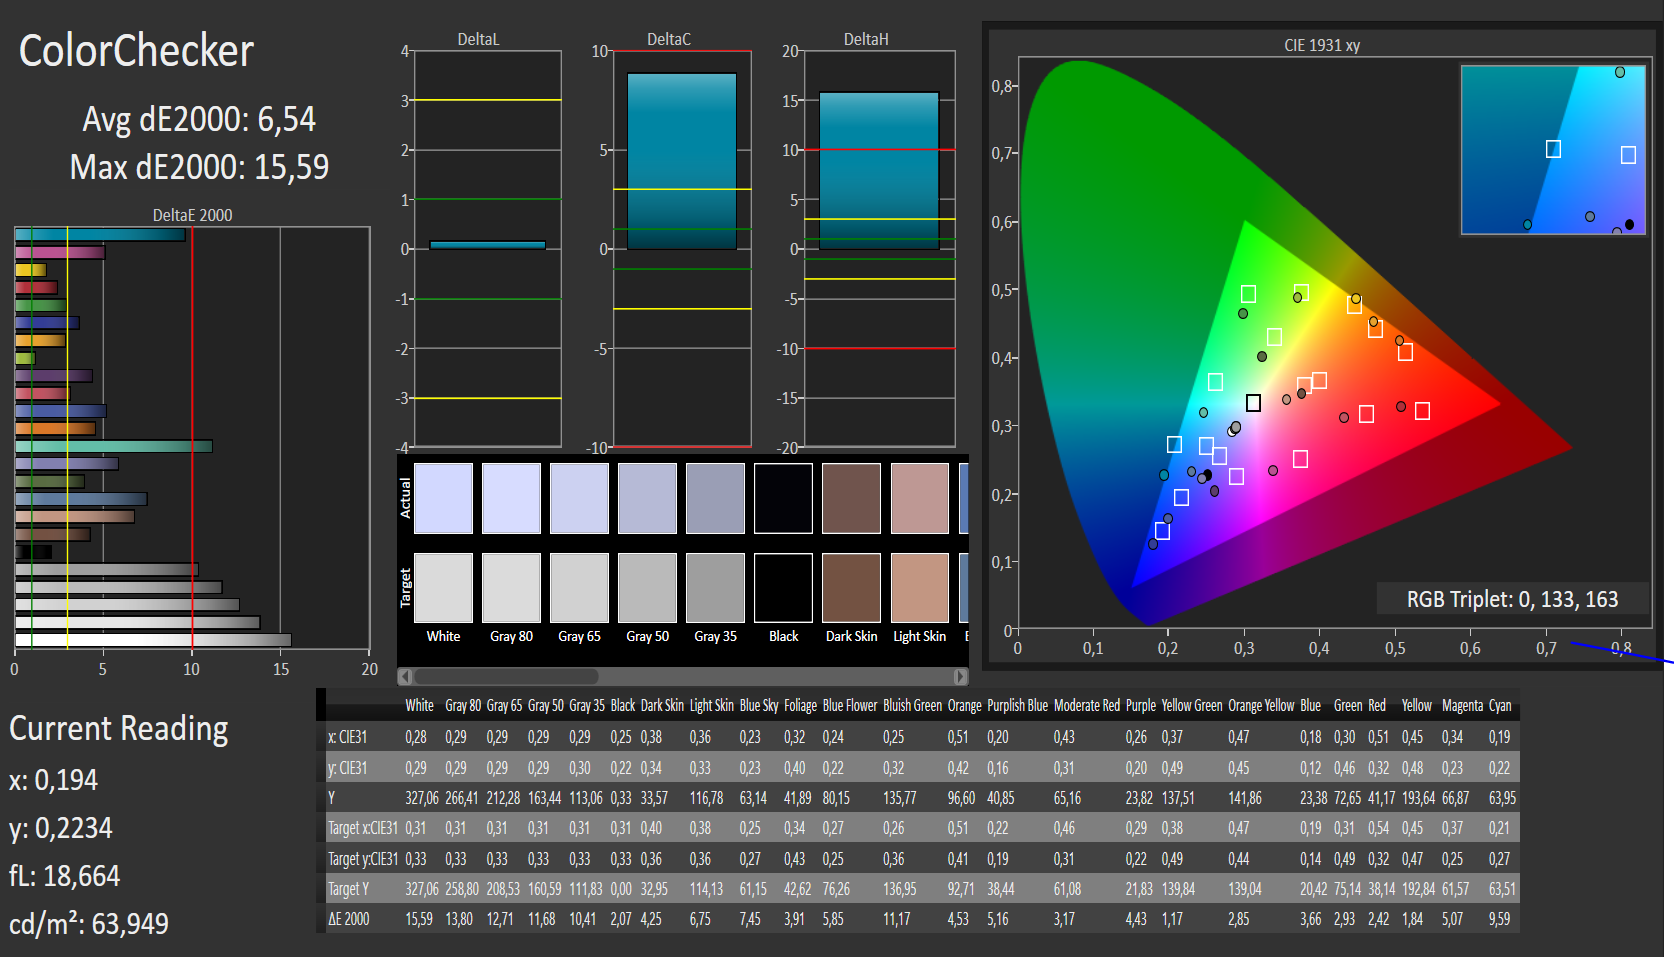
ΔE Color 6.54 | 0.5-29.43 Ø5
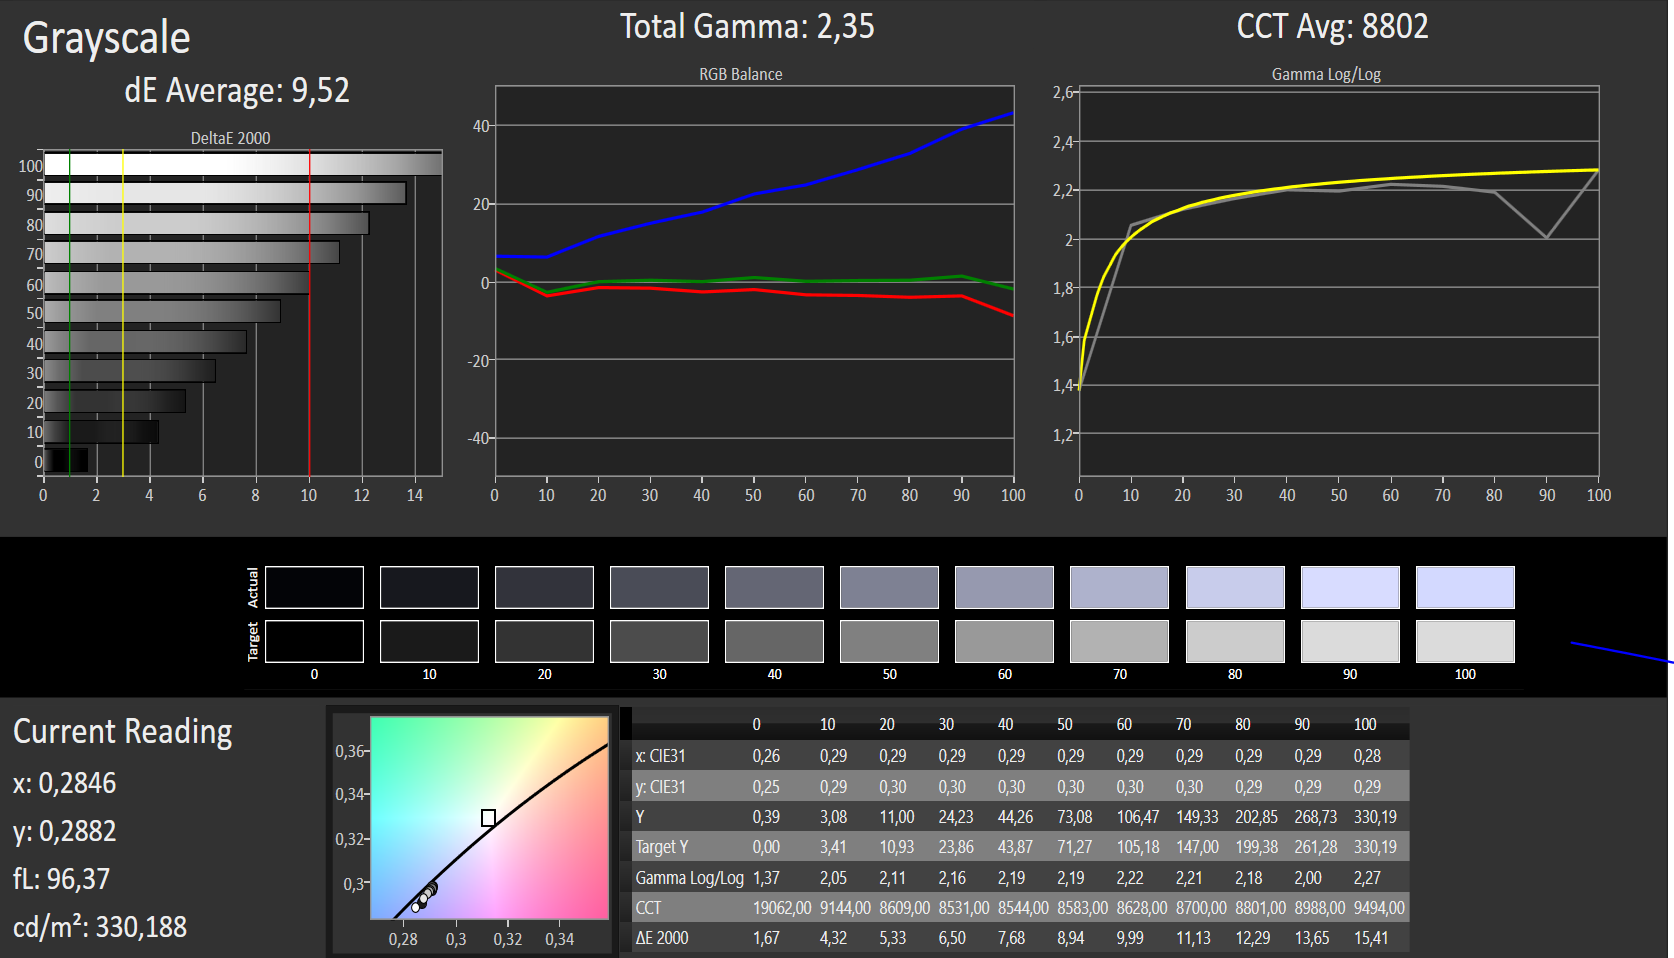
ΔE Greyscale 9.52 | 0.57-98 Ø5.3
92% sRGB (Argyll 1.6.3 3D)
59% AdobeRGB 1998 (Argyll 1.6.3 3D)
65.5% AdobeRGB 1998 (Argyll 2.2.0 3D)
92% sRGB (Argyll 2.2.0 3D)
64.5% Display P3 (Argyll 2.2.0 3D)
Gamma: 2.35
| Lenovo Miix 510 Pro 80U10006GE Unknown, , 1920x1200, 12.20 | Microsoft Surface Pro 4, Core i5, 128GB Samsung 123YL01-001 ID: SDC3853, , 2736x1824, 12.30 | HP Elite x2 1012 G1 LG Philips, , 1920x1280, 12.10 | Acer Aspire Switch Alpha 12 SA5-271-56HM Panasonic VVX12T041N00, , 2160x1440, 12.00 | Lenovo IdeaPad Miix 700 Samsung L_QLLTN120QL01L01, , 2160x1440, 12.00 | Huawei MateBook m5-6Y54 TMA 1200 Unknown Vendor, , 2160x1440, 12.00 | |
|---|---|---|---|---|---|---|
| Display | 3% | -18% | 3% | 6% | 3% | |
| Display P3 Coverage | 64.5 | 65 1% | 53.8 -17% | 65.5 2% | 68.1 6% | 65.8 2% |
| sRGB Coverage | 92 | 96.5 5% | 73.7 -20% | 96.1 4% | 97.4 6% | 96.2 5% |
| AdobeRGB 1998 Coverage | 65.5 | 67 2% | 53.8 -18% | 66.9 2% | 70.2 7% | 66.8 2% |
| Response Times | -45% | 0% | 230% | 33% | 25% | |
| Response Time Grey 50% / Grey 80% * | 33 ? | 46 ? -39% | 33.2 ? -1% | 20 ? 39% | 30 ? 9% | 25 ? 24% |
| Response Time Black / White * | 23 ? | 31.2 ? -36% | 22.8 ? 1% | 34 ? -48% | 16 ? 30% | 17 ? 26% |
| PWM Frequency | 125 ? | 50 ? -60% | 1000 ? 700% | 200 ? 60% | ||
| Screen | 21% | 1% | 6% | 4% | 4% | |
| Brightness middle | 327 | 413 26% | 322 -2% | 345 6% | 341 4% | 451 38% |
| Brightness | 324 | 396 22% | 319 -2% | 328 1% | 318 -2% | 425 31% |
| Brightness Distribution | 88 | 87 -1% | 97 10% | 91 3% | 87 -1% | 80 -9% |
| Black Level * | 0.35 | 0.36 -3% | 0.42 -20% | 0.38 -9% | 0.36 -3% | 0.37 -6% |
| Contrast | 934 | 1147 23% | 767 -18% | 908 -3% | 947 1% | 1219 31% |
| Colorchecker dE 2000 * | 6.54 | 3.09 53% | 6.02 8% | 8.4 -28% | 6 8% | 11.04 -69% |
| Colorchecker dE 2000 max. * | 15.59 | 10.06 35% | 11.9 24% | 14.92 4% | ||
| Greyscale dE 2000 * | 9.52 | 3.92 59% | 6.29 34% | 4.3 55% | 8.12 15% | 10.45 -10% |
| Gamma | 2.35 94% | 2.3 96% | 2.4 92% | 2.63 84% | 2.23 99% | 2 110% |
| CCT | 8802 74% | 7333 89% | 7712 84% | 7368 88% | 7011 93% | 8849 73% |
| Color Space (Percent of AdobeRGB 1998) | 59 | 61 3% | 47.8 -19% | 62 5% | 63.4 7% | 74 25% |
| Color Space (Percent of sRGB) | 92 | 97 5% | 73.2 -20% | 97.4 6% | 100 9% | |
| Total Average (Program / Settings) | -7% /
4% | -6% /
-3% | 80% /
50% | 14% /
10% | 11% /
7% |
* ... smaller is better
Display Response Times
| ↔ Response Time Black to White | ||
|---|---|---|
| 23 ms ... rise ↗ and fall ↘ combined | ↗ 10 ms rise | 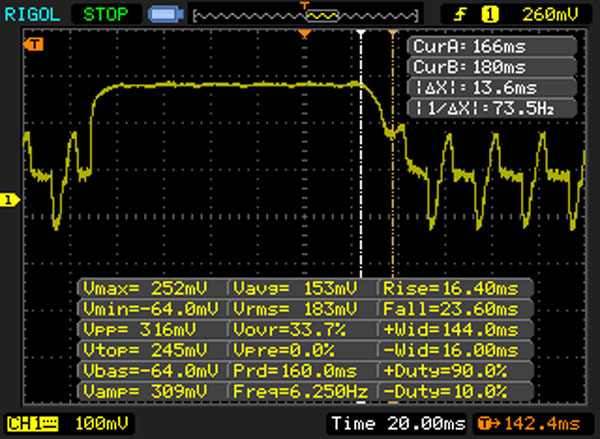 |
| ↘ 13 ms fall | ||
| The screen shows good response rates in our tests, but may be too slow for competitive gamers. In comparison, all tested devices range from 0.1 (minimum) to 240 (maximum) ms. » 45 % of all devices are better. This means that the measured response time is similar to the average of all tested devices (21.5 ms). | ||
| ↔ Response Time 50% Grey to 80% Grey | ||
| 33 ms ... rise ↗ and fall ↘ combined | ↗ 21 ms rise | 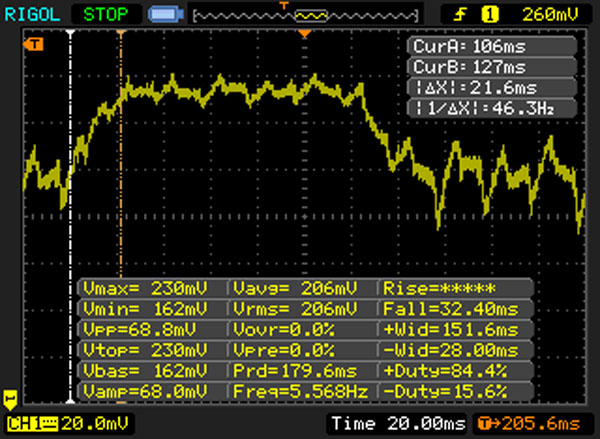 |
| ↘ 12 ms fall | ||
| The screen shows slow response rates in our tests and will be unsatisfactory for gamers. In comparison, all tested devices range from 0.2 (minimum) to 636 (maximum) ms. » 38 % of all devices are better. This means that the measured response time is similar to the average of all tested devices (33.7 ms). | ||
Screen Flickering / PWM (Pulse-Width Modulation)
| Screen flickering / PWM detected | 125 Hz | ≤ 90 % brightness setting | 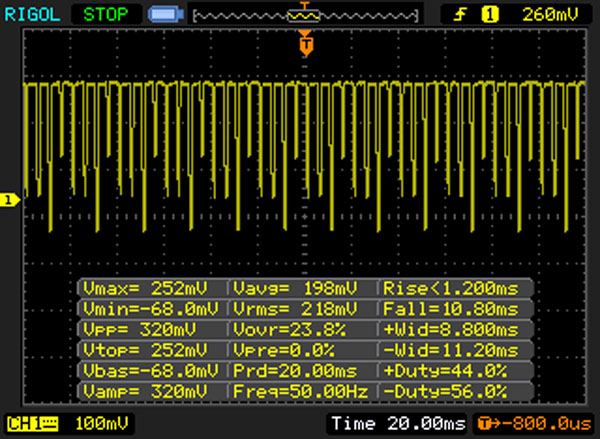 |
The display backlight flickers at 125 Hz (worst case, e.g., utilizing PWM) Flickering detected at a brightness setting of 90 % and below. There should be no flickering or PWM above this brightness setting. The frequency of 125 Hz is very low, so the flickering may cause eyestrain and headaches after extended use. In comparison: 53 % of all tested devices do not use PWM to dim the display. If PWM was detected, an average of 17915 (minimum: 5 - maximum: 3846000) Hz was measured. | |||
| PCMark 8 Home Score Accelerated v2 | 3264 points | |
| PCMark 8 Work Score Accelerated v2 | 4197 points | |
Help | ||
| Lenovo Miix 510 Pro 80U10006GE Samsung PM951 NVMe MZVLV256 | Microsoft Surface Pro 4, Core i5, 128GB Samsung MZFLV128 NVMe | HP Elite x2 1012 G1 Liteon L8H-256V2G | Acer Aspire Switch Alpha 12 SA5-271-56HM Kingston RBU-SNS8152S3256GG2 | Lenovo IdeaPad Miix 700 Samsung MZNLN128HCGR-000L2 | Huawei MateBook m5-6Y54 SanDisk SD8SN8U256G1027 | |
|---|---|---|---|---|---|---|
| CrystalDiskMark 3.0 | -39% | -27% | -38% | -36% | -25% | |
| Read Seq | 1271 | 666 -48% | 501 -61% | 518 -59% | 497.9 -61% | 512 -60% |
| Write Seq | 305.4 | 154.2 -50% | 297.2 -3% | 199.9 -35% | 153.5 -50% | 462.1 51% |
| Read 512 | 651 | 266.3 -59% | 351.7 -46% | 374.9 -42% | 401.2 -38% | 376 -42% |
| Write 512 | 305.2 | 154.2 -49% | 295.7 -3% | 201 -34% | 154.5 -49% | 295.2 -3% |
| Read 4k | 41.07 | 28.51 -31% | 28.31 -31% | 29.3 -29% | 36.2 -12% | 31.83 -22% |
| Write 4k | 122.7 | 101.5 -17% | 90.3 -26% | 76.8 -37% | 95.5 -22% | 64.5 -47% |
| Read 4k QD32 | 411.2 | 368.3 -10% | 285 -31% | 272 -34% | 389.5 -5% | 269.6 -34% |
| Write 4k QD32 | 305.1 | 153.6 -50% | 268.4 -12% | 197.1 -35% | 154 -50% | 178.2 -42% |

| 3DMark | |
| 1280x720 Cloud Gate Standard Graphics | |
| Microsoft Surface Pro 4, Core i5, 128GB | |
| Acer Aspire Switch Alpha 12 SA5-271-56HM | |
| HP Elite x2 1012 G1 | |
| Lenovo Miix 510 Pro 80U10006GE | |
| Huawei MateBook m5-6Y54 | |
| Lenovo IdeaPad Miix 700 | |
| 1920x1080 Fire Strike Graphics | |
| Microsoft Surface Pro 4, Core i5, 128GB | |
| HP Elite x2 1012 G1 | |
| Lenovo IdeaPad Miix 700 | |
| 3DMark 11 Performance | 1428 points | |
| 3DMark Cloud Gate Standard Score | 4755 points | |
Help | ||
| Thief - 1024x768 Very Low Preset | |
| Lenovo Miix 510 Pro 80U10006GE | |
| Huawei MateBook m5-6Y54 | |
| Rise of the Tomb Raider - 1024x768 Lowest Preset | |
| Lenovo Miix 510 Pro 80U10006GE | |
| Acer Aspire Switch Alpha 12 SA5-271-56HM | |
| Huawei MateBook m5-6Y54 | |
| low | med. | high | ultra | |
| BioShock Infinite (2013) | 46.3 | 24.9 | ||
| Thief (2014) | 18.2 | 11.2 | ||
| Rise of the Tomb Raider (2016) | 17.4 | 9.2 |
Noise Level
| Idle |
| 30.15 / 30.8 / 31 dB(A) |
| Load |
| 36.8 / 33.8 dB(A) |
 | ||
30 dB silent 40 dB(A) audible 50 dB(A) loud |
||
min: | ||
(±) The maximum temperature on the upper side is 41.4 °C / 107 F, compared to the average of 35.3 °C / 96 F, ranging from 19.6 to 55.7 °C for the class Convertible.
(+) The bottom heats up to a maximum of 39.5 °C / 103 F, compared to the average of 36.8 °C / 98 F
(+) In idle usage, the average temperature for the upper side is 29.9 °C / 86 F, compared to the device average of 30.2 °C / 86 F.
(-) The palmrests and touchpad can get very hot to the touch with a maximum of 40.2 °C / 104.4 F.
(-) The average temperature of the palmrest area of similar devices was 28.1 °C / 82.6 F (-12.1 °C / -21.8 F).
Lenovo Miix 510 Pro 80U10006GE audio analysis
(-) | not very loud speakers (62 dB)
Bass 100 - 315 Hz
(-) | nearly no bass - on average 22.9% lower than median
(±) | linearity of bass is average (7.4% delta to prev. frequency)
Mids 400 - 2000 Hz
(+) | balanced mids - only 2.3% away from median
(±) | linearity of mids is average (12.2% delta to prev. frequency)
Highs 2 - 16 kHz
(±) | higher highs - on average 5% higher than median
(±) | linearity of highs is average (11.5% delta to prev. frequency)
Overall 100 - 16.000 Hz
(±) | linearity of overall sound is average (27.9% difference to median)
Compared to same class
» 83% of all tested devices in this class were better, 3% similar, 15% worse
» The best had a delta of 6%, average was 21%, worst was 57%
Compared to all devices tested
» 82% of all tested devices were better, 3% similar, 15% worse
» The best had a delta of 4%, average was 25%, worst was 134%
Acer Aspire Switch Alpha 12 SA5-271-56HM audio analysis
(±) | speaker loudness is average but good (73 dB)
Analysis not possible as minimum curve is missing or too high
Lenovo IdeaPad Miix 700 audio analysis
(±) | speaker loudness is average but good (74.3 dB)
Analysis not possible as minimum curve is missing or too high
Huawei MateBook m5-6Y54 audio analysis
(-) | not very loud speakers (67 dB)
Bass 100 - 315 Hz
(-) | nearly no bass - on average 18.8% lower than median
(±) | linearity of bass is average (8.4% delta to prev. frequency)
Mids 400 - 2000 Hz
(±) | higher mids - on average 5.9% higher than median
(±) | linearity of mids is average (14.5% delta to prev. frequency)
Highs 2 - 16 kHz
(±) | higher highs - on average 5% higher than median
(±) | linearity of highs is average (7.9% delta to prev. frequency)
Overall 100 - 16.000 Hz
(±) | linearity of overall sound is average (28.9% difference to median)
Compared to same class
» 85% of all tested devices in this class were better, 3% similar, 12% worse
» The best had a delta of 6%, average was 21%, worst was 57%
Compared to all devices tested
» 84% of all tested devices were better, 3% similar, 13% worse
» The best had a delta of 4%, average was 25%, worst was 134%
| Off / Standby | |
| Idle | |
| Load |
|
| Lenovo Miix 510 Pro 80U10006GE 6200U, HD Graphics 520, Samsung PM951 NVMe MZVLV256, IPS, 1920x1200, 12.20 | Microsoft Surface Pro 4, Core i5, 128GB 6300U, HD Graphics 520, Samsung MZFLV128 NVMe, IPS, 2736x1824, 12.30 | HP Elite x2 1012 G1 6Y54, HD Graphics 515, Liteon L8H-256V2G, IPS, 1920x1280, 12.10 | Acer Aspire Switch Alpha 12 SA5-271-56HM 6200U, HD Graphics 520, Kingston RBU-SNS8152S3256GG2, IPS, 2160x1440, 12.00 | Huawei MateBook m5-6Y54 6Y54, HD Graphics 515, SanDisk SD8SN8U256G1027, IPS, 2160x1440, 12.00 | |
|---|---|---|---|---|---|
| Power Consumption | 18% | 18% | -7% | 0% | |
| Idle Minimum * | 4.2 | 4.4 -5% | 3.7 12% | 7.3 -74% | 7.4 -76% |
| Idle Average * | 11.5 | 9 22% | 6.8 41% | 10 13% | 11.6 -1% |
| Idle Maximum * | 11.7 | 10.7 9% | 7.6 35% | 10.15 13% | 11.6 1% |
| Load Average * | 31 | 19.6 37% | 22.5 27% | 25.2 19% | 16.8 46% |
| Load Maximum * | 27.4 | 19.9 27% | 34.5 -26% | 29.3 -7% | 19.1 30% |
* ... smaller is better
| Lenovo Miix 510 Pro 80U10006GE 6200U, HD Graphics 520, 50 Wh | Microsoft Surface Pro 4, Core i5, 128GB 6300U, HD Graphics 520, 38 Wh | HP Elite x2 1012 G1 6Y54, HD Graphics 515, 37 Wh | Acer Aspire Switch Alpha 12 SA5-271-56HM 6200U, HD Graphics 520, 37 Wh | Lenovo IdeaPad Miix 700 6Y54, HD Graphics 515, 41 Wh | Huawei MateBook m5-6Y54 6Y54, HD Graphics 515, 33 Wh | |
|---|---|---|---|---|---|---|
| Battery Runtime | 21% | 20% | -2% | 34% | -18% | |
| Reader / Idle | 696 | 899 29% | 732 5% | 640 -8% | 861 24% | 478 -31% |
| WiFi v1.3 | 322 | 427 33% | 443 38% | 321 0% | 440 37% | 263 -18% |
| Load | 111 | 111 0% | 130 17% | 112 1% | 157 41% | 106 -5% |
| H.264 | 432 | 468 | 450 |
Pros
Cons
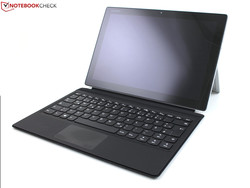
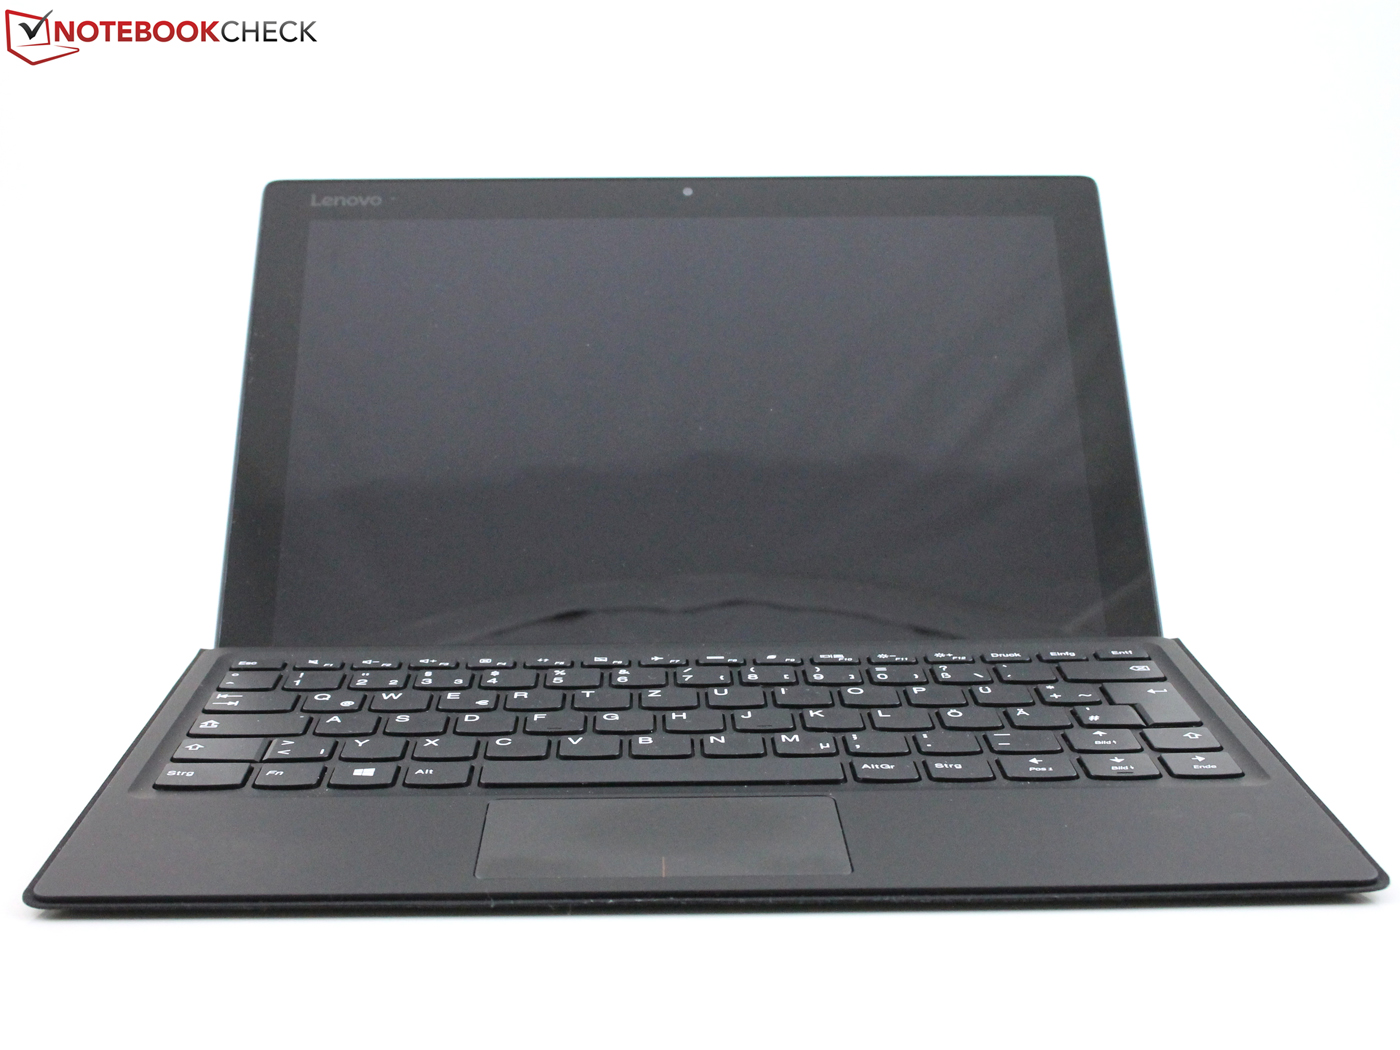
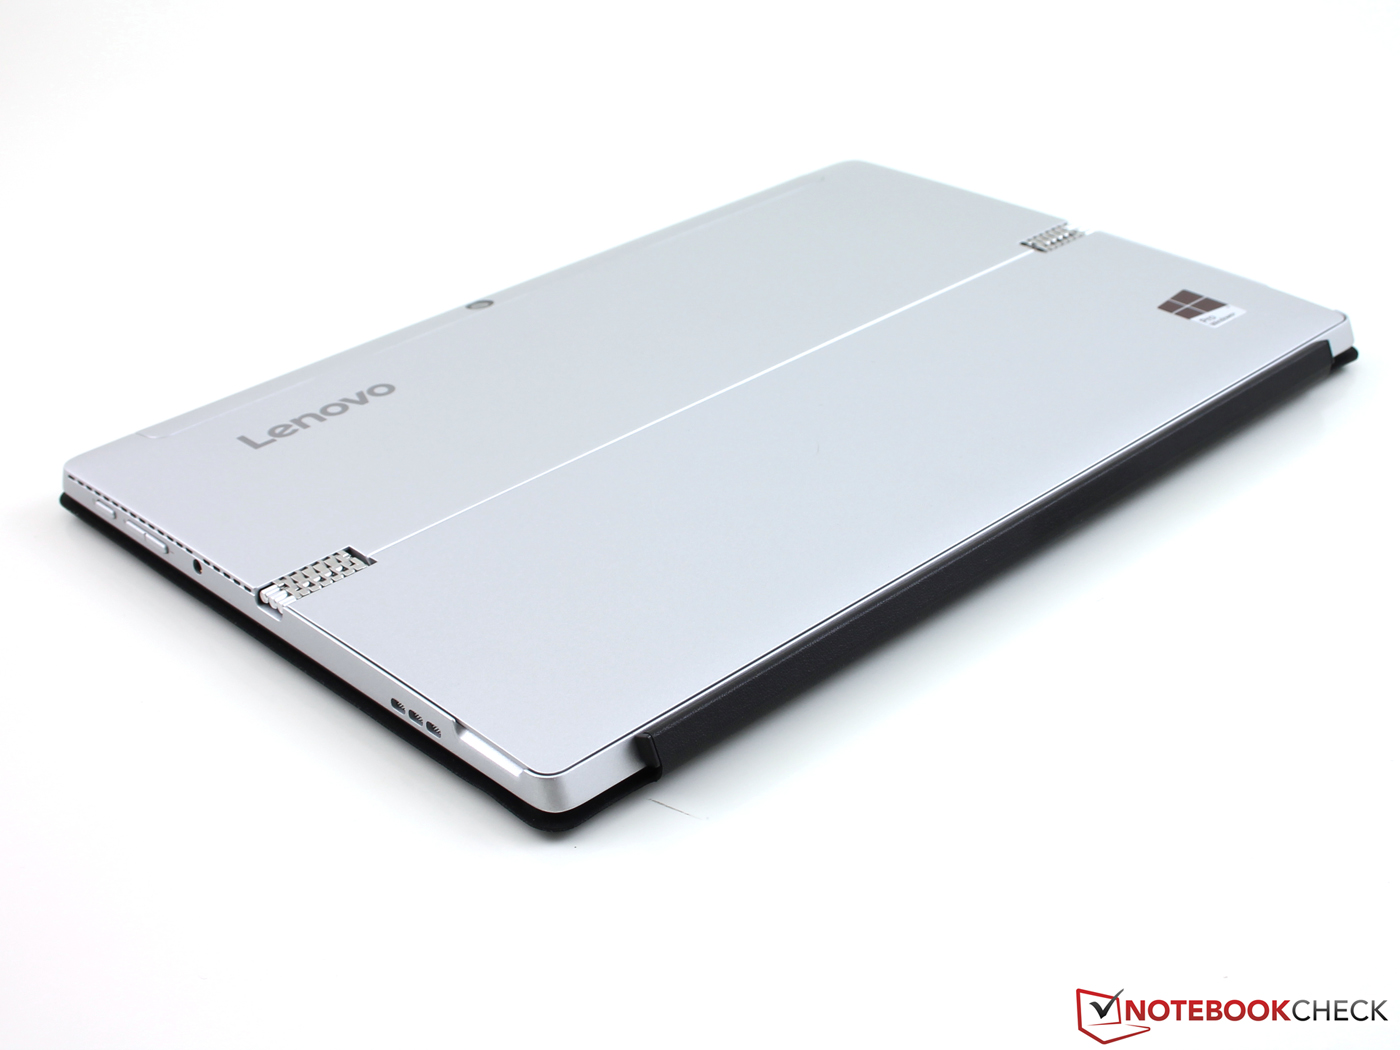
联想Miix 510 Pro是Surface Pro 4的有力挑战者吗?是的,不过这台二合一设备的整体表现并不及更成熟的微软设备。Miix需要更长的电池续航,更好的主相机品质和色彩更绚丽的屏幕,才能得到更高的分数。
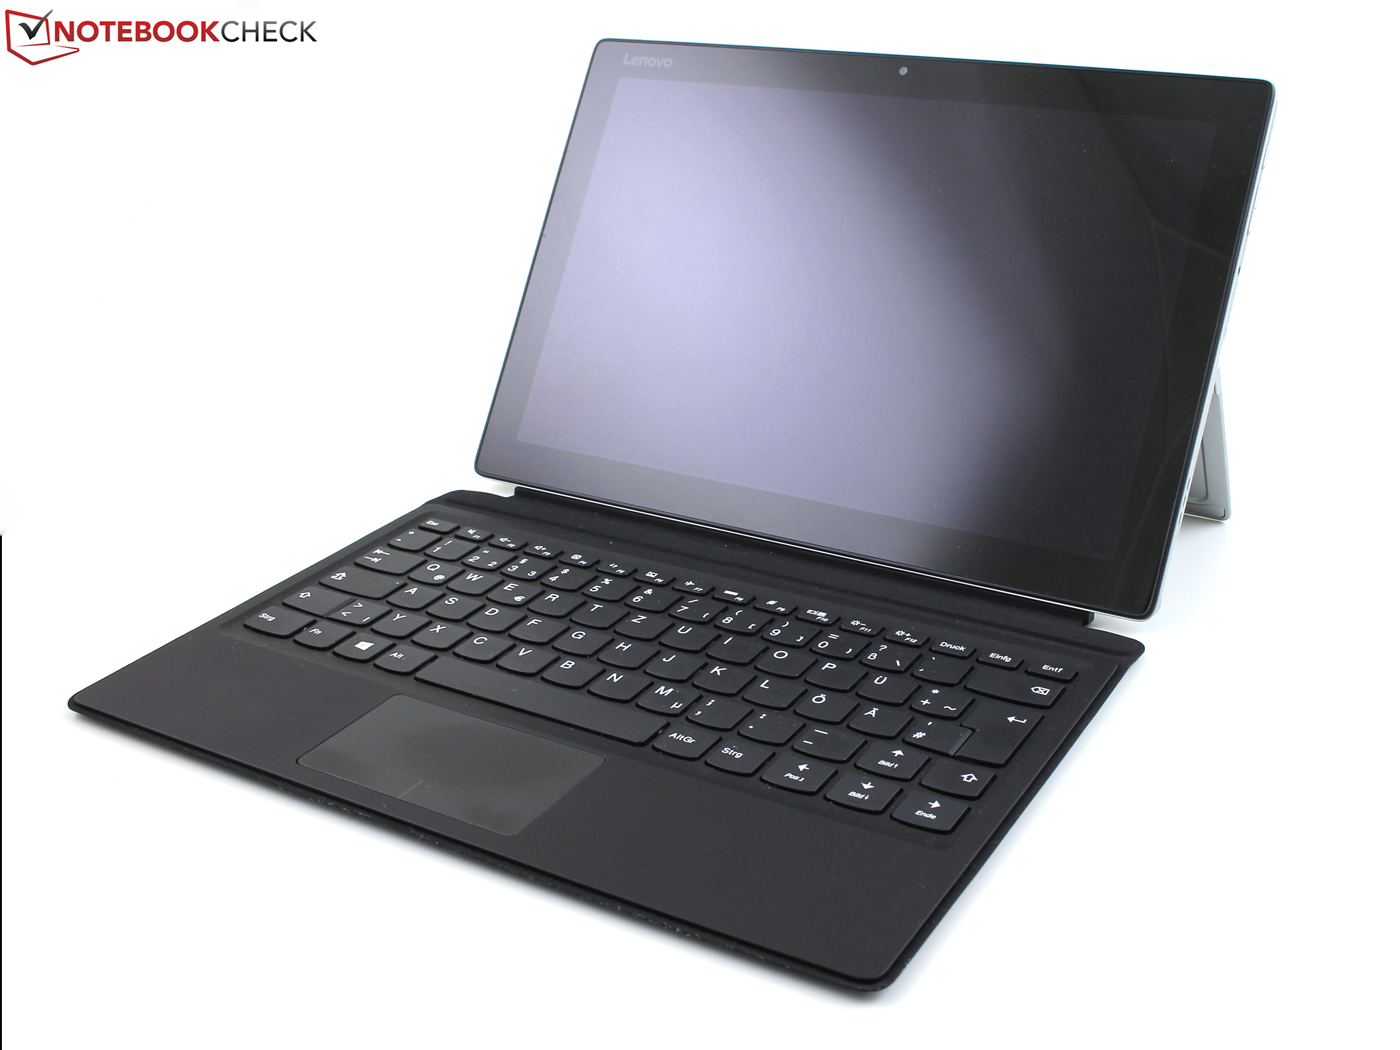
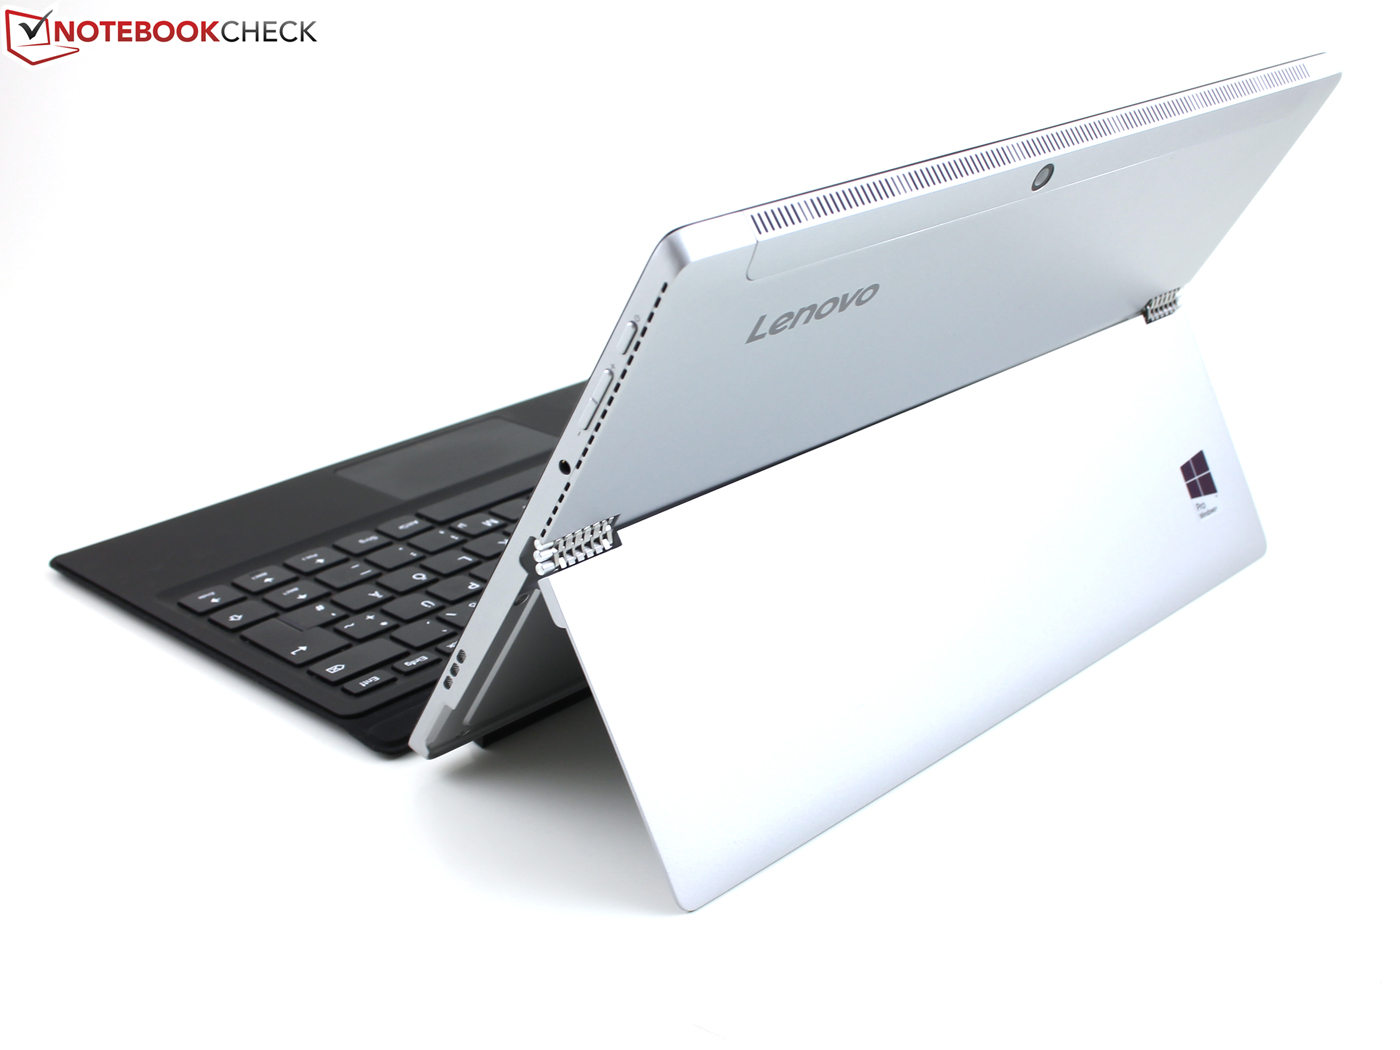
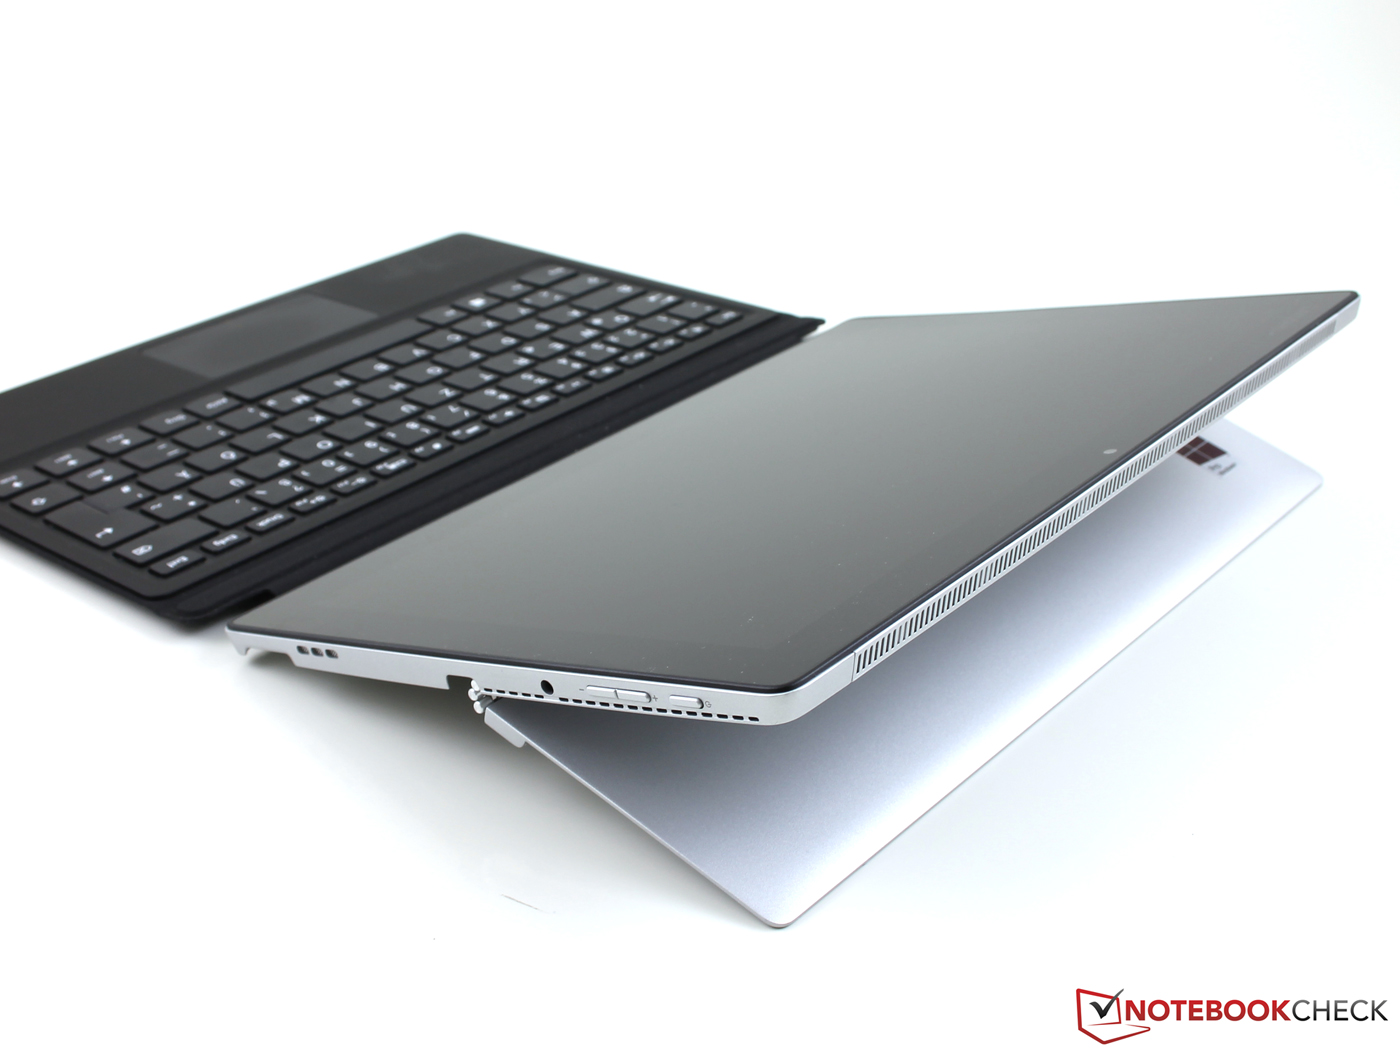
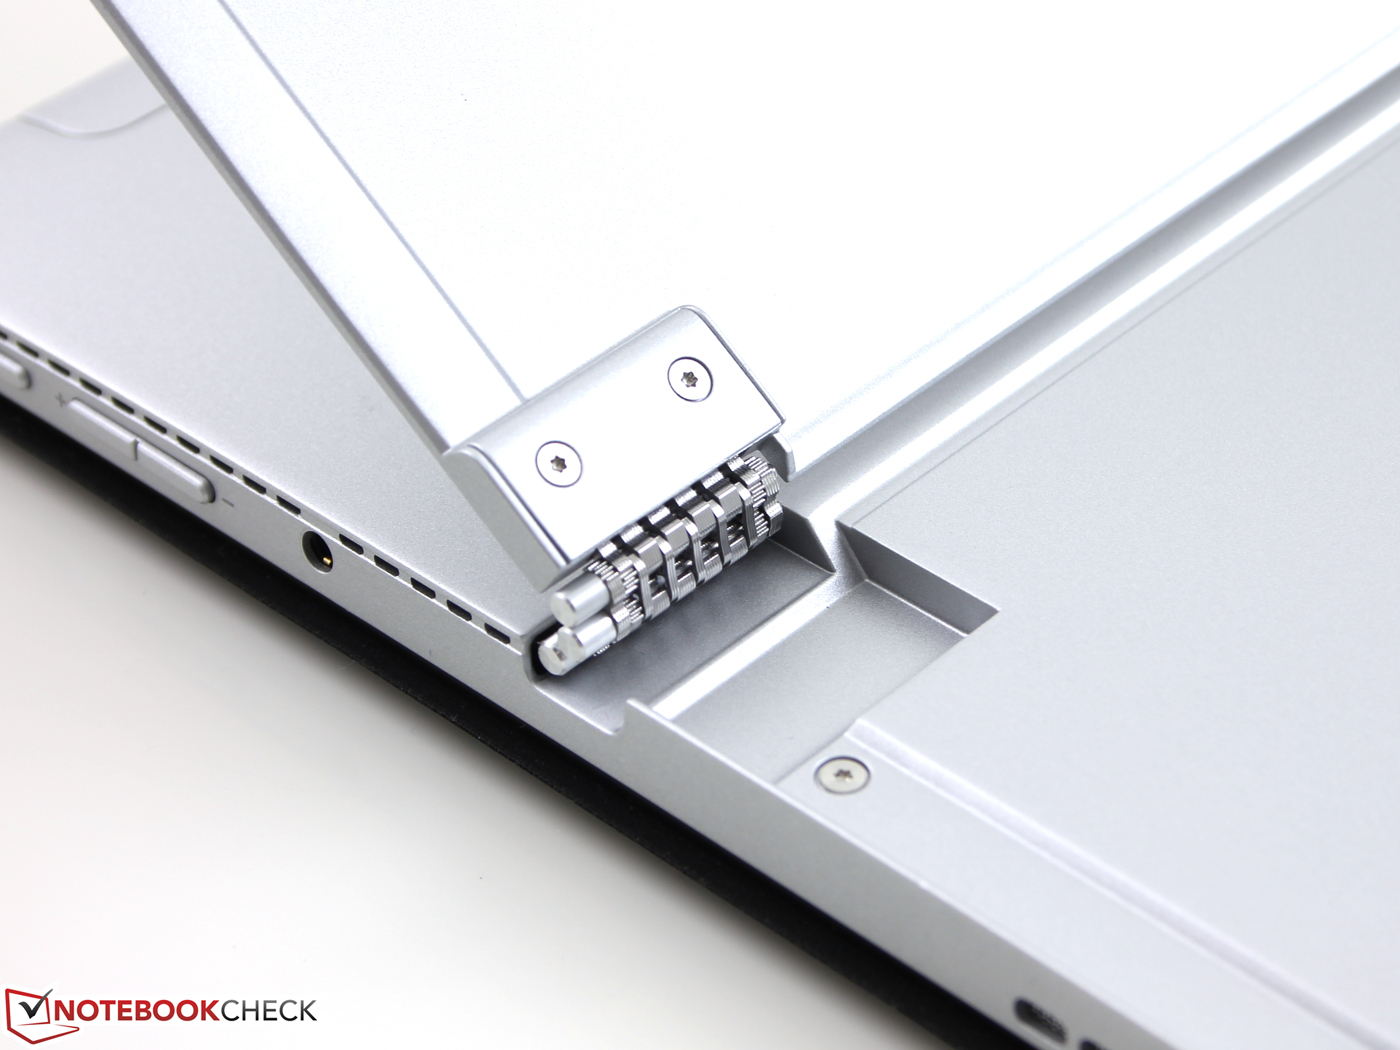
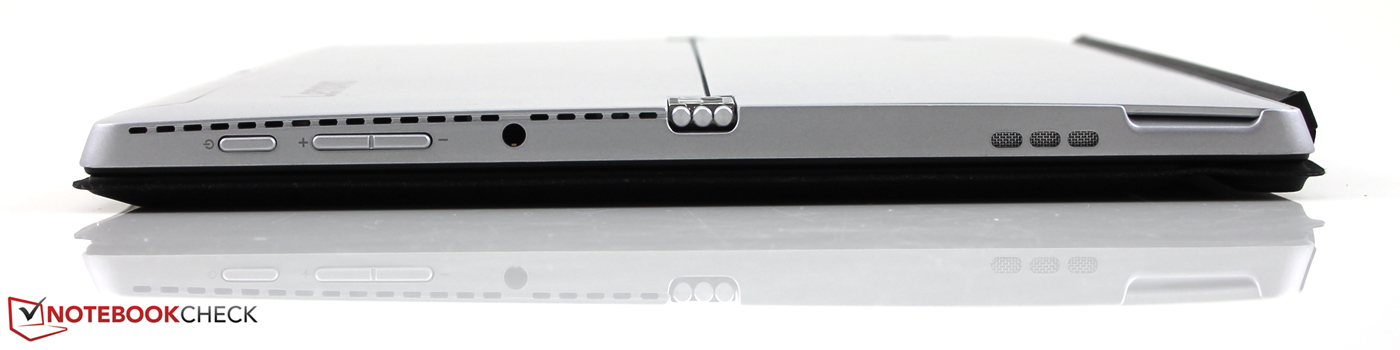
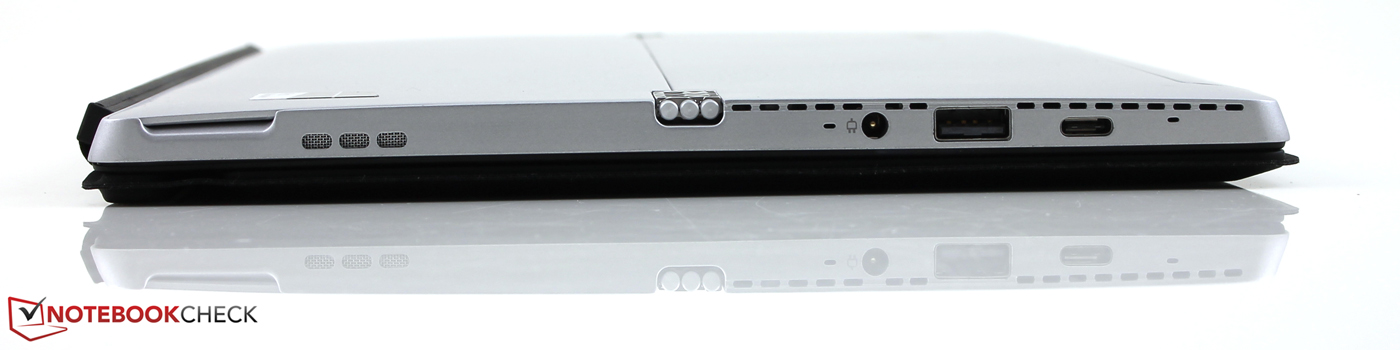
我们十分欣赏它的高品质机身和优秀的键盘,不过尺寸较小的触控版则让我们很难满意。它的应用程序性能十分出色,尽管处理器只能在测试中保持标准速度。归功于出色的键盘,不错的麦克风和物理接口(USB-A和C),Miix 510可以成为工作交流极为便利的随身设备。我们更希望它能够在机身上提供一个视频输出接口,用户目前需要购买额外的拓展坞才能连接显示器。
联想为Miix 510提供了多种配置可供用户选择,从入门级到高端各不相同。宏碁也为Switch 12 Alpha采用了相似的策略,它的售价从650欧元到1200欧元不等(约4805到8871人民币)。
Aspire Switch Alpha 12当然也是一个不错的选择,特别是如果你需要更高的屏幕分辨率的话。它不支持LTE,但宏碁提供了512GB固态硬盘可选。一些机型附带手写笔,但更需要注意的是,不是所有机型都附带键盘底座。
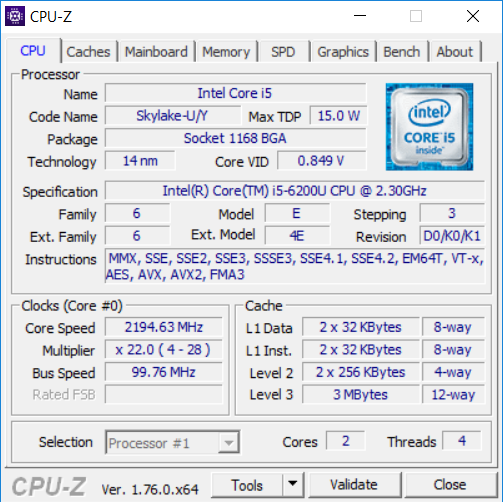
搭配Type Cover和256GB硬盘的微软 Surface Pro 4售价1300欧元(约9610人民币)。它的酷睿 i5 6300U处理器性能表现相当(并没有快很多)。Surface Pro搭配的屏幕提供了更高的分辨率,更丰富的色彩和手写笔,但缺少LTE网络和USB-C接口。售价980欧元(约7245人民币)的Miix 510 Pro定位十分合理。我们的测试机型搭配了英特尔酷睿 i5 6200U,8GB DDR4内存和256GB固态硬盘;键盘底座也随机附带。联想的这台二合一设备定价略高于配置相近的Switch 12 Alpha。
注:本文是基于完整评测的缩减版本,阅读完整的英文评测,请点击这里。
Lenovo Miix 510 Pro 80U10006GE
-
11/01/2016 v5.1(old)
Sebastian Jentsch
Pricecompare
