 Deutsch
 English
 Español
 Français
 Italiano
 Nederlands
 Polski
 Português
 Русский
 Türkçe
 Svenska
 Chinese
 Magyar
戴尔 Latitude 7480 (7600U, FHD) 笔记本电脑简短评测

| SD Card Reader | |
| average JPG Copy Test (av. of 3 runs) | |
| Dell Latitude 14 7000 Series E7470 | |
| Lenovo ThinkPad T470s-20HGS00V00 | |
| Dell Latitude 7480 | |
| HP EliteBook 840 G4-Z2V49ET ABD | |
| Lenovo ThinkPad X1 Carbon 2017-20HQS03P00 | |
| maximum AS SSD Seq Read Test (1GB) | |
| Dell Latitude 14 7000 Series E7470 | |
| Dell Latitude 7480 | |
| Lenovo ThinkPad T470s-20HGS00V00 | |
| HP EliteBook 840 G4-Z2V49ET ABD | |
| Lenovo ThinkPad X1 Carbon 2017-20HQS03P00 | |
| Networking | |
| WiFi Speed Client 1m 4M x10 Netgear AX12 | |
| WiFi Speed Server 1m 4M x10 (-R) Netgear AX12 |
| |||||||||||||||||||||||||
Brightness Distribution: 85 %
Center on Battery: 344 cd/m²
Contrast: 1075:1 (Black: 0.32 cd/m²)
ΔE Color 2.6 | 0.5-29.43 Ø5
ΔE Greyscale 2.6 | 0.57-98 Ø5.3
92.27% sRGB (Argyll 1.6.3 3D)
65.82% AdobeRGB 1998 (Argyll 1.6.3 3D)
65.8% AdobeRGB 1998 (Argyll 2.2.0 3D)
92.3% sRGB (Argyll 2.2.0 3D)
65.4% Display P3 (Argyll 2.2.0 3D)
Gamma: 2.28
| Dell Latitude 7480 LG Philips LGD0557, IPS, 14.00, 1920x1080 | Dell Latitude 14 7000 Series E7470 AUO B140QAN Dell PN F0WXVV, IPS, 14.00, 2560x1440 | Lenovo ThinkPad X1 Carbon 2017-20HQS03P00 B140HAN03_1, IPS, 14.00, 1920x1080 | HP EliteBook 840 G4-Z2V49ET ABD AUO123D, TN, 14.00, 1920x1080 | Lenovo ThinkPad T470s-20HGS00V00 B140QAN01.5, IPS, 14.00, 2560x1440 | |
|---|---|---|---|---|---|
| Display | 4% | -6% | -13% | 5% | |
| Display P3 Coverage | 65.4 | 67.2 3% | 61.4 -6% | 55.8 -15% | 69 6% |
| sRGB Coverage | 92.3 | 95.9 4% | 85.9 -7% | 80.7 -13% | 95.1 3% |
| AdobeRGB 1998 Coverage | 65.8 | 69.3 5% | 62.4 -5% | 57.7 -12% | 69.6 6% |
| Response Times | -3% | -2% | 15% | -3% | |
| Response Time Grey 50% / Grey 80% * | 40.8 ? | 48 ? -18% | 41.6 ? -2% | 39 ? 4% | 46.4 ? -14% |
| Response Time Black / White * | 31.2 ? | 27 ? 13% | 31.6 ? -1% | 23 ? 26% | 28.8 ? 8% |
| PWM Frequency | |||||
| Screen | -1% | -26% | -90% | -39% | |
| Brightness middle | 344 | 380 10% | 311 -10% | 346 1% | 327 -5% |
| Brightness | 321 | 354 10% | 288 -10% | 317 -1% | 311 -3% |
| Brightness Distribution | 85 | 81 -5% | 85 0% | 86 1% | 88 4% |
| Black Level * | 0.32 | 0.26 19% | 0.24 25% | 0.86 -169% | 0.25 22% |
| Contrast | 1075 | 1462 36% | 1296 21% | 402 -63% | 1308 22% |
| Colorchecker dE 2000 * | 2.6 | 3.11 -20% | 5.5 -112% | 8.64 -232% | 6.1 -135% |
| Colorchecker dE 2000 max. * | 7.8 | 6.73 14% | 9 -15% | 13.58 -74% | 12.2 -56% |
| Greyscale dE 2000 * | 2.6 | 4.35 -67% | 6.2 -138% | 11.24 -332% | 8.8 -238% |
| Gamma | 2.28 96% | 2.37 93% | 2.02 109% | 2.62 84% | 2.18 101% |
| CCT | 7050 92% | 6771 96% | 5950 109% | 12530 52% | 6172 105% |
| Color Space (Percent of AdobeRGB 1998) | 65.82 | 62 -6% | 55.96 -15% | 52 -21% | 61.56 -6% |
| Color Space (Percent of sRGB) | 92.27 | 96 4% | 85.77 -7% | 80 -13% | 94.88 3% |
| Total Average (Program / Settings) | 0% /
0% | -11% /
-19% | -29% /
-61% | -12% /
-26% |
* ... smaller is better
Display Response Times
| ↔ Response Time Black to White | ||
|---|---|---|
| 31.2 ms ... rise ↗ and fall ↘ combined | ↗ 18.8 ms rise | 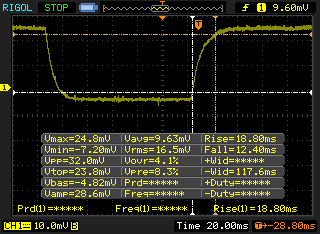 |
| ↘ 12.4 ms fall | ||
| The screen shows slow response rates in our tests and will be unsatisfactory for gamers. In comparison, all tested devices range from 0.1 (minimum) to 240 (maximum) ms. » 82 % of all devices are better. This means that the measured response time is worse than the average of all tested devices (21.5 ms). | ||
| ↔ Response Time 50% Grey to 80% Grey | ||
| 40.8 ms ... rise ↗ and fall ↘ combined | ↗ 19.2 ms rise | 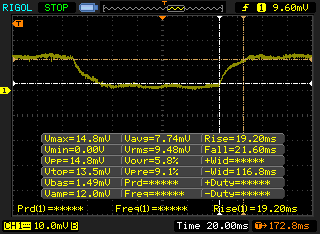 |
| ↘ 21.6 ms fall | ||
| The screen shows slow response rates in our tests and will be unsatisfactory for gamers. In comparison, all tested devices range from 0.2 (minimum) to 636 (maximum) ms. » 59 % of all devices are better. This means that the measured response time is worse than the average of all tested devices (33.7 ms). | ||
Screen Flickering / PWM (Pulse-Width Modulation)
| Screen flickering / PWM not detected | 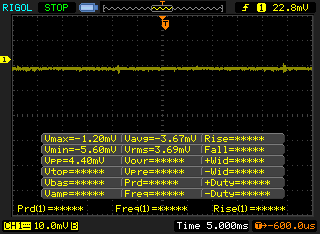 | ||
In comparison: 53 % of all tested devices do not use PWM to dim the display. If PWM was detected, an average of 17924 (minimum: 5 - maximum: 3846000) Hz was measured. | |||
| Cinebench R10 | |
| Rendering Multiple CPUs 32Bit | |
| Lenovo ThinkPad T470s-20HGS00V00 | |
| Dell Latitude 7480 | |
| Rendering Single 32Bit | |
| Lenovo ThinkPad T470s-20HGS00V00 | |
| Dell Latitude 7480 | |
| Dell Latitude 14 7000 Series E7470 | |
| wPrime 2.10 - 1024m | |
| Dell Latitude 7480 | |
| Dell Latitude 7280 | |
| Lenovo ThinkPad T470s-20HGS00V00 | |
* ... smaller is better
| PCMark 8 Home Score Accelerated v2 | 3985 points | |
| PCMark 8 Creative Score Accelerated v2 | 4981 points | |
| PCMark 8 Work Score Accelerated v2 | 5052 points | |
Help | ||
| Dell Latitude 7480 Intel SSDSCKKF256H6 | Lenovo ThinkPad X1 Carbon 2017-20HQS03P00 Samsung PM961 NVMe MZVLW512HMJP | HP EliteBook 840 G4-Z2V49ET ABD Samsung PM961 MZVLW256HEHP | Lenovo ThinkPad T470s-20HGS00V00 Samsung SSD PM961 1TB M.2 PCIe 3.0 x4 NVMe (MZVLW1T0) | Dell Latitude 7280 SanDisk X400 M.2 2280 256GB | Dell Latitude 5480 Toshiba SG5 256GB THNSNK256GVN8 | |
|---|---|---|---|---|---|---|
| CrystalDiskMark 3.0 | 163% | 141% | 168% | -2% | -1% | |
| Read Seq | 486.5 | 1827 276% | 1819 274% | 1760 262% | 470.8 -3% | 469.4 -4% |
| Write Seq | 418.6 | 1383 230% | 1263 202% | 1666 298% | 477.4 14% | 264.8 -37% |
| Read 512 | 354.3 | 814 130% | 922 160% | 832 135% | 370.1 4% | 408.1 15% |
| Write 512 | 306.8 | 1098 258% | 804 162% | 1064 247% | 323.2 5% | 265.5 -13% |
| Read 4k | 29.25 | 61 109% | 61.4 110% | 53.2 82% | 30.23 3% | 24.66 -16% |
| Write 4k | 90.5 | 172.2 90% | 157.1 74% | 167.4 85% | 59.5 -34% | 114.8 27% |
| Read 4k QD32 | 280.2 | 601 114% | 513 83% | 630 125% | 344.4 23% | 380.3 36% |
| Write 4k QD32 | 252.8 | 495.6 96% | 410.2 62% | 533 111% | 183 -28% | 207.2 -18% |

| 3DMark | |
| 1280x720 Cloud Gate Standard Graphics | |
| Lenovo ThinkPad T470s-20HGS00V00 | |
| Lenovo ThinkPad X1 Carbon 2017-20HQS03P00 | |
| Dell Latitude 5480 | |
| Dell Latitude 7480 | |
| Dell Latitude 7280 | |
| HP EliteBook 840 G4-Z2V49ET ABD | |
| Dell Latitude 14 7000 Series E7470 | |
| 1920x1080 Fire Strike Graphics | |
| Lenovo ThinkPad T470s-20HGS00V00 | |
| Lenovo ThinkPad X1 Carbon 2017-20HQS03P00 | |
| Dell Latitude 5480 | |
| Dell Latitude 7480 | |
| Dell Latitude 7280 | |
| Dell Latitude 14 7000 Series E7470 | |
| HP EliteBook 840 G4-Z2V49ET ABD | |
| 1920x1080 Ice Storm Extreme Graphics | |
| Dell Latitude 7480 | |
| 3DMark 11 Performance | 1807 points | |
| 3DMark Ice Storm Standard Score | 64798 points | |
| 3DMark Cloud Gate Standard Score | 6706 points | |
| 3DMark Fire Strike Score | 934 points | |
| 3DMark Fire Strike Extreme Score | 441 points | |
Help | ||
| low | med. | high | ultra | |
| Tomb Raider (2013) | 83.6 | 43.3 | 25.9 | 12.7 |
| BioShock Infinite (2013) | 54.5 | 31.6 | 26.3 | 8.4 |
Noise Level
| Idle |
| 28.6 / 28.6 / 28.6 dB(A) |
| Load |
| 30.2 / 31.2 dB(A) |
 | ||
30 dB silent 40 dB(A) audible 50 dB(A) loud |
||
min: | ||
| Dell Latitude 7480 HD Graphics 620, i7-7600U, Intel SSDSCKKF256H6 | Lenovo ThinkPad X1 Carbon 2017-20HQS03P00 HD Graphics 620, i7-7500U, Samsung PM961 NVMe MZVLW512HMJP | HP EliteBook 840 G4-Z2V49ET ABD HD Graphics 620, i5-7200U, Samsung PM961 MZVLW256HEHP | Lenovo ThinkPad T470s-20HGS00V00 HD Graphics 620, i7-7600U, Samsung SSD PM961 1TB M.2 PCIe 3.0 x4 NVMe (MZVLW1T0) | Dell Latitude 7280 HD Graphics 620, i7-7600U, SanDisk X400 M.2 2280 256GB | Dell Latitude 5480 HD Graphics 620, i7-7600U, Toshiba SG5 256GB THNSNK256GVN8 | |
|---|---|---|---|---|---|---|
| Noise | -11% | -9% | -13% | -3% | -20% | |
| Idle Minimum * | 28.6 | 29.3 -2% | 31 -8% | 28.9 -1% | 29.4 -3% | 29.6 -3% |
| Idle Average * | 28.6 | 29.3 -2% | 31 -8% | 28.9 -1% | 29.4 -3% | 29.6 -3% |
| Idle Maximum * | 28.6 | 32.2 -13% | 31 -8% | 30.1 -5% | 30 -5% | 29.6 -3% |
| Load Average * | 30.2 | 34.3 -14% | 33.5 -11% | 39.2 -30% | 30.6 -1% | 42 -39% |
| Load Maximum * | 31.2 | 39.3 -26% | 33.7 -8% | 39.2 -26% | 32.7 -5% | 47.1 -51% |
| off / environment * | 29.3 | 31 | 28.9 | 29.4 |
* ... smaller is better
(+) The maximum temperature on the upper side is 39 °C / 102 F, compared to the average of 34.2 °C / 94 F, ranging from 21.2 to 62.5 °C for the class Office.
(-) The bottom heats up to a maximum of 47.2 °C / 117 F, compared to the average of 36.7 °C / 98 F
(+) In idle usage, the average temperature for the upper side is 24.5 °C / 76 F, compared to the device average of 29.5 °C / 85 F.
(+) The palmrests and touchpad are cooler than skin temperature with a maximum of 24.2 °C / 75.6 F and are therefore cool to the touch.
(+) The average temperature of the palmrest area of similar devices was 27.7 °C / 81.9 F (+3.5 °C / 6.3 F).
Dell Latitude 7480 audio analysis
(±) | speaker loudness is average but good (75 dB)
Bass 100 - 315 Hz
(±) | reduced bass - on average 11.9% lower than median
(±) | linearity of bass is average (10.6% delta to prev. frequency)
Mids 400 - 2000 Hz
(+) | balanced mids - only 3.8% away from median
(±) | linearity of mids is average (7.8% delta to prev. frequency)
Highs 2 - 16 kHz
(±) | higher highs - on average 6.6% higher than median
(+) | highs are linear (6.3% delta to prev. frequency)
Overall 100 - 16.000 Hz
(±) | linearity of overall sound is average (23.2% difference to median)
Compared to same class
» 61% of all tested devices in this class were better, 9% similar, 30% worse
» The best had a delta of 7%, average was 22%, worst was 53%
Compared to all devices tested
» 65% of all tested devices were better, 6% similar, 29% worse
» The best had a delta of 4%, average was 25%, worst was 134%
Apple MacBook 12 (Early 2016) 1.1 GHz audio analysis
(+) | speakers can play relatively loud (83.6 dB)
Bass 100 - 315 Hz
(±) | reduced bass - on average 11.3% lower than median
(±) | linearity of bass is average (14.2% delta to prev. frequency)
Mids 400 - 2000 Hz
(+) | balanced mids - only 2.4% away from median
(+) | mids are linear (5.5% delta to prev. frequency)
Highs 2 - 16 kHz
(+) | balanced highs - only 2% away from median
(+) | highs are linear (4.5% delta to prev. frequency)
Overall 100 - 16.000 Hz
(+) | overall sound is linear (10.2% difference to median)
Compared to same class
» 5% of all tested devices in this class were better, 2% similar, 93% worse
» The best had a delta of 5%, average was 19%, worst was 53%
Compared to all devices tested
» 3% of all tested devices were better, 1% similar, 96% worse
» The best had a delta of 4%, average was 25%, worst was 134%
| Off / Standby | |
| Idle | |
| Load |
|
| Dell Latitude 7480 i7-7600U, HD Graphics 620, Intel SSDSCKKF256H6, IPS, 1920x1080, 14.00 | Lenovo ThinkPad X1 Carbon 2017-20HQS03P00 i7-7500U, HD Graphics 620, Samsung PM961 NVMe MZVLW512HMJP, IPS, 1920x1080, 14.00 | HP EliteBook 840 G4-Z2V49ET ABD i5-7200U, HD Graphics 620, Samsung PM961 MZVLW256HEHP, TN, 1920x1080, 14.00 | Lenovo ThinkPad T470s-20HGS00V00 i7-7600U, HD Graphics 620, Samsung SSD PM961 1TB M.2 PCIe 3.0 x4 NVMe (MZVLW1T0), IPS, 2560x1440, 14.00 | Dell Latitude 7280 i7-7600U, HD Graphics 620, SanDisk X400 M.2 2280 256GB, IPS, 1920x1080, 12.50 | Dell Latitude 5480 i7-7600U, HD Graphics 620, Toshiba SG5 256GB THNSNK256GVN8, IPS, 1920x1080, 14.00 | Dell Latitude 14 7000 Series E7470 6600U, HD Graphics 520, Samsung SSD PM851 M.2 2280 256GB, IPS, 2560x1440, 14.00 | |
|---|---|---|---|---|---|---|---|
| Power Consumption | -25% | 2% | -38% | 7% | -18% | -26% | |
| Idle Minimum * | 4.32 | 3.84 11% | 2.9 33% | 4.64 -7% | 4.28 1% | 6.64 -54% | 5.1 -18% |
| Idle Average * | 6.27 | 6.3 -0% | 5.6 11% | 8.93 -42% | 5.11 19% | 6.67 -6% | 8.5 -36% |
| Idle Maximum * | 6.35 | 8.6 -35% | 8.15 -28% | 9.12 -44% | 5.49 14% | 7.78 -23% | 10.1 -59% |
| Load Average * | 29.82 | 41.9 -41% | 30.6 -3% | 42.2 -42% | 29.83 -0% | 30.83 -3% | 35.2 -18% |
| Load Maximum * | 30.64 | 48.7 -59% | 31 -1% | 47.3 -54% | 30.05 2% | 31.7 -3% | 31 -1% |
* ... smaller is better
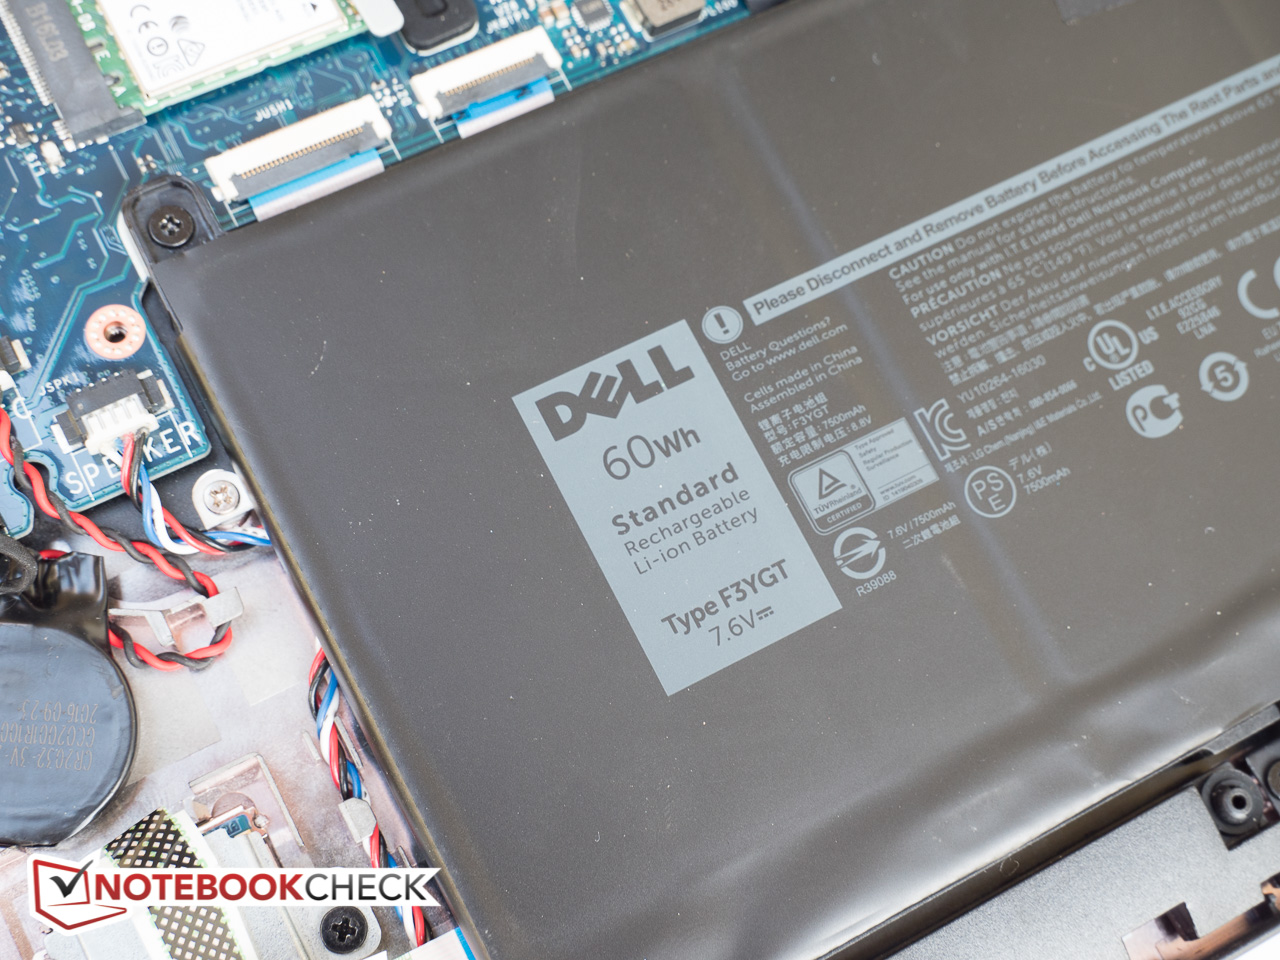
| Dell Latitude 7480 i7-7600U, HD Graphics 620, 60 Wh | Lenovo ThinkPad X1 Carbon 2017-20HQS03P00 i7-7500U, HD Graphics 620, 57 Wh | HP EliteBook 840 G4-Z2V49ET ABD i5-7200U, HD Graphics 620, 51 Wh | Lenovo ThinkPad T470s-20HGS00V00 i7-7600U, HD Graphics 620, 51 Wh | Dell Latitude 5480 i7-7600U, HD Graphics 620, 68 Wh | Dell Latitude 14 7000 Series E7470 6600U, HD Graphics 520, 55 Wh | |
|---|---|---|---|---|---|---|
| Battery Runtime | -31% | -15% | -47% | 5% | -44% | |
| Reader / Idle | 1662 | 1252 -25% | 1155 -31% | 787 -53% | 1448 -13% | |
| WiFi v1.3 | 719 | 496 -31% | 571 -21% | 417 -42% | 964 34% | 346 -52% |
| Load | 171 | 110 -36% | 184 8% | 93 -46% | 159 -7% | 112 -35% |
Pros
Cons
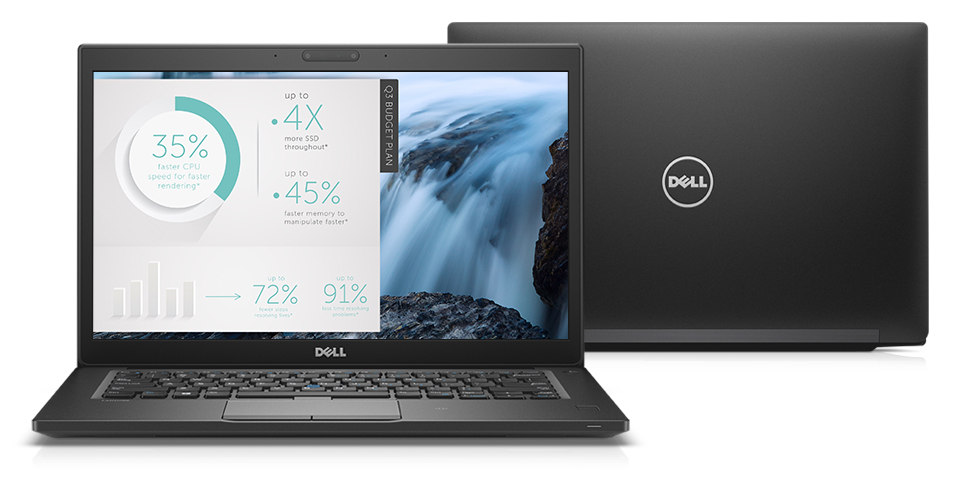
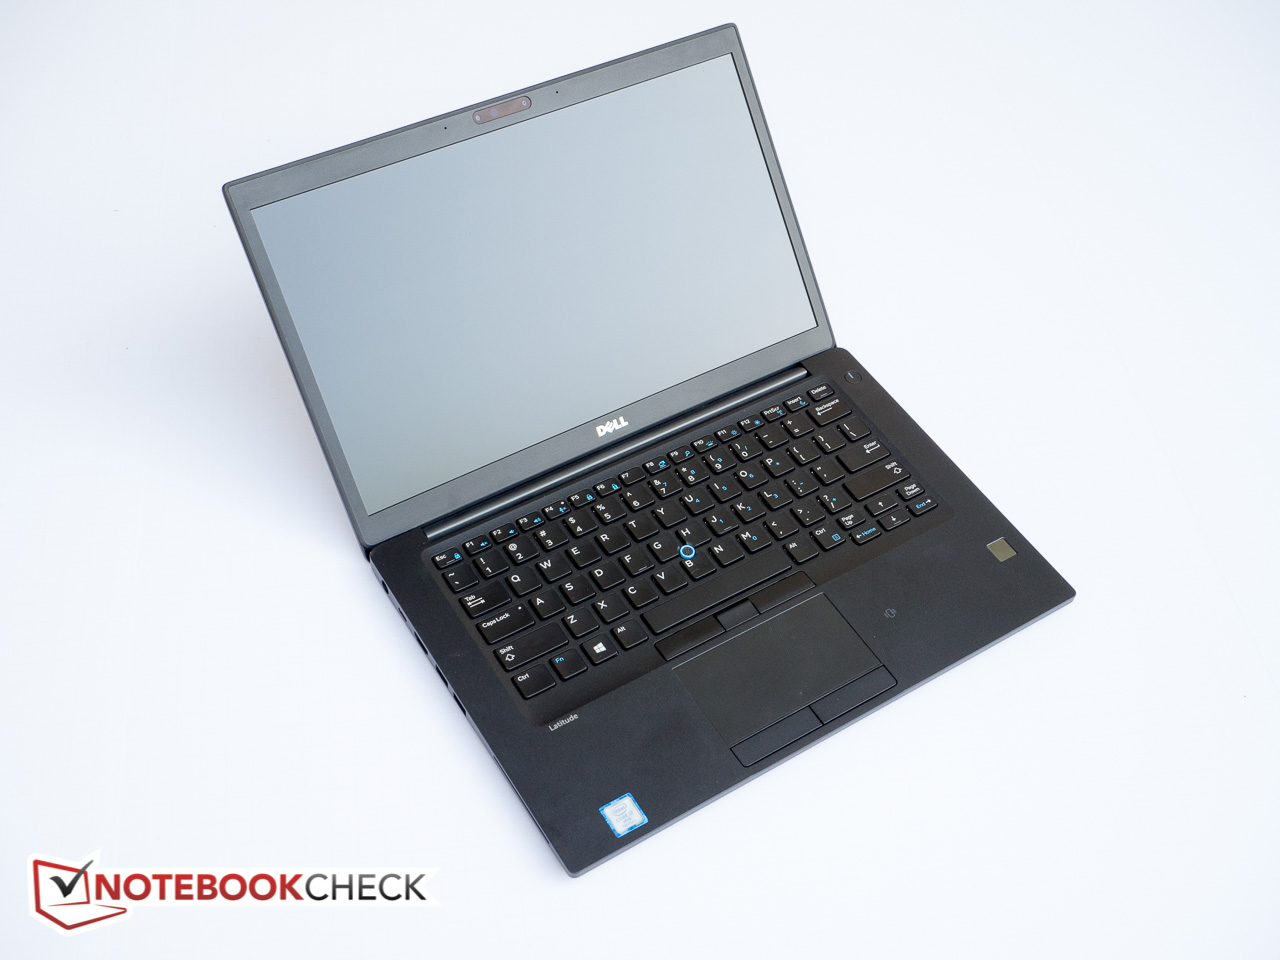
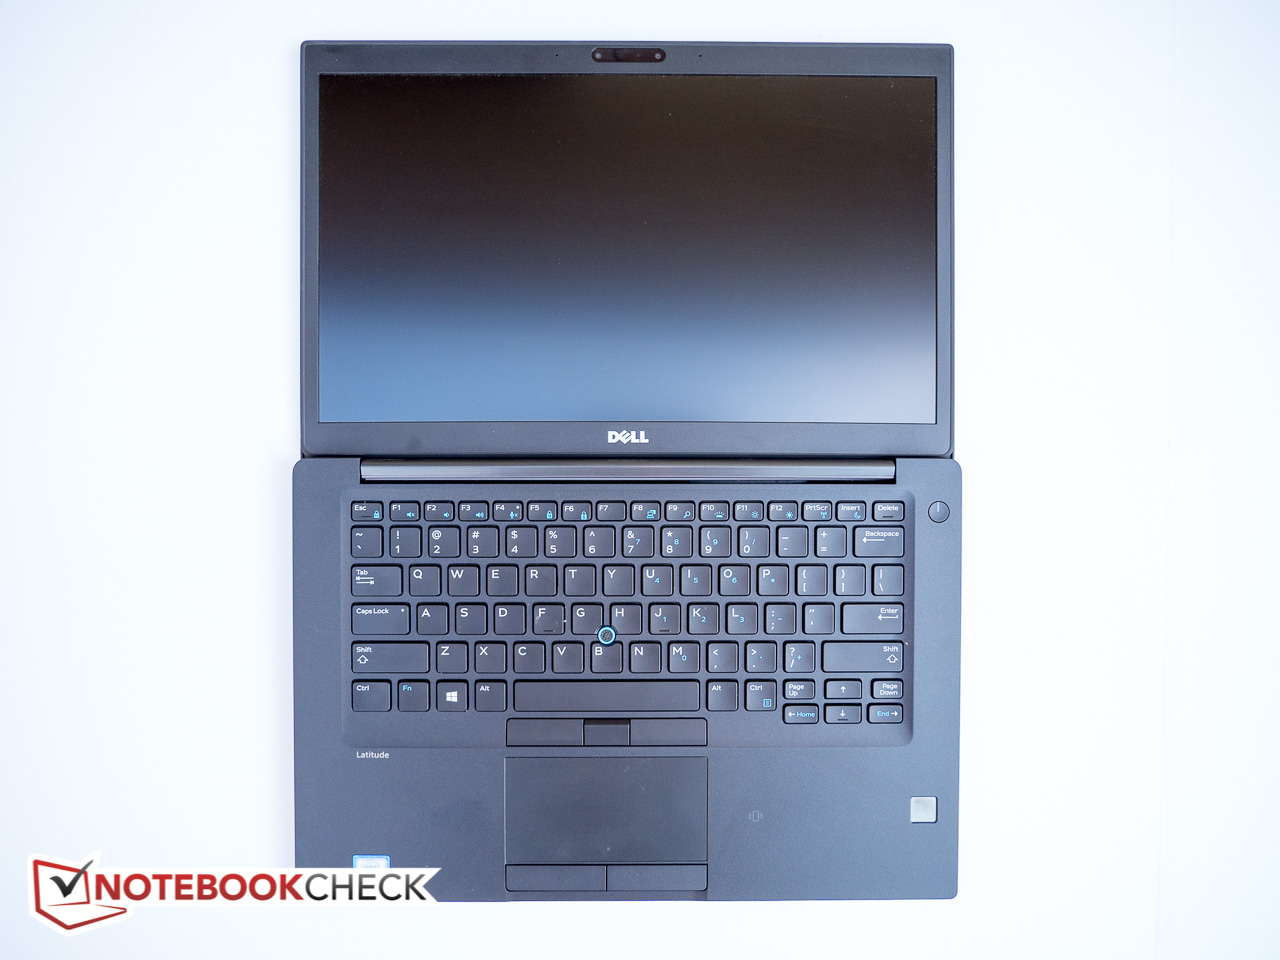
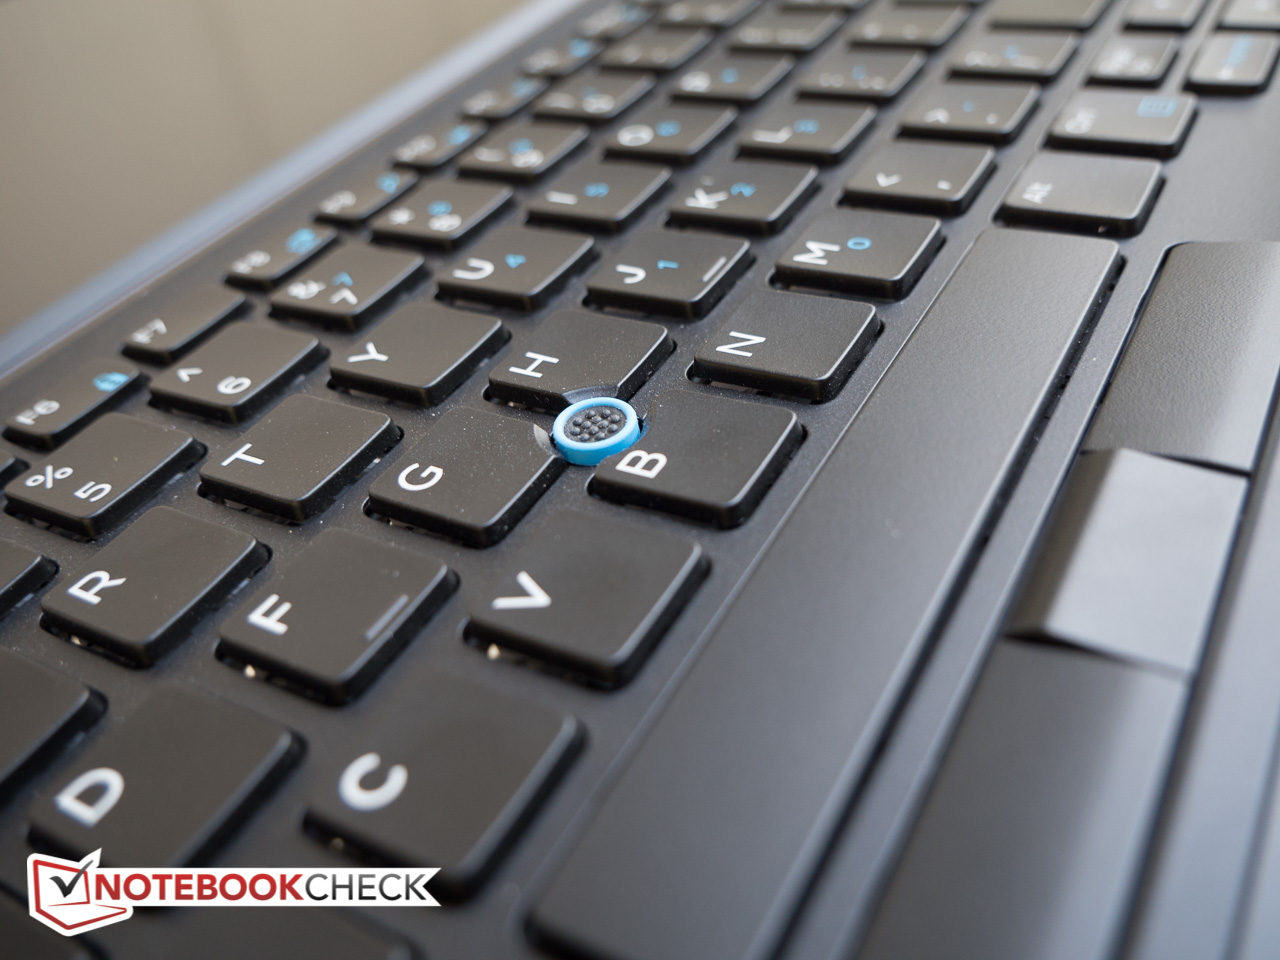
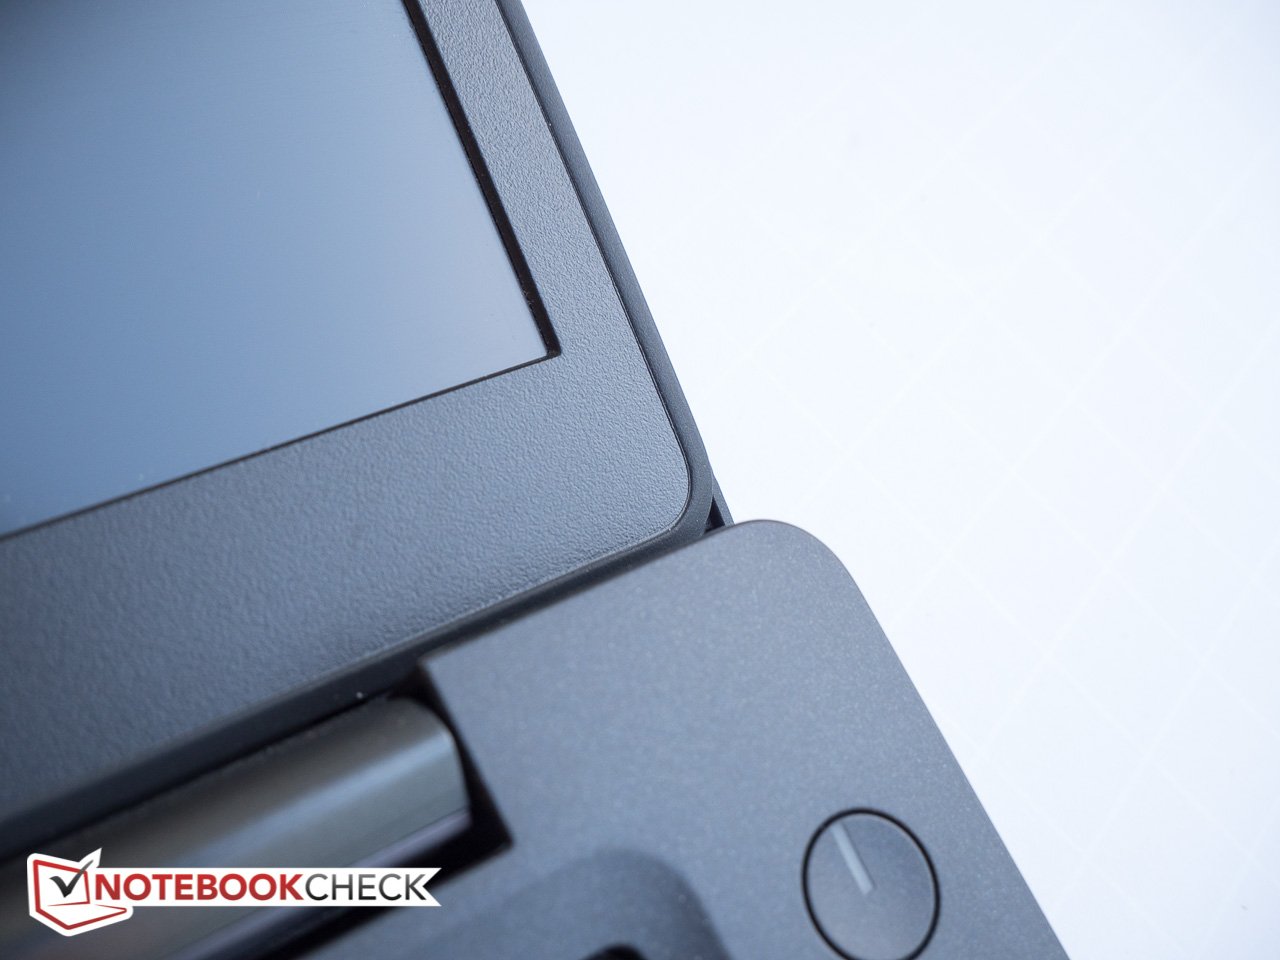
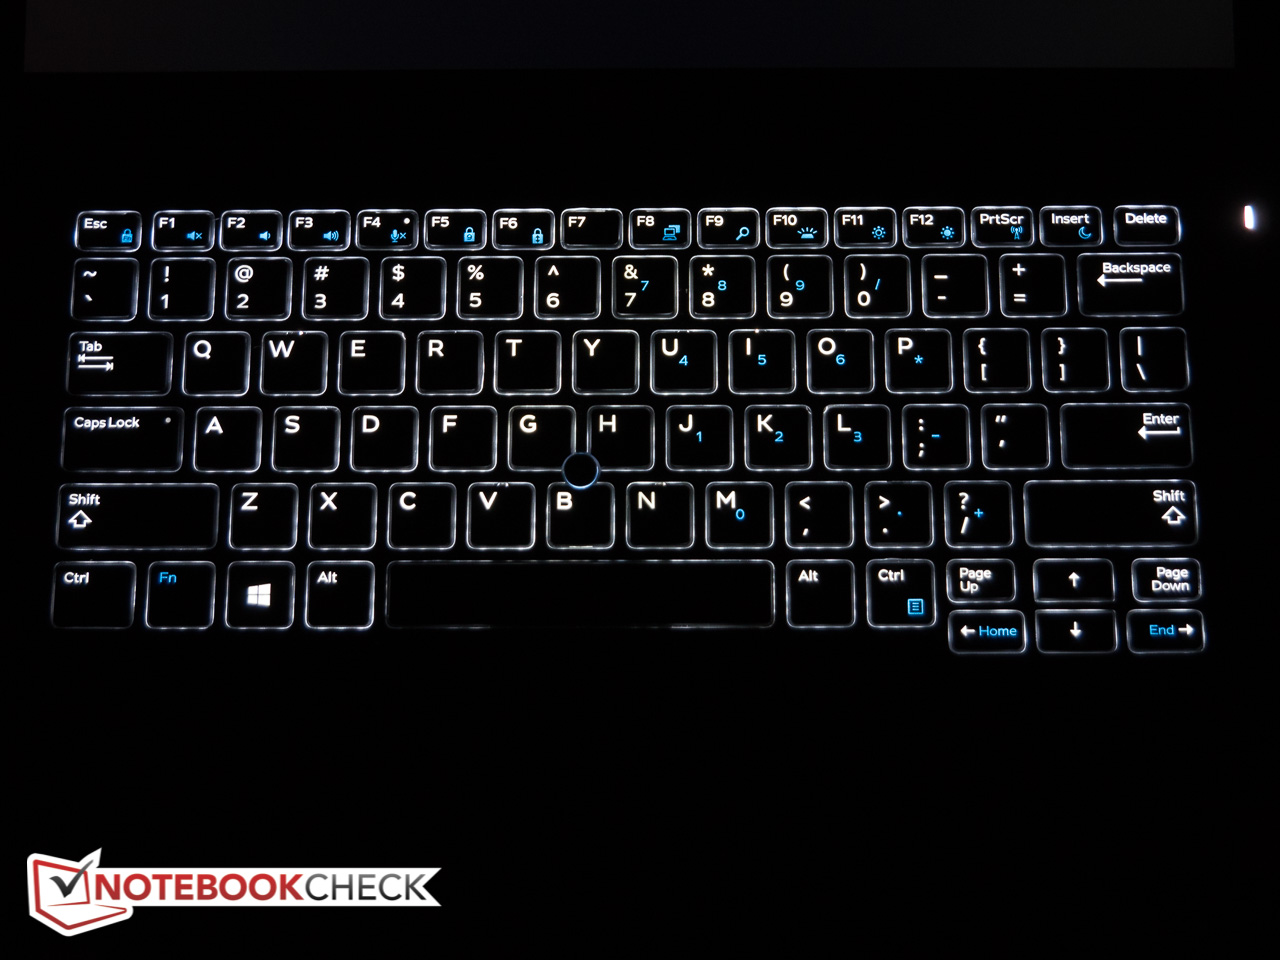
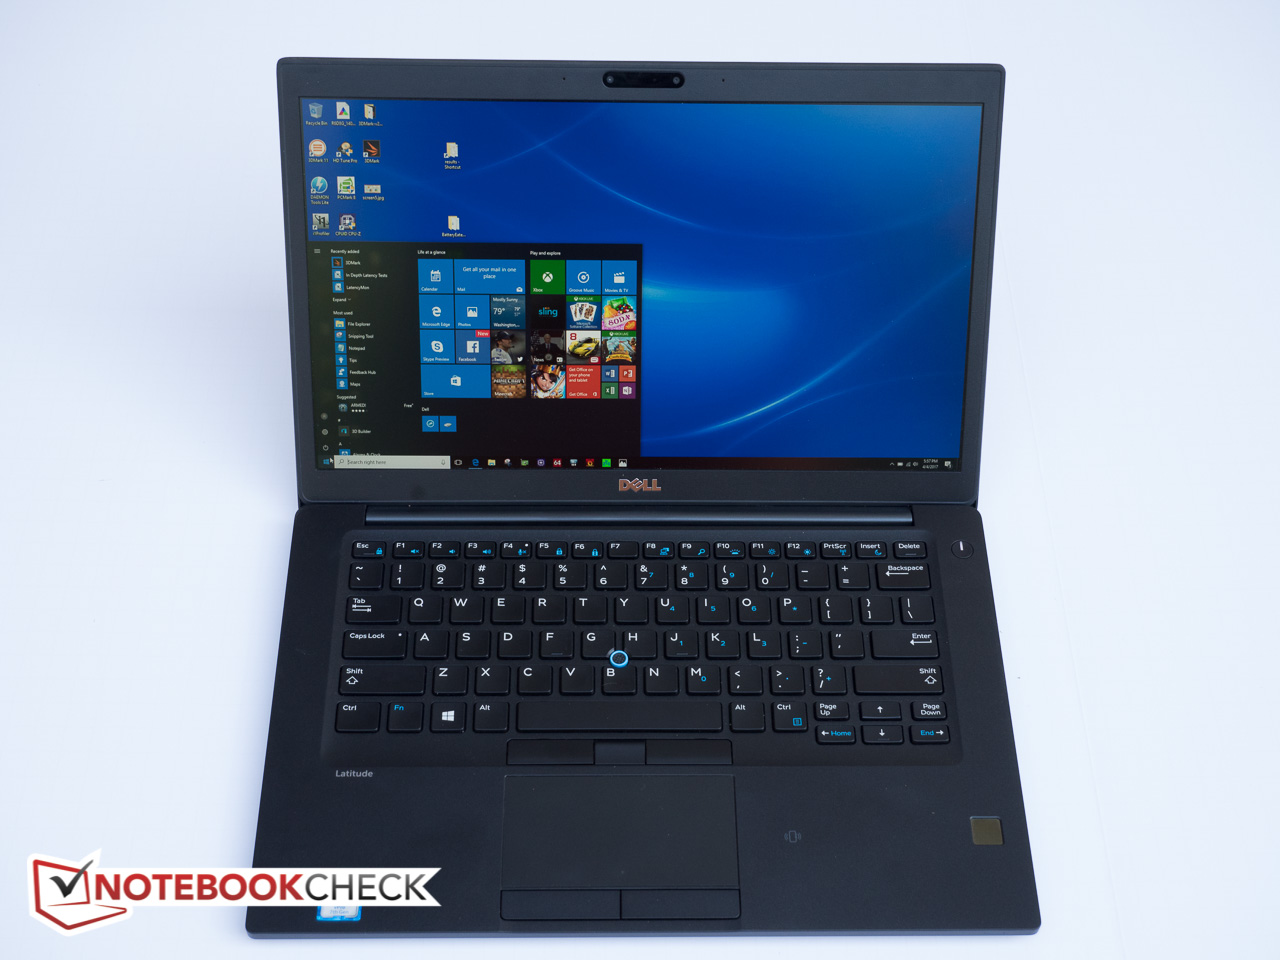
尽管不像戴尔自己的13寸及15寸XPS机型一样有名,Latitude 7480从某种程度上来说是其有名的主流笔记本的商务款。这台外观出色的14英寸笔记本比起上一代更加轻薄,但制造质量毫无疑问的保持了高水准。外壳坚硬且制造准确,有着柔软的类肤质图层。屏幕亮度高,色彩准确,且没有反射的问题,所以户外用户无须担心烦人的反射问题。性能是顶级的,尽管部分CPU性能测试在短期内出现了轻微的性能下降。这台笔记本在同步基准测试中表现优异。电池续航时间足够一整天的使用,尽管充电速度偏慢。输入设备极为出色,我们认为它是现在市面上最好的笔记本键盘之一。
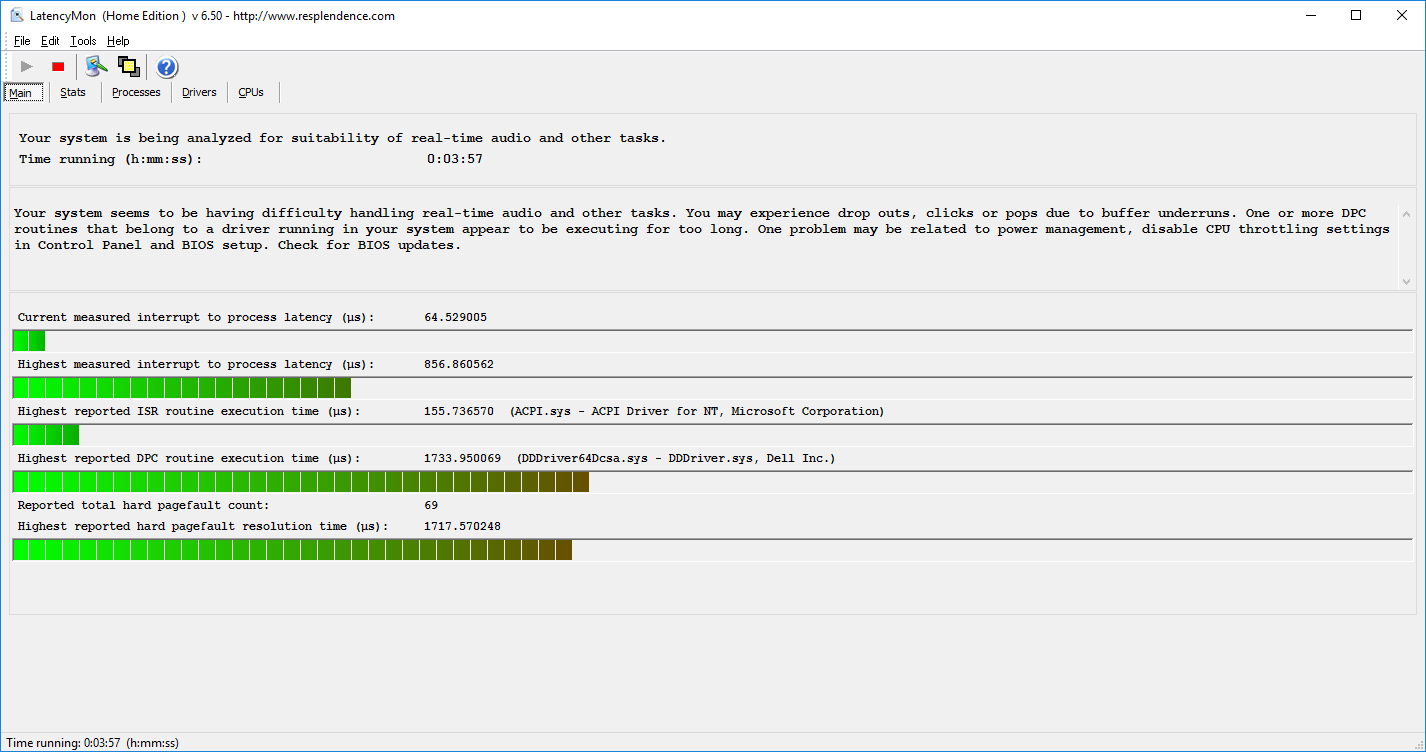
Latitude 7480 是一台高质量的稳固的商务本,但它伴随的线圈啸叫对它是个致命伤。
如果想要找到一个明显的缺点,那就是线圈啸叫,它在至少3英尺远的地方都能被听到而且看上去无论在任何负载条件下都会发生(但显然在待机状态下最为明显)。我们的确希望这只是我们这台测试样机的问题。但考虑到我们对Latitude 5480以及7280的测试中遇到了相同的测试问题,那么假设真实情况是这是一个广泛问题的话我们也不会惊讶。
注:本文是基于完整评测的缩减版本,阅读完整的英文评测,请点击这里。
Dell Latitude 7480
-
04/18/2017 v6(old)
Bernie Pechlaner
Pricecompare
