 Deutsch
 English
 Español
 Français
 Italiano
 Nederlands
 Polski
 Português
 Русский
 Türkçe
 Svenska
 Chinese
 Magyar
戴尔 Latitude 12 5285 二合一变形本简短评测
| SD Card Reader | |
| average JPG Copy Test (av. of 3 runs) | |
| Dell Latitude 12 5285 2-in-1 | |
| maximum AS SSD Seq Read Test (1GB) | |
| Dell Latitude 12 5285 2-in-1 | |
| Networking | |
| iperf3 transmit AX12 | |
| Asus Transformer 3 Pro T303UA-GN050T | |
| Microsoft Surface Pro 4, Core i5, 128GB (Klaus I211) | |
| Dell Latitude 12 5285 2-in-1 | |
| iperf3 receive AX12 | |
| Asus Transformer 3 Pro T303UA-GN050T | |
| Microsoft Surface Pro 4, Core i5, 128GB (Klaus I211) | |
| Dell Latitude 12 5285 2-in-1 | |
| |||||||||||||||||||||||||
Brightness Distribution: 88 %
Center on Battery: 523.2 cd/m²
Contrast: 1246:1 (Black: 0.42 cd/m²)
ΔE Color 4 | 0.5-29.43 Ø5
ΔE Greyscale 5.5 | 0.57-98 Ø5.3
93.97% sRGB (Argyll 1.6.3 3D)
64.86% AdobeRGB 1998 (Argyll 1.6.3 3D)
64.7% AdobeRGB 1998 (Argyll 2.2.0 3D)
94% sRGB (Argyll 2.2.0 3D)
62.8% Display P3 (Argyll 2.2.0 3D)
Gamma: 2.16
| Dell Latitude 12 5285 2-in-1 BOE06DC, IPS, 12.30, 1920x1280 | Microsoft Surface Pro 4, Core i5, 128GB Samsung 123YL01-001 ID: SDC3853, IPS, 12.30, 2736x1824 | HP Elite x2 1012 G1 LG Philips, IPS, 12.10, 1920x1280 | Acer Aspire Switch Alpha 12 SA5-271-70EQ WST KL.1200W.002 WST2216, IPS, 12.00, 2160x1440 | Asus Transformer 3 Pro T303UA-GN050T BOE BOE06AC (NV126A1M-N51), IPS, 12.60, 2880x1920 | |
|---|---|---|---|---|---|
| Display | 4% | -18% | -12% | 21% | |
| Display P3 Coverage | 62.8 | 65 4% | 53.8 -14% | 55.7 -11% | 81.8 30% |
| sRGB Coverage | 94 | 96.5 3% | 73.7 -22% | 82.7 -12% | 98.3 5% |
| AdobeRGB 1998 Coverage | 64.7 | 67 4% | 53.8 -17% | 56.9 -12% | 82.2 27% |
| Response Times | -28% | 24% | -6% | 10% | |
| Response Time Grey 50% / Grey 80% * | 42.4 ? | 46 ? -8% | 33.2 ? 22% | 21 ? 50% | 30 ? 29% |
| Response Time Black / White * | 30.8 ? | 31.2 ? -1% | 22.8 ? 26% | 28 ? 9% | 29 ? 6% |
| PWM Frequency | 210.1 ? | 50 ? -76% | 50 ? -76% | 200 ? -5% | |
| Screen | 1% | -24% | -33% | -3% | |
| Brightness middle | 523.2 | 413 -21% | 322 -38% | 391 -25% | 316 -40% |
| Brightness | 522 | 396 -24% | 319 -39% | 367 -30% | 307 -41% |
| Brightness Distribution | 88 | 87 -1% | 97 10% | 87 -1% | 91 3% |
| Black Level * | 0.42 | 0.36 14% | 0.42 -0% | 0.56 -33% | 0.29 31% |
| Contrast | 1246 | 1147 -8% | 767 -38% | 698 -44% | 1090 -13% |
| Colorchecker dE 2000 * | 4 | 3.09 23% | 6.02 -51% | 6.96 -74% | 3.91 2% |
| Colorchecker dE 2000 max. * | 8.6 | 10.06 -17% | 13.43 -56% | 7.9 8% | |
| Greyscale dE 2000 * | 5.5 | 3.92 29% | 6.29 -14% | 7.44 -35% | 5.37 2% |
| Gamma | 2.16 102% | 2.3 96% | 2.4 92% | 2.41 91% | 2.36 93% |
| CCT | 7546 86% | 7333 89% | 7712 84% | 8126 80% | 7812 83% |
| Color Space (Percent of AdobeRGB 1998) | 64.86 | 61 -6% | 47.8 -26% | 53 -18% | 72 11% |
| Color Space (Percent of sRGB) | 93.97 | 97 3% | 73.2 -22% | 83 -12% | 98 4% |
| Total Average (Program / Settings) | -8% /
-4% | -6% /
-16% | -17% /
-24% | 9% /
4% |
* ... smaller is better
Display Response Times
| ↔ Response Time Black to White | ||
|---|---|---|
| 30.8 ms ... rise ↗ and fall ↘ combined | ↗ 18 ms rise | 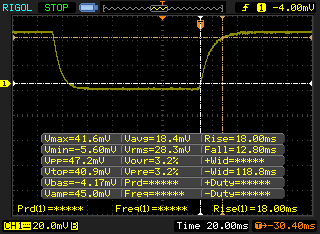 |
| ↘ 12.8 ms fall | ||
| The screen shows slow response rates in our tests and will be unsatisfactory for gamers. In comparison, all tested devices range from 0.1 (minimum) to 240 (maximum) ms. » 81 % of all devices are better. This means that the measured response time is worse than the average of all tested devices (21.5 ms). | ||
| ↔ Response Time 50% Grey to 80% Grey | ||
| 42.4 ms ... rise ↗ and fall ↘ combined | ↗ 20.4 ms rise | 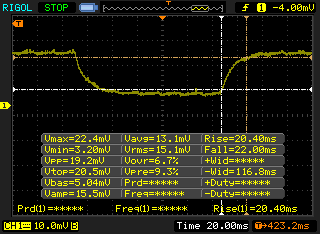 |
| ↘ 22 ms fall | ||
| The screen shows slow response rates in our tests and will be unsatisfactory for gamers. In comparison, all tested devices range from 0.2 (minimum) to 636 (maximum) ms. » 66 % of all devices are better. This means that the measured response time is worse than the average of all tested devices (33.8 ms). | ||
Screen Flickering / PWM (Pulse-Width Modulation)
| Screen flickering / PWM detected | 210.1 Hz | ≤ 99 % brightness setting | 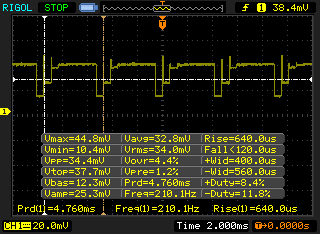 |
The display backlight flickers at 210.1 Hz (worst case, e.g., utilizing PWM) Flickering detected at a brightness setting of 99 % and below. There should be no flickering or PWM above this brightness setting. The frequency of 210.1 Hz is relatively low, so sensitive users will likely notice flickering and experience eyestrain at the stated brightness setting and below. In comparison: 53 % of all tested devices do not use PWM to dim the display. If PWM was detected, an average of 17933 (minimum: 5 - maximum: 3846000) Hz was measured. | |||
| Cinebench R10 | |
| Rendering Multiple CPUs 32Bit | |
| Dell Latitude 12 5285 2-in-1 | |
| Microsoft Surface Pro 4, Core i5, 128GB | |
| HP Elite x2 1012 G1 | |
| Asus Transformer 3 Pro T303UA-GN050T | |
| Rendering Single 32Bit | |
| Asus Transformer 3 Pro T303UA-GN050T | |
| Dell Latitude 12 5285 2-in-1 | |
| Microsoft Surface Pro 4, Core i5, 128GB | |
| HP Elite x2 1012 G1 | |
| wPrime 2.10 - 1024m | |
| Dell Latitude 12 5285 2-in-1 | |
* ... smaller is better
| PCMark 8 Home Score Accelerated v2 | 4741 points | |
| PCMark 8 Creative Score Accelerated v2 | 4602 points | |
| PCMark 8 Work Score Accelerated v2 | 3510 points | |
Help | ||
| Dell Latitude 12 5285 2-in-1 Samsung PM961 MZVLW256HEHP | Microsoft Surface Pro 4, Core i5, 128GB Samsung MZFLV128 NVMe | HP Elite x2 1012 G1 Liteon L8H-256V2G | Acer Aspire Switch Alpha 12 SA5-271-70EQ Lite-On CV1-8B512 M.2 512 GB | Asus Transformer 3 Pro T303UA-GN050T SK Hynix Canvas SC300 512GB M.2 (HFS512G39MND) | Microsoft Surface Pro 4 Core i7 Samsung MZFLV256 NVMe | |
|---|---|---|---|---|---|---|
| CrystalDiskMark 3.0 | -37% | -32% | -29% | -41% | -16% | |
| Read Seq | 1294 | 666 -49% | 501 -61% | 496.6 -62% | 398.9 -69% | 834 -36% |
| Write Seq | 865 | 154.2 -82% | 297.2 -66% | 415.3 -52% | 402 -54% | 304 -65% |
| Read 512 | 406 | 266.3 -34% | 351.7 -13% | 335.9 -17% | 303.1 -25% | 396.7 -2% |
| Write 512 | 589 | 154.2 -74% | 295.7 -50% | 384 -35% | 320.3 -46% | 304.3 -48% |
| Read 4k | 31.75 | 28.51 -10% | 28.31 -11% | 32.38 2% | 26.11 -18% | 40.75 28% |
| Write 4k | 72.2 | 101.5 41% | 90.3 25% | 81.8 13% | 57.7 -20% | 106.3 47% |
| Read 4k QD32 | 493.3 | 368.3 -25% | 285 -42% | 296.3 -40% | 245.8 -50% | 393.1 -20% |
| Write 4k QD32 | 434.5 | 153.6 -65% | 268.4 -38% | 260.3 -40% | 253.8 -42% | 292.3 -33% |

| 3DMark 11 Performance | 1744 points | |
| 3DMark Ice Storm Standard Score | 12587 points | |
| 3DMark Cloud Gate Standard Score | 6652 points | |
| 3DMark Fire Strike Score | 985 points | |
| 3DMark Fire Strike Extreme Score | 457 points | |
Help | ||
| low | med. | high | ultra | |
| Tomb Raider (2013) | 88.6 | 45.5 | 29.7 | 13.6 |
| BioShock Infinite (2013) | 56.5 | 32.8 | 28.6 | 9 |
Noise Level
| Idle |
| 28.2 / 28.2 / 28.2 dB(A) |
| Load |
| 30.4 / 34 dB(A) |
 | ||
30 dB silent 40 dB(A) audible 50 dB(A) loud |
||
min: | ||
| Dell Latitude 12 5285 2-in-1 HD Graphics 620, i7-7600U, Samsung PM961 MZVLW256HEHP | Microsoft Surface Pro 4, Core i5, 128GB HD Graphics 520, 6300U, Samsung MZFLV128 NVMe | Asus Transformer 3 Pro T303UA-GN050T HD Graphics 520, 6500U, SK Hynix Canvas SC300 512GB M.2 (HFS512G39MND) | Microsoft Surface Pro 4 Core i7 Iris Graphics 540, 6650U, Samsung MZFLV256 NVMe | |
|---|---|---|---|---|
| Noise | -18% | -11% | -12% | |
| off / environment * | 28.2 | 30.7 -9% | ||
| Idle Minimum * | 28.2 | 31.5 -12% | 30.7 -9% | 28.4 -1% |
| Idle Average * | 28.2 | 31.5 -12% | 30.7 -9% | 28.6 -1% |
| Idle Maximum * | 28.2 | 31.5 -12% | 30.7 -9% | 28.7 -2% |
| Load Average * | 30.4 | 40.5 -33% | 37 -22% | 40.8 -34% |
| Load Maximum * | 34 | 40.7 -20% | 37.1 -9% | 41.4 -22% |
* ... smaller is better
(+) The maximum temperature on the upper side is 38.2 °C / 101 F, compared to the average of 35.3 °C / 96 F, ranging from 19.6 to 55.7 °C for the class Convertible.
(-) The bottom heats up to a maximum of 48.6 °C / 119 F, compared to the average of 36.7 °C / 98 F
(+) In idle usage, the average temperature for the upper side is 28.4 °C / 83 F, compared to the device average of 30.2 °C / 86 F.
(+) The palmrests and touchpad are cooler than skin temperature with a maximum of 31.2 °C / 88.2 F and are therefore cool to the touch.
(-) The average temperature of the palmrest area of similar devices was 28.1 °C / 82.6 F (-3.1 °C / -5.6 F).
Dell Latitude 12 5285 2-in-1 audio analysis
(±) | speaker loudness is average but good (72.4 dB)
Bass 100 - 315 Hz
(-) | nearly no bass - on average 16.3% lower than median
(±) | linearity of bass is average (11% delta to prev. frequency)
Mids 400 - 2000 Hz
(+) | balanced mids - only 4.3% away from median
(±) | linearity of mids is average (11.3% delta to prev. frequency)
Highs 2 - 16 kHz
(+) | balanced highs - only 2.6% away from median
(±) | linearity of highs is average (8.2% delta to prev. frequency)
Overall 100 - 16.000 Hz
(±) | linearity of overall sound is average (23.5% difference to median)
Compared to same class
» 67% of all tested devices in this class were better, 5% similar, 28% worse
» The best had a delta of 6%, average was 21%, worst was 57%
Compared to all devices tested
» 66% of all tested devices were better, 7% similar, 28% worse
» The best had a delta of 4%, average was 25%, worst was 134%
Apple MacBook 12 (Early 2016) 1.1 GHz audio analysis
(+) | speakers can play relatively loud (83.6 dB)
Bass 100 - 315 Hz
(±) | reduced bass - on average 11.3% lower than median
(±) | linearity of bass is average (14.2% delta to prev. frequency)
Mids 400 - 2000 Hz
(+) | balanced mids - only 2.4% away from median
(+) | mids are linear (5.5% delta to prev. frequency)
Highs 2 - 16 kHz
(+) | balanced highs - only 2% away from median
(+) | highs are linear (4.5% delta to prev. frequency)
Overall 100 - 16.000 Hz
(+) | overall sound is linear (10.2% difference to median)
Compared to same class
» 5% of all tested devices in this class were better, 2% similar, 93% worse
» The best had a delta of 5%, average was 19%, worst was 53%
Compared to all devices tested
» 3% of all tested devices were better, 1% similar, 96% worse
» The best had a delta of 4%, average was 25%, worst was 134%
| Off / Standby | |
| Idle | |
| Load |
|
| Dell Latitude 12 5285 2-in-1 i7-7600U, HD Graphics 620, Samsung PM961 MZVLW256HEHP, IPS, 1920x1280, 12.30 | Microsoft Surface Pro 4, Core i5, 128GB 6300U, HD Graphics 520, Samsung MZFLV128 NVMe, IPS, 2736x1824, 12.30 | HP Elite x2 1012 G1 6Y54, HD Graphics 515, Liteon L8H-256V2G, IPS, 1920x1280, 12.10 | Acer Aspire Switch Alpha 12 SA5-271-70EQ 6500U, HD Graphics 520, Lite-On CV1-8B512 M.2 512 GB, IPS, 2160x1440, 12.00 | Asus Transformer 3 Pro T303UA-GN050T 6500U, HD Graphics 520, SK Hynix Canvas SC300 512GB M.2 (HFS512G39MND), IPS, 2880x1920, 12.60 | Microsoft Surface Pro 4 Core i7 6650U, Iris Graphics 540, Samsung MZFLV256 NVMe, IPS, 2736x1824, 12.30 | |
|---|---|---|---|---|---|---|
| Power Consumption | -11% | -0% | -44% | -48% | ||
| Idle Minimum * | 2.85 | 4.4 -54% | 3.7 -30% | 5.5 -93% | 6.7 -135% | |
| Idle Average * | 6.76 | 9 -33% | 6.8 -1% | 9.8 -45% | 10.3 -52% | |
| Idle Maximum * | 6.91 | 10.7 -55% | 7.6 -10% | 11.9 -72% | 13.5 -95% | |
| Load Average * | 32.88 | 19.6 40% | 22.5 32% | 36.1 -10% | 26 21% | |
| Load Maximum * | 37.41 | 19.9 47% | 34.5 8% | 36.7 2% | 28.8 23% |
* ... smaller is better
| Dell Latitude 12 5285 2-in-1 i7-7600U, HD Graphics 620, 42 Wh | Microsoft Surface Pro 4, Core i5, 128GB 6300U, HD Graphics 520, 38 Wh | HP Elite x2 1012 G1 6Y54, HD Graphics 515, 37 Wh | Acer Aspire Switch Alpha 12 SA5-271-70EQ 6500U, HD Graphics 520, 37 Wh | Asus Transformer 3 Pro T303UA-GN050T 6500U, HD Graphics 520, 39 Wh | Microsoft Surface Pro 4 Core i7 6650U, Iris Graphics 540, 38 Wh | |
|---|---|---|---|---|---|---|
| Battery Runtime | -7% | -6% | -23% | -39% | -35% | |
| Reader / Idle | 1075 | 899 -16% | 732 -32% | 644 -40% | 426 -60% | 654 -39% |
| WiFi v1.3 | 486 | 427 -12% | 443 -9% | 291 -40% | 223 -54% | 293 -40% |
| Load | 105 | 111 6% | 130 24% | 115 10% | 102 -3% | 79 -25% |
Pros
Cons
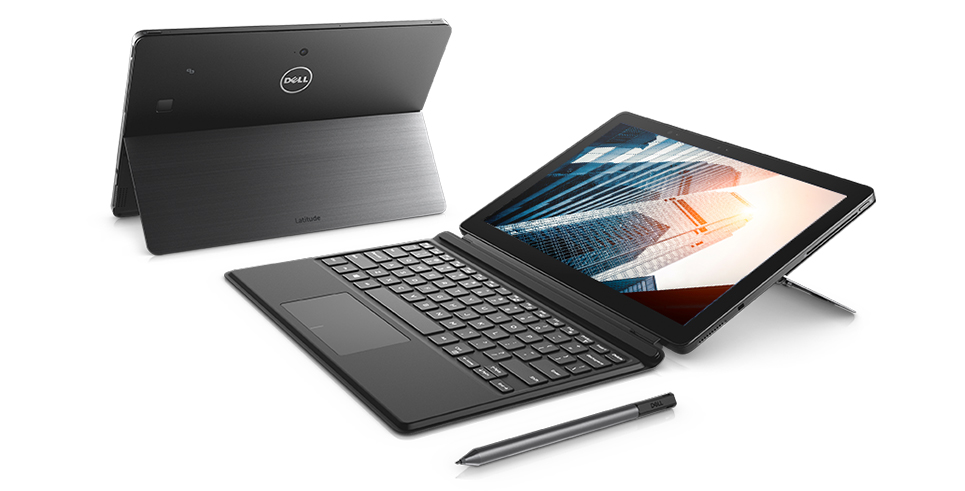
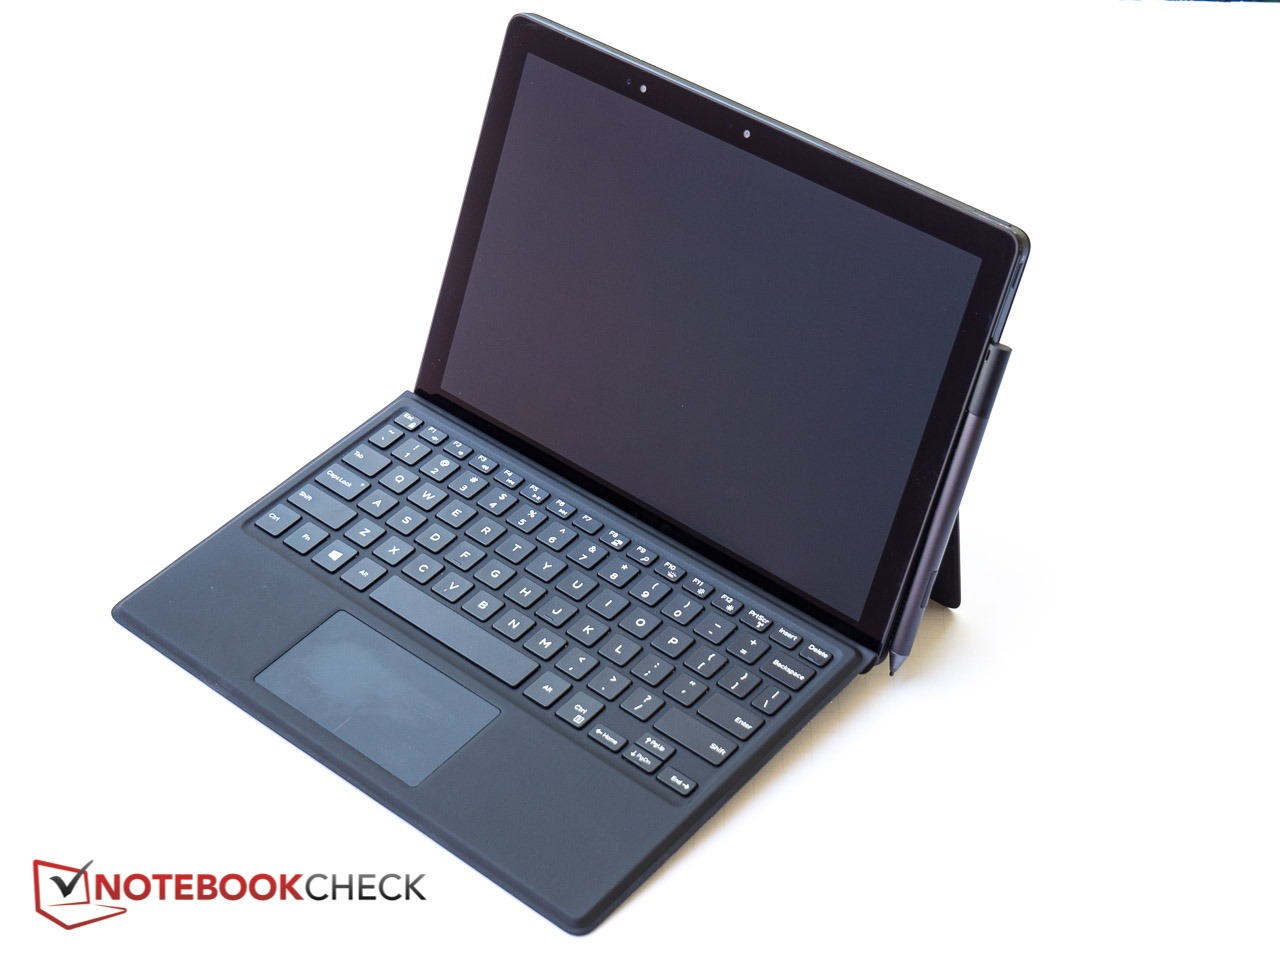
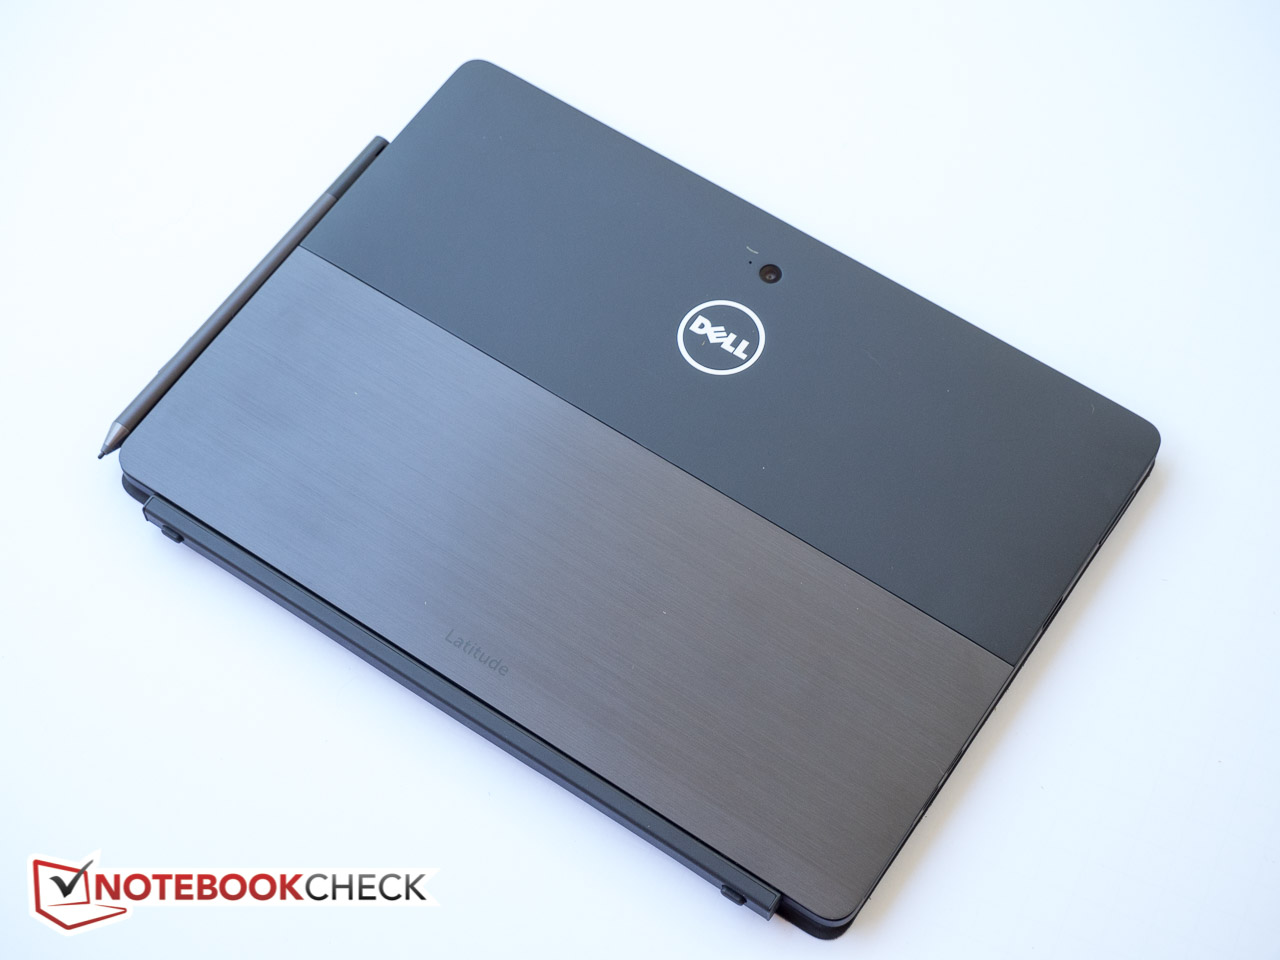
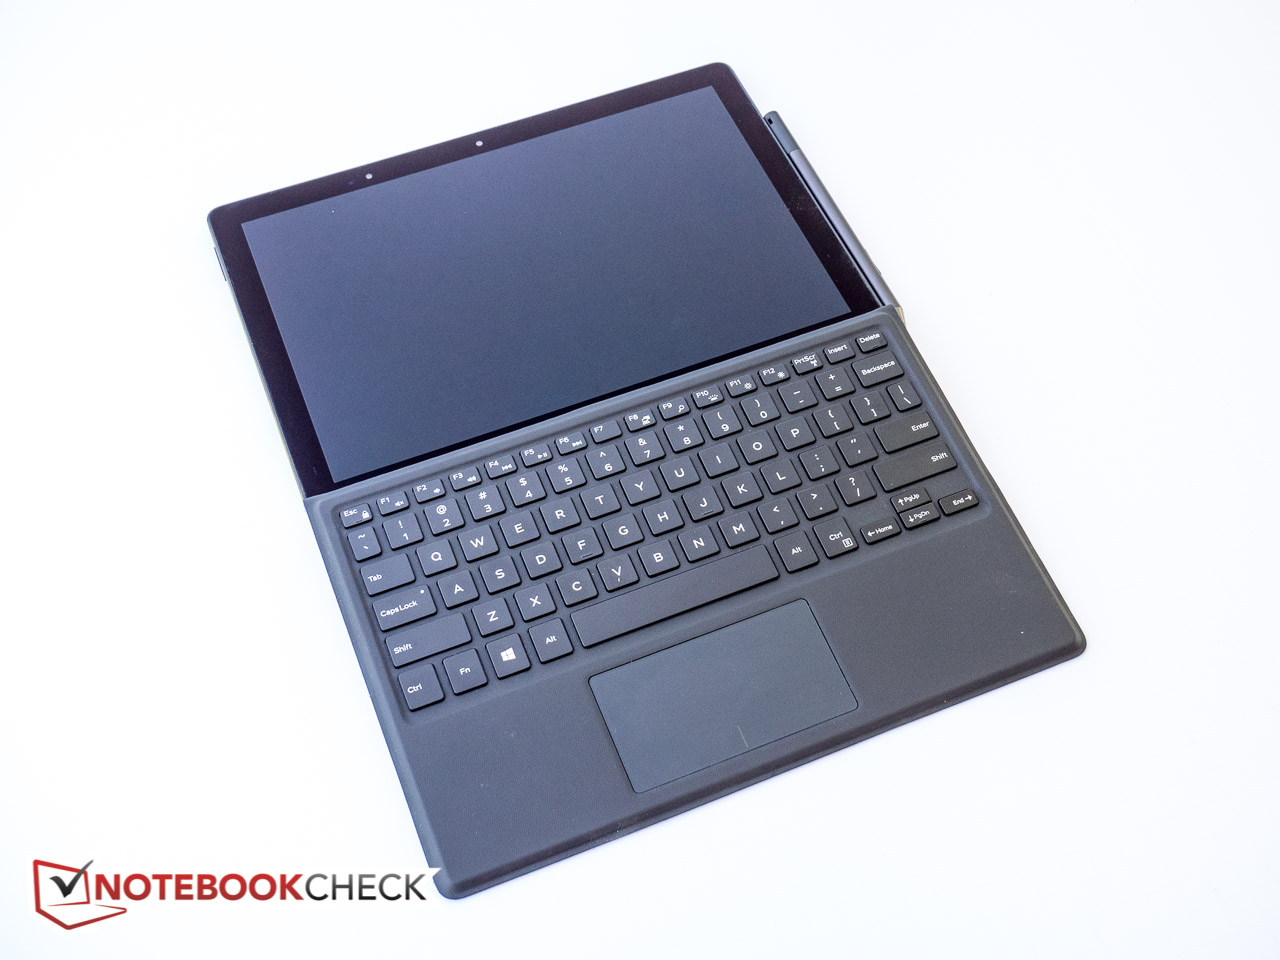
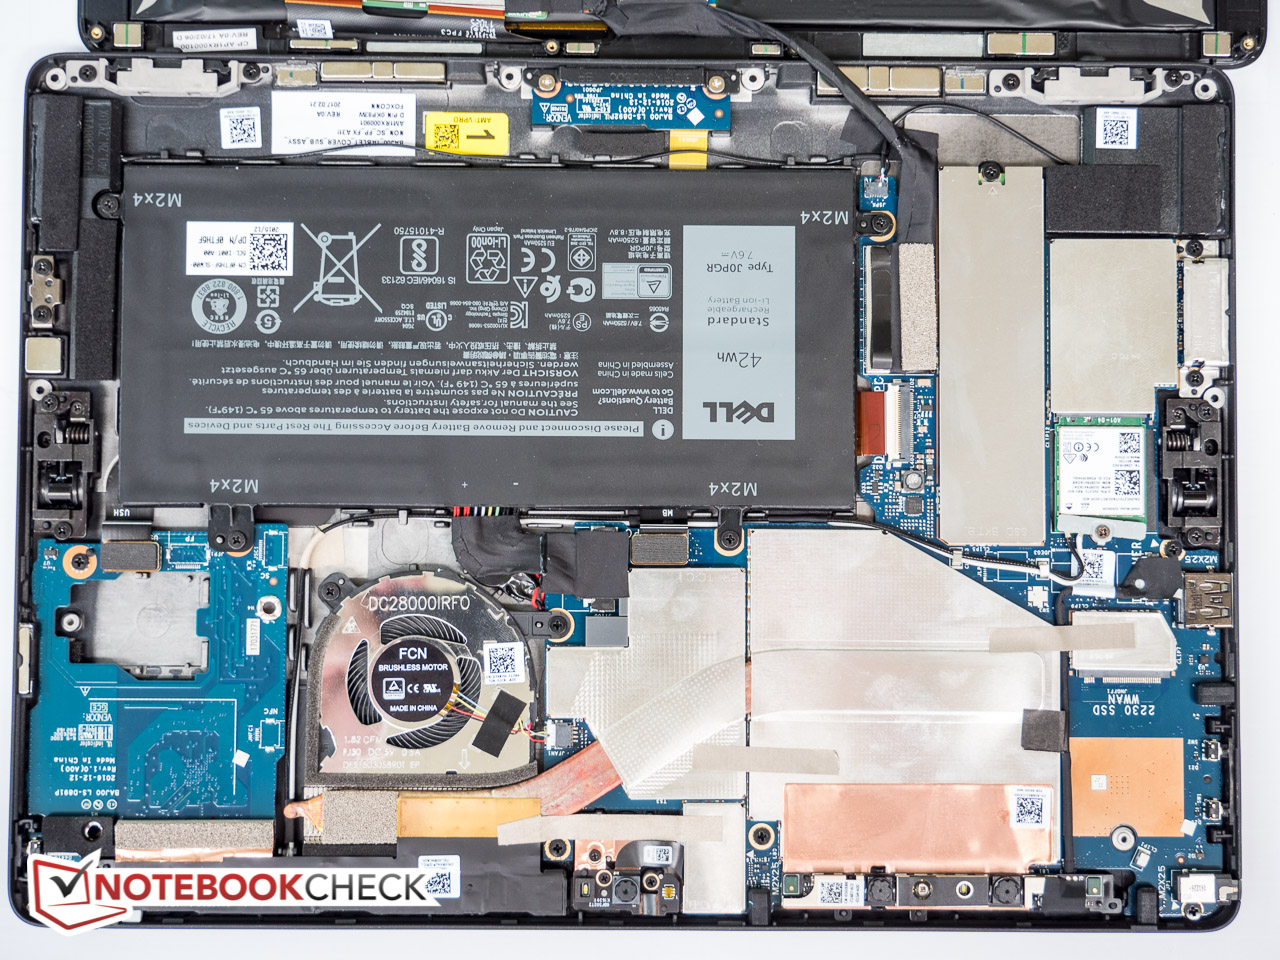
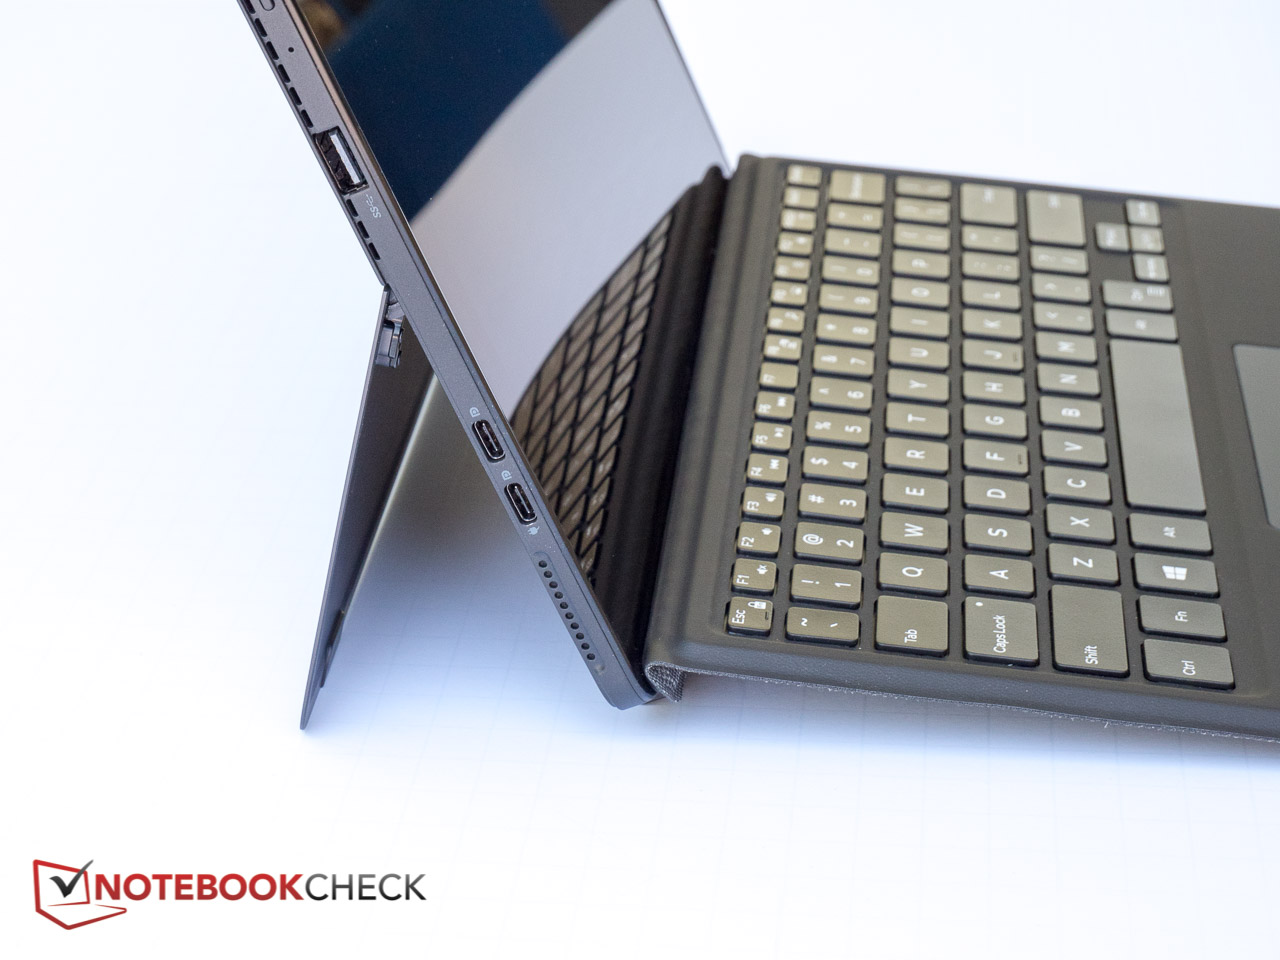
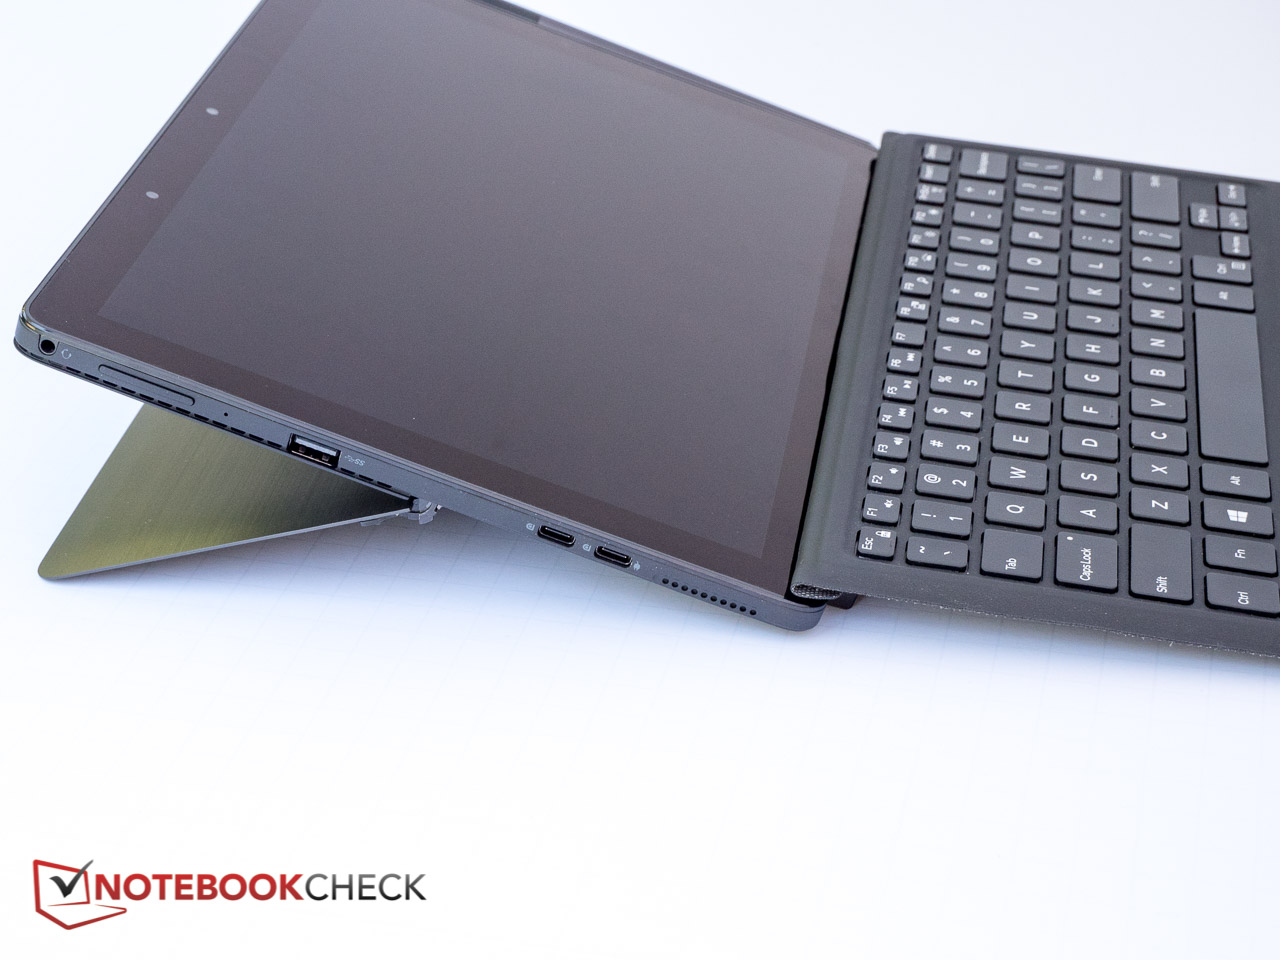
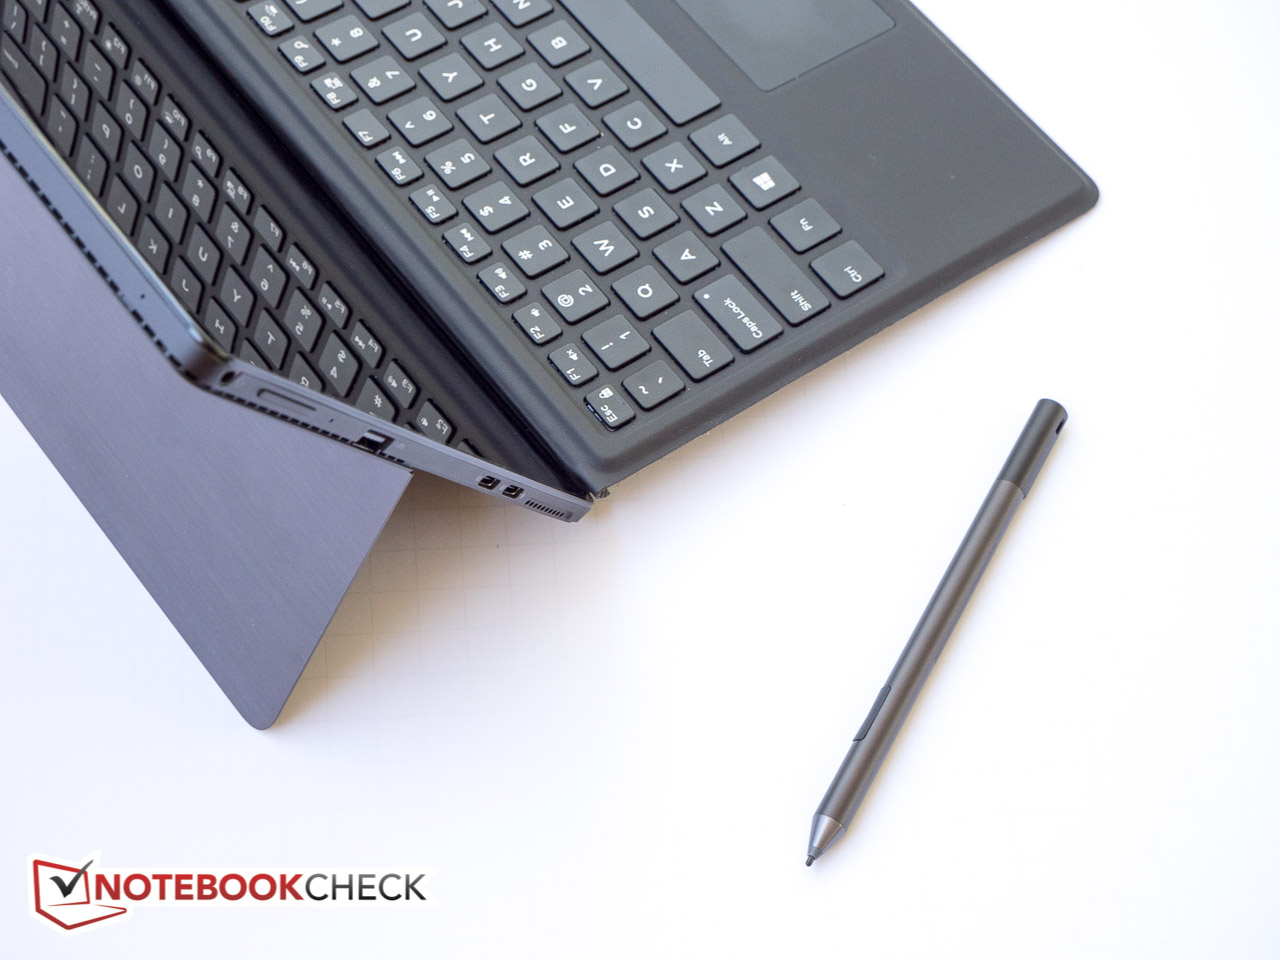
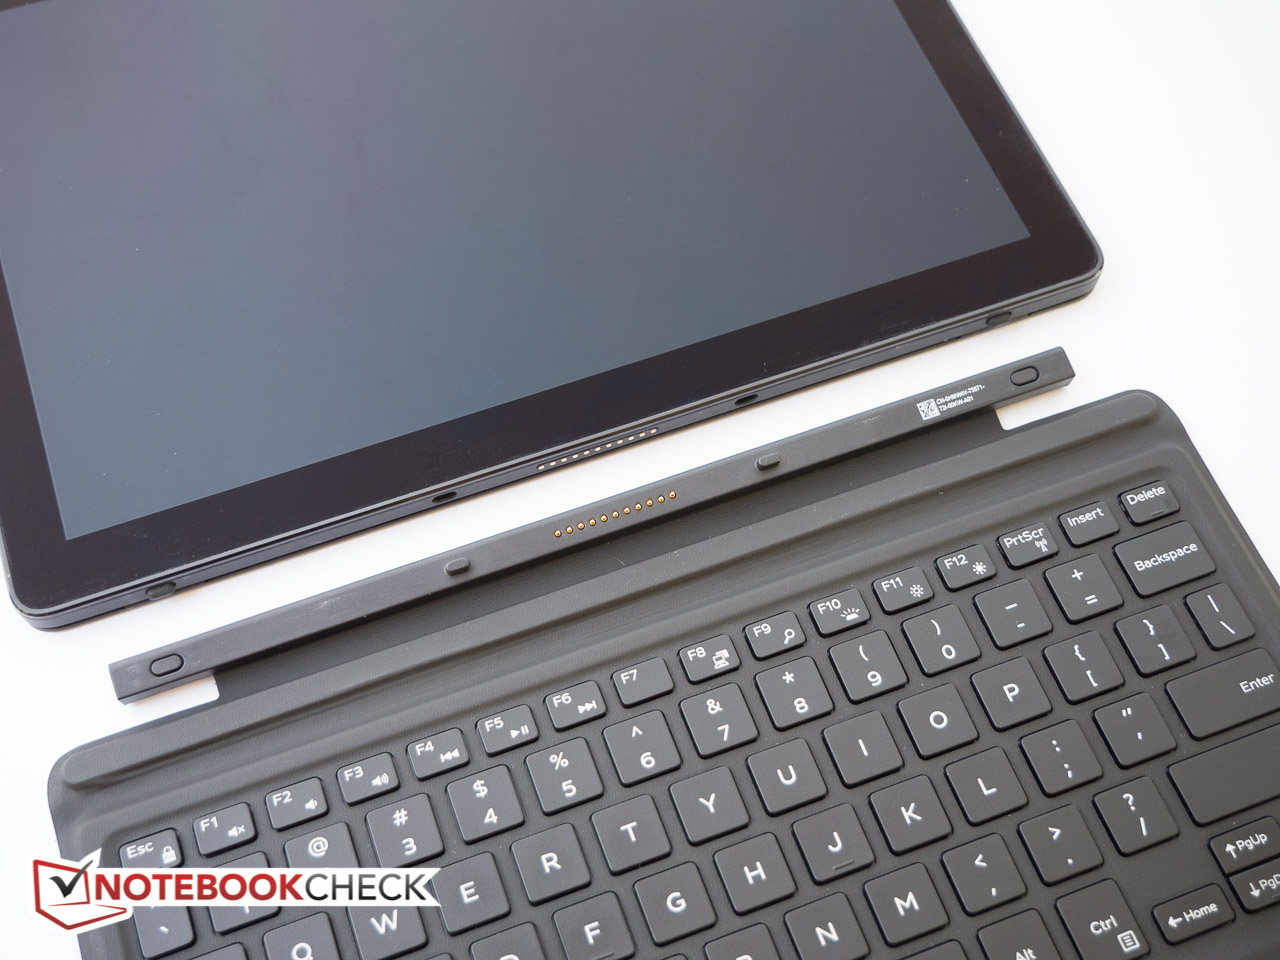
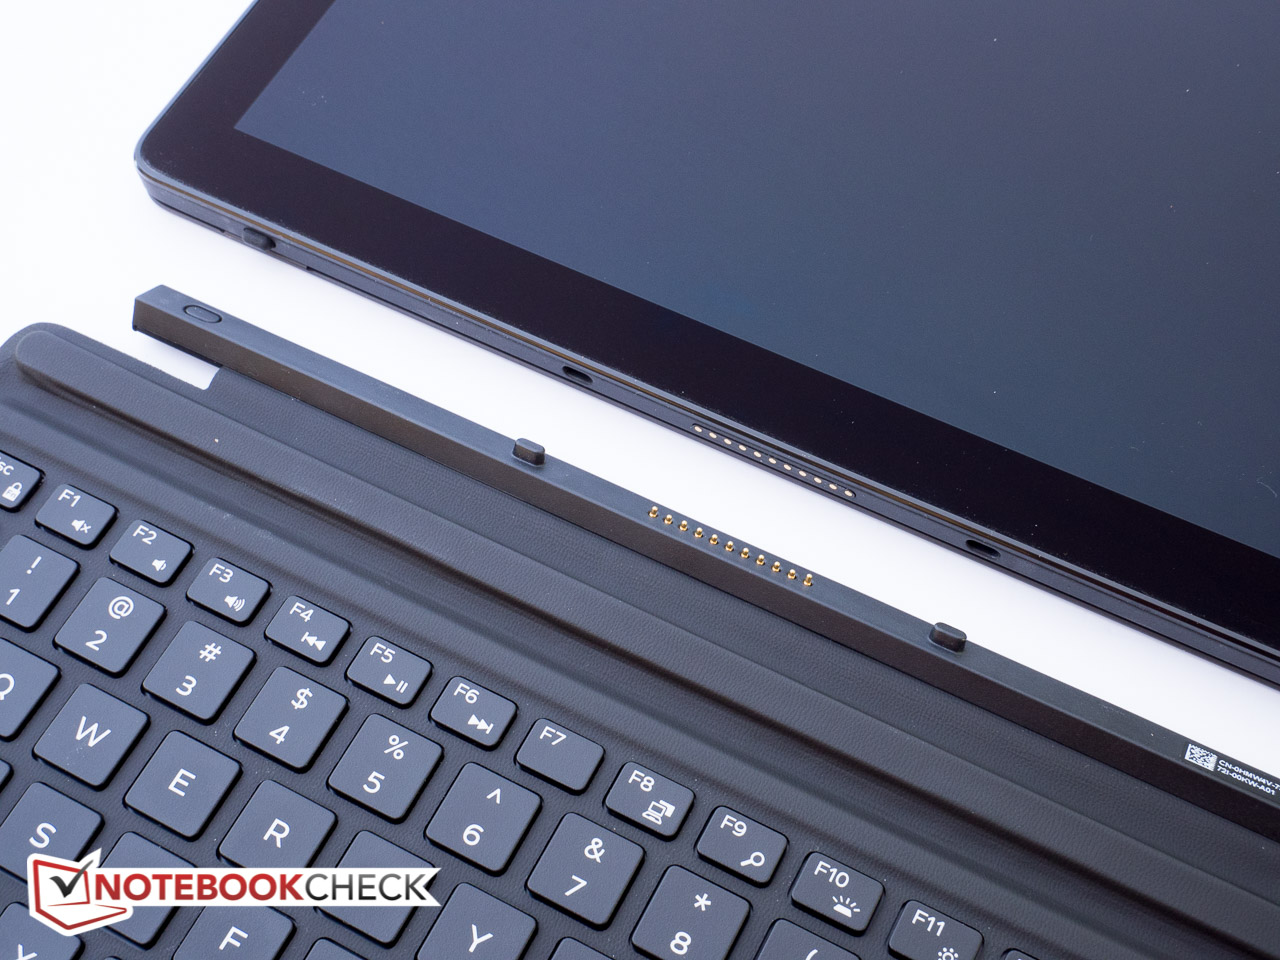
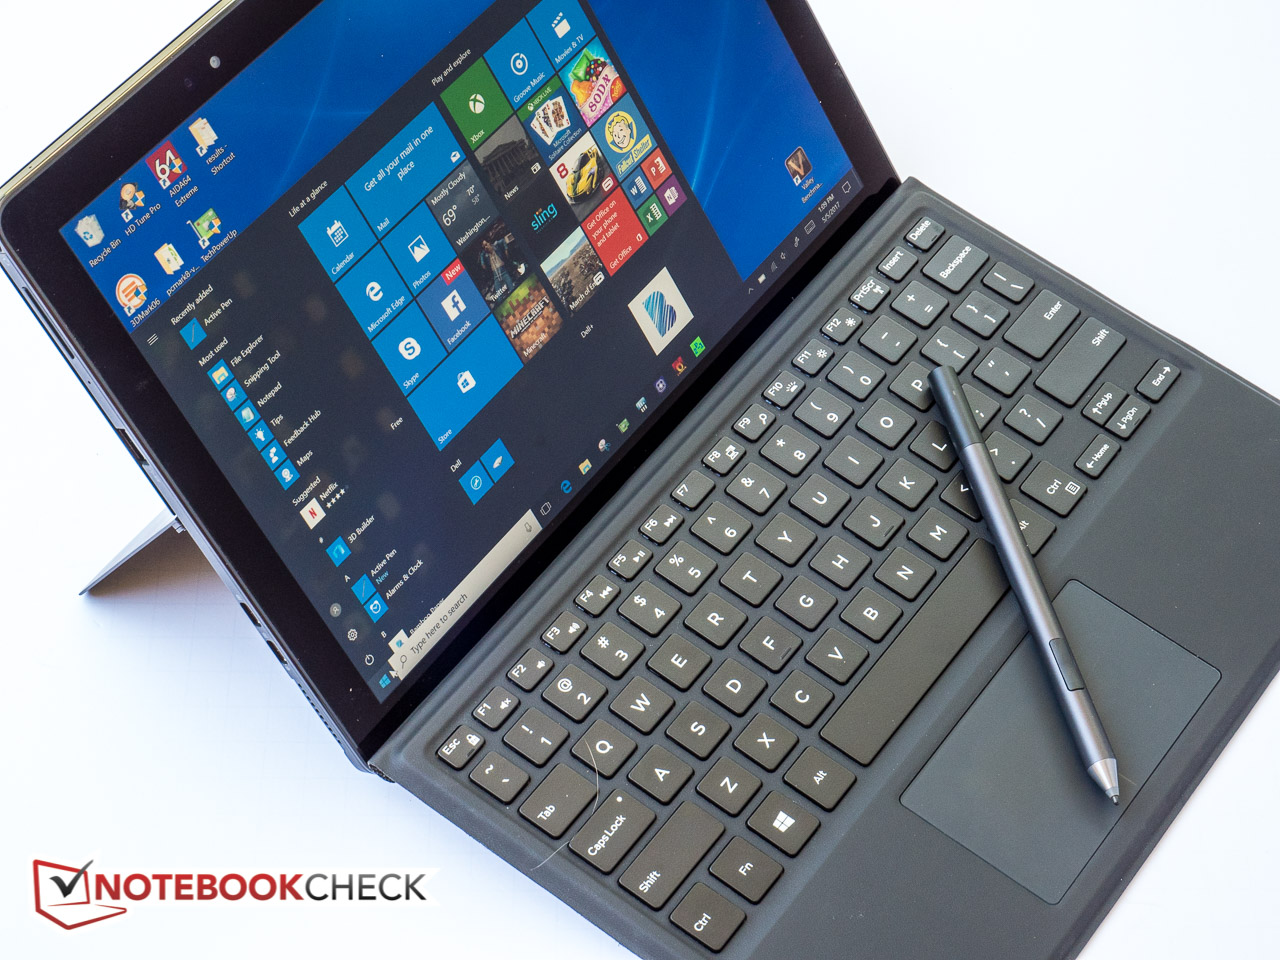
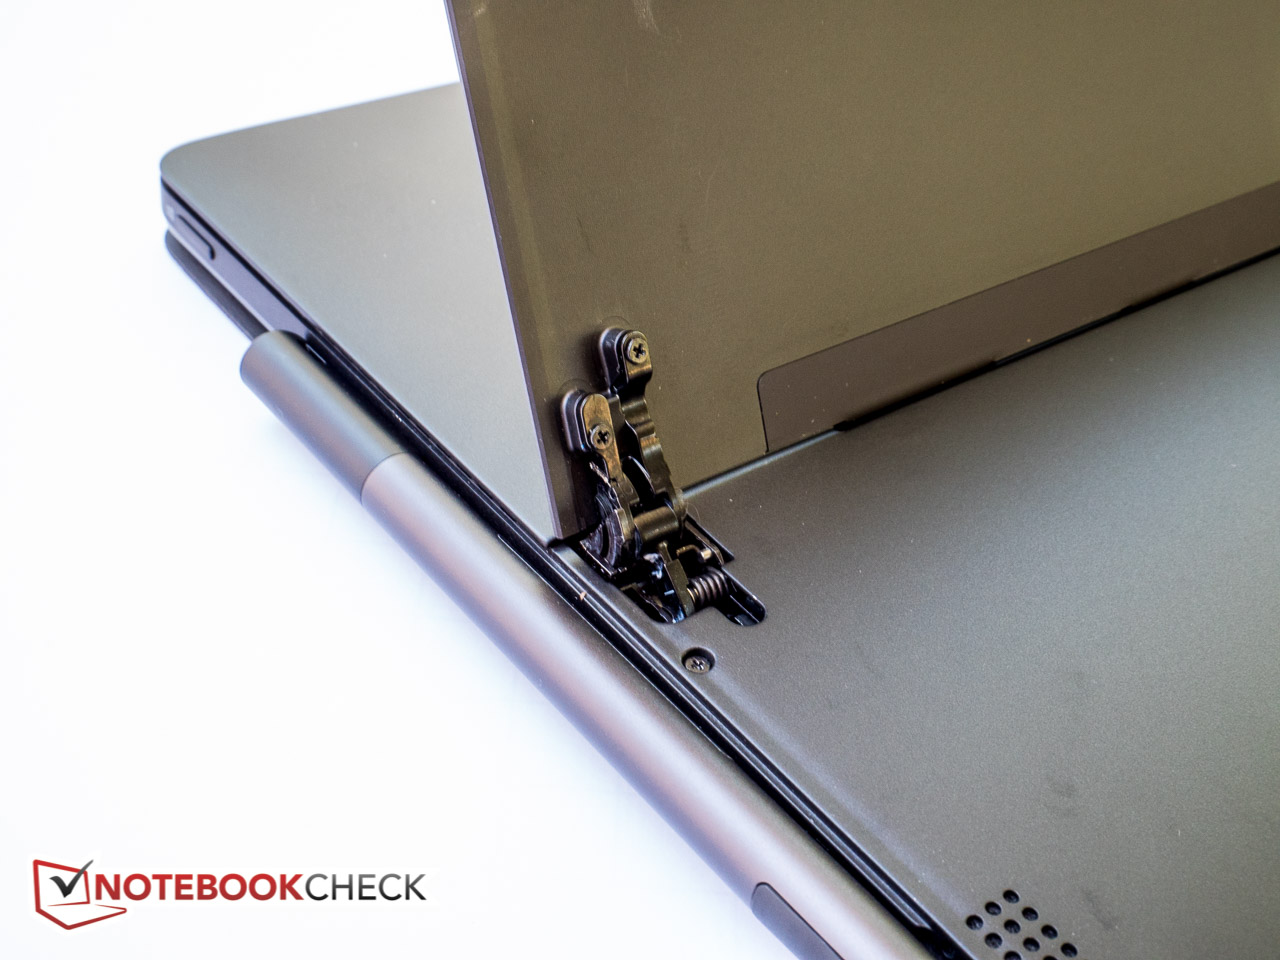
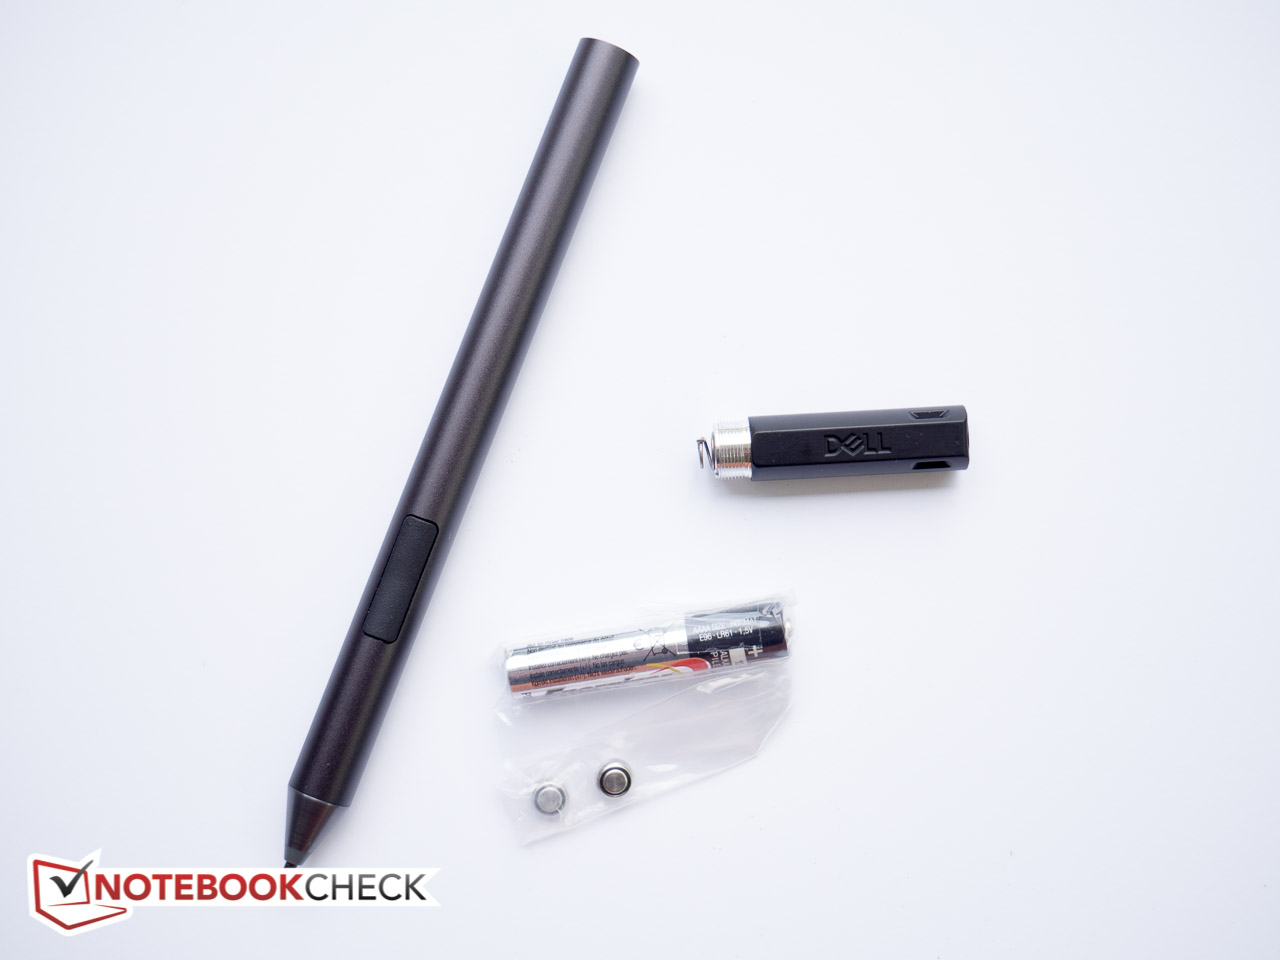
戴尔Latitude 12 5285是一个坚固的商务变形本。2合1,且符合人体工程学,运行速度优秀和续航优秀,外观很有吸引力。是的,它看起来很像微软的Surface Pro 4,但是我们老实说,不要指望戴尔采用新外观,而能做到标新立异。可拆卸键盘提供坚实的按键反馈,并提供两种背光强度。触控笔作为额外的输入设备工具,非常好用,并提供了附加的功能,可以启动Microsoft OneNote或其他应用程序。戴尔与竞争对手的不同之处在于两个关键点:首先,虽然显示分辨率较低,但鉴于Latitude的业务导向,我们不认为这是重大缺陷——另外,面板非常明亮,远超竞争对手。另外,2合1笔记本硬件非常易于使用和维护,这同样也是基于平板电脑的变形本的致命弱点。
Latitude的突出特色毫无疑问是其显示效果,它非常亮,平均亮度超过520尼特。
主要让人不喜欢的点是:5285在负载下会非常热,也比竞争对手稍重。增加一个雷电3端口可能会是一个不错的选择。 Latitude非常昂贵的,对于一些用户来说,其他变形本,比如,华硕Transformer 3 Pro或液冷式宏碁 Aspire Switch Alpha 12更具吸引力,即使是它们的续航能力较差。同样,微软的Surface Pro 4也是一个不错的选择——特别是Core i5和256 GB 固态硬盘版本,此时售价只超过1300美元。
注:本文是基于完整评测的缩减版本,阅读完整的英文评测,请点击这里。
Dell Latitude 12 5285 2-in-1
-
05/06/2017 v6(old)
Bernhard Pechlaner
Pricecompare
