Intel Iris Graphics 6100
英特尔Iris Graphics 6100 (GT3) 是一款集成的Braodwell架构显卡,在2015年第一季度发布。它主要使用于几颗低电压处理器中(28瓦TDP)如酷睿i5-5257U或i7-5557U。酷睿i5和酷睿i7芯片拥有48个执行单元(EU),而酷睿i3版本仅提供47个。根据处理器型号的不同,它的最高核心频率在1000和1100MHz之间。
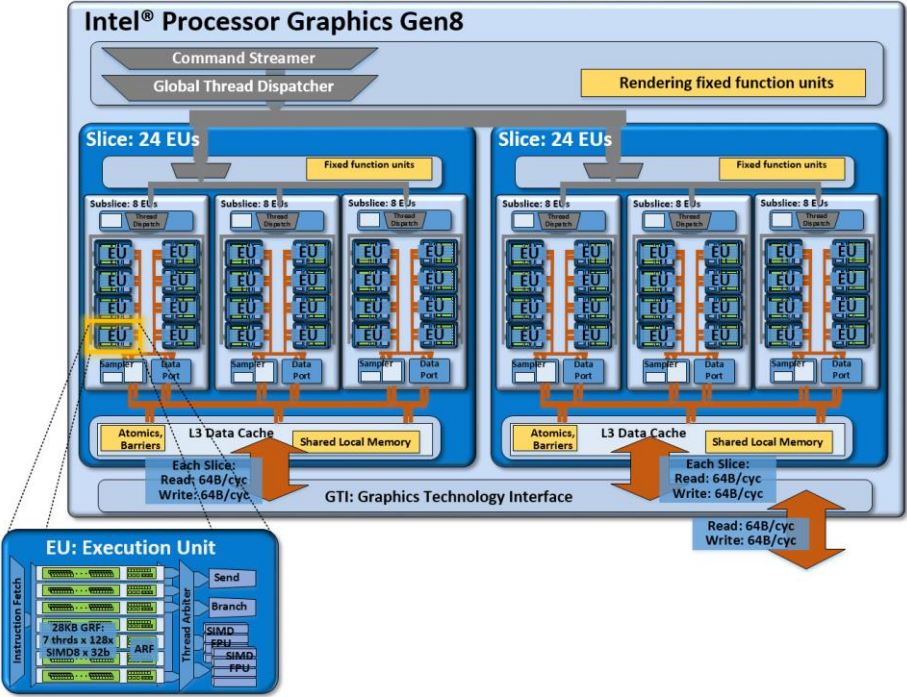
Broadwell处理器集成显卡采用了基于英特尔第八代(Gen8)架构,在各方面相比之前的Gen7.5(Haswell)有了优化。除此之外,称作“子片”(subslice)的着色器阵列获得了重新设计,现在各提供了8个执行单元(EU)。三个子片组成一个“片”(slice),共计24个执行单元。加上其他改进如更大L1缓存和优化的前端等,这块集成相比前代产品速度更快、更加高效。
Iris Graphics 6100是Broadwell系列显卡的顶级版本,包括两组共48个执行单元。除此之外,它也有一个低端(GT1,12个EU),一个中端(GT2,24个EU)和一个高端版本(GT3e,48个EU+eDRAM)。
所有Broadwell显卡都支持OpenCL 2.0和DirectX 11.2。它的视频引擎现在可以同时使用固有硬件以及可用的处理器着色器协同解码H.265视频。最多三个显示器可以通过DP 1.2 / eDP 1.3(最大3840×2160 @ 60Hz)或HDMI 1.4a(最大3840×2160 @ 24Hz)连接。但是它并不支持HDMI 2.0。
根据处理器型号的不同,它的最高核心频率在1000和1100MHz之间。尽管Iris Graphics 6100在技术上与HD Graphics 6000相同,但较高的TDP(28瓦相对于15瓦)使它可以更好地利用Turbo Boost技术进行加速,提供更高的性能。总体而言,Iris 6100应比GeForce 820M独立显卡稍快。
不过,2014/2015年的游戏通常只可在低设置下流畅运行。
采用了新的14纳米工艺,Broadwell低电压芯片的TDP为28瓦,因此适用于中等尺寸的超极本。它的TDP可以定制,能够进一步降低(到23瓦),这会对性能有显著影响。
Iris Series Iris Pro Graphics 6200 48 @ 0.3 - 1.15 GHz eDRAM + 64/128 Bit Iris Pro Graphics 5200 40 @ 0.2 - 1.3 GHz eDRAM + 64/128 Bit Iris Graphics 6100 48 @ 0.3 - 1.1 GHz 64/128 Bit Iris Graphics 5100 40 @ 0.2 - 1.2 GHz 64/128 Bit
Codename Broadwell GT3 Architecture Gen. 8 Broadwell Pipelines 48 - unified Core Speed 300 - 1100 (Boost) MHz Memory Bus Width 64/128 Bit Shared Memory yes API DirectX 12 (FL 11_1), OpenGL 4.3 Power Consumption 28 Watt Transistor Count 1.9 Billion technology 14 nm Features QuickSync Date of Announcement 05.01.2015
Benchmarks Performance Rating - 3DMark 11 + Fire Strike + Time Spy
0.4 pt (1%)
...
Intel UHD Graphics 615
NVIDIA GeForce GT 720M
AMD Radeon HD 8650G + HD 8670M Dual Graphics
AMD FirePro M4100
AMD Radeon HD 8650G + HD 8570M Dual Graphics
Intel Iris Graphics 5100
AMD Radeon HD 8650G
AMD Radeon R6 (Carrizo)
AMD Radeon HD 8550G + HD 8670M Dual Graphics
AMD Radeon R5 M335
AMD Radeon R5 M330
...
max:
3DMark - 3DMark Time Spy Score
425 Points (1%)
...
Intel UHD Graphics 24EUs (Alder Lake-N)
Intel UHD Graphics Xe 16EUs (Tiger Lake-H)
AMD Radeon R7 M360
Intel UHD Graphics G1 (Ice Lake 32 EU)
Intel Iris Plus Graphics 640
...
max:
3DMark - 3DMark Time Spy Graphics
377 Points (1%)
...
NVIDIA GeForce 920M
Intel UHD Graphics 24EUs (Alder Lake-N)
Intel UHD Graphics Xe 16EUs (Tiger Lake-H)
Intel HD Graphics 630
AMD Radeon R7 M360
Intel UHD Graphics G1 (Ice Lake 32 EU)
Intel Iris Plus Graphics 640
...
max:
3DMark - 3DMark Ice Storm Unlimited Graphics
89341 Points (10%)
...
Intel HD Graphics 530
NVIDIA GeForce GT 640M
AMD Radeon R7 M360
Intel Iris Plus Graphics G4 (Ice Lake 48 EU)
AMD Radeon R7 M275DX
NVIDIA GeForce 920M
AMD Radeon RX Vega 6 (Ryzen 2000/3000)
Intel HD Graphics 630
AMD Radeon RX 460 (Laptop)
Intel UHD Graphics G1 (Ice Lake 32 EU)
Intel UHD Graphics Xe G4 48EUs
AMD Radeon R7 M260X
...
max:
3DMark - 3DMark Ice Storm Extreme Graphics
min: 43469 avg: 46800 median: 46800 (6%) max: 50131 Points
Intel HD Graphics (Bay Trail)
...
AMD Radeon R7 M340
AMD Radeon HD 8650G
AMD Radeon RX 550X (Laptop)
AMD Radeon Pro WX 3100
Intel UHD Graphics Xe G4 48EUs
NVIDIA Quadro RTX 5000 Max-Q
AMD Radeon R8 M365DX
Intel Iris Plus Graphics G4 (Ice Lake 48 EU)
Intel Iris Plus Graphics G7 (Ice Lake 64 EU)
...
max:
3DMark - 3DMark Cloud Gate Score
min: 5746 avg: 6119 median: 6141 (7%) max: 6637 Points
Intel Graphics Media Accelerator (GMA) 4500MHD
...
AMD Radeon R9 M375
AMD Radeon R7 M275DX
NVIDIA Quadro K610M
AMD Radeon HD 8850M
NVIDIA GeForce 940M
NVIDIA Quadro K620M
AMD Radeon R7 M260X
...
max:
3DMark - 3DMark Cloud Gate Graphics
min: 7175 avg: 7743 median: 7798 (2%) max: 8199 Points
Intel Graphics Media Accelerator (GMA) 4500MHD
...
AMD Radeon R6 M255DX
Intel UHD Graphics 617
NVIDIA GeForce 920M
NVIDIA GeForce GT 740M
AMD Radeon HD 8650M
Intel HD Graphics 5600
Intel HD Graphics 530
AMD Radeon R5 (Bristol Ridge)
...
max:
3DMark - 3DMark Fire Strike Standard Score
min: 811 avg: 880 median: 864.5 (2%) max: 981 Points
...
AMD Radeon HD 8650G
AMD FirePro M4100
AMD Radeon R5 M335
AMD Radeon R5 M330
AMD Radeon R6 (Carrizo)
AMD Radeon R5 M240
Intel HD Graphics 530
AMD Radeon R6 M255DX
Intel UHD Graphics 617
Intel HD Graphics 630
AMD Radeon R5 (Carrizo)
NVIDIA GeForce 910M
AMD Radeon HD 8650M
...
max:
3DMark - 3DMark Fire Strike Standard Graphics
min: 857 avg: 917 median: 874 (1%) max: 1020 Points
...
AMD Radeon HD 8650G + HD 8570M Dual Graphics
AMD Radeon HD 8650G
AMD Radeon HD 8550G + HD 8670M Dual Graphics
AMD Radeon R5 M335
AMD Radeon R5 M330
AMD Radeon R6 (Carrizo)
AMD Radeon R5 M315
Intel HD Graphics 530
AMD Radeon R5 M240
Intel HD Graphics 630
Intel HD Graphics 5600
Intel UHD Graphics 617
AMD Radeon R5 (Carrizo)
...
max:
3DMark - 3DMark Ice Storm Graphics
min: 60636 avg: 64246 median: 61997 (7%) max: 70106 Points
Intel Graphics Media Accelerator (GMA) 4500MHD
...
NVIDIA Quadro K1100M
AMD Radeon HD 8650G + HD 8570M Dual Graphics
AMD Radeon HD 8550G + HD 8750M Dual Graphics
NVIDIA GeForce GT 740M
AMD Radeon HD 8550G
NVIDIA GeForce RTX 2070 Super Max-Q
...
max:
3DMark 11 - 3DM11 Performance Score
min: 1581 avg: 1763 median: 1768 (2%) max: 1884 Points
...
Intel HD Graphics 5600
AMD Radeon R5 M320
AMD Radeon R5 M240
Intel UHD Graphics 617
AMD Radeon R5 (Carrizo)
NVIDIA GeForce GT 735M
Intel UHD Graphics 24EUs (Alder Lake-N)
AMD Radeon R5 M330
NVIDIA GeForce 920M
AMD Radeon R5 (Bristol Ridge)
...
max:
3DMark 11 - 3DM11 Performance GPU
min: 1471 avg: 1656 median: 1694.5 (1%) max: 1765 Points
...
AMD Radeon R5 M240
AMD Radeon HD 8450G + Radeon HD 8570M Dual Graphics
AMD Radeon HD 6620G + HD 7670M Dual Graphics
Intel UHD Graphics Xe 16EUs (Tiger Lake-H)
AMD Radeon R5 M320
AMD Radeon R5 M330
Intel HD Graphics 630
NVIDIA GeForce GT 735M
AMD Radeon R5 (Bristol Ridge)
NVIDIA GeForce GT 640M
NVIDIA GeForce 920M
...
max:
3DMark Vantage + 3DMark Vantage - 3DM Vant. Perf. total
6531 Points (2%)
...
NVIDIA GeForce 8800M GTX SLI
NVIDIA GeForce GTX 280M
Intel HD Graphics 530
NVIDIA GeForce GT 740M
NVIDIA GeForce GTX 285M
ATI Mobility Radeon HD 4870
AMD Radeon R7 M270
Intel UHD Graphics Xe 16EUs (Tiger Lake-H)
AMD Radeon R7 M445
ATI Mobility Radeon HD 3870 X2
...
max:
NVIDIA T600
3DM Vant. Perf. GPU no PhysX + 3DMark Vantage - 3DM Vant. Perf. GPU no PhysX
5717 Points (3%)
...
AMD Radeon HD 8650G + HD 8570M Dual Graphics
AMD Radeon HD 8550G + HD 8670M Dual Graphics
NVIDIA GeForce GTX 285M
NVIDIA GeForce GT 740M
AMD Radeon HD 8550G + HD 8750M Dual Graphics
...
max:
3DMark 06 3DMark 06 - Standard 1280x1024 +
min: 7929 avg: 8675 median: 8764 (12%) max: 9332 Points
...
NVIDIA GeForce 9800M GS
NVIDIA GeForce GT 735M
AMD Radeon HD 8550G + HD 8750M Dual Graphics
ATI Mobility Radeon HD 3870
Intel UHD Graphics 617
AMD Radeon R8 M365DX
...
max:
Unigine Heaven 3.0 - Unigine Heaven 3.0 OpenGL
14.6 fps (6%)
...
Intel HD Graphics 5000
AMD Radeon R7 M360
NVIDIA GeForce 910M
Intel Iris Graphics 5100
NVIDIA GeForce GT 740M
NVIDIA Quadro K1100M
AMD FirePro W4170M
NVIDIA Quadro K620M
AMD Radeon RX Vega 8 (Ryzen 2000/3000)
...
SPECviewperf 12 + SPECviewperf 12 - specvp12 sw-03
20.2 fps (5%)
...
NVIDIA GeForce 940M
Intel Iris Pro Graphics 5200
AMD Radeon HD 8550G
Intel HD Graphics 515
NVIDIA GeForce GTX 950M
Intel UHD Graphics 24EUs (Alder Lake-N)
Intel HD Graphics 520
Intel Iris Xe MAX Graphics
AMD Radeon RX Vega 10
AMD FirePro M4100
...
max:
specvp12 snx-02 + SPECviewperf 12 - specvp12 snx-02
2.7 fps (0%)
Intel Iris Xe MAX Graphics
...
Intel UHD Graphics 24EUs (Alder Lake-N)
Intel HD Graphics 515
Intel Iris Graphics 540
Intel Iris Pro Graphics 5200
Intel HD Graphics 520
Intel UHD Graphics Xe 32EUs (Tiger Lake-H)
...
max:
specvp12 showcase-01 + SPECviewperf 12 - specvp12 showcase-01
5.8 fps (1%)
Intel HD Graphics 4400
AMD Radeon R7 M260X
Intel HD Graphics 515
Intel UHD Graphics 24EUs (Alder Lake-N)
Intel HD Graphics 520
NVIDIA GeForce 940M
AMD Radeon Pro WX 3100
...
max:
specvp12 mediacal-01 + SPECviewperf 12 - specvp12 mediacal-01
1.6 fps (0%)
...
AMD FirePro M4100
Intel HD Graphics 4400
Intel HD Graphics 520
Intel HD Graphics 515
AMD Radeon HD 8550G
Intel Iris Pro Graphics 5200
Intel UHD Graphics 24EUs (Alder Lake-N)
Intel UHD Graphics Xe 16EUs (Tiger Lake-H)
...
max:
specvp12 maya-04 + SPECviewperf 12 - specvp12 maya-04
4.1 fps (1%)
Intel HD Graphics 4400
AMD FirePro M4100
AMD Radeon RX Vega 10
AMD Radeon R7 M260X
AMD Radeon HD 8550G
...
max:
specvp12 energy-01 + SPECviewperf 12 - specvp12 energy-01
0.1 fps (0%)
...
Intel HD Graphics 515
Intel HD Graphics 520
AMD FirePro M4100
AMD Radeon R7 M260X
NVIDIA GeForce 940M
Intel Iris Pro Graphics 5200
Intel HD Graphics 4400
Intel UHD Graphics Xe 16EUs (Tiger Lake-H)
Intel UHD Graphics 24EUs (Alder Lake-N)
AMD Radeon Pro 455
AMD Radeon HD 8550G
Intel Iris Graphics 540
...
AMD Radeon 660M
max:
specvp12 creo-01 + SPECviewperf 12 - specvp12 creo-01
12.3 fps (5%)
...
Intel Iris Xe MAX Graphics
Intel Iris Graphics 540
Intel Iris Pro Graphics 5200
AMD Radeon R7 M275DX
AMD FirePro M4100
AMD Radeon R7 M260X
Intel UHD Graphics Xe 32EUs (Tiger Lake-H)
...
max:
specvp12 catia-04 + SPECviewperf 12 - specvp12 catia-04
12 fps (2%)
...
NVIDIA GeForce 940M
Intel HD Graphics 515
Intel UHD Graphics 24EUs (Alder Lake-N)
AMD Radeon RX Vega 10
Intel HD Graphics 520
AMD Radeon HD 8550G
AMD FirePro M4100
NVIDIA GeForce GTX 950M
Intel UHD Graphics Xe 16EUs (Tiger Lake-H)
NVIDIA GeForce GTX 860M
AMD Radeon R7 M275DX
...
max:
Cinebench R10 Cinebench R10 Shading (32bit) + Cinebench R10 - Cinebench R10 Shading (32bit)
min: 7690 avg: 7993 median: 7832.5 (6%) max: 8615 points
Intel Graphics Media Accelerator (GMA) 500
...
NVIDIA Quadro M5000M
AMD Radeon HD 8790M
AMD Radeon R7 M445
AMD Radeon RX Vega 8 (Ryzen 2000/3000)
AMD Radeon HD 8970M Crossfire
Intel UHD Graphics 24EUs (Alder Lake-N)
Intel Iris Graphics 540
...
Cinebench R11.5 Cinebench R11.5 OpenGL 64 Bit + Cinebench R11.5 - Cinebench R11.5 OpenGL 64 Bit
min: 20.23 avg: 24.9 median: 24.9 (9%) max: 28.68 fps
Intel Graphics Media Accelerator (GMA) 4500MHD
...
AMD Radeon R5 M335
AMD Radeon HD 8550G + HD 8670M Dual Graphics
AMD Radeon R8 M365DX
AMD Radeon HD 7640G + HD 7610M Dual Graphics
AMD Radeon R7 M360
Intel UHD Graphics 615
AMD Radeon HD 8650G + HD 8570M Dual Graphics
Intel UHD Graphics Xe 750 32EUs (Rocket Lake)
...
max:
Cinebench R15 + Cinebench R15 - Cinebench R15 OpenGL 64 Bit
min: 29.16 avg: 34.9 median: 36.4 (2%) max: 37.51 fps
Intel Graphics Media Accelerator (GMA) 4500MHD
...
AMD Radeon R7 M275DX
AMD Radeon R7 M340
AMD Radeon R7 M360
AMD Radeon R7 M260
NVIDIA Maxwell GPU Surface Book
NVIDIA GeForce GT 720M
AMD Radeon R7 M260X
Intel HD Graphics 520
AMD Radeon R7 M270
AMD FirePro M4100
...
Cinebench R15 OpenGL Ref. Match 64 Bit + Cinebench R15 - Cinebench R15 OpenGL Ref. Match 64 Bit
98 % (98%)
...
Intel Iris Plus Graphics G7 (Ice Lake 64 EU)
AMD Radeon 610M
AMD Radeon 680M
AMD Radeon 660M
Intel Iris Pro Graphics 580
Intel Iris Plus Graphics G4 (Ice Lake 48 EU)
Intel Iris Graphics 540
Intel Iris Plus Graphics 640
Intel UHD Graphics 617
...
GFXBench 3.0 - GFXBench 3.0 Manhattan Offscreen
48.8 fps (3%)
...
AMD Radeon RX Vega 8 (Ryzen 2000/3000)
AMD Radeon RX Vega 10
Intel Iris Plus Graphics G7 (Ice Lake 64 EU)
NVIDIA GeForce 920M
Intel HD Graphics 630
NVIDIA Quadro K620M
Intel HD Graphics 530
AMD Radeon R9 M370X
Intel HD Graphics 510
NVIDIA GeForce 940M
...
GFXBench (DX / GLBenchmark) 2.7 + GFXBench (DX / GLBenchmark) 2.7 - GFXBench T-Rex HD Offscreen C24Z16
102.1 fps (1%)
Intel HD Graphics (Bay Trail)
...
AMD Radeon R6 (Carrizo)
AMD Radeon R7 (Carrizo)
Intel HD Graphics 520
NVIDIA GeForce 920M
AMD Radeon HD 8650G
AMD Radeon R5 (Bristol Ridge)
AMD Radeon R7 M340
AMD Radeon R7 M360
AMD Radeon R8 M365DX
NVIDIA GeForce GT 740M
AMD Radeon R7 M275DX
...
LuxMark v2.0 64Bit - LuxMark v2.0 Room GPU
145 Samples/s (1%)
...
AMD Radeon HD 7640G + HD 7610M Dual Graphics
NVIDIA GeForce GT 735M
AMD Radeon R6 (Carrizo)
NVIDIA GeForce GT 720M
AMD Radeon HD 8450G + Radeon HD 8570M Dual Graphics
AMD Radeon HD 6620G + HD 7670M Dual Graphics
Intel HD Graphics 4400
Intel UHD Graphics 610
AMD Radeon R7 M340
...
max:
4x NVIDIA RTX A6000
LuxMark v2.0 64Bit - LuxMark v2.0 Sala GPU
390 Samples/s (1%)
...
AMD Radeon HD 8610G
NVIDIA GeForce GT 745M
AMD Radeon R7 (Carrizo)
AMD Radeon R7 M260X
AMD Radeon HD 8550G + HD 8750M Dual Graphics
AMD Radeon R5 M240
Intel HD Graphics 515
Intel Iris Graphics 5100
AMD Radeon HD 8650G + HD 8670M Dual Graphics
NVIDIA GeForce GT 740M
...
max:
4x NVIDIA RTX A6000
ComputeMark v2.1 - ComputeMark v2.1 Result
1115 points (1%)
...
Intel UHD Graphics Xe 750 32EUs (Rocket Lake)
Intel Iris Graphics 5100
AMD Radeon 610M
NVIDIA GeForce GT 640M
AMD Radeon R5 (Bristol Ridge)
AMD Radeon R5 M240
Intel Iris Pro Graphics 5200
AMD Radeon R7 M270
AMD Radeon R7 M260X
...
max:
Power Consumption - Furmark Stress Test Power Consumption - external Monitor *
43.2 Watt (6%)
...
Intel UHD Graphics Xe 32EUs (Tiger Lake-H)
AMD Radeon 660M
AMD Radeon RX Vega 8 (Ryzen 2000/3000)
AMD Radeon RX Vega 9
Intel HD Graphics (Haswell)
Intel UHD Graphics Xe 750 32EUs (Rocket Lake)
Intel Iris Xe MAX Graphics
...
max:
4x NVIDIA RTX A6000
Power Consumption - The Witcher 3 Power Consumption - external Monitor *
43 Watt (6%)
...
Apple M1 Max 32-Core GPU
Intel HD Graphics 630
NVIDIA GeForce GT 640M
NVIDIA Quadro P520
NVIDIA T500 Laptop GPU
AMD Radeon Pro 450
Intel HD Graphics 5600
NVIDIA GeForce 940M
...
max:
4x NVIDIA RTX A6000
Clock Speed - GPU Clock Witcher 3 ultra
850 MHz (33%)
Intel Iris Plus Graphics G7 (Ice Lake 64 EU)
NVIDIA GeForce GT 640M
Intel Iris Plus Graphics 640
AMD Radeon Pro 555
AMD Radeon RX Vega 8 (Ryzen 2000/3000)
...
Clock Speed - GPU Clock Speed Furmark
749 MHz (30%)
Intel UHD Graphics 605
Intel UHD Graphics 600
NVIDIA GeForce GT 640M
NVIDIA Quadro RTX 3000 Max-Q
Intel Iris Plus Graphics 640
Intel Iris Plus Graphics 650
AMD Radeon Pro 555
Intel Iris Plus Graphics G7 (Ice Lake 64 EU)
...
max:
AMD Radeon RX 6700 XT
- Range of benchmark values for this graphics card
- Average benchmark values for this graphics card
* Smaller numbers mean a higher performance
Game Benchmarks The following benchmarks stem from our benchmarks of review laptops. The performance depends on the used graphics memory, clock rate, processor, system settings, drivers, and operating systems. So the results don't have to be representative for all laptops with this GPU. For detailed information on the benchmark results, click on the fps number.
13.5 (!) [X] Intel NUC5i7RYH Intel Core i7-5557U 3.1GHz
Iris Graphics 6100
min:
11 fps, max:
16 fps
fps
+ Compare
- Hide Comparison
Intel HD Graphics 4400
Intel UHD Graphics 615
AMD Radeon R4 (Stoney Ridge)
NVIDIA GeForce GT 720M
AMD Radeon R5 (Bristol Ridge)
NVIDIA GeForce 940M
Intel HD Graphics 630
Intel UHD Graphics Xe 16EUs (Tiger Lake-H)
Intel UHD Graphics G1 (Ice Lake 32 EU)
...
max:
» The benchmarks indicate that the game is not playable in the tested settings.
...
AMD Radeon R5 (Bristol Ridge)
Intel UHD Graphics 615
Intel UHD Graphics 610
Intel UHD Graphics Xe G4 48EUs
NVIDIA GeForce 920M
AMD Radeon RX Vega 8 (Ryzen 2000/3000)
AMD Radeon RX Vega 6 (Ryzen 2000/3000)
Intel UHD Graphics G1 (Ice Lake 32 EU)
...
max:
» The benchmarks indicate that the game is not playable in the tested settings.
Intel UHD Graphics (Elkhart Lake 16 EU)
...
Intel HD Graphics 520
Intel UHD Graphics 610
AMD Radeon R5 (Bristol Ridge)
Intel HD Graphics 5600
Intel HD Graphics 4400
Intel HD Graphics 530
Intel HD Graphics 630
NVIDIA GeForce GT 720M
Intel UHD Graphics 24EUs (Alder Lake-N)
...
max:
» The benchmarks indicate that the game is not playable in the tested settings.
...
Intel UHD Graphics G1 (Ice Lake 32 EU)
NVIDIA GeForce GT 720M
Intel HD Graphics 530
Intel Iris Plus Graphics G4 (Ice Lake 48 EU)
AMD Radeon RX 560X (Laptop)
Intel Iris Plus Graphics G7 (Ice Lake 64 EU)
...
AMD Radeon Pro 560X
...
AMD Radeon RX Vega 8 (Ryzen 2000/3000)
Intel UHD Graphics G1 (Ice Lake 32 EU)
NVIDIA GeForce GT 720M
Intel HD Graphics 530
Intel Iris Plus Graphics G4 (Ice Lake 48 EU)
...
AMD Radeon Pro 560X
...
Intel UHD Graphics 615
AMD Radeon R5 (Bristol Ridge)
Intel HD Graphics 530
AMD Radeon RX Vega 6 (Ryzen 2000/3000)
Intel HD Graphics 5600
Intel UHD Graphics G1 (Ice Lake 32 EU)
Intel Iris Plus Graphics 640
AMD Radeon 540X
...
AMD Radeon Pro 560X
Intel HD Graphics 5600
Intel HD Graphics 530
AMD Radeon R5 (Bristol Ridge)
NVIDIA GeForce GT 720M
Intel UHD Graphics G1 (Ice Lake 32 EU)
...
AMD Radeon Pro 560X
max:
AMD Radeon R7 370
» With all tested laptops playable in detail settings high.
Intel HD Graphics (Bay Trail)
...
AMD Radeon RX Vega 10
AMD Radeon R5 (Bristol Ridge)
Intel HD Graphics 5600
Intel HD Graphics 530
Intel HD Graphics 630
NVIDIA GeForce 920M
AMD Radeon RX Vega 6 (Ryzen 2000/3000)
...
» With all tested laptops playable in detail settings low.
Intel HD Graphics (Bay Trail)
...
AMD Radeon HD 8650G
Intel UHD Graphics 617
Intel Iris Plus Graphics G4 (Ice Lake 48 EU)
AMD Radeon R5 (Bristol Ridge)
Intel UHD Graphics G1 (Ice Lake 32 EU)
Intel HD Graphics 4400
NVIDIA GeForce GT 720M
NVIDIA GeForce 920M
Intel HD Graphics 630
...
...
Intel UHD Graphics 615
Intel HD Graphics 4400
AMD Radeon R5 (Bristol Ridge)
NVIDIA GeForce GT 720M
Intel UHD Graphics 617
Intel HD Graphics 5600
...
max:
» With all tested laptops playable in detail settings low.
...
Intel HD Graphics 515
Intel HD Graphics 520
AMD Radeon HD 8650G
AMD Radeon R5 (Bristol Ridge)
Intel HD Graphics 5600
Intel HD Graphics 530
NVIDIA GeForce GT 720M
Intel HD Graphics 630
Intel UHD Graphics G1 (Ice Lake 32 EU)
AMD Radeon RX Vega 6 (Ryzen 2000/3000)
...
max:
» The benchmarks indicate that the game is not playable in the tested settings.
...
AMD Radeon R2 (Stoney Ridge)
Intel HD Graphics 515
Intel HD Graphics 4400
AMD Radeon R5 (Bristol Ridge)
AMD Radeon R7 M445
AMD Radeon HD 8650G
Intel HD Graphics 520
NVIDIA GeForce GT 720M
...
NVIDIA Quadro P2000
...
AMD Radeon RX Vega 10
Intel HD Graphics 5600
Intel HD Graphics 520
NVIDIA GeForce GT 720M
AMD Radeon HD 8650G
AMD Radeon RX Vega 6 (Ryzen 2000/3000)
NVIDIA GeForce GT 640M
Intel HD Graphics 530
AMD Radeon R7 M360
NVIDIA GeForce 920M
...
NVIDIA Quadro P2000
Intel HD Graphics (Haswell)
...
Intel HD Graphics 5600
NVIDIA GeForce GT 720M
AMD Radeon RX Vega 6 (Ryzen 2000/3000)
Intel HD Graphics 520
Intel HD Graphics 530
NVIDIA GeForce GT 640M
AMD Radeon R7 M360
Intel HD Graphics 630
...
max:
NVIDIA GeForce GTX 1060 (Desktop)
» With all tested laptops playable in detail settings med..
...
NVIDIA GeForce GT 720M
Intel HD Graphics 515
Intel HD Graphics 520
NVIDIA GeForce 920M
AMD Radeon R6 (Carrizo)
AMD Radeon R7 M360
AMD Radeon R5 (Bristol Ridge)
Intel HD Graphics 630
Intel Iris Graphics 540
...
NVIDIA Quadro P4000 Max-Q
max:
» The benchmarks indicate that the game is not playable in the tested settings.
...
Intel HD Graphics 4400
AMD Radeon R5 (Bristol Ridge)
NVIDIA GeForce 910M
NVIDIA GeForce GT 720M
Intel HD Graphics 530
AMD Radeon R7 M360
AMD Radeon R9 M280X
Intel HD Graphics 520
Intel HD Graphics 630
...
max:
...
AMD Radeon R5 (Bristol Ridge)
NVIDIA GeForce GT 720M
Intel HD Graphics 520
NVIDIA GeForce 910M
Intel HD Graphics 530
Intel HD Graphics 630
AMD Radeon R7 M360
NVIDIA GeForce 920M
NVIDIA GeForce GT 640M
Intel Iris Graphics 540
...
NVIDIA GeForce GTX 980 (Laptop)
max:
NVIDIA GeForce GTX 1080 (Desktop)
» The benchmarks indicate that the game is not playable in the tested settings.
...
AMD Radeon R6 (Carrizo)
Intel HD Graphics (Haswell)
Intel UHD Graphics 615
Intel HD Graphics 4400
AMD Radeon R5 (Bristol Ridge)
Intel HD Graphics 520
Intel HD Graphics 5600
Intel Iris Plus Graphics G4 (Ice Lake 48 EU)
NVIDIA GeForce GT 720M
...
...
Intel UHD Graphics 610
Intel HD Graphics 4400
Intel UHD Graphics 615
Intel HD Graphics 520
Intel HD Graphics 5600
NVIDIA GeForce GT 720M
AMD Radeon R5 (Bristol Ridge)
Intel HD Graphics 530
...
» The benchmarks indicate that the game is not playable in the tested settings.
AMD Radeon RX Vega 6 (Ryzen 2000/3000)
AMD Radeon R6 (Carrizo)
AMD Radeon HD 8650G
NVIDIA GeForce 920M
AMD Radeon R7 M340
...
NVIDIA GeForce GTX 980 (Laptop)
...
AMD Radeon R6 (Carrizo)
Intel HD Graphics 4400
Intel HD Graphics 530
Intel HD Graphics 5600
AMD Radeon R9 M280X
NVIDIA GeForce 910M
AMD Radeon R5 (Bristol Ridge)
Intel HD Graphics 520
AMD Radeon R5 M330
AMD Radeon R7 M360
NVIDIA GeForce GT 740M
...
NVIDIA GeForce GTX 1080 Mobile
max:
» The benchmarks indicate that the game is not playable in the tested settings.
Intel HD Graphics 4200
Intel HD Graphics 515
AMD Radeon R6 (Carrizo)
Intel HD Graphics 4400
NVIDIA GeForce 910M
Intel HD Graphics 520
Intel HD Graphics 5600
AMD Radeon R5 (Bristol Ridge)
Intel HD Graphics 530
NVIDIA GeForce GT 720M
...
NVIDIA GeForce GTX 980 (Laptop)
» The benchmarks indicate that the game is not playable in the tested settings.
...
Intel HD Graphics 4400
Intel UHD Graphics 615
AMD Radeon R6 (Carrizo)
NVIDIA GeForce 910M
NVIDIA GeForce GT 720M
Intel HD Graphics 520
AMD Radeon R5 (Bristol Ridge)
AMD Radeon R5 M330
AMD Radeon R6 M340DX
AMD Radeon R5 (Carrizo)
...
NVIDIA Quadro P5200
max:
» The benchmarks indicate that the game is not playable in the tested settings.
...
Intel HD Graphics 510
Intel HD Graphics 515
AMD Radeon HD 8650G
Intel UHD Graphics 615
Intel HD Graphics 520
NVIDIA GeForce GT 720M
Intel Iris Pro Graphics 5200
AMD Radeon R5 (Bristol Ridge)
AMD Radeon R7 (Carrizo)
AMD Radeon R6 (Carrizo)
NVIDIA GeForce 910M
...
max:
...
Intel HD Graphics 515
Intel HD Graphics 510
AMD Radeon HD 8650G
Intel UHD Graphics 615
Intel HD Graphics 520
NVIDIA GeForce GT 720M
Intel Iris Pro Graphics 5200
AMD Radeon R5 M330
AMD Radeon R6 (Carrizo)
AMD Radeon R7 (Carrizo)
...
max:
AMD Radeon R5 M330
NVIDIA GeForce GT 720M
Intel HD Graphics 520
AMD Radeon R6 (Carrizo)
AMD Radeon R7 (Carrizo)
AMD Radeon R5 M335
NVIDIA GeForce 910M
AMD Radeon R6 M340DX
...
max:
AMD Radeon R5 M330
AMD Radeon R6 (Carrizo)
Intel HD Graphics 520
AMD Radeon R5 M335
AMD Radeon R7 (Carrizo)
AMD Radeon R6 M340DX
NVIDIA GeForce 910M
NVIDIA GeForce GT 740M
NVIDIA GeForce GT 640M
...
max:
» The benchmarks indicate that the game is not playable in the tested settings.
...
NVIDIA GeForce 910M
Intel HD Graphics 4400
AMD Radeon R6 M340DX
NVIDIA GeForce GT 720M
AMD Radeon R9 M385X
Intel HD Graphics 520
AMD Radeon R9 M280X
AMD Radeon R5 M330
AMD Radeon R5 M335
Intel HD Graphics 630
NVIDIA GeForce 920M
...
NVIDIA GeForce GTX 980 (Laptop)
max:
NVIDIA Titan X Pascal
...
Intel HD Graphics 4400
NVIDIA GeForce 910M
NVIDIA GeForce GT 720M
AMD Radeon R6 M340DX
Intel HD Graphics 520
AMD Radeon R5 M330
AMD Radeon R5 M335
NVIDIA GeForce 920M
Intel Iris Pro Graphics 5200
Intel HD Graphics 630
AMD Radeon R9 M385X
...
NVIDIA GeForce GTX 980 (Laptop)
max:
NVIDIA GeForce GTX 1080 (Desktop)
» The benchmarks indicate that the game is not playable in the tested settings.
Intel HD Graphics (Cherry Trail)
...
AMD Radeon R7 M360
Intel HD Graphics 520
AMD Radeon R5 M335
AMD Radeon R6 M340DX
Intel HD Graphics 630
AMD Radeon R9 M385X
NVIDIA GeForce 920M
AMD Radeon R5 M330
NVIDIA GeForce GT 740M
Intel Iris Graphics 540
...
NVIDIA GeForce GTX 980 (Laptop)
20.7 (!) [X] Intel NUC5i7RYH Intel Core i7-5557U 3.1GHz
Iris Graphics 6100
min:
17 fps, max:
26 fps
fps
+ Compare
- Hide Comparison
Intel HD Graphics (Cherry Trail)
...
AMD Radeon R7 M340
NVIDIA GeForce 910M
AMD Radeon R7 (Carrizo)
Intel HD Graphics 630
AMD Radeon R7 M360
AMD Radeon R6 M340DX
AMD Radeon R5 M335
NVIDIA GeForce 920M
AMD Radeon R5 M330
Intel Iris Graphics 540
...
NVIDIA GeForce GTX 980 (Laptop)
max:
NVIDIA GeForce GTX 1080 (Desktop)
9.8 (!) [X] Intel NUC5i7RYH Intel Core i7-5557U 3.1GHz
Iris Graphics 6100
min:
8 fps, max:
13 fps
fps
+ Compare
- Hide Comparison
...
AMD Radeon R5 (Bristol Ridge)
AMD Radeon R6 (Carrizo)
AMD Radeon R7 M340
AMD Radeon R7 (Carrizo)
AMD Radeon R5 M335
AMD Radeon R6 M340DX
NVIDIA GeForce 920M
AMD Radeon R7 M360
AMD Radeon R5 M330
NVIDIA GeForce GT 740M
...
» The benchmarks indicate that the game is not playable in the tested settings.
...
AMD Radeon R6 (Carrizo)
Intel HD Graphics 520
Intel HD Graphics 4400
AMD Radeon R7 (Carrizo)
NVIDIA GeForce GT 720M
AMD Radeon R7 M360
AMD Radeon R5 M330
NVIDIA GeForce 920M
Intel HD Graphics 5600
AMD Radeon R6 M340DX
NVIDIA GeForce GT 740M
AMD Radeon R5 M335
AMD Radeon R9 M280X
...
max:
NVIDIA GeForce GTX 1060 (Desktop)
...
Intel HD Graphics 4400
NVIDIA GeForce GT 720M
AMD Radeon R6 (Carrizo)
AMD Radeon R7 (Carrizo)
AMD Radeon R5 M330
Intel HD Graphics 5600
NVIDIA GeForce 920M
AMD Radeon R7 M360
NVIDIA GeForce GT 740M
AMD Radeon R6 M340DX
AMD Radeon R5 M335
AMD Radeon R7 M340
Intel Iris Pro Graphics 5200
...
max:
NVIDIA GeForce GTX 1060 (Desktop)
» The benchmarks indicate that the game is not playable in the tested settings.
Intel HD Graphics (Cherry Trail)
...
AMD Radeon R7 (Carrizo)
NVIDIA GeForce GT 720M
AMD Radeon R5 M330
Intel Iris Pro Graphics 5200
AMD Radeon R6 (Carrizo)
AMD Radeon R5 M335
AMD Radeon R8 M365DX
AMD Radeon R7 M360
NVIDIA GeForce 920M
AMD Radeon R6 M340DX
NVIDIA GeForce GT 740M
...
NVIDIA Quadro M5000M
Intel HD Graphics (Cherry Trail)
...
AMD Radeon R5 (Bristol Ridge)
NVIDIA GeForce 910M
AMD Radeon R5 M330
NVIDIA GeForce GT 720M
AMD Radeon R7 (Carrizo)
AMD Radeon R6 (Carrizo)
AMD Radeon R5 M335
NVIDIA GeForce GT 640M
AMD Radeon R6 M340DX
AMD Radeon R7 M360
...
NVIDIA Quadro M5000M
» The benchmarks indicate that the game is not playable in the tested settings.
43.8 [X] Medion Akoya E6418-MD99620 Intel Core i5-5257U 2.7GHz
Iris Graphics 6100
51.2 [X] Lenovo G50-80 80E5039SGE Intel Core i5-5257U 2.7GHz
Iris Graphics 6100
55.5 [X] Intel NUC5i7RYH Intel Core i7-5557U 3.1GHz
Iris Graphics 6100
min:
50 fps, max:
60 fps
~ 50 fps
+ Compare
- Hide Comparison
...
Intel HD Graphics (Broadwell)
Intel HD Graphics 515
AMD Radeon R7 (Carrizo)
Intel HD Graphics 520
AMD Radeon R8 M365DX
AMD Radeon R6 (Carrizo)
Intel HD Graphics 4400
AMD Radeon R5 M330
AMD Radeon R6 M340DX
AMD Radeon R5 M335
Intel HD Graphics 5600
...
max:
NVIDIA GeForce GTX 1060 (Desktop)
37.1 [X] Lenovo G50-80 80E5039SGE Intel Core i5-5257U 2.7GHz
Iris Graphics 6100
37.2 [X] Medion Akoya E6418-MD99620 Intel Core i5-5257U 2.7GHz
Iris Graphics 6100
42.7 (!) [X] Intel NUC5i7RYH Intel Core i7-5557U 3.1GHz
Iris Graphics 6100
min:
38 fps, max:
48 fps
~ 39 fps
+ Compare
- Hide Comparison
...
Intel HD Graphics 520
AMD Radeon R6 (Carrizo)
AMD Radeon R5 M330
AMD Radeon R8 M365DX
AMD Radeon R7 (Carrizo)
AMD Radeon R5 M240
AMD Radeon R5 M335
Intel HD Graphics 5600
AMD Radeon R6 M340DX
NVIDIA GeForce GT 720M
NVIDIA GeForce 920M
Intel HD Graphics 530
...
max:
NVIDIA GeForce GTX 1060 (Desktop)
19.1 [X] Medion Akoya E6418-MD99620 Intel Core i5-5257U 2.7GHz
Iris Graphics 6100
22.8 [X] Intel NUC5i7RYH Intel Core i7-5557U 3.1GHz
Iris Graphics 6100
min:
19 fps, max:
25 fps
~ 21 fps
+ Compare
- Hide Comparison
...
AMD Radeon R8 M365DX
AMD Radeon R6 (Carrizo)
AMD Radeon R5 M335
Intel HD Graphics 520
AMD Radeon R7 (Carrizo)
Intel HD Graphics 5600
AMD Radeon R6 M340DX
NVIDIA GeForce GT 720M
AMD Radeon R7 M340
AMD Radeon R7 M360
...
» With all tested laptops playable in detail settings high.
45.1 [X] Medion Akoya E6418-MD99620 Intel Core i5-5257U 2.7GHz
Iris Graphics 6100
54 [X] Intel NUC5i7RYH Intel Core i7-5557U 3.1GHz
Iris Graphics 6100
min:
35 fps, max:
64 fps
~ 50 fps
+ Compare
- Hide Comparison
Intel HD Graphics (Bay Trail)
...
AMD Radeon R6 M340DX
AMD Radeon R5 M330
AMD Radeon HD 8650G
Intel HD Graphics 510
AMD Radeon R5 M335
AMD Radeon R8 M365DX
AMD Radeon R5 M240
Intel UHD Graphics 615
AMD Radeon R7 (Carrizo)
...
max:
NVIDIA GeForce GTX 1080 (Desktop)
31.9 [X] Medion Akoya E6418-MD99620 Intel Core i5-5257U 2.7GHz
Iris Graphics 6100
37.4 [X] Intel NUC5i7RYH 0.5.0.0
Intel Core i7-5557U 3.1GHz
Iris Graphics 6100
min:
25 fps, max:
51 fps
~ 35 fps
+ Compare
- Hide Comparison
...
Intel HD Graphics 4400
AMD Radeon R6 (Carrizo)
NVIDIA GeForce GT 640M
AMD Radeon R7 M360
AMD Radeon R6 M340DX
AMD Radeon R5 M330
AMD Radeon R5 M335
Intel UHD Graphics 615
AMD Radeon HD 8650G
AMD Radeon R5 M240
AMD Radeon R8 M365DX
AMD Radeon R7 (Carrizo)
...
max:
NVIDIA GeForce GTX 1080 (Desktop)
20.5 [X] Medion Akoya E6418-MD99620 Intel Core i5-5257U 2.7GHz
Iris Graphics 6100
22.2 [X] Intel NUC5i7RYH 0.5.0.0
Intel Core i7-5557U 3.1GHz
Iris Graphics 6100
min:
13 fps, max:
30 fps
~ 21 fps
+ Compare
- Hide Comparison
...
NVIDIA GeForce GT 640M
AMD Radeon R7 (Carrizo)
NVIDIA GeForce 910M
Intel HD Graphics 520
Intel UHD Graphics G1 (Ice Lake 32 EU)
Intel HD Graphics 5600
...
max:
NVIDIA GeForce GTX 1080 (Desktop)
16 [X] Medion Akoya E6418-MD99620 Intel Core i5-5257U 2.7GHz
Iris Graphics 6100
16.9 [X] Intel NUC5i7RYH 0.5.0.0
Intel Core i7-5557U 3.1GHz
Iris Graphics 6100
min:
10 fps, max:
24 fps
~ 16 fps
+ Compare
- Hide Comparison
...
NVIDIA GeForce 910M
AMD Radeon R5 (Bristol Ridge)
Intel HD Graphics 520
Intel HD Graphics 5600
AMD Radeon R7 (Carrizo)
Intel UHD Graphics G1 (Ice Lake 32 EU)
Intel HD Graphics 530
NVIDIA GeForce 920M
Intel Iris Plus Graphics G4 (Ice Lake 48 EU)
...
max:
» With all tested laptops playable in detail settings low.
32.2 [X] Medion Akoya E6418-MD99620 Intel Core i5-5257U 2.7GHz
Iris Graphics 6100
38.9 [X] Intel NUC5i7RYH Intel Core i7-5557U 3.1GHz
Iris Graphics 6100
min:
33 fps, max:
41 fps
~ 36 fps
+ Compare
- Hide Comparison
Intel HD Graphics (Bay Trail)
...
AMD Radeon HD 8350G
Intel HD Graphics 4200
Intel HD Graphics 5600
Intel HD Graphics 4400
Intel Iris Graphics 5100
Intel HD Graphics 510
Intel HD Graphics 520
AMD Radeon R7 M360
AMD Radeon R7 (Carrizo)
AMD Radeon R5 M335
AMD Radeon R5 M330
...
24.4 [X] Medion Akoya E6418-MD99620 Intel Core i5-5257U 2.7GHz
Iris Graphics 6100
26.3 [X] Intel NUC5i7RYH Intel Core i7-5557U 3.1GHz
Iris Graphics 6100
min:
23 fps, max:
28 fps
~ 25 fps
+ Compare
- Hide Comparison
Intel HD Graphics (Braswell)
...
AMD Radeon HD 8350G
Intel HD Graphics 4400
Intel Iris Graphics 5100
Intel HD Graphics 510
AMD Radeon R5 M335
AMD Radeon R5 M330
Intel HD Graphics 520
AMD Radeon R7 M360
AMD Radeon R6 M340DX
...
9.5 [X] Medion Akoya E6418-MD99620 Intel Core i5-5257U 2.7GHz
Iris Graphics 6100
10.3 [X] Intel NUC5i7RYH Intel Core i7-5557U 3.1GHz
Iris Graphics 6100
min:
9 fps, max:
11 fps
~ 10 fps
+ Compare
- Hide Comparison
Intel Iris Graphics 5100
AMD Radeon R5 M330
AMD Radeon R5 M335
AMD Radeon R7 M360
AMD Radeon R8 M365DX
Intel HD Graphics 520
AMD Radeon R7 (Carrizo)
Intel HD Graphics 530
AMD Radeon HD 8650G
...
AMD Radeon R9 M390
AMD Radeon R7 M360
AMD Radeon R5 M335
AMD Radeon R6 M340DX
AMD Radeon R8 M365DX
NVIDIA GeForce GT 720M
AMD Radeon R6 (Carrizo)
Intel HD Graphics 530
AMD Radeon R7 (Carrizo)
NVIDIA GeForce 910M
Intel HD Graphics 520
Intel Iris Pro Graphics 5200
...
» With most tested laptops playable in detail settings low.
19.1 [X] Medion Akoya E6418-MD99620 Intel Core i5-5257U 2.7GHz
Iris Graphics 6100
21.6 [X] Intel NUC5i7RYH Intel Core i7-5557U 3.1GHz
Iris Graphics 6100
min:
18 fps, max:
24 fps
~ 20 fps
+ Compare
- Hide Comparison
...
Intel HD Graphics 5600
AMD Radeon R8 M365DX
AMD Radeon R5 M330
Intel Iris Graphics 5100
AMD Radeon R5 (Bristol Ridge)
AMD Radeon R6 (Carrizo)
NVIDIA GeForce GT 720M
Intel HD Graphics 520
AMD Radeon R7 (Carrizo)
AMD Radeon R5 M240
AMD Radeon R7 M360
Intel HD Graphics 530
...
max:
NVIDIA GeForce GTX 1080 (Desktop)
...
Intel HD Graphics 5600
AMD Radeon R8 M365DX
NVIDIA GeForce GT 720M
Intel HD Graphics 520
AMD Radeon R6 (Carrizo)
AMD Radeon R5 (Bristol Ridge)
AMD Radeon R5 M330
AMD Radeon R7 (Carrizo)
AMD Radeon R7 M360
Intel HD Graphics 630
AMD Radeon R7 M340
NVIDIA GeForce GT 740M
Intel Iris Pro Graphics 5200
...
AMD Radeon R7 M360
AMD Radeon R7 (Carrizo)
Intel HD Graphics 530
AMD Radeon R7 M340
NVIDIA GeForce GT 740M
...
» The benchmarks indicate that the game is not playable in the tested settings.
...
Intel Iris Plus Graphics G7 (Ice Lake 64 EU)
AMD Radeon 610M
AMD Radeon Pro 560X
AMD Radeon RX 580 (Laptop)
AMD Radeon RX 550X (Laptop)
AMD Radeon RX 560X (Laptop)
NVIDIA Quadro P500
...
max:
...
Intel Iris Pro Graphics 580
AMD Radeon R7 M340
Intel Iris Graphics 5100
AMD Radeon R9 M280X
Intel HD Graphics 510
Intel Iris Graphics 550
AMD Radeon 540X
AMD Radeon RX Vega 6 (Ryzen 2000/3000)
Intel UHD Graphics 24EUs (Alder Lake-N)
Intel HD Graphics 520
AMD Radeon R9 M375
NVIDIA GeForce GT 640M
Intel Iris Plus Graphics G7 (Ice Lake 64 EU)
...
max:
...
Intel Iris Plus Graphics G4 (Ice Lake 48 EU)
AMD Radeon R5 (Bristol Ridge)
Intel Iris Graphics 5100
Intel UHD Graphics 24EUs (Alder Lake-N)
NVIDIA GeForce GT 720M
AMD Radeon R7 M340
Intel UHD Graphics G1 (Ice Lake 32 EU)
Intel UHD Graphics Xe 16EUs (Tiger Lake-H)
Intel HD Graphics 530
...
max:
...
AMD Radeon R5 (Bristol Ridge)
Intel Iris Graphics 5100
Intel Iris Plus Graphics G4 (Ice Lake 48 EU)
AMD Radeon R7 M340
NVIDIA GeForce GT 720M
Intel UHD Graphics 24EUs (Alder Lake-N)
Intel HD Graphics 530
Intel UHD Graphics G1 (Ice Lake 32 EU)
Intel UHD Graphics Xe 16EUs (Tiger Lake-H)
Intel Iris Plus Graphics 640
...
max:
» With all tested laptops playable in detail settings med..
15 [X] Medion Akoya E6417-MD99248 Intel Core i3-5157U 2.5GHz
Iris Graphics 6100
16 [X] Intel NUC5i7RYH Intel Core i7-5557U 3.1GHz
Iris Graphics 6100
min:
12 fps, max:
22 fps
~ 16 fps
+ Compare
- Hide Comparison
...
Intel HD Graphics 5600
Intel HD Graphics 530
NVIDIA GeForce 910M
NVIDIA GeForce GT 720M
NVIDIA GeForce GT 740M
AMD Radeon R7 (Carrizo)
NVIDIA GeForce 920M
AMD Radeon R7 M360
AMD Radeon R5 M240
Intel Iris Pro Graphics 5200
AMD Radeon R5 M330
AMD Radeon R5 M335
AMD Radeon R6 M340DX
AMD Radeon R7 M340
NVIDIA Quadro K1100M
...
...
NVIDIA GeForce GT 720M
Intel HD Graphics 530
NVIDIA GeForce 920M
NVIDIA GeForce 910M
NVIDIA GeForce GT 740M
AMD Radeon R7 M340
AMD Radeon R7 M360
AMD Radeon R8 M365DX
NVIDIA Maxwell GPU Surface Book
AMD Radeon R6 M340DX
AMD Radeon R5 M335
AMD Radeon R5 M330
NVIDIA Quadro K1100M
Intel Iris Pro Graphics 5200
...
NVIDIA GeForce GT 740M
AMD Radeon R5 M330
Intel HD Graphics 5600
NVIDIA GeForce GT 720M
AMD Radeon R6 M340DX
AMD Radeon R7 (Carrizo)
AMD Radeon R7 M340
NVIDIA GeForce 920M
NVIDIA Quadro K1100M
AMD Radeon R8 M365DX
NVIDIA GeForce GT 750M
...
» The benchmarks indicate that the game is not playable in the tested settings.
15.3 [X] Medion Akoya E6417-MD99248 Intel Core i3-5157U 2.5GHz
Iris Graphics 6100
16.3 [X] Intel NUC5i7RYH Intel Core i7-5557U 3.1GHz
Iris Graphics 6100
min:
12 fps, max:
22 fps
~ 16 fps
+ Compare
- Hide Comparison
...
Intel Iris Graphics 5100
NVIDIA GeForce GT 720M
Intel HD Graphics 5600
AMD Radeon HD 8650G
AMD Radeon R5 M330
AMD Radeon R6 (Carrizo)
Intel HD Graphics 630
AMD Radeon R5 M335
AMD Radeon R6 M340DX
AMD Radeon R7 (Carrizo)
...
max:
10.1 [X] Medion Akoya E6417-MD99248 Intel Core i3-5157U 2.5GHz
Iris Graphics 6100
10.4 [X] Intel NUC5i7RYH Intel Core i7-5557U 3.1GHz
Iris Graphics 6100
min:
8 fps, max:
15 fps
~ 10 fps
+ Compare
- Hide Comparison
...
Intel HD Graphics 520
Intel UHD Graphics 610
Intel HD Graphics 530
NVIDIA GeForce GT 720M
Intel HD Graphics 5600
AMD Radeon R6 (Carrizo)
AMD Radeon R5 M330
AMD Radeon R5 (Bristol Ridge)
AMD Radeon R5 M335
AMD Radeon R6 M340DX
NVIDIA Quadro K1100M
...
max:
» The benchmarks indicate that the game is not playable in the tested settings.
83.4 [X] Medion Akoya E6417-MD99248 Intel Core i3-5157U 2.5GHz
Iris Graphics 6100
83.7 [X] Medion Akoya E6418-MD99620 Intel Core i5-5257U 2.7GHz
Iris Graphics 6100
103 [X] Intel NUC5i7RYH Intel Core i7-5557U 3.1GHz
Iris Graphics 6100
min:
89 fps, max:
139 fps
~ 90 fps
+ Compare
- Hide Comparison
...
AMD Radeon R7 (Carrizo)
Intel HD Graphics 520
AMD Radeon R6 (Carrizo)
Intel Iris Graphics 5100
AMD Radeon R5 M330
AMD Radeon RX Vega 6 (Ryzen 2000/3000)
...
24.3 [X] Medion Akoya E6417-MD99248 Intel Core i3-5157U 2.5GHz
Iris Graphics 6100
25.8 [X] Medion Akoya E6418-MD99620 Intel Core i5-5257U 2.7GHz
Iris Graphics 6100
28.6 [X] Intel NUC5i7RYH Intel Core i7-5557U 3.1GHz
Iris Graphics 6100
min:
23 fps, max:
39 fps
~ 26 fps
+ Compare
- Hide Comparison
Intel HD Graphics (Braswell)
...
AMD Radeon R5 (Bristol Ridge)
Intel HD Graphics 520
AMD Radeon R5 M330
NVIDIA GeForce 910M
AMD Radeon R6 (Carrizo)
AMD Radeon R7 (Carrizo)
Intel HD Graphics 530
Intel HD Graphics 5600
AMD Radeon R5 M335
AMD Radeon RX Vega 6 (Ryzen 2000/3000)
...
AMD FirePro W7170M
max:
NVIDIA GeForce GTX 1060 (Desktop)
13.4 [X] Medion Akoya E6418-MD99620 Intel Core i5-5257U 2.7GHz
Iris Graphics 6100
13.8 [X] Medion Akoya E6417-MD99248 Intel Core i3-5157U 2.5GHz
Iris Graphics 6100
14.2 [X] Intel NUC5i7RYH Intel Core i7-5557U 3.1GHz
Iris Graphics 6100
min:
12.5 fps, max:
18 fps
~ 14 fps
+ Compare
- Hide Comparison
...
Intel HD Graphics 520
Intel HD Graphics 5600
Intel HD Graphics 530
AMD Radeon R5 (Bristol Ridge)
Intel Iris Graphics 5100
AMD Radeon R6 (Carrizo)
AMD Radeon R5 M335
AMD Radeon R8 M365DX
NVIDIA GeForce GT 720M
Intel HD Graphics 630
...
NVIDIA GeForce 920M
NVIDIA GeForce 940M
NVIDIA GeForce GT 640M
NVIDIA GeForce GT 750M
AMD Radeon RX Vega 8 (Ryzen 2000/3000)
...
» With all tested laptops playable in detail settings low.
...
Intel HD Graphics 4400
Intel UHD Graphics 610
Qualcomm Adreno 690
Intel HD Graphics 510
AMD Radeon R6 (Carrizo)
Intel HD Graphics 520
Intel UHD Graphics Xe 750 32EUs (Rocket Lake)
Intel Iris Graphics 550
AMD Radeon R5 (Bristol Ridge)
...
max:
...
Intel HD Graphics 5000
AMD Radeon HD 8650G
Intel UHD Graphics 615
Intel HD Graphics 4400
Intel UHD Graphics 610
Intel Iris Graphics 5100
Intel HD Graphics 510
Intel HD Graphics 520
Intel Iris Plus Graphics 640
Intel Iris Graphics 550
...
max:
» The benchmarks indicate that the game is not playable in the tested settings.
39.3 [X] Medion Akoya E6418-MD99620 Intel Core i5-5257U 2.7GHz
Iris Graphics 6100
45.7 [X] Intel NUC5i7RYH Intel Core i7-5557U 3.1GHz
Iris Graphics 6100
min:
36 fps, max:
54 fps
~ 43 fps
+ Compare
- Hide Comparison
AMD Radeon R2 (Stoney Ridge)
...
AMD Radeon R7 (Carrizo)
AMD Radeon R5 M330
Intel HD Graphics 5600
AMD Radeon R7 M340
AMD Radeon R9 M280X
Intel HD Graphics 520
NVIDIA GeForce 920M
NVIDIA GeForce GT 740M
NVIDIA GeForce GT 640M
AMD Radeon R5 M240
Intel HD Graphics 530
AMD Radeon R7 M270
AMD Radeon R6 M340DX
...
25.1 [X] Medion Akoya E6418-MD99620 Intel Core i5-5257U 2.7GHz
Iris Graphics 6100
27.9 [X] Intel NUC5i7RYH Intel Core i7-5557U 3.1GHz
Iris Graphics 6100
min:
22 fps, max:
31 fps
~ 27 fps
+ Compare
- Hide Comparison
AMD Radeon R2 (Stoney Ridge)
...
NVIDIA GeForce GT 720M
Intel HD Graphics 510
AMD Radeon R6 (Carrizo)
Intel Iris Graphics 5100
AMD Radeon R5 M330
AMD Radeon R7 (Carrizo)
Intel HD Graphics 5600
Intel HD Graphics 520
AMD Radeon R7 M360
AMD Radeon R7 M340
NVIDIA GeForce 920M
Intel HD Graphics 530
...
8.9 [X] Medion Akoya E6418-MD99620 Intel Core i5-5257U 2.7GHz
Iris Graphics 6100
9.9 [X] Intel NUC5i7RYH Intel Core i7-5557U 3.1GHz
Iris Graphics 6100
min:
8 fps, max:
12 fps
~ 9 fps
+ Compare
- Hide Comparison
NVIDIA GeForce 910M
Intel HD Graphics 5000
Intel HD Graphics 515
AMD Radeon R6 (Carrizo)
AMD Radeon R7 (Carrizo)
Intel Iris Graphics 5100
Intel HD Graphics 520
NVIDIA GeForce GT 720M
AMD Radeon R6 M340DX
AMD Radeon R5 M335
Intel HD Graphics 5600
...
Intel HD Graphics 515
Intel HD Graphics 5000
AMD Radeon HD 8650G
Intel HD Graphics 520
Intel Iris Graphics 5100
NVIDIA GeForce 910M
AMD Radeon R7 (Carrizo)
Intel HD Graphics 5600
AMD Radeon R5 M335
AMD Radeon R6 M340DX
Intel HD Graphics 530
...
» With all tested laptops playable in detail settings low.
Intel HD Graphics (Bay Trail)
...
Intel HD Graphics 530
AMD Radeon HD 8650G
NVIDIA GeForce GT 720M
Intel HD Graphics 5600
Intel Iris Graphics 5100
AMD Radeon R6 (Carrizo)
AMD Radeon R7 M260X
AMD Radeon R5 M330
AMD Radeon R5 M335
AMD Radeon R5 M240
NVIDIA GeForce 920M
AMD Radeon R7 M260
AMD Radeon R7 M340
NVIDIA GeForce GT 640M
NVIDIA GeForce GT 740M
...
Intel HD Graphics (Bay Trail)
...
Intel HD Graphics 530
Intel HD Graphics 5600
NVIDIA GeForce GT 720M
AMD Radeon R6 (Carrizo)
AMD Radeon R7 M260X
Intel Iris Graphics 5100
AMD Radeon R5 M335
AMD Radeon R7 M340
AMD Radeon R5 M240
NVIDIA GeForce 920M
AMD Radeon R7 M260
NVIDIA GeForce GT 740M
NVIDIA GeForce 845M
AMD Radeon R8 M365DX
NVIDIA GeForce GT 640M
...
Intel HD Graphics 5000
Intel HD Graphics 530
NVIDIA GeForce GT 720M
Intel HD Graphics 5600
AMD Radeon R6 (Carrizo)
AMD Radeon R7 M260X
AMD Radeon R5 M330
AMD Radeon R5 M335
NVIDIA GeForce GT 640M
NVIDIA GeForce 920M
AMD Radeon R7 M340
NVIDIA GeForce GT 740M
NVIDIA GeForce 845M
AMD Radeon R7 M260
...
Intel HD Graphics 5000
AMD Radeon R5 M335
Intel HD Graphics 530
AMD Radeon R7 M340
Intel HD Graphics 5600
AMD Radeon R7 M260X
NVIDIA GeForce 920M
NVIDIA GeForce GT 740M
...
» The benchmarks indicate that the game is not playable in the tested settings.
...
AMD Radeon R5 (Bristol Ridge)
AMD Radeon R5 M330
NVIDIA GeForce 910M
NVIDIA GeForce GT 720M
AMD Radeon R5 M240
AMD Radeon R7 M260X
AMD Radeon R7 M260
AMD Radeon R6 M340DX
NVIDIA GeForce 845M
NVIDIA GeForce 920M
Intel HD Graphics 5600
...
max:
NVIDIA GeForce GTX 1080 (Desktop)
...
AMD Radeon R5 M330
AMD Radeon HD 8650G
Intel Iris Graphics 5100
AMD Radeon R5 (Bristol Ridge)
NVIDIA GeForce GT 720M
AMD Radeon R7 M260X
AMD Radeon R5 M240
NVIDIA GeForce 910M
AMD Radeon R6 M340DX
Intel HD Graphics 5600
Intel HD Graphics 530
...
max:
NVIDIA GeForce GTX 1060 (Desktop)
» The benchmarks indicate that the game is not playable in the tested settings.
Intel HD Graphics (Bay Trail)
...
AMD Radeon HD 8330
Intel HD Graphics 4400
Intel HD Graphics 5000
Intel HD Graphics 530
Intel HD Graphics 5600
AMD Radeon HD 8650G
AMD Radeon R5 M330
NVIDIA GeForce GT 720M
AMD Radeon R9 M280X
...
» The benchmarks indicate that the game is not playable in the tested settings.
...
Intel Iris Graphics 5100
AMD Radeon R6 (Carrizo)
AMD Radeon HD 8650G
AMD Radeon R8 M365DX
AMD Radeon R7 M360
AMD Radeon R9 M280X
AMD Radeon R5 M330
NVIDIA GeForce GT 720M
Intel HD Graphics 5600
NVIDIA GeForce GT 640M
NVIDIA GeForce 920M
...
NVIDIA GeForce GTX 980 (Laptop)
...
AMD Radeon R6 M255DX
AMD Radeon R6 (Carrizo)
Intel Iris Graphics 5100
AMD Radeon HD 8550G
AMD Radeon HD 8650G
AMD Radeon R8 M365DX
NVIDIA GeForce GT 720M
AMD Radeon R7 M360
AMD Radeon R5 M330
Intel HD Graphics 5600
NVIDIA GeForce 920M
NVIDIA GeForce GT 740M
Intel Iris Pro Graphics 5200
...
NVIDIA GeForce GTX 980 (Laptop)
Intel HD Graphics 5000
AMD Radeon R6 M255DX
Intel HD Graphics 5600
NVIDIA GeForce 920M
NVIDIA GeForce GT 720M
AMD Radeon R7 M360
AMD Radeon R5 M330
NVIDIA Quadro K1100M
AMD Radeon R7 M260X
NVIDIA GeForce GT 740M
Intel Iris Pro Graphics 5200
AMD Radeon R9 M375
NVIDIA GeForce 940M
...
NVIDIA GeForce GTX 980 (Laptop)
max:
NVIDIA GeForce GTX 970
» With most tested laptops playable in detail settings low.
Intel HD Graphics (Braswell)
...
AMD Radeon R6 M255DX
AMD Radeon R7 M360
AMD Radeon HD 8650G
AMD Radeon R7 M260X
NVIDIA GeForce GT 640M
NVIDIA GeForce GT 720M
AMD Radeon R9 M375
AMD Radeon R7 M275DX
Intel Iris Pro Graphics 5200
Intel HD Graphics 530
...
max:
Intel HD Graphics (Braswell)
...
AMD Radeon R8 M365DX
AMD Radeon R7 M260
Intel HD Graphics 530
AMD Radeon R7 M275DX
NVIDIA GeForce GT 740M
Intel Iris Pro Graphics 5200
NVIDIA GeForce GT 750M
NVIDIA GeForce 940M
AMD Radeon R7 M360
AMD Radeon R9 M375
AMD Radeon R9 M370X
...
...
Intel HD Graphics 530
AMD Radeon R8 M365DX
NVIDIA GeForce GT 740M
AMD Radeon R7 M260
AMD Radeon R7 M275DX
Intel Iris Pro Graphics 5200
NVIDIA GeForce GT 750M
NVIDIA GeForce 940M
AMD Radeon R7 M360
AMD Radeon R9 M375
...
...
AMD Radeon R6 (Carrizo)
Intel HD Graphics 530
AMD Radeon R7 M260X
NVIDIA GeForce GT 740M
AMD Radeon R8 M365DX
Intel Iris Pro Graphics 5200
NVIDIA GeForce GT 750M
NVIDIA GeForce 940M
AMD Radeon R7 M360
AMD Radeon R7 M275DX
...
» With all tested laptops playable in detail settings low.
Intel HD Graphics (Braswell)
...
Intel HD Graphics 5000
AMD Radeon R5 (Bristol Ridge)
Intel HD Graphics 520
AMD Radeon R6 M340DX
NVIDIA GeForce GT 720M
AMD Radeon R9 M280X
AMD Radeon HD 8650G
AMD Radeon R7 M260
AMD Radeon R7 M275DX
...
max:
...
AMD Radeon R5 (Bristol Ridge)
AMD Radeon R5 M240
Intel HD Graphics 5000
AMD Radeon R7 M360
AMD Radeon R6 M340DX
AMD Radeon R7 M260
AMD Radeon HD 8650G
AMD Radeon R5 M330
Intel HD Graphics 520
...
...
Intel HD Graphics 5000
AMD Radeon R5 M330
AMD Radeon R6 M255DX
NVIDIA GeForce 910M
Intel HD Graphics 520
AMD Radeon R8 M365DX
AMD Radeon R7 M260
AMD Radeon R7 M360
AMD Radeon R5 M230
AMD Radeon HD 8650G
...
...
Intel HD Graphics 5000
Intel Iris Graphics 5100
Intel HD Graphics 520
AMD Radeon R6 M255DX
Intel HD Graphics 5600
AMD Radeon R6 (Carrizo)
AMD Radeon R7 M260
AMD Radeon HD 8650G
AMD Radeon R6 M340DX
AMD Radeon R7 M360
AMD Radeon R8 M365DX
...
NVIDIA Quadro M3000M
» With all tested laptops playable in detail settings med..
Intel HD Graphics (Bay Trail)
...
AMD Radeon HD 8650G
NVIDIA GeForce GT 720M
AMD Radeon R6 M255DX
AMD Radeon R7 M275DX
AMD Radeon R5 M330
Intel Iris Pro Graphics 5200
NVIDIA GeForce GT 740M
AMD Radeon R7 M260
NVIDIA GeForce 920M
AMD Radeon R7 M270
AMD Radeon R7 M360
...
Intel HD Graphics (Bay Trail)
...
Intel HD Graphics 4400
Intel HD Graphics 5000
NVIDIA GeForce GT 720M
AMD Radeon R6 M255DX
AMD Radeon R5 M330
NVIDIA GeForce GT 740M
NVIDIA GeForce 920M
AMD Radeon R7 M260
Intel Iris Pro Graphics 5200
AMD Radeon R7 M360
AMD Radeon R7 M270
...
AMD Radeon R5 M230
Intel HD Graphics 4400
NVIDIA GeForce GT 720M
NVIDIA GeForce GT 740M
NVIDIA GeForce 920M
AMD Radeon R7 M270
Intel Iris Pro Graphics 5200
AMD Radeon R7 M360
NVIDIA GeForce GT 750M
AMD Radeon R7 M260
...
» The benchmarks indicate that the game is not playable in the tested settings.
Intel HD Graphics (Bay Trail)
...
AMD Radeon HD 8650G
AMD Radeon R5 M230
Intel HD Graphics 5600
Intel Iris Pro Graphics 5200
AMD Radeon R5 M330
AMD Radeon R5 M240
NVIDIA GeForce GT 740M
NVIDIA GeForce GT 640M
NVIDIA GeForce 920M
AMD Radeon R7 M360
AMD Radeon R7 M260
NVIDIA Quadro K1100M
...
NVIDIA Quadro M5000M
Intel HD Graphics (Bay Trail)
...
NVIDIA GeForce GT 720M
Intel Iris Graphics 5100
AMD Radeon R5 M230
AMD Radeon R5 M330
Intel HD Graphics 5600
AMD Radeon R5 M240
Intel Iris Pro Graphics 5200
NVIDIA GeForce GT 740M
AMD Radeon R7 M260
AMD Radeon R7 M360
NVIDIA GeForce GT 640M
NVIDIA GeForce 920M
...
NVIDIA Quadro M5000M
...
NVIDIA GeForce GT 720M
AMD Radeon R5 M230
Intel Iris Graphics 5100
Intel HD Graphics 5600
NVIDIA GeForce GT 640M
AMD Radeon R5 M240
NVIDIA GeForce GT 740M
AMD Radeon R7 M260
NVIDIA GeForce 920M
AMD Radeon R7 M360
NVIDIA Quadro K1100M
...
NVIDIA GeForce 920M
AMD Radeon R7 M360
Intel HD Graphics 5600
NVIDIA GeForce GT 640M
NVIDIA GeForce GT 740M
NVIDIA Quadro K1100M
AMD Radeon R7 M270
NVIDIA GeForce GT 750M
AMD FirePro M5100
NVIDIA GeForce 940M
...
» The benchmarks indicate that the game is not playable in the tested settings.
Intel HD Graphics (Bay Trail)
...
AMD Radeon R5 M335
AMD Radeon R5 M240
AMD Radeon R6 (Carrizo)
AMD Radeon HD 8650G
AMD Radeon R9 M280X
NVIDIA GeForce GT 720M
AMD Radeon R7 M360
Intel HD Graphics 520
AMD Radeon R7 M340
AMD Radeon R5 (Bristol Ridge)
...
max:
NVIDIA GeForce GTX 1060 (Desktop)
Intel HD Graphics (Bay Trail)
...
AMD Radeon R5 (Bristol Ridge)
Intel HD Graphics 520
AMD Radeon HD 8650G
NVIDIA GeForce GT 720M
AMD Radeon R9 M280X
AMD Radeon R7 M360
Intel HD Graphics 5600
NVIDIA GeForce 920M
AMD Radeon R7 M270
Intel HD Graphics 530
AMD Radeon R7 M340
...
max:
NVIDIA GeForce GTX 1060 (Desktop)
...
AMD Radeon HD 8650G
Intel HD Graphics 5600
NVIDIA GeForce 920M
AMD Radeon R7 M360
Intel HD Graphics 530
NVIDIA GeForce GT 740M
AMD Radeon R7 M340
AMD Radeon R7 M270
AMD Radeon R9 M280X
...
NVIDIA GeForce GTX 1080 Mobile
max:
NVIDIA GeForce GTX 1080 (Desktop)
...
AMD Radeon R6 M255DX
NVIDIA GeForce 920M
NVIDIA GeForce GT 720M
Intel HD Graphics 5600
Intel HD Graphics 530
AMD Radeon HD 8650G
AMD Radeon R5 (Bristol Ridge)
NVIDIA GeForce GT 740M
AMD Radeon R7 M360
AMD Radeon R7 M340
AMD Radeon R7 M270
...
» With all tested laptops playable in detail settings low.
Intel HD Graphics (Bay Trail)
...
Intel Iris Graphics 5100
AMD Radeon R5 M240
NVIDIA GeForce GT 720M
AMD Radeon R7 M260
AMD Radeon R7 (Carrizo)
Intel UHD Graphics 615
AMD Radeon HD 8550G
Intel HD Graphics 520
AMD Radeon R7 M340
NVIDIA GeForce 920M
AMD Radeon R7 M360
NVIDIA GeForce GT 740M
...
Intel HD Graphics (Bay Trail)
...
Intel UHD Graphics 615
AMD Radeon R5 M240
AMD Radeon R7 M260
Intel Iris Graphics 5100
AMD Radeon R7 (Carrizo)
AMD Radeon HD 8550G
AMD Radeon R5 (Bristol Ridge)
AMD Radeon R7 M360
Intel HD Graphics 520
NVIDIA GeForce 920M
NVIDIA GeForce GT 740M
AMD Radeon R7 M340
Intel HD Graphics 5600
...
...
Intel Iris Graphics 5100
AMD Radeon R7 M260
Intel HD Graphics 520
AMD Radeon R7 (Carrizo)
NVIDIA GeForce 920M
AMD Radeon R7 M360
Intel HD Graphics 5600
NVIDIA GeForce GT 740M
AMD Radeon R7 M340
AMD FirePro W4190M
Intel HD Graphics 530
...
...
NVIDIA GeForce 920M
AMD Radeon R7 (Carrizo)
NVIDIA GeForce GT 740M
AMD Radeon R7 M340
Intel HD Graphics 5600
Intel HD Graphics 530
NVIDIA Quadro K1100M
NVIDIA GeForce GT 640M
AMD Radeon R7 M270
AMD Radeon R7 M275DX
NVIDIA GeForce GT 750M
Intel Iris Graphics 550
AMD Radeon R6 M255DX
...
» The benchmarks indicate that the game is not playable in the tested settings.
...
AMD Radeon HD 8550G
AMD Radeon HD 8650G
AMD Radeon R7 M360
AMD Radeon R9 M280X
AMD Radeon R6 (Carrizo)
Intel Iris Graphics 5100
AMD Radeon R7 M275DX
Intel HD Graphics 530
Intel HD Graphics 5600
NVIDIA GeForce GT 720M
NVIDIA GeForce 920M
AMD Radeon R7 M260
...
...
AMD Radeon R5 M330
Intel HD Graphics 520
AMD Radeon HD 8650G
Intel Iris Graphics 5100
AMD Radeon R9 M280X
Intel HD Graphics 5600
NVIDIA GeForce GT 720M
AMD Radeon R7 M260
AMD Radeon R7 M360
AMD Radeon R7 M275DX
NVIDIA GeForce 920M
AMD Radeon R7 M260X
NVIDIA GeForce GT 740M
...
max:
NVIDIA GeForce GTX 970
...
AMD Radeon R7 M260
AMD Radeon HD 8650G
Intel HD Graphics 520
AMD Radeon R7 M360
Intel HD Graphics 5600
Intel HD Graphics 530
Intel Iris Graphics 5100
AMD Radeon R7 M260X
NVIDIA GeForce GT 720M
AMD Radeon R9 M375
NVIDIA GeForce 920M
AMD Radeon R7 M275DX
NVIDIA GeForce GT 740M
...
max:
NVIDIA GeForce GTX 970
» With all tested laptops playable in detail settings high.
...
NVIDIA Quadro K3100M
AMD Radeon R9 M295X
Intel HD Graphics 510
Intel Iris Plus Graphics G7 (Ice Lake 64 EU)
NVIDIA Quadro K5100M
NVIDIA GeForce GTX 980 (Laptop)
AMD Radeon HD 8970M
Intel Iris Graphics 550
NVIDIA GeForce GTX 960M
NVIDIA GeForce 945M
...
max:
Intel HD Graphics (Bay Trail)
...
AMD Radeon RX Vega 6 (Ryzen 2000/3000)
AMD Radeon R7 M260X
Intel HD Graphics 5600
Intel HD Graphics 530
NVIDIA GeForce GT 720M
NVIDIA GeForce 845M
Intel UHD Graphics G1 (Ice Lake 32 EU)
Intel HD Graphics 630
AMD Radeon RX Vega 8 (Ryzen 2000/3000)
NVIDIA Quadro K1100M
...
max:
NVIDIA GeForce GTX 1060 (Desktop)
...
AMD Radeon R7 M360
AMD Radeon R8 M365DX
AMD Radeon R7 M275DX
Intel HD Graphics 5600
AMD Radeon R7 M340
AMD Radeon R7 M260X
NVIDIA GeForce GT 720M
Intel HD Graphics 530
...
NVIDIA GeForce GTX 1080 Mobile
...
AMD Radeon R5 M335
AMD Radeon R6 (Carrizo)
AMD Radeon R5 (Bristol Ridge)
AMD Radeon R7 (Carrizo)
AMD Radeon R9 M280X
AMD Radeon HD 8650G
Intel HD Graphics 5600
AMD Radeon R8 M365DX
AMD Radeon R7 M360
Intel HD Graphics 530
AMD Radeon R7 M275DX
...
max:
NVIDIA Titan X Pascal
» With all tested laptops playable in detail settings med..
...
Intel HD Graphics 520
AMD Radeon R5 M330
AMD Radeon R6 M255DX
NVIDIA GeForce GT 720M
AMD Radeon R5 M240
Intel HD Graphics 5000
AMD Radeon R7 M260
AMD Radeon R5 M230
NVIDIA GeForce GTX 960M
AMD Radeon R7 M360
AMD Radeon RX Vega 8 (Ryzen 2000/3000)
...
...
Intel HD Graphics 4400
AMD Radeon R6 M255DX
AMD Radeon R5 M330
Intel HD Graphics 520
AMD Radeon R5 M230
AMD Radeon R5 M240
Intel HD Graphics 5000
NVIDIA GeForce GT 720M
AMD Radeon R7 M260
Intel Iris Graphics 5100
AMD Radeon HD 8550G
AMD Radeon R7 M360
...
NVIDIA GeForce GTX 780M
max:
Intel HD Graphics 520
AMD Radeon HD 8610G
Intel HD Graphics 5000
AMD Radeon R5 M230
AMD Radeon R7 M360
AMD Radeon R6 M255DX
NVIDIA GeForce GT 720M
...
max:
Intel HD Graphics 5000
AMD Radeon R7 M360
Intel Iris Graphics 5100
NVIDIA GeForce 920M
AMD Radeon RX Vega 8 (Ryzen 2000/3000)
...
NVIDIA GeForce GTX 1080 Mobile
» The benchmarks indicate that the game is not playable in the tested settings.
...
NVIDIA GeForce GT 720M
AMD Radeon R5 M240
Intel HD Graphics 5000
Intel HD Graphics 515
AMD Radeon R6 M340DX
AMD Radeon R9 M375
AMD Radeon HD 8550G
Intel UHD Graphics 615
AMD Radeon R7 M260
AMD Radeon HD 8650G
Intel HD Graphics 5600
Intel HD Graphics 520
AMD Radeon R5 M330
AMD Radeon R7 M360
...
Intel HD Graphics (Bay Trail)
...
AMD Radeon R6 (Carrizo)
NVIDIA GeForce GT 720M
Intel HD Graphics 510
Intel UHD Graphics 615
Intel Iris Graphics 5100
AMD Radeon R8 M365DX
AMD Radeon R7 M260
AMD Radeon R5 M240
AMD Radeon R5 M330
AMD Radeon HD 8550G
Intel HD Graphics 520
AMD Radeon R5 M230
...
...
AMD Radeon R5 M230
AMD Radeon R6 M255DX
Intel HD Graphics 520
AMD Radeon HD 8650G
AMD Radeon R6 M340DX
AMD Radeon R5 M335
AMD Radeon R5 M240
Intel HD Graphics 530
...
max:
NVIDIA GeForce GTX 970
...
Intel HD Graphics 5000
AMD Radeon R6 M340DX
Intel HD Graphics 520
Intel HD Graphics 530
AMD Radeon R5 M335
AMD Radeon HD 8650G
NVIDIA GeForce 920M
AMD Radeon R7 M360
AMD Radeon R7 M340
AMD Radeon R7 M270
Intel Iris Pro Graphics 5200
NVIDIA GeForce GT 740M
...
max:
NVIDIA GeForce GTX 1060 (Desktop)
» With all tested laptops playable in detail settings low.
...
AMD Radeon HD 8650G
Intel Iris Graphics 5100
AMD Radeon R8 M365DX
AMD Radeon R7 M260
AMD Radeon HD 8550G
AMD Radeon R5 M330
AMD Radeon R5 M335
AMD Radeon R7 M340
NVIDIA Quadro K620M
Intel HD Graphics 520
...
Intel HD Graphics (Bay Trail)
...
AMD Radeon R6 M255DX
AMD Radeon R5 M330
Intel HD Graphics 520
AMD Radeon R5 M335
AMD Radeon R8 M365DX
AMD Radeon R7 M360
NVIDIA GeForce GT 735M
NVIDIA GeForce 920M
AMD Radeon R7 M260
...
...
AMD Radeon R5 M330
AMD Radeon R5 M240
AMD Radeon HD 8650G
AMD Radeon R5 M335
NVIDIA GeForce GT 720M
Intel HD Graphics 520
AMD Radeon R8 M365DX
NVIDIA GeForce GT 735M
AMD Radeon R7 M260X
...
NVIDIA Quadro P5200
...
AMD Radeon R7 (Carrizo)
AMD Radeon R6 M255DX
AMD Radeon R5 M330
Intel Iris Graphics 5100
AMD Radeon R5 M335
AMD Radeon R6 (Carrizo)
AMD Radeon HD 8650G
NVIDIA GeForce 920M
Intel HD Graphics 5600
Intel HD Graphics 530
NVIDIA GeForce GT 740M
AMD Radeon R8 M365DX
AMD Radeon R7 M260
NVIDIA GeForce GT 640M
...
» The benchmarks indicate that the game is not playable in the tested settings.
Intel HD Graphics (Bay Trail)
...
Intel HD Graphics 510
AMD Radeon HD 8550G
NVIDIA GeForce 910M
AMD Radeon R6 M255DX
Intel HD Graphics 520
AMD Radeon HD 8650G + HD 8570M Dual Graphics
AMD Radeon R5 (Bristol Ridge)
Intel Iris Graphics 5100
AMD Radeon R8 M365DX
AMD Radeon R5 M230
AMD Radeon R5 M330
AMD Radeon R6 M340DX
...
NVIDIA GeForce GTX 980 (Laptop)
max:
NVIDIA Titan RTX
...
NVIDIA GeForce 910M
Intel HD Graphics 520
AMD Radeon R5 M230
Intel Iris Graphics 5100
AMD Radeon R6 M340DX
AMD Radeon R5 M330
AMD Radeon R8 M365DX
Intel HD Graphics 530
AMD Radeon RX Vega 6 (Ryzen 2000/3000)
Intel HD Graphics 5600
AMD Radeon R7 M260
...
NVIDIA GeForce GTX 980 (Laptop)
max:
NVIDIA Titan RTX
...
AMD Radeon HD 8650G + HD 8570M Dual Graphics
Intel HD Graphics 510
AMD Radeon R7 (Carrizo)
AMD Radeon R6 M255DX
AMD Radeon HD 8550G
AMD Radeon HD 8650G
AMD Radeon R5 M230
AMD Radeon R6 M340DX
AMD Radeon R5 M240
AMD Radeon R5 M330
AMD Radeon R5 (Bristol Ridge)
Intel HD Graphics 5600
NVIDIA GeForce 910M
...
NVIDIA GeForce GTX 980 (Laptop)
max:
NVIDIA Titan RTX
...
AMD Radeon R7 (Carrizo)
AMD Radeon HD 8650G
Intel Iris Graphics 5100
Intel HD Graphics 530
Intel HD Graphics 5600
AMD Radeon R5 M330
AMD Radeon R6 M340DX
AMD Radeon R7 M260
AMD Radeon R5 (Bristol Ridge)
AMD Radeon R7 M360
NVIDIA GeForce 910M
...
max:
NVIDIA Titan RTX
» With all tested laptops playable in detail settings low.
...
AMD Radeon R9 M280X
Intel HD Graphics 5000
NVIDIA GeForce GT 640M
Intel Iris Graphics 5100
NVIDIA GeForce GT 720M
NVIDIA GeForce GT 735M
NVIDIA GeForce GT 750M
NVIDIA GeForce GT 740M
AMD Radeon R7 M260X
NVIDIA GeForce 940M
...
max:
AMD Radeon R7 370
...
AMD Radeon HD 8650G + HD 8670M Dual Graphics
AMD Radeon R7 M360
NVIDIA GeForce GT 740M
NVIDIA GeForce GT 640M
NVIDIA GeForce GT 735M
AMD Radeon R9 M280X
NVIDIA GeForce GT 750M
NVIDIA GeForce 845M
AMD Radeon HD 8850M
...
max:
AMD Radeon R7 370
...
Intel Iris Graphics 5100
AMD Radeon R8 M365DX
AMD Radeon R6 M255DX
NVIDIA GeForce GT 640M
NVIDIA GeForce GT 740M
AMD Radeon R7 M275DX
NVIDIA GeForce GT 735M
NVIDIA GeForce 845M
AMD Radeon R7 M260X
NVIDIA GeForce GT 750M
...
» With all tested laptops playable in detail settings med..
...
Intel Iris Graphics 5100
NVIDIA GeForce GT 720M
AMD FirePro M4100
AMD Radeon HD 8550G + HD 8670M Dual Graphics
AMD Radeon HD 8550G + HD 8750M Dual Graphics
NVIDIA Quadro K2100M
NVIDIA GeForce GT 640M
AMD Radeon R5 M230
NVIDIA Quadro K1100M
NVIDIA GeForce GT 735M
Intel Iris Pro Graphics 5200
...
NVIDIA GeForce GTX 1050 Max-Q
» The benchmarks indicate that the game is not playable in the tested settings.
...
AMD Radeon R6 M255DX
NVIDIA Quadro K610M
AMD Radeon R6 (Carrizo)
AMD Radeon R7 (Carrizo)
AMD Radeon HD 8650G
NVIDIA GeForce GT 720M
AMD Radeon HD 8550G + HD 8670M Dual Graphics
Intel Iris Graphics 5100
Intel HD Graphics 520
AMD Radeon R7 M260
AMD Radeon HD 8550G + HD 8750M Dual Graphics
AMD Radeon HD 8650G + HD 8670M Dual Graphics
...
...
AMD Radeon R5 M230
AMD Radeon R7 M260
NVIDIA Quadro K610M
NVIDIA GeForce GT 720M
AMD Radeon HD 8450G
AMD Radeon R6 M255DX
Intel Iris Graphics 5100
AMD Radeon R7 (Carrizo)
AMD Radeon HD 8650G
AMD Radeon R5 (Bristol Ridge)
AMD Radeon HD 8550G + HD 8670M Dual Graphics
AMD Radeon HD 8650G + HD 8670M Dual Graphics
AMD Radeon R6 (Carrizo)
NVIDIA GeForce GT 735M
...
...
AMD Radeon R6 (Carrizo)
AMD Radeon R6 M255DX
AMD Radeon R5 (Bristol Ridge)
AMD Radeon R7 (Carrizo)
NVIDIA GeForce GT 735M
Intel HD Graphics 515
Intel HD Graphics 520
NVIDIA GeForce GT 640M
NVIDIA GeForce GT 740M
...
...
NVIDIA GeForce GT 740M
Intel HD Graphics 520
AMD Radeon R5 (Bristol Ridge)
AMD Radeon R7 M260X
Intel HD Graphics 530
Intel HD Graphics 5600
AMD Radeon R6 M255DX
AMD FirePro M4100
...
max:
» The benchmarks indicate that the game is not playable in the tested settings.
...
Intel Iris Graphics 5100
Intel HD Graphics 515
Intel HD Graphics 510
Intel UHD Graphics 615
AMD Radeon R5 M320
AMD Radeon HD 8650G + HD 8570M Dual Graphics
AMD Radeon HD 8550G + HD 8670M Dual Graphics
Intel HD Graphics 520
AMD Radeon R5 M335
AMD Radeon R6 M340DX
...
Intel HD Graphics (Bay Trail)
...
AMD Radeon R5 M330
NVIDIA Quadro K610M
AMD Radeon R5 M240
AMD Radeon R5 M320
Intel HD Graphics 530
AMD Radeon HD 8650G + HD 8670M Dual Graphics
Intel UHD Graphics 617
AMD Radeon R5 (Carrizo)
NVIDIA GeForce GT 720M
NVIDIA GeForce 910M
Intel HD Graphics 5600
AMD Radeon R6 M255DX
...
Intel HD Graphics (Bay Trail)
...
AMD Radeon R5 (Carrizo)
AMD Radeon R6 (Carrizo)
AMD Radeon R5 M330
NVIDIA Quadro K610M
AMD Radeon HD 8650G
AMD Radeon R5 M320
Intel HD Graphics 530
AMD Radeon HD 8650G + HD 8670M Dual Graphics
NVIDIA GeForce GT 720M
Intel HD Graphics 5600
Intel UHD Graphics 617
NVIDIA GeForce 910M
AMD Radeon R7 (Carrizo)
...
Intel HD Graphics (Bay Trail)
...
Intel UHD Graphics 615
Intel HD Graphics 520
AMD Radeon R5 M230
AMD Radeon HD 8650G + HD 8570M Dual Graphics
Intel HD Graphics 530
NVIDIA GeForce GT 720M
Intel HD Graphics 5600
Intel HD Graphics 5000
AMD Radeon R5 M335
AMD Radeon R7 (Carrizo)
AMD Radeon R6 M340DX
...
max:
» With most tested laptops playable in detail settings low.
...
AMD Radeon R5 M335
AMD Radeon R5 M320
AMD FirePro M4100
AMD Radeon R6 (Carrizo)
AMD Radeon HD 8550G
AMD Radeon R5 M240
NVIDIA GeForce GT 720M
AMD Radeon HD 8650G + HD 8570M Dual Graphics
AMD Radeon HD 8550G + HD 8670M Dual Graphics
AMD Radeon HD 8650G
Intel HD Graphics 520
...
...
AMD Radeon HD 8550G
AMD Radeon R5 (Carrizo)
AMD Radeon R5 M335
Intel Iris Graphics 5100
AMD Radeon R6 (Carrizo)
AMD Radeon R5 M240
NVIDIA Quadro K610M
AMD Radeon R7 (Carrizo)
AMD Radeon HD 8550G + HD 8670M Dual Graphics
Intel HD Graphics 520
NVIDIA GeForce GT 720M
AMD Radeon HD 8650G
AMD Radeon HD 8650G + HD 8570M Dual Graphics
...
...
AMD Radeon R5 M240
AMD Radeon HD 8650G
AMD Radeon HD 8550G + HD 8670M Dual Graphics
AMD Radeon R7 M260
AMD Radeon R5 M335
NVIDIA GeForce GT 735M
AMD Radeon R7 (Carrizo)
NVIDIA GeForce GT 740M
...
Intel HD Graphics (Bay Trail)
...
AMD FirePro W4170M
AMD Radeon R7 M260
Intel HD Graphics 5600
NVIDIA GeForce GT 740M
AMD Radeon R7 (Carrizo)
NVIDIA GeForce 920M
AMD Radeon R5 M335
Intel HD Graphics 530
AMD Radeon HD 6620G + HD 7670M Dual Graphics
...
» With all tested laptops playable in detail settings low.
...
AMD Radeon HD 8650G + HD 8670M Dual Graphics
Intel HD Graphics 5000
Intel HD Graphics 520
AMD Radeon HD 8350G
AMD Radeon R7 M260
AMD Radeon RX Vega 6 (Ryzen 2000/3000)
AMD Radeon R5 M230
NVIDIA GeForce GT 720M
AMD Radeon R5 M240
AMD Radeon HD 8450G
AMD Radeon HD 8650G
...
max:
NVIDIA GeForce GTX 1080 (Desktop)
...
Intel HD Graphics 520
AMD Radeon HD 8450G
AMD Radeon R5 M230
Intel Iris Graphics 5100
AMD Radeon HD 8650G
AMD Radeon HD 8550G
AMD Radeon R6 (Carrizo)
AMD Radeon R7 M360
AMD Radeon R7 (Carrizo)
AMD Radeon R7 M340
...
max:
NVIDIA GeForce GTX 1080 (Desktop)
Intel HD Graphics (Braswell)
...
Intel HD Graphics 5000
AMD Radeon R5 M240
AMD Radeon R5 M230
AMD Radeon HD 8550G + HD 8670M Dual Graphics
AMD Radeon HD 8650G + HD 8570M Dual Graphics
Intel HD Graphics 520
AMD Radeon R6 (Carrizo)
AMD Radeon RX Vega 6 (Ryzen 2000/3000)
AMD Radeon R5 (Bristol Ridge)
AMD Radeon R7 M360
Intel HD Graphics 5600
Intel Iris Graphics 5100
...
max:
NVIDIA GeForce GTX 1080 (Desktop)
...
AMD Radeon HD 8650G + HD 8570M Dual Graphics
AMD Radeon R6 (Carrizo)
AMD Radeon R5 M230
AMD Radeon R5 (Bristol Ridge)
Intel Iris Graphics 5100
AMD Radeon R7 (Carrizo)
AMD Radeon R7 M360
Intel HD Graphics 5600
AMD Radeon R8 M365DX
AMD Radeon R7 M340
Intel HD Graphics 530
...
max:
» The benchmarks indicate that the game is not playable in the tested settings.
...
Intel UHD Graphics 615
AMD Radeon HD 8550G + HD 8670M Dual Graphics
NVIDIA GeForce GT 720M
AMD Radeon R5 M335
Apple M1 7-Core GPU
Intel HD Graphics 520
Intel UHD Graphics G1 (Ice Lake 32 EU)
AMD Radeon RX Vega 8 (Ryzen 2000/3000)
AMD Radeon RX Vega 10
AMD Radeon R5 M330
NVIDIA GeForce GT 640M
AMD Radeon HD 8650G + HD 8670M Dual Graphics
Intel Iris Plus Graphics G4 (Ice Lake 48 EU)
...
NVIDIA GeForce GTX 1050 Max-Q
Intel Graphics Media Accelerator (GMA) 4500MHD
...
Intel UHD Graphics Xe G4 48EUs
AMD Radeon R5 M330
Intel HD Graphics 520
AMD Radeon R8 M365DX
Intel Iris Graphics 5100
AMD Radeon HD 8550G + HD 8670M Dual Graphics
Intel UHD Graphics G1 (Ice Lake 32 EU)
AMD Radeon R7 M360
NVIDIA GeForce GT 720M
AMD Radeon RX Vega 6 (Ryzen 2000/3000)
AMD Radeon RX Vega 10
AMD Radeon HD 8650G + HD 8670M Dual Graphics
...
NVIDIA GeForce GTX 1050 Max-Q
Intel Graphics Media Accelerator (GMA) 4500MHD
...
Intel Iris Graphics 5100
Intel UHD Graphics G1 (Ice Lake 32 EU)
AMD Radeon HD 8550G + HD 8670M Dual Graphics
NVIDIA GeForce GT 720M
AMD Radeon RX Vega 10
AMD Radeon HD 8650G + HD 8670M Dual Graphics
AMD Radeon R7 M360
AMD Radeon RX Vega 8 (Ryzen 2000/3000)
AMD Radeon RX Vega 6 (Ryzen 2000/3000)
Intel Iris Plus Graphics G4 (Ice Lake 48 EU)
Apple M1 7-Core GPU
...
NVIDIA GeForce GTX 780M SLI
...
NVIDIA GeForce 910M
Intel UHD Graphics G1 (Ice Lake 32 EU)
Intel Iris Graphics 5100
AMD Radeon HD 8650G + HD 8570M Dual Graphics
AMD Radeon R6 (Carrizo)
AMD Radeon RX Vega 6 (Ryzen 2000/3000)
NVIDIA GeForce GT 735M
AMD Radeon HD 8450G
Intel Iris Plus Graphics G4 (Ice Lake 48 EU)
AMD Radeon HD 8550G
...
NVIDIA GeForce GTX 780M SLI
max:
AMD Radeon RX 480 (Desktop)
» With all tested laptops playable in detail settings high.
...
NVIDIA Quadro K610M
AMD Radeon R7 M360
AMD Radeon R5 M330
NVIDIA Quadro K620M
AMD Radeon HD 8650G
AMD Radeon HD 8550G + HD 8670M Dual Graphics
AMD Radeon HD 8650G + HD 8570M Dual Graphics
Intel HD Graphics 630
AMD Radeon HD 8650G + HD 8670M Dual Graphics
Intel UHD Graphics Xe G4 48EUs
...
...
AMD Radeon R7 M360
Intel HD Graphics 520
Intel HD Graphics 630
NVIDIA Quadro K620M
...
Intel HD Graphics (Bay Trail)
...
AMD Radeon R7 M360
AMD Radeon HD 8650G
NVIDIA Quadro K610M
Intel HD Graphics 520
AMD Radeon HD 8650G + HD 8570M Dual Graphics
AMD Radeon R8 M365DX
NVIDIA GeForce 910M
Intel HD Graphics 630
...
Intel HD Graphics (Bay Trail)
...
Intel HD Graphics 630
AMD Radeon HD 8650G + HD 8570M Dual Graphics
AMD Radeon R7 M260
AMD Radeon R7 M360
AMD Radeon R8 M365DX
NVIDIA GeForce 910M
AMD Radeon R7 M270
...
NVIDIA GeForce GTX 1080 Mobile
max:
» With all tested laptops playable in detail settings high.
...
Intel HD Graphics 4400
AMD Radeon R4 (Stoney Ridge)
AMD Radeon HD 8450G + Radeon HD 8570M Dual Graphics
AMD Radeon HD 8350G
Intel HD Graphics 5000
NVIDIA Quadro K610M
AMD Radeon R5 (Bristol Ridge)
...
max:
AMD Radeon HD 7870
...
Intel Iris Graphics 5100
NVIDIA Quadro K1100M
AMD Radeon HD 6620G + HD 7670M Dual Graphics
NVIDIA GeForce GT 735M
AMD Radeon R7 M360
AMD Radeon R7 M260
AMD Radeon HD 7640G + HD 7610M Dual Graphics
...
NVIDIA GeForce GTX 780M SLI
...
AMD Radeon HD 8650G + HD 8570M Dual Graphics
AMD Radeon R5 M240
NVIDIA GeForce GT 720M
Intel Iris Graphics 5100
NVIDIA GeForce GT 735M
AMD Radeon R7 M360
AMD Radeon R7 M260
AMD Radeon HD 6620G + HD 7670M Dual Graphics
...
NVIDIA GeForce GTX 780M SLI
Intel HD Graphics (Bay Trail)
...
Intel Iris Graphics 5100
NVIDIA Quadro K1100M
AMD Radeon R7 M360
AMD Radeon R7 M270
NVIDIA GeForce GT 640M
...
» With all tested laptops playable in detail settings med..
...
Intel Iris Graphics 5100
AMD Radeon HD 8650G + HD 8670M Dual Graphics
AMD Radeon HD 6620G + HD 7670M Dual Graphics
Intel UHD Graphics 615
AMD Radeon R5 M330
AMD Radeon HD 8550G
NVIDIA GeForce GT 735M
NVIDIA GeForce GT 720M
...
...
Intel HD Graphics 520
AMD Radeon HD 8550G + HD 8670M Dual Graphics
Intel UHD Graphics 615
AMD Radeon HD 8650G + HD 8570M Dual Graphics
AMD Radeon HD 8350G
AMD Radeon R7 (Carrizo)
AMD Radeon R5 M230
AMD Radeon R5 (Bristol Ridge)
AMD Radeon HD 8650G + HD 8670M Dual Graphics
AMD Radeon R6 M255DX
...
...
Intel HD Graphics 520
AMD Radeon HD 8550G + HD 8670M Dual Graphics
AMD Radeon HD 8350G
AMD Radeon R7 (Carrizo)
AMD Radeon R5 M230
...
...
Intel HD Graphics 520
Intel Iris Graphics 5100
Intel HD Graphics 515
AMD Radeon HD 8350G
AMD Radeon R7 (Carrizo)
...
NVIDIA GeForce GTX 780M SLI
» With all tested laptops playable in detail settings low.
For more games that might be playable and a list of all games and graphics cards visit our Gaming List
v1.26
log 19. 02:04:06
#0 no ids found in url (should be separated by "_") +0s ... 0s
#1 not redirecting to Ajax server +0s ... 0s
#2 did not recreate cache, as it is less than 5 days old! Created at Tue, 16 Apr 2024 05:39:00 +0200 +0.001s ... 0.001s
#3 no comparison url found in template nbc.compare_page_1 needed +0.078s ... 0.079s
#4 no comparison url found in template nbc.compare_page_1 needed +0s ... 0.079s
#5 no comparison url found in template nbc.compare_page_1 needed +0s ... 0.079s
#6 composed specs +0s ... 0.079s
#7 did output specs +0s ... 0.079s
#8 start showIntegratedCPUs +0s ... 0.079s
#9 getting avg benchmarks for device 5945 +0.039s ... 0.118s
#10 got single benchmarks 5945 +0.018s ... 0.136s
#11 got avg benchmarks for devices +0s ... 0.136s
#12 min, max, avg, median took s +0.846s ... 0.982s
#13 before gaming benchmark output +0s ... 0.982s
#14 Got 225 rows for game benchmarks. +0.019s ... 1.001s
#15 composed SQL query for gamebenchmarks +0s ... 1.001s
#16 got data and put it in $dataArray +0.043s ... 1.043s
#17 benchmarks composed for output. +1.815s ... 2.859s
#18 no comparison url found in template nbc.compare_page_1 needed +0.006s ... 2.864s
#19 return log +0s ... 2.864s
Please share our article, every link counts!
» Comparison of GPUs
» Benchmark List
» Notebook Gaming List
Class 1 GeForce RTX 2080 Super Mobile
Class 2 M1 Max 32-Core GPU *
GeForce RTX 2070 Super Mobile
M1 Max 24-Core GPU *
Quadro RTX 5000 Max-Q
Radeon RX 5700M *
GeForce GTX 1080 Mobile
Quadro RTX 4000 (Laptop)
M1 Pro 16-Core GPU *
Radeon PRO W6600M *
GeForce RTX 2070 Super Max-Q
Quadro RTX 4000 Max-Q *
M1 Pro 14-Core GPU *
Quadro P5200
Quadro RTX 3000 Max-Q *
Quadro P4200
Quadro P5000 Max-Q *
GeForce GTX 980 (Laptop)
Quadro P4000
Quadro P4000 Max-Q
Quadro P3200
Radeon RX 580X (Laptop) *
Radeon RX 580 (Laptop)
Radeon Pro 5300M
Radeon RX 5300M
Quadro P3000 Max-Q *
Quadro T2000 Max-Q *
Radeon Pro WX 7100 *
Radeon RX 570X (Laptop) *
Radeon RX 570 (Laptop) *
Radeon RX 470 (Laptop) *
Quadro T1000 Max-Q *
Class 3 Vega M GH
Quadro M5000M
GeForce GTX 1050 Ti Mobile
Radeon 680M
Quadro P2000
Quadro P2000 Max-Q
Quadro M4000M
T500 Laptop GPU *
Radeon R9 M395X
GeForce GTX 1050 Ti Max-Q *
Radeon Pro Vega 16
WX Vega M GL
Radeon R9 M485X
Quadro M3000M
FirePro W7170M
Radeon R9 M395
GeForce GTX 1050 Max-Q *
Radeon 660M
Radeon Pro WX 4150 *
Radeon RX 560X (Laptop)
Radeon RX 560 (Laptop)
Radeon RX 460 (Laptop)
Quadro P1000
Radeon R9 M390
Xe MAX
Radeon Pro 560X
Radeon Pro 560
Radeon Pro 460
Radeon Pro WX 4130 *
GeForce GTX 960M
Quadro P620 *
Radeon RX 550X (Laptop)
Radeon Pro WX 3200 *
Radeon Pro 555X
Radeon Pro 555
Radeon Pro 455
Quadro P600
Quadro M2000M
Radeon RX 540X *
Radeon Pro WX 2100 *
Radeon Pro WX 3100 *
GeForce GTX 950M
Radeon Pro 450
Radeon 630
Radeon 540X *
Radeon R9 M385X
Quadro P520
Quadro M1000M
GeForce 945M
Quadro P500 *
Iris Plus Graphics G7 (Ice Lake 64 EU) *
Vega 10 *
Iris Pro Graphics 580
FirePro W5170M *
Radeon R9 M370X
Vega 9
FirePro W5130M
UHD Graphics Xe G4 48EUs *
UHD Graphics 32EUs
UHD Graphics Xe 32EUs (Tiger Lake-H) *
UHD Graphics 750
Vega 7
Radeon R7 M465
Iris Pro Graphics 6200
Vega 8
GeForce 940M
Iris Plus Graphics G4 (Ice Lake 48 EU)
Quadro M600M
FirePro W4190M
Radeon R9 M375
Radeon R7 M445
Iris Plus Graphics 650
Iris Graphics 550
Radeon 625
Vega 6 *
Iris Plus Graphics 640
Iris Graphics 540
UHD Graphics 24EUs (Alder Lake-N) *
Radeon R7 M360
GeForce 920M
Radeon 620
Radeon R7 M340
Radeon 610
Radeon 610M *
Vega 6 *
UHD Graphics G1 (Ice Lake 32 EU)
UHD Graphics Xe 16EUs (Tiger Lake-H) *
HD Graphics 530
Radeon R5 (Bristol Ridge)
Adreno 690 *
Adreno 685 *
Adreno 680 *
Radeon R5 M330
GeForce 910M
HD Graphics 520
Class 4 UHD Graphics 730
Radeon R5 M320 *
Radeon R5 M315 *
Radeon R5 M420 *
Vega 2 *
UHD Graphics 617
UHD Graphics 615
HD Graphics 515
UHD Graphics 610
HD Graphics 510
UHD Graphics 605
Radeon R4 (Stoney Ridge)
Radeon R2 (Stoney Ridge)
HD Graphics (Broadwell)
UHD Graphics 600
HD Graphics (Braswell)
Class 5 * Approximate position of the graphics adapter
Klaus Hinum (Update: 2016-01-26)
 Deutsch
 English
 Español
 Français
 Italiano
 Nederlands
 Polski
 Português
 Русский
 Türkçe
 Svenska
 Chinese
 Magyar