Intel HD Graphics 615
英特尔HD Graphics 615(GT2)是一块低端集成显卡,它可以在很多Kaby Lake架构的Y系列处理器中找到。而“GT2”版本提供24个执行单元(EU),主频最高可达1050 MHz的(取决于CPU型号)。由于缺少独立显存或eDRAM缓存,HD 615需要访问主内存(2×64位 DDR3L/ LPDDR3)。
HD 615的3D性能取决于CPU型号和笔记本电脑散热/ TDP设置。此外,所使用的主内存(单通道,DDR3(L),容量)也都会影响性能。平均来说,HD graphics 615应该比上一代的HD Graphics 515快大约20%至30%。因此,它甚至可能达到HD Graphics 520的性能水平。因此,一些要求较低的游戏可以流畅运行。
改进后的视频引擎现在可以更加高效地硬件解码H.265 / HEVC Main10和10位色彩。此外,谷歌VP9编解码器也将可以通过硬件解码。它的第一批型号不支持HDCP 2.2,因此不支持Netflix 4K。2017年的新批次应该会增加这项支持。
HD Graphics 615搭配于一些4.5瓦TDP(笔记本电脑生产商可以自行定制)Y系列处理器中,因此它将适合于非常轻薄的被动散热式二合一笔记本电脑或平板电脑中。
Gen. 9.5 Series Iris Plus Graphics 655 48 @ 0.3 - 1.2 GHz Iris Plus Graphics 650 48 @ 0.3 - 1.1 GHz 64/128 Bit Iris Plus Graphics 645 48 @ 0.3 - 1.15 GHz Iris Plus Graphics 640 48 @ 0.3 - 1.05 GHz 64/128 Bit UHD Graphics 630 24 @ 0.3 - 1.15 GHz 64/128 Bit UHD Graphics P630 24 @ 0.3 - 1.2 GHz 64/128 Bit HD Graphics 630 24 @ 0.3 - 1.15 GHz 64/128 Bit HD Graphics P630 24 64/128 Bit UHD Graphics 620 24 @ 0.3 - 1.15 GHz HD Graphics 620 24 @ 0.3 - 1.05 GHz 64/128 Bit UHD Graphics 617 24 @ 0.3 - 1.15 GHz 64/128 Bit UHD Graphics 615 24 @ 0.3 - 1 GHz 64/128 Bit HD Graphics 615 24 @ 0.3 - 1.05 GHz 64/128 Bit
Codename Kaby-Lake GT2 Architecture Gen. 9 Kaby Lake Pipelines 24 - unified Core Speed 300 - 1050 (Boost) MHz Memory Bus Width 64/128 Bit Memory Type DDR3L/LPDDR3 Shared Memory yes API DirectX 12_1, OpenGL 4.4 technology 14 nm Features QuickSync Date of Announcement 30.08.2016
Benchmarks Performance Rating - 3DMark 11 + Fire Strike + Time Spy
0.4 pt (1%)
...
AMD Radeon HD 8550G
Intel HD Graphics 520
Intel UHD Graphics 615
NVIDIA GeForce GT 720M
AMD Radeon HD 8650G + HD 8670M Dual Graphics
AMD FirePro M4100
AMD Radeon HD 8650G + HD 8570M Dual Graphics
Intel Iris Graphics 5100
AMD Radeon HD 8650G
AMD Radeon R6 (Carrizo)
AMD Radeon HD 8550G + HD 8670M Dual Graphics
...
max:
3DMark - 3DMark Time Spy Score
min: 180 avg: 277.2 median: 296.5 (1%) max: 327 Points
...
Intel UHD Graphics 600
Intel UHD Graphics 605
Intel UHD Graphics 610
AMD Radeon R4 (Stoney Ridge)
Intel HD Graphics 530
Intel UHD Graphics 615
Intel HD Graphics 520
AMD Radeon R6 (Carrizo)
Intel UHD Graphics 617
NVIDIA GeForce 920M
...
max:
3DMark - 3DMark Time Spy Graphics
min: 157 avg: 243.7 median: 261 (1%) max: 288 Points
...
Intel UHD Graphics 600
Intel UHD Graphics 605
Intel UHD Graphics 610
AMD Radeon R4 (Stoney Ridge)
Intel HD Graphics 530
Intel UHD Graphics 615
Intel HD Graphics 520
AMD Radeon R6 (Carrizo)
Intel UHD Graphics 617
...
max:
3DMark - 3DMark Ice Storm Unlimited Graphics
min: 55271 avg: 69892 median: 70743 (8%) max: 79719 Points
...
NVIDIA GeForce GT 720M
Intel UHD Graphics 615
AMD Radeon R7 (Carrizo)
Intel UHD Graphics Xe 16EUs (Tiger Lake-H)
Intel HD Graphics 5000
AMD Radeon R8 M365DX
AMD Radeon HD 8550G
AMD Radeon R7 M340
Intel HD Graphics 520
AMD Radeon R5 M335
Intel Iris Graphics 5100
AMD Radeon HD 8650G
NVIDIA Quadro T2000 Max-Q
Intel UHD Graphics 617
...
max:
3DMark - 3DMark Ice Storm Extreme Graphics
min: 28302 avg: 34366 median: 33200.5 (4%) max: 42163 Points
Intel HD Graphics (Bay Trail)
...
AMD Radeon R7 M260X
AMD Radeon R5 (Carrizo)
AMD Radeon HD 8450G
AMD Radeon R6 (Carrizo)
NVIDIA Quadro P2000 Max-Q
NVIDIA GeForce 940M
AMD Radeon R5 (Bristol Ridge)
Intel HD Graphics 5000
Intel HD Graphics 530
Intel HD Graphics 520
...
max:
3DMark - 3DMark Cloud Gate Score
min: 4050 avg: 4904 median: 4893 (5%) max: 5828 Points
Intel Graphics Media Accelerator (GMA) 4500MHD
...
Intel Iris Graphics 5100
AMD Radeon R7 M270
Intel UHD Graphics 617
AMD Radeon R6 M340DX
AMD Radeon HD 8550G + HD 8750M Dual Graphics
AMD Radeon R5 (Bristol Ridge)
AMD FirePro M4100
NVIDIA GeForce 920M
AMD Radeon R7 M340
...
max:
3DMark - 3DMark Cloud Gate Graphics
min: 5478 avg: 6502 median: 6387 (2%) max: 7839 Points
Intel Graphics Media Accelerator (GMA) 4500MHD
...
Intel UHD Graphics 615
AMD Radeon HD 8550G + HD 8670M Dual Graphics
AMD Radeon R7 M270
AMD Radeon HD 8650G + HD 8670M Dual Graphics
AMD Radeon HD 8650G + HD 8570M Dual Graphics
AMD Radeon R7 (Carrizo)
Intel Iris Graphics 5100
NVIDIA GeForce 910M
Intel HD Graphics 520
NVIDIA GeForce GT 735M
AMD Radeon R7 M340
AMD Radeon R6 M255DX
Intel UHD Graphics 617
...
max:
3DMark - 3DMark Fire Strike Standard Score
min: 582 avg: 750 median: 762 (1%) max: 861 Points
...
AMD Radeon HD 8550G + HD 8750M Dual Graphics
AMD Radeon R5 M230
Intel UHD Graphics 615
AMD Radeon HD 8550G
Intel HD Graphics 520
NVIDIA GeForce GT 720M
Intel Iris Graphics 5100
AMD Radeon HD 8650G
AMD FirePro M4100
AMD Radeon R5 M335
AMD Radeon R5 M330
...
max:
3DMark - 3DMark Fire Strike Standard Graphics
min: 647 avg: 830 median: 853 (1%) max: 965 Points
...
AMD Radeon HD 6620G + HD 7670M Dual Graphics
AMD Radeon HD 8550G
Intel HD Graphics 520
NVIDIA GeForce GT 720M
Intel UHD Graphics 615
Intel Iris Graphics 5100
AMD Radeon HD 8650G + HD 8670M Dual Graphics
AMD FirePro M4100
AMD Radeon HD 8650G + HD 8570M Dual Graphics
AMD Radeon HD 8650G
AMD Radeon HD 8550G + HD 8670M Dual Graphics
...
max:
3DMark - 3DMark Ice Storm Graphics
min: 45589 avg: 54672 median: 50760 (6%) max: 69035 Points
Intel Graphics Media Accelerator (GMA) 4500MHD
...
AMD Radeon Pro WX Vega M GL
NVIDIA GeForce GT 720M
AMD Radeon HD 7640G + HD 7610M Dual Graphics
NVIDIA Maxwell GPU Surface Book
AMD Radeon R8 M365DX
AMD Radeon RX 550X (Laptop)
AMD Radeon HD 8850M
AMD Radeon HD 8650G
Intel HD Graphics 520
AMD Radeon HD 8550G + HD 8670M Dual Graphics
AMD Radeon HD 6620G + HD 7670M Dual Graphics
...
max:
3DMark - 3DMark Night Raid
2461 Points (2%)
...
Intel UHD Graphics 605
Intel UHD Graphics 600
Intel UHD Graphics 610
Intel UHD Graphics 615
AMD Radeon RX Vega 2
Intel UHD Graphics Xe 750 32EUs (Rocket Lake)
Intel UHD Graphics 617
...
max:
3DMark - 3DMark Night Raid Graphics Score
2800 Points (1%)
Intel UHD Graphics 605
Intel UHD Graphics 610
AMD Radeon RX Vega 2
Intel UHD Graphics 615
Intel UHD Graphics Xe 750 32EUs (Rocket Lake)
Intel UHD Graphics 617
...
max:
3DMark 11 - 3DM11 Performance Score
min: 1141 avg: 1350 median: 1362.5 (2%) max: 1514 Points
...
AMD Radeon HD 8550G
NVIDIA Quadro K610M
AMD Radeon R5 M230
NVIDIA GeForce 910M
AMD Radeon HD 8650G
Intel HD Graphics 520
...
max:
3DMark 11 - 3DM11 Performance GPU
min: 1032 avg: 1233 median: 1242.5 (1%) max: 1384 Points
...
NVIDIA Quadro K610M
Intel UHD Graphics 615
AMD Radeon HD 8550G
AMD Radeon R5 M230
Intel HD Graphics 520
...
max:
3DMark Vantage + 3DMark Vantage - 3DM Vant. Perf. total
min: 4081 avg: 4102 median: 4102 (1%) max: 4123 Points
...
NVIDIA GeForce GTS 160M
Intel UHD Graphics 610
NVIDIA GeForce 9800M GT
NVIDIA GeForce 9800M GTS
AMD Radeon HD 6570M
AMD Radeon HD 8550G
Intel HD Graphics 5000
NVIDIA GeForce 910M
...
max:
NVIDIA T600
3DM Vant. Perf. GPU no PhysX + 3DMark Vantage - 3DM Vant. Perf. GPU no PhysX
min: 3514 avg: 3538 median: 3537.5 (2%) max: 3561 Points
...
AMD Radeon HD 8450G + Radeon HD 8570M Dual Graphics
AMD Radeon HD 6570M
NVIDIA GeForce 8800M GTX
NVIDIA GeForce GTS 160M
Intel UHD Graphics 610
ATI Mobility Radeon HD 3870
NVIDIA Quadro K610M
Intel HD Graphics 5000
NVIDIA GeForce 9800M GTS
...
max:
3DMark 2001SE - 3DMark 2001 - Standard
19381 Points (20%)
...
ATI Mobility Radeon X1700
ATI Mobility Radeon X1800
NVIDIA GeForce Go 7600
ATI Mobility Radeon X800
NVIDIA GeForce Go 7800
NVIDIA GeForce 9650M GS
Intel HD Graphics 515
Intel HD Graphics 4400
...
max:
3DMark 03 - 3DMark 03 - Standard
16620 Points (9%)
VIA S3 Graphics ProSavage8
...
NVIDIA GeForce 9650M GS
NVIDIA GeForce GT 230M
NVIDIA Quadro FX 1600M
NVIDIA GeForce GT 130M
Intel HD Graphics 530
NVIDIA Quadro FX 770M
...
NVIDIA GeForce GTX 1080 Mobile
3DMark 05 - 3DMark 05 - Standard
8649 Points (9%)
Intel Graphics Media Accelerator (GMA) 500
...
ATI Mobility Radeon HD 3670
NVIDIA GeForce 9650M GT
NVIDIA GeForce Go 7900 GTX
NVIDIA Quadro FX 2500M
ATI Mobility FireGL V5700
Intel HD Graphics 4400
ATI Mobility Radeon HD 2600 XT
ATI Mobility Radeon HD 3850
NVIDIA GeForce 9600M GS
AMD Radeon R4 (Stoney Ridge)
Intel UHD Graphics Xe 750 32EUs (Rocket Lake)
...
max:
3DMark 06 3DMark 06 - Standard 1280x1024 +
min: 6299 avg: 7294 median: 7399 (10%) max: 7991 Points
...
AMD Radeon HD 8650G + HD 8570M Dual Graphics
AMD Radeon HD 6620G + HD 7670M Dual Graphics
ATI Mobility Radeon HD 4830
Intel HD Graphics 510
AMD Radeon HD 8550G
NVIDIA GeForce Go 7950 GTX SLI
...
max:
3DMark 06 - Standard 1280x768 +
6524 Points (9%)
...
NVIDIA GeForce GT 120M
NVIDIA GeForce GT 130M
AMD Radeon R5 M330
NVIDIA GeForce GT 230M
NVIDIA GeForce GT 240M
ATI Mobility Radeon HD 4650
ATI Mobility Radeon HD 4670
...
Unigine Heaven 2.1 - Heaven 2.1 high
17.4 fps (3%)
...
Intel HD Graphics 515
AMD Radeon R7 M270
NVIDIA GeForce 910M
AMD Radeon R5 M240
...
Cinebench R10 Cinebench R10 Shading (32bit) + Cinebench R10 - Cinebench R10 Shading (32bit)
min: 5363 avg: 6543 median: 6470 (5%) max: 7323 points
Intel Graphics Media Accelerator (GMA) 500
...
AMD Radeon R7 M360
AMD Radeon R9 M375
NVIDIA GeForce GT 755M
AMD FirePro M4100
AMD Radeon R5 M330
NVIDIA GeForce GTX 1050 Ti Mobile
NVIDIA GeForce GT 750M
...
Cinebench R11.5 Cinebench R11.5 OpenGL 64 Bit + Cinebench R11.5 - Cinebench R11.5 OpenGL 64 Bit
min: 23.45 avg: 28.6 median: 27.8 (10%) max: 32.97 fps
Intel Graphics Media Accelerator (GMA) 4500MHD
...
AMD Radeon HD 8650G
NVIDIA GeForce GTX 260M
NVIDIA Quadro K610M
AMD Radeon HD 8550G
Intel HD Graphics 520
NVIDIA Quadro FX 3700M
AMD Radeon R7 M275DX
AMD Radeon HD 8650G + HD 8670M Dual Graphics
...
max:
Cinebench R15 + Cinebench R15 - Cinebench R15 OpenGL 64 Bit
min: 24.79 avg: 33.1 median: 35 (2%) max: 37.62 fps
Intel Graphics Media Accelerator (GMA) 4500MHD
...
AMD Radeon HD 8650G
AMD Radeon HD 8650G + HD 8670M Dual Graphics
AMD Radeon R8 M365DX
Intel UHD Graphics 615
AMD Radeon R7 M275DX
AMD Radeon R7 M340
AMD Radeon R7 M360
AMD Radeon R7 M260
NVIDIA Maxwell GPU Surface Book
...
Cinebench R15 OpenGL Ref. Match 64 Bit + Cinebench R15 - Cinebench R15 OpenGL Ref. Match 64 Bit
min: 97.7 avg: 97.9 median: 97.8 (98%) max: 99.3 %
...
Intel HD Graphics 520
Intel HD Graphics 530
Intel HD Graphics 630
Intel UHD Graphics Xe 16EUs (Tiger Lake-H)
Intel UHD Graphics G1 (Ice Lake 32 EU)
AMD Radeon 610M
AMD Radeon 660M
Intel Iris Plus Graphics G7 (Ice Lake 64 EU)
Intel Iris Pro Graphics 580
...
GFXBench 3.1 - GFXBench Manhattan ES 3.1 Offscreen
42.7 fps (1%)
Intel HD Graphics (Bay Trail)
...
AMD Radeon R7 M340
NVIDIA GeForce 910M
NVIDIA GeForce 920M
AMD Radeon R7 M270
Intel UHD Graphics Xe 16EUs (Tiger Lake-H)
AMD Radeon RX Vega 10
AMD Radeon RX Vega 8 (Ryzen 2000/3000)
Intel HD Graphics 630
Intel HD Graphics 510
AMD Radeon RX Vega 6 (Ryzen 4000/5000)
...
GFXBench (DX / GLBenchmark) 2.7 + GFXBench (DX / GLBenchmark) 2.7 - GFXBench T-Rex HD Offscreen C24Z16
76.3 fps (1%)
Intel HD Graphics (Bay Trail)
...
Intel UHD Graphics 610
Intel HD Graphics 5000
AMD Radeon R6 M340DX
AMD Radeon R5 M335
Intel UHD Graphics 615
Intel HD Graphics 515
AMD Radeon R6 M255DX
NVIDIA GeForce 910M
Intel Iris Graphics 5100
AMD Radeon HD 8550G
AMD Radeon R6 (Carrizo)
...
Basemark ES 2.0 - Basemark ES 2.0
59.8 fps (99%)
Intel HD Graphics (Bay Trail)
max:
PowerVR G6200
Basemark X 1.1 - Basemark X 1.1 High Quality
33662 Points (76%)
Intel HD Graphics (Bay Trail)
max:
ARM Mali-G71 MP20
Basemark X 1.1 - Basemark X 1.1 Medium Quality
42892 Points (95%)
Intel HD Graphics (Bay Trail)
max:
Basemark GPU 1.2 - Basemark GPU 1.2 Vulkan Official Medium Offscreen 1080
38.3 fps (0%)
Intel Iris Graphics 5100
Intel UHD Graphics 605
Intel UHD Graphics 610
Intel UHD Graphics Xe 750 32EUs (Rocket Lake)
Intel UHD Graphics Xe 16EUs (Tiger Lake-H)
Intel Iris Graphics 550
Intel UHD Graphics 24EUs (Alder Lake-N)
Intel UHD Graphics Xe G4 48EUs
AMD Radeon RX Vega 6 (Ryzen 4000/5000)
Intel Iris Plus Graphics G7 (Ice Lake 64 EU)
Intel UHD Graphics Xe 32EUs (Tiger Lake-H)
...
max:
Basemark GPU 1.2 - Basemark GPU 1.2 Vulkan Official High Offscreen 2160
3.4 fps (1%)
Intel UHD Graphics 605
Intel UHD Graphics Xe 750 32EUs (Rocket Lake)
Intel UHD Graphics Xe G4 48EUs
...
LuxMark v2.0 64Bit - LuxMark v2.0 Room GPU
min: 145 avg: 181 median: 185 (1%) max: 213 Samples/s
...
AMD Radeon R7 M260
Intel HD Graphics 510
AMD Radeon R7 M360
AMD Radeon R5 (Bristol Ridge)
AMD Radeon HD 8610G
AMD Radeon HD 8650G
Intel HD Graphics 515
AMD FirePro M4100
Intel HD Graphics 5000
Intel HD Graphics 520
AMD Radeon HD 8550G + HD 8750M Dual Graphics
Intel UHD Graphics 615
...
max:
4x NVIDIA RTX A6000
LuxMark v2.0 64Bit - LuxMark v2.0 Sala GPU
min: 281 avg: 365.3 median: 369 (1%) max: 446 Samples/s
...
AMD Radeon R5 (Bristol Ridge)
AMD Radeon HD 8610G
NVIDIA GeForce GT 745M
AMD Radeon R7 (Carrizo)
AMD Radeon R7 M260X
AMD Radeon R5 M240
AMD Radeon HD 8550G + HD 8750M Dual Graphics
...
max:
4x NVIDIA RTX A6000
ComputeMark v2.1 - ComputeMark v2.1 Result
min: 447 avg: 654 median: 693 (1%) max: 783 points
...
AMD Radeon HD 7640G + HD 7610M Dual Graphics
AMD Radeon HD 8550G
AMD Radeon HD 8610G
AMD Radeon R4 (Stoney Ridge)
AMD Radeon Pro WX 3200
AMD Radeon R9 M375
Intel HD Graphics 515
NVIDIA GeForce GT 720M
Intel UHD Graphics 24EUs (Alder Lake-N)
AMD Radeon R5 M330
Intel UHD Graphics Xe 16EUs (Tiger Lake-H)
...
max:
PassMark PerformanceTest Mobile V1 - PerformanceTest Mobile V1 2D Graphics Tests
18536 Points (19%)
Intel HD Graphics (Bay Trail)
PassMark PerformanceTest Mobile V1 - PerformanceTest Mobile V1 3D Graphics Tests
2667 Points (5%)
Intel HD Graphics (Bay Trail)
max:
Power Consumption - Furmark Stress Test Power Consumption - external Monitor *
17.8 Watt (3%)
Intel UHD Graphics 600
Intel UHD Graphics 605
Intel UHD Graphics (Elkhart Lake 16 EU)
Qualcomm Adreno 680
Intel UHD Graphics 24EUs (Alder Lake-N)
Qualcomm Adreno 690
AMD Radeon HD 8210
AMD Radeon 610M
Intel UHD Graphics 615
Intel UHD Graphics G1 (Ice Lake 32 EU)
...
max:
4x NVIDIA RTX A6000
Clock Speed - GPU Clock Speed Furmark
630 MHz (25%)
Intel UHD Graphics 605
Intel UHD Graphics 600
NVIDIA GeForce GT 640M
NVIDIA Quadro RTX 3000 Max-Q
Intel Iris Plus Graphics 640
...
max:
AMD Radeon RX 6700 XT
- Range of benchmark values for this graphics card
- Average benchmark values for this graphics card
* Smaller numbers mean a higher performance
Game Benchmarks The following benchmarks stem from our benchmarks of review laptops. The performance depends on the used graphics memory, clock rate, processor, system settings, drivers, and operating systems. So the results don't have to be representative for all laptops with this GPU. For detailed information on the benchmark results, click on the fps number.
0 Tooltip Eve V i7: Ø14.5 (4.076-28.6)
AMD Radeon RX Vega 6 (Ryzen 2000/3000)
Intel UHD Graphics Xe 16EUs (Tiger Lake-H)
Intel UHD Graphics G1 (Ice Lake 32 EU)
Intel Iris Graphics 550
AMD Radeon RX Vega 6 (Ryzen 4000/5000)
AMD Radeon RX Vega 10
...
max:
AMD Radeon RX 6700 XT
» The benchmarks indicate that the game is not playable in the tested settings.
NVIDIA GeForce 920M
Intel UHD Graphics 610
Intel UHD Graphics 24EUs (Alder Lake-N)
Intel UHD Graphics Xe 16EUs (Tiger Lake-H)
Intel UHD Graphics G1 (Ice Lake 32 EU)
...
max:
» The benchmarks indicate that the game is not playable in the tested settings.
Intel UHD Graphics 600
Intel UHD Graphics Xe G4 48EUs
...
max:
NVIDIA Titan RTX
Intel UHD Graphics Xe G4 48EUs
Intel UHD Graphics Xe 750 32EUs (Rocket Lake)
AMD Radeon RX Vega 6 (Ryzen 4000/5000)
...
max:
NVIDIA Titan RTX
» With all tested laptops playable in detail settings low.
Additional Benchmarks
Low / Off 1xAF 1920x1080
44.9 [X] Eve-Tech Eve V i7 Intel Core i7-7Y75 1.3GHz
HD Graphics 615
P1:
26.6 fps
Intel UHD Graphics 610
Intel HD Graphics 630
Intel UHD Graphics Xe 16EUs (Tiger Lake-H)
AMD Radeon RX Vega 6 (Ryzen 2000/3000)
Intel Iris Graphics 550
...
max:
» The benchmarks indicate that the game is not playable in the tested settings.
Intel UHD Graphics 600
Intel UHD Graphics 610
Intel UHD Graphics 600
Intel UHD Graphics 610
AMD Radeon RX Vega 7
AMD Radeon RX Vega 6 (Ryzen 4000/5000)
...
AMD Radeon RX Vega 6 (Ryzen 4000/5000)
AMD Radeon RX Vega 7
AMD Radeon Pro 560X
» The benchmarks indicate that the game is not playable in the tested settings.
0 100 200 Tooltip Eve V i7: Ø39.7 (20.123-290)
Intel Iris Graphics 5100
AMD Radeon RX Vega 6 (Ryzen 4000/5000)
AMD Radeon R9 M280X
AMD Radeon RX Vega 7
0 100 200 300 Tooltip Eve V i7: Ø23 (13.286-391)
AMD Radeon RX Vega 6 (Ryzen 4000/5000)
AMD Radeon RX Vega 7
AMD Radeon R9 M280X
» The benchmarks indicate that the game is not playable in the tested settings.
Intel HD Graphics 4400
...
Intel HD Graphics 4400
Intel UHD Graphics 610
AMD Radeon R5 (Bristol Ridge)
NVIDIA GeForce GT 720M
Intel UHD Graphics G1 (Ice Lake 32 EU)
...
NVIDIA GeForce GT 720M
...
NVIDIA GeForce GT 720M
Intel HD Graphics 630
Intel UHD Graphics G1 (Ice Lake 32 EU)
AMD Radeon RX Vega 6 (Ryzen 2000/3000)
Intel Iris Plus Graphics G7 (Ice Lake 64 EU)
Intel Iris Plus Graphics G4 (Ice Lake 48 EU)
...
max:
Intel HD Graphics 4400
AMD Radeon R4 (Stoney Ridge)
Intel UHD Graphics 615
Intel UHD Graphics 610
AMD Radeon R5 (Bristol Ridge)
NVIDIA GeForce GT 720M
NVIDIA Quadro P520
Intel HD Graphics 630
...
max:
NVIDIA GeForce GTX 1660 Super (Desktop)
» The benchmarks indicate that the game is not playable in the tested settings.
Intel Graphics Media Accelerator (GMA) 4500MHD
NVIDIA GeForce G210M
Intel UHD Graphics 600
Intel UHD Graphics 605
AMD Radeon HD 8650G
NVIDIA GeForce 920M
AMD Radeon RX Vega 10
AMD Radeon RX Vega 8 (Ryzen 2000/3000)
NVIDIA GeForce GTX 950M
Intel Iris Graphics 540
Intel Iris Graphics 550
NVIDIA GeForce 940M
AMD Radeon RX Vega M GH
...
max:
Intel UHD Graphics 600
NVIDIA GeForce G210M
Intel UHD Graphics 605
AMD Radeon HD 8650G
AMD Radeon RX Vega 10
NVIDIA GeForce 920M
AMD Radeon RX Vega 8 (Ryzen 2000/3000)
NVIDIA GeForce GTX 950M
Intel Iris Graphics 540
Intel Iris Graphics 550
NVIDIA GeForce 940M
...
max:
Intel UHD Graphics 600
NVIDIA GeForce G210M
Intel UHD Graphics 605
AMD Radeon HD 8650G
AMD Radeon RX Vega 10
NVIDIA GeForce 920M
AMD Radeon RX Vega 8 (Ryzen 2000/3000)
Intel Iris Graphics 540
NVIDIA GeForce GTX 950M
Intel Iris Graphics 550
NVIDIA GeForce 940M
...
max:
Intel UHD Graphics 600
NVIDIA GeForce G210M
Intel UHD Graphics 605
AMD Radeon HD 8650G
AMD Radeon RX Vega 10
NVIDIA GeForce 920M
AMD Radeon RX Vega 8 (Ryzen 2000/3000)
Intel Iris Graphics 540
NVIDIA GeForce GTX 950M
Intel HD Graphics 630
Intel Iris Graphics 550
...
max:
Intel UHD Graphics 605
NVIDIA GeForce GTX 950M
Intel HD Graphics 630
NVIDIA GeForce 940M
AMD Radeon Pro 560X
AMD Radeon RX Vega M GH
max:
» With all tested laptops playable in detail settings ultra.
...
Intel UHD Graphics 615
Intel UHD Graphics 610
Intel UHD Graphics Xe G4 48EUs
NVIDIA GeForce 920M
AMD Radeon RX Vega 8 (Ryzen 2000/3000)
AMD Radeon RX Vega 6 (Ryzen 2000/3000)
Intel UHD Graphics G1 (Ice Lake 32 EU)
...
max:
Intel UHD Graphics 610
NVIDIA GeForce 920M
AMD Radeon RX Vega 6 (Ryzen 2000/3000)
Intel UHD Graphics G1 (Ice Lake 32 EU)
AMD Radeon RX Vega 8 (Ryzen 2000/3000)
Intel HD Graphics 630
...
max:
» The benchmarks indicate that the game is not playable in the tested settings.
Intel UHD Graphics 600
Intel UHD Graphics (Elkhart Lake 16 EU)
Intel UHD Graphics 610
Intel UHD Graphics 24EUs (Alder Lake-N)
Intel UHD Graphics Xe 16EUs (Tiger Lake-H)
Intel UHD Graphics G1 (Ice Lake 32 EU)
Intel Iris Graphics 550
...
NVIDIA GeForce RTX 2080 Super Mobile
max:
Intel UHD Graphics 610
Intel UHD Graphics 24EUs (Alder Lake-N)
Intel UHD Graphics Xe 16EUs (Tiger Lake-H)
Intel UHD Graphics G1 (Ice Lake 32 EU)
...
max:
Intel UHD Graphics 610
Intel UHD Graphics 24EUs (Alder Lake-N)
Intel UHD Graphics G1 (Ice Lake 32 EU)
Intel UHD Graphics Xe 16EUs (Tiger Lake-H)
Intel UHD Graphics Xe 750 32EUs (Rocket Lake)
...
max:
AMD Radeon 610M
AMD Radeon RX Vega 6 (Ryzen 2000/3000)
Intel UHD Graphics Xe 16EUs (Tiger Lake-H)
Intel UHD Graphics 24EUs (Alder Lake-N)
AMD Radeon RX Vega 10
Intel UHD Graphics G1 (Ice Lake 32 EU)
AMD Radeon RX Vega 8 (Ryzen 2000/3000)
Intel UHD Graphics Xe 750 32EUs (Rocket Lake)
Intel UHD Graphics 610
...
max:
» The benchmarks indicate that the game is not playable in the tested settings.
Intel HD Graphics 4400
Intel UHD Graphics 605
AMD Radeon R5 (Bristol Ridge)
NVIDIA GeForce GT 720M
Intel HD Graphics 630
Intel HD Graphics 530
...
AMD Radeon Pro 555
» The benchmarks indicate that the game is not playable in the tested settings.
...
Intel HD Graphics 4400
AMD Radeon R5 (Bristol Ridge)
Intel UHD Graphics 615
Intel UHD Graphics 610
NVIDIA GeForce GT 720M
Intel HD Graphics 530
Intel HD Graphics 630
NVIDIA GeForce 920M
...
max:
» The benchmarks indicate that the game is not playable in the tested settings.
...
Intel UHD Graphics 605
AMD Radeon R4 (Stoney Ridge)
Intel HD Graphics 4400
AMD Radeon R5 (Bristol Ridge)
AMD Radeon HD 8650G
Intel UHD Graphics 615
Intel UHD Graphics Xe G4 48EUs
AMD Radeon RX Vega 6 (Ryzen 2000/3000)
NVIDIA GeForce 920M
Intel Iris Plus Graphics G7 (Ice Lake 64 EU)
...
NVIDIA Quadro RTX 5000 Max-Q
...
Intel UHD Graphics 600
Intel UHD Graphics 605
Intel HD Graphics 4400
AMD Radeon HD 8650G
AMD Radeon R4 (Stoney Ridge)
Intel UHD Graphics 615
AMD Radeon R5 (Bristol Ridge)
NVIDIA GeForce GT 720M
Intel Iris Graphics 540
NVIDIA GeForce 920M
Intel HD Graphics 630
...
NVIDIA Quadro RTX 5000 Max-Q
NVIDIA GeForce 920M
Intel Iris Graphics 540
Intel HD Graphics 630
Intel UHD Graphics G1 (Ice Lake 32 EU)
AMD Radeon RX Vega 6 (Ryzen 2000/3000)
NVIDIA GeForce 940M
...
NVIDIA Quadro RTX 5000 Max-Q
max:
» With all tested laptops playable in detail settings low.
...
AMD Radeon HD 8650G
Intel HD Graphics 520
Intel Iris Graphics 550
Intel UHD Graphics 24EUs (Alder Lake-N)
AMD Radeon RX Vega 6 (Ryzen 2000/3000)
Intel UHD Graphics 617
Intel UHD Graphics Xe 16EUs (Tiger Lake-H)
Intel Iris Graphics 5100
Qualcomm Adreno 690
...
max:
...
Intel HD Graphics (Haswell)
Intel UHD Graphics 615
AMD Radeon R5 (Bristol Ridge)
Intel UHD Graphics 610
Intel HD Graphics 520
Intel UHD Graphics 24EUs (Alder Lake-N)
Intel Iris Plus Graphics G4 (Ice Lake 48 EU)
Intel UHD Graphics G1 (Ice Lake 32 EU)
...
max:
...
AMD Radeon HD 8350G
Intel UHD Graphics 610
Intel UHD Graphics 615
Intel UHD Graphics 24EUs (Alder Lake-N)
Intel Iris Plus Graphics G4 (Ice Lake 48 EU)
Intel Iris Graphics 550
Intel UHD Graphics G1 (Ice Lake 32 EU)
...
max:
Intel HD Graphics 630
NVIDIA GeForce 920M
Intel UHD Graphics Xe 32EUs (Tiger Lake-H)
Intel Iris Graphics 5100
AMD Radeon RX Vega 8 (Ryzen 2000/3000)
...
max:
» The benchmarks indicate that the game is not playable in the tested settings.
AMD Radeon R4 (Stoney Ridge)
AMD Radeon R5 (Bristol Ridge)
Intel HD Graphics 520
Intel HD Graphics 4400
NVIDIA GeForce GT 720M
...
max:
» The benchmarks indicate that the game is not playable in the tested settings.
Intel UHD Graphics 610
Intel HD Graphics 520
AMD Radeon R5 (Bristol Ridge)
NVIDIA GeForce GT 720M
Intel Iris Plus Graphics G4 (Ice Lake 48 EU)
Intel HD Graphics 530
AMD Radeon R9 M375
...
max:
NVIDIA GeForce GTX 1070 SLI (Desktop)
» With all tested laptops playable in detail settings low.
AMD Radeon R5 (Bristol Ridge)
Intel HD Graphics 520
AMD Radeon R9 M280X
NVIDIA GeForce GT 720M
Intel HD Graphics 630
...
max:
» The benchmarks indicate that the game is not playable in the tested settings.
Intel HD Graphics 4400
Intel HD Graphics 520
AMD Radeon R5 (Bristol Ridge)
NVIDIA GeForce GT 720M
...
NVIDIA GeForce GTX 1080 Mobile
max:
NVIDIA GeForce GTX 1060 (Desktop)
» The benchmarks indicate that the game is not playable in the tested settings.
AMD Radeon R5 (Bristol Ridge)
Intel HD Graphics 520
AMD Radeon RX Vega 6 (Ryzen 2000/3000)
NVIDIA GeForce GT 720M
...
NVIDIA GeForce GTX 1080 Mobile
max:
» The benchmarks indicate that the game is not playable in the tested settings.
Intel HD Graphics 4400
Intel HD Graphics 520
NVIDIA GeForce GT 720M
Intel HD Graphics 630
AMD Radeon R5 (Bristol Ridge)
...
max:
» The benchmarks indicate that the game is not playable in the tested settings.
Intel HD Graphics 4400
NVIDIA Quadro P5200
AMD Radeon R5 (Bristol Ridge)
NVIDIA GeForce GT 720M
...
» The benchmarks indicate that the game is not playable in the tested settings.
Intel UHD Graphics 605
Intel HD Graphics 4400
AMD Radeon R4 (Stoney Ridge)
Intel UHD Graphics 615
Intel HD Graphics 520
AMD Radeon R5 (Bristol Ridge)
...
max:
NVIDIA GeForce GTX 1060 (Desktop)
» The benchmarks indicate that the game is not playable in the tested settings.
Intel HD Graphics 4400
Intel HD Graphics 520
AMD FirePro W4190M
NVIDIA GeForce GT 720M
NVIDIA GeForce 920M
...
max:
NVIDIA GeForce GTX 1080 (Desktop)
» The benchmarks indicate that the game is not playable in the tested settings.
...
Intel UHD Graphics 600
Intel HD Graphics 4400
Intel UHD Graphics 610
Intel HD Graphics 630
Intel UHD Graphics 615
AMD Radeon R5 (Bristol Ridge)
NVIDIA GeForce GT 720M
NVIDIA GeForce 920M
...
NVIDIA Quadro P5200
» The benchmarks indicate that the game is not playable in the tested settings.
Intel HD Graphics 4400
NVIDIA GeForce GT 720M
Intel HD Graphics 530
Intel HD Graphics 630
Intel Iris Plus Graphics 640
Intel HD Graphics 5600
...
max:
» With all tested laptops playable in detail settings low.
Intel HD Graphics (Haswell)
Intel UHD Graphics 605
Intel HD Graphics 4400
AMD Radeon R5 (Bristol Ridge)
NVIDIA GeForce GT 720M
Intel HD Graphics 520
AMD Radeon RX Vega 10
Intel HD Graphics 530
Intel HD Graphics 630
...
» The benchmarks indicate that the game is not playable in the tested settings.
Intel HD Graphics (Bay Trail)
...
Intel UHD Graphics 605
Intel HD Graphics 4400
AMD Radeon HD 8650G
Intel HD Graphics 515
AMD Radeon R4 (Stoney Ridge)
AMD FirePro W4190M
Intel HD Graphics 520
NVIDIA GeForce GT 720M
AMD Radeon RX Vega 10
AMD Radeon R5 (Bristol Ridge)
Intel HD Graphics 5600
...
» The benchmarks indicate that the game is not playable in the tested settings.
Intel HD Graphics (Bay Trail)
...
Intel UHD Graphics 610
Intel UHD Graphics 605
Intel HD Graphics 515
AMD Radeon R2 (Stoney Ridge)
AMD Radeon R4 (Stoney Ridge)
Intel UHD Graphics 615
Intel HD Graphics (Haswell)
Intel HD Graphics 520
Intel HD Graphics 530
Intel HD Graphics 5600
...
Intel UHD Graphics 605
Intel HD Graphics 515
Intel UHD Graphics 600
Intel HD Graphics (Haswell)
Intel UHD Graphics 615
Intel HD Graphics 4400
AMD Radeon R5 (Bristol Ridge)
NVIDIA GeForce GT 720M
...
max:
» The benchmarks indicate that the game is not playable in the tested settings.
Additional Benchmarks
Performance 1920x1080
Intel UHD Graphics 605
AMD Radeon R2 (Stoney Ridge)
Intel HD Graphics 4400
Intel UHD Graphics 615
Intel HD Graphics 520
AMD Radeon R5 (Bristol Ridge)
AMD Radeon HD 8650G
NVIDIA GeForce GT 720M
...
NVIDIA Quadro P5200
Intel UHD Graphics 615
NVIDIA GeForce GT 720M
AMD Radeon R5 (Bristol Ridge)
Intel HD Graphics 630
...
NVIDIA Quadro P5200
» The benchmarks indicate that the game is not playable in the tested settings.
AMD Radeon R5 (Bristol Ridge)
Intel HD Graphics 4400
AMD Radeon HD 8650G
Intel HD Graphics 520
NVIDIA GeForce GT 720M
Intel HD Graphics 530
...
max:
NVIDIA GeForce GT 720M
AMD Radeon R5 (Bristol Ridge)
Intel HD Graphics 520
AMD Radeon RX Vega 8 (Ryzen 2000/3000)
AMD Radeon Pro WX 3100
NVIDIA GeForce GTX 950M
...
max:
» The benchmarks indicate that the game is not playable in the tested settings.
Intel HD Graphics 520
Intel UHD Graphics 615
Intel HD Graphics 515
AMD Radeon R4 (Stoney Ridge)
Intel HD Graphics 4400
AMD Radeon HD 8650G
NVIDIA GeForce GT 720M
AMD Radeon R5 (Bristol Ridge)
Intel UHD Graphics G1 (Ice Lake 32 EU)
...
max:
...
Intel HD Graphics 520
Intel HD Graphics 515
NVIDIA GeForce GT 720M
AMD Radeon R5 (Bristol Ridge)
Intel HD Graphics 630
AMD Radeon RX Vega 6 (Ryzen 2000/3000)
...
max:
» The benchmarks indicate that the game is not playable in the tested settings.
...
Intel UHD Graphics 605
Intel UHD Graphics 600
Intel HD Graphics 4400
AMD Radeon R4 (Stoney Ridge)
Intel UHD Graphics 615
Intel HD Graphics 515
Intel HD Graphics 520
AMD Radeon HD 8650G
AMD Radeon R5 (Bristol Ridge)
Intel HD Graphics 5600
...
max:
Intel HD Graphics 515
AMD Radeon R5 (Bristol Ridge)
Intel HD Graphics 520
Intel HD Graphics 530
Intel HD Graphics 5600
...
max:
» The benchmarks indicate that the game is not playable in the tested settings.
Intel HD Graphics (Haswell)
Intel HD Graphics 510
Intel HD Graphics 4400
Intel HD Graphics 515
Intel HD Graphics 520
AMD FirePro W4190M
AMD Radeon R4 (Stoney Ridge)
NVIDIA GeForce GT 720M
Intel HD Graphics 530
...
NVIDIA GeForce GTX 1080 Mobile
max:
NVIDIA GeForce GTX 1080 (Desktop)
Intel HD Graphics 4400
Intel HD Graphics 515
AMD FirePro W4190M
Intel HD Graphics 530
...
max:
» The benchmarks indicate that the game is not playable in the tested settings.
Intel HD Graphics 4400
Intel HD Graphics 510
NVIDIA GeForce GT 720M
AMD Radeon R5 (Bristol Ridge)
AMD Radeon HD 8650G
Intel HD Graphics 520
...
max:
NVIDIA Titan X Pascal
Intel HD Graphics 4400
Intel HD Graphics 510
NVIDIA GeForce GT 720M
AMD Radeon HD 8650G
AMD Radeon R5 (Bristol Ridge)
Intel HD Graphics 520
...
max:
NVIDIA Titan X Pascal
» The benchmarks indicate that the game is not playable in the tested settings.
...
AMD Radeon HD 8650G
Intel HD Graphics 520
NVIDIA GeForce GT 720M
Intel HD Graphics 510
AMD Radeon R7 M360
AMD Radeon RX Vega 10
NVIDIA GeForce GT 640M
Intel HD Graphics 530
...
NVIDIA Quadro P2000
...
AMD Radeon R5 (Bristol Ridge)
Intel HD Graphics 510
AMD Radeon R7 M445
AMD Radeon RX Vega 10
Intel HD Graphics 5600
Intel HD Graphics 520
NVIDIA GeForce GT 720M
AMD Radeon HD 8650G
...
NVIDIA Quadro P2000
» With all tested laptops playable in detail settings med..
AMD Radeon R4 (Stoney Ridge)
Intel HD Graphics 4400
Intel HD Graphics (Haswell)
AMD Radeon R5 (Bristol Ridge)
AMD Radeon HD 8650G
...
NVIDIA Quadro P3200
max:
NVIDIA GeForce GTX 1080 (Desktop)
Intel HD Graphics 4400
AMD Radeon R5 (Bristol Ridge)
AMD Radeon HD 8650G
Intel HD Graphics 520
NVIDIA GeForce GT 720M
...
max:
» The benchmarks indicate that the game is not playable in the tested settings.
Additional Benchmarks
Medium Preset FXAA 1920x1080
...
Intel UHD Graphics 605
Intel HD Graphics 530
Intel UHD Graphics G1 (Ice Lake 32 EU)
Intel HD Graphics 4400
Intel HD Graphics 515
AMD Radeon R2 (Stoney Ridge)
Intel HD Graphics 510
AMD Radeon HD 8650G
AMD Radeon R4 (Stoney Ridge)
Intel HD Graphics 520
...
Intel UHD Graphics 605
Intel HD Graphics 530
Intel HD Graphics 4400
AMD Radeon R2 (Stoney Ridge)
Intel HD Graphics 510
Intel HD Graphics 520
Intel HD Graphics 515
AMD Radeon HD 8650G
AMD Radeon R5 (Bristol Ridge)
NVIDIA GeForce GT 720M
...
» The benchmarks indicate that the game is not playable in the tested settings.
Intel HD Graphics 4400
NVIDIA GeForce GT 720M
Intel Iris Graphics 540
Intel HD Graphics 520
AMD Radeon R7 M445
Intel HD Graphics 530
...
max:
NVIDIA GeForce GTX 1060 (Desktop)
AMD Radeon R6 (Carrizo)
NVIDIA GeForce GT 720M
Intel HD Graphics 520
Intel HD Graphics 5600
Intel HD Graphics 530
Intel HD Graphics 630
...
max:
AMD Radeon RX 480 (Desktop)
» With all tested laptops playable in detail settings low.
Intel HD Graphics 4400
AMD Radeon R4 (Stoney Ridge)
NVIDIA GeForce GT 720M
Intel HD Graphics 515
Intel HD Graphics 520
NVIDIA GeForce 920M
AMD Radeon R6 (Carrizo)
...
NVIDIA Quadro P4000 Max-Q
max:
» The benchmarks indicate that the game is not playable in the tested settings.
Intel HD Graphics 515
Intel HD Graphics (Haswell)
AMD Radeon HD 8650G
Intel HD Graphics 4400
AMD Radeon R5 (Bristol Ridge)
...
max:
Intel HD Graphics (Haswell)
Intel HD Graphics 4400
AMD Radeon R5 (Bristol Ridge)
Intel HD Graphics 520
NVIDIA GeForce GT 720M
...
NVIDIA GeForce GTX 980 (Laptop)
max:
NVIDIA GeForce GTX 1080 (Desktop)
» The benchmarks indicate that the game is not playable in the tested settings.
...
Intel HD Graphics 515
AMD Radeon R4 (Stoney Ridge)
Intel UHD Graphics 610
Intel HD Graphics (Haswell)
AMD Radeon R6 (Carrizo)
Intel UHD Graphics 615
Intel HD Graphics 4400
AMD Radeon R5 (Bristol Ridge)
Intel HD Graphics 520
...
...
AMD Radeon R2 (Stoney Ridge)
Intel HD Graphics (Haswell)
AMD Radeon R4 (Stoney Ridge)
Intel UHD Graphics 610
Intel HD Graphics 4400
Intel UHD Graphics 615
Intel HD Graphics 520
Intel HD Graphics 5600
NVIDIA GeForce GT 720M
AMD Radeon R5 (Bristol Ridge)
...
» The benchmarks indicate that the game is not playable in the tested settings.
AMD Radeon RX Vega 6 (Ryzen 2000/3000)
AMD Radeon R6 (Carrizo)
AMD Radeon HD 8650G
NVIDIA GeForce 920M
AMD Radeon R7 M340
Intel HD Graphics 520
AMD Radeon R7 M360
...
NVIDIA GeForce GTX 980 (Laptop)
AMD Radeon R6 (Carrizo)
AMD Radeon R7 M360
AMD Radeon RX Vega 6 (Ryzen 2000/3000)
AMD FirePro W4190M
AMD Radeon Pro WX 3100
...
NVIDIA GeForce GTX 980 (Laptop)
» The benchmarks indicate that the game is not playable in the tested settings.
Intel HD Graphics 530
AMD Radeon R4 (Stoney Ridge)
AMD Radeon R5 (Bristol Ridge)
NVIDIA GeForce GT 720M
Intel HD Graphics 630
AMD Radeon RX Vega 6 (Ryzen 2000/3000)
AMD Radeon R6 (Carrizo)
...
NVIDIA Quadro P5200
» The benchmarks indicate that the game is not playable in the tested settings.
...
AMD Radeon R8 M365DX
NVIDIA GeForce GT 720M
Intel HD Graphics 510
AMD Radeon HD 8650G
AMD Radeon R6 (Carrizo)
Intel HD Graphics 4400
Intel HD Graphics 530
Intel HD Graphics 5600
AMD Radeon R9 M280X
NVIDIA GeForce 910M
AMD Radeon R5 (Bristol Ridge)
...
NVIDIA GeForce GTX 1080 Mobile
max:
» The benchmarks indicate that the game is not playable in the tested settings.
Intel HD Graphics (Haswell)
Intel HD Graphics 515
AMD Radeon R5 (Bristol Ridge)
AMD Radeon R6 (Carrizo)
NVIDIA GeForce GT 720M
Intel HD Graphics 520
Intel HD Graphics 5600
NVIDIA GeForce 910M
...
NVIDIA GeForce GTX 1080 Mobile
NVIDIA GeForce GT 720M
AMD Radeon R8 M365DX
Intel HD Graphics 520
AMD Radeon R6 (Carrizo)
Intel HD Graphics 5600
NVIDIA GeForce 910M
AMD Radeon R5 (Bristol Ridge)
...
NVIDIA GeForce GTX 1080 Mobile
max:
NVIDIA GeForce GTX 1080 (Desktop)
» The benchmarks indicate that the game is not playable in the tested settings.
...
Intel Iris Plus Graphics G4 (Ice Lake 48 EU)
Intel HD Graphics 510
Intel HD Graphics 4200
Intel UHD Graphics 615
AMD Radeon HD 8650G
Intel HD Graphics 4400
NVIDIA GeForce 910M
NVIDIA GeForce GT 720M
AMD Radeon R6 (Carrizo)
Intel HD Graphics 530
Intel UHD Graphics 617
...
NVIDIA Quadro P5200
max:
...
Intel HD Graphics 4200
AMD Radeon HD 8650G
Intel HD Graphics 510
Intel HD Graphics 4400
Intel UHD Graphics 615
AMD Radeon R6 (Carrizo)
NVIDIA GeForce 910M
NVIDIA GeForce GT 720M
Intel HD Graphics 520
AMD Radeon R5 (Bristol Ridge)
...
NVIDIA Quadro P5200
max:
» The benchmarks indicate that the game is not playable in the tested settings.
...
Intel UHD Graphics 600
Intel HD Graphics 4200
Intel HD Graphics 4400
AMD Radeon R2 (Stoney Ridge)
Intel UHD Graphics 610
Intel HD Graphics 510
Intel HD Graphics 515
AMD Radeon HD 8650G
...
max:
...
Intel UHD Graphics 600
Intel HD Graphics 4400
AMD Radeon R2 (Stoney Ridge)
Intel UHD Graphics 610
Intel HD Graphics 515
Intel HD Graphics 510
AMD Radeon HD 8650G
Intel UHD Graphics 615
Intel HD Graphics 520
NVIDIA GeForce GT 720M
...
max:
» The benchmarks indicate that the game is not playable in the tested settings.
Intel HD Graphics (Cherry Trail)
Intel HD Graphics (Broadwell)
Intel HD Graphics 515
Intel HD Graphics 4200
AMD Radeon R6 (Carrizo)
AMD Radeon R7 (Carrizo)
AMD Radeon HD 8650G
AMD Radeon R5 (Bristol Ridge)
NVIDIA GeForce 910M
AMD Radeon R7 M340
Intel HD Graphics 4400
NVIDIA GeForce GT 720M
...
NVIDIA GeForce GTX 980 (Laptop)
Intel HD Graphics (Cherry Trail)
Intel HD Graphics (Broadwell)
Intel HD Graphics 515
AMD Radeon R5 (Bristol Ridge)
Intel HD Graphics 4400
AMD Radeon R6 (Carrizo)
NVIDIA GeForce GT 720M
Intel HD Graphics 520
AMD Radeon R7 M340
NVIDIA GeForce 910M
AMD Radeon R7 (Carrizo)
...
NVIDIA GeForce GTX 980 (Laptop)
max:
NVIDIA GeForce GTX 1080 (Desktop)
» The benchmarks indicate that the game is not playable in the tested settings.
Intel HD Graphics 520
AMD Radeon R7 (Carrizo)
Intel HD Graphics 5600
AMD Radeon R6 (Carrizo)
...
NVIDIA Quadro P5200
» The benchmarks indicate that the game is not playable in the tested settings.
Intel HD Graphics 515
Intel HD Graphics 4200
AMD Radeon R6 (Carrizo)
Intel HD Graphics 520
Intel HD Graphics 4400
AMD Radeon R7 (Carrizo)
...
max:
NVIDIA GeForce GTX 1060 (Desktop)
» The benchmarks indicate that the game is not playable in the tested settings.
Intel HD Graphics (Cherry Trail)
Intel HD Graphics 530
Intel HD Graphics 515
AMD Radeon R5 (Bristol Ridge)
Intel HD Graphics 4200
Intel HD Graphics 510
Intel HD Graphics 520
Intel HD Graphics 4400
NVIDIA GeForce 910M
...
NVIDIA Quadro M5000M
Intel HD Graphics (Cherry Trail)
...
Intel HD Graphics 4200
Intel HD Graphics 4400
Intel HD Graphics 515
Intel HD Graphics 520
Intel Iris Pro Graphics 5200
AMD Radeon R5 (Bristol Ridge)
Intel HD Graphics 510
NVIDIA GeForce 910M
AMD Radeon R5 M330
NVIDIA GeForce GT 720M
...
NVIDIA Quadro M5000M
» The benchmarks indicate that the game is not playable in the tested settings.
Intel HD Graphics (Bay Trail)
...
AMD Radeon R6 M340DX
AMD Radeon R5 M330
AMD Radeon HD 8650G
Intel HD Graphics 510
AMD Radeon R5 M335
AMD Radeon R8 M365DX
AMD Radeon R5 M240
Intel UHD Graphics 615
AMD Radeon R7 (Carrizo)
...
max:
NVIDIA GeForce GTX 1080 (Desktop)
...
Intel HD Graphics 4200
NVIDIA GeForce GT 720M
Intel HD Graphics 515
NVIDIA GeForce 910M
AMD Radeon R5 (Bristol Ridge)
Intel HD Graphics 510
Intel HD Graphics 4400
AMD Radeon R6 (Carrizo)
NVIDIA GeForce GT 640M
AMD Radeon R7 M360
AMD Radeon R6 M340DX
AMD Radeon R5 M330
AMD Radeon R5 M335
...
max:
NVIDIA GeForce GTX 1080 (Desktop)
» With all tested laptops playable in detail settings low.
Intel HD Graphics (Bay Trail)
...
Intel HD Graphics (Braswell)
Intel HD Graphics (Cherry Trail)
Intel UHD Graphics 605
AMD Radeon R2 (Stoney Ridge)
Intel HD Graphics 515
AMD Radeon R4 (Stoney Ridge)
AMD Radeon HD 8350G
Intel HD Graphics 4200
Intel HD Graphics 5600
...
Intel HD Graphics (Braswell)
...
Intel HD Graphics 515
Intel UHD Graphics 605
AMD Radeon R4 (Stoney Ridge)
AMD Radeon R2 (Stoney Ridge)
Intel HD Graphics 4200
Intel HD Graphics 5600
AMD Radeon HD 8350G
Intel HD Graphics 4400
Intel Iris Graphics 5100
...
Intel Iris Graphics 5100
AMD Radeon R5 M330
AMD Radeon R5 M335
AMD Radeon R6 M340DX
...
AMD Radeon R9 M390
» The benchmarks indicate that the game is not playable in the tested settings.
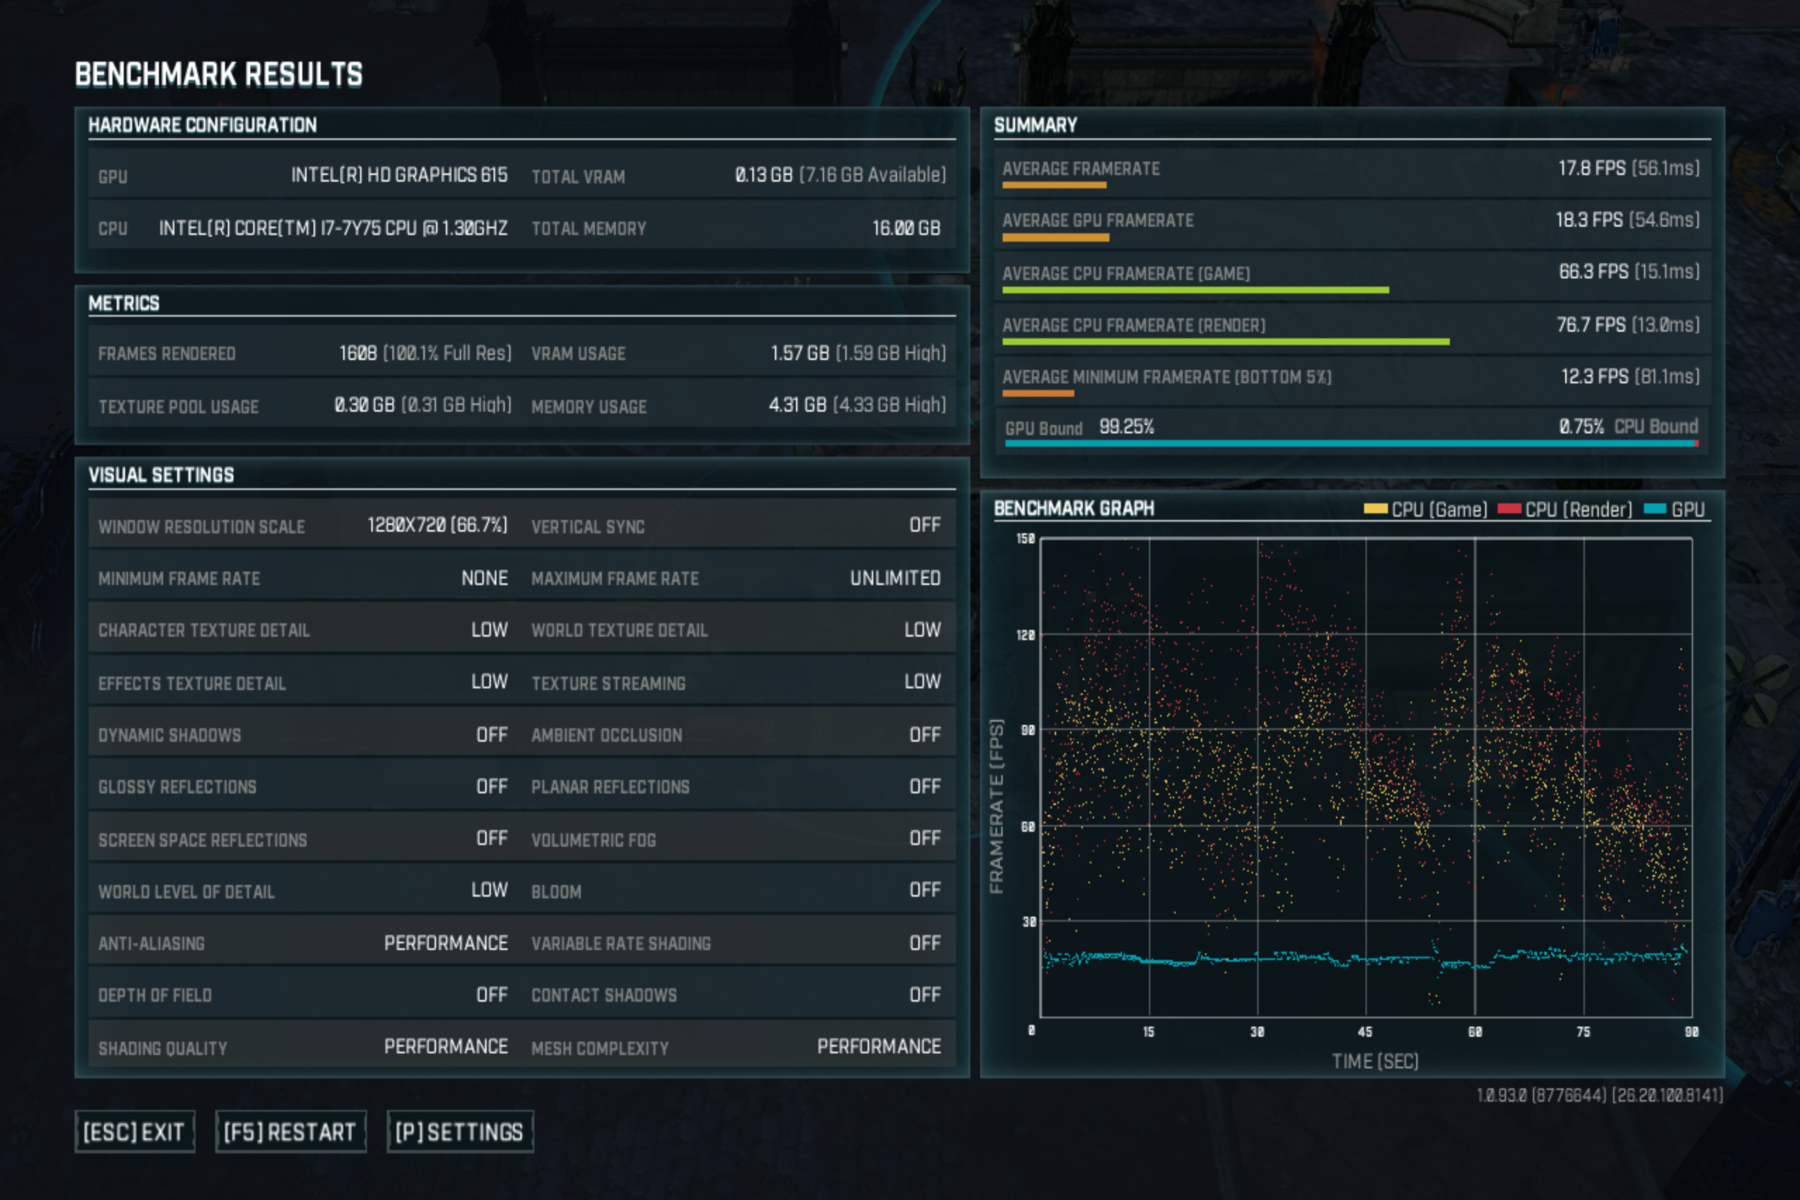
50.4 [X] Eve-Tech Eve V i7 Intel Core i7-7Y75 1.3GHz
HD Graphics 615
min:
44.1 fps
57.4 [X] Eve-Tech Eve V m3 Intel Core m3-7Y30 1GHz
HD Graphics 615
min:
50.3 fps
57.4 [X] Eve-Tech Eve V i5 Intel Core i5-7Y54 1.2GHz
HD Graphics 615
min:
50.3 fps
59.1 ~ 56 fps
+ Compare
- Hide Comparison
...
AMD Radeon R9 M280X
Intel UHD Graphics 615
NVIDIA GeForce GT 640M
Qualcomm Adreno 690
Intel UHD Graphics 610
AMD Radeon R9 M375
Intel Iris Pro Graphics 580
Intel HD Graphics 4400
Intel Iris Graphics 5100
...
max:
27.6 [X] Eve-Tech Eve V i7 Intel Core i7-7Y75 1.3GHz
HD Graphics 615
min:
24 fps
31.9 [X] Eve-Tech Eve V m3 Intel Core m3-7Y30 1GHz
HD Graphics 615
min:
27.6 fps
31.9 [X] Eve-Tech Eve V i5 Intel Core i5-7Y54 1.2GHz
HD Graphics 615
min:
27.6 fps
52.7 ~ 36 fps
+ Compare
- Hide Comparison
...
Intel HD Graphics 515
Intel UHD Graphics 617
Intel HD Graphics 4400
AMD Radeon HD 8650G
Intel UHD Graphics Xe G4 48EUs
Intel Iris Plus Graphics G4 (Ice Lake 48 EU)
Intel UHD Graphics G1 (Ice Lake 32 EU)
Intel Iris Pro Graphics 580
AMD Radeon R7 M340
Intel Iris Graphics 5100
AMD Radeon R9 M280X
...
max:
13.7 [X] Eve-Tech Eve V i7 Intel Core i7-7Y75 1.3GHz
HD Graphics 615
min:
12.6 fps
15.7 [X] Eve-Tech Eve V m3 Intel Core m3-7Y30 1GHz
HD Graphics 615
min:
14.6 fps
15.7 [X] Eve-Tech Eve V i5 Intel Core i5-7Y54 1.2GHz
HD Graphics 615
min:
14.6 fps
27.4 ~ 18 fps
+ Compare
- Hide Comparison
...
AMD Radeon HD 8650G
AMD Radeon R5 (Bristol Ridge)
Intel Iris Plus Graphics G4 (Ice Lake 48 EU)
Intel Iris Graphics 5100
Intel UHD Graphics 24EUs (Alder Lake-N)
NVIDIA GeForce GT 720M
...
max:
12.3 [X] Eve-Tech Eve V i7 Intel Core i7-7Y75 1.3GHz
HD Graphics 615
min:
11.5 fps
14.1 [X] Eve-Tech Eve V m3 Intel Core m3-7Y30 1GHz
HD Graphics 615
min:
12.8 fps
14.1 [X] Eve-Tech Eve V i5 Intel Core i5-7Y54 1.2GHz
HD Graphics 615
min:
12.8 fps
25.1 ~ 16 fps
+ Compare
- Hide Comparison
...
Intel UHD Graphics 617
Intel Iris Pro Graphics 580
AMD Radeon HD 8650G
Intel Iris Graphics 5100
AMD Radeon R5 (Bristol Ridge)
Intel Iris Plus Graphics G4 (Ice Lake 48 EU)
AMD Radeon R7 M340
NVIDIA GeForce GT 720M
...
max:
» With most tested laptops playable in detail settings med..
...
AMD Radeon R9 M375
Intel UHD Graphics 610
Intel UHD Graphics 615
Intel HD Graphics 4400
Intel HD Graphics 520
Intel HD Graphics 530
Intel Iris Graphics 5100
NVIDIA GeForce GT 720M
...
max:
» The benchmarks indicate that the game is not playable in the tested settings.
...
Intel HD Graphics (Broadwell)
Intel HD Graphics (Haswell)
AMD Radeon HD 8350G
AMD Radeon RX Vega 8 (Ryzen 2000/3000)
Intel HD Graphics 515
AMD Radeon R5 (Bristol Ridge)
Intel HD Graphics 4200
AMD Radeon R8 M365DX
Intel HD Graphics 4400
AMD Radeon R7 (Carrizo)
Intel HD Graphics 520
...
Intel HD Graphics (Braswell)
...
AMD Radeon HD 8330
Intel HD Graphics 515
Intel HD Graphics 4200
AMD Radeon R4 (Stoney Ridge)
AMD Radeon HD 8350G
Intel HD Graphics 510
Intel HD Graphics 4400
AMD Radeon R5 (Bristol Ridge)
Intel HD Graphics 520
...
AMD FirePro W7170M
max:
NVIDIA GeForce GTX 1060 (Desktop)
» With all tested laptops playable in detail settings low.
...
Intel HD Graphics (Cherry Trail)
Intel UHD Graphics 605
Intel UHD Graphics 600
Intel UHD Graphics 615
Intel HD Graphics 5000
Intel Iris Graphics 5100
AMD Radeon HD 8650G
Intel HD Graphics 4400
Intel UHD Graphics 610
...
max:
Intel UHD Graphics 605
Intel UHD Graphics 600
Intel HD Graphics 5000
AMD Radeon HD 8650G
Intel UHD Graphics 615
Intel HD Graphics 4400
Intel UHD Graphics 610
Intel Iris Graphics 5100
Intel HD Graphics 510
...
max:
Intel UHD Graphics 610
Intel HD Graphics 520
Intel Iris Pro Graphics 5200
Intel HD Graphics 630
NVIDIA GeForce GT 720M
NVIDIA GeForce 920M
Intel UHD Graphics Xe 16EUs (Tiger Lake-H)
...
max:
» The benchmarks indicate that the game is not playable in the tested settings.
Additional Benchmarks
Normal/Off 4xAF 1920x1080
17.2 [X] Eve-Tech Eve V i7 Intel Core i7-7Y75 1.3GHz
HD Graphics 615
min:
6.75 fps, P1:
10.9 fps, max:
36.4 fps
Lowest Settings possible 1920x1080
18.3 [X] Eve-Tech Eve V i7 Intel Core i7-7Y75 1.3GHz
HD Graphics 615
min:
6.83 fps, P1:
11.5 fps, max:
43.1 fps
AMD Radeon R2 (Stoney Ridge)
...
NVIDIA GeForce 910M
Intel UHD Graphics 605
Intel HD Graphics (Braswell)
AMD Radeon R4 (Stoney Ridge)
AMD Radeon HD 8330
Intel HD Graphics (Haswell)
AMD Radeon HD 8350G
Intel HD Graphics 5000
AMD Radeon R5 (Bristol Ridge)
Intel HD Graphics (Broadwell)
Intel HD Graphics 515
...
AMD Radeon R2 (Stoney Ridge)
...
AMD Radeon HD 8330
Intel UHD Graphics 605
Intel HD Graphics (Haswell)
AMD Radeon HD 8350G
AMD Radeon R4 (Stoney Ridge)
AMD Radeon R5 (Bristol Ridge)
Intel HD Graphics 5000
Intel HD Graphics (Broadwell)
Intel HD Graphics 515
AMD Radeon R8 M365DX
...
» The benchmarks indicate that the game is not playable in the tested settings.
...
Intel HD Graphics 515
Intel HD Graphics (Broadwell)
AMD Radeon R4 (Stoney Ridge)
Intel HD Graphics 4400
AMD Radeon R6 (Carrizo)
Intel HD Graphics 5000
AMD Radeon R7 (Carrizo)
AMD Radeon R7 M340
AMD Radeon R6 M255DX
...
max:
NVIDIA GeForce GTX 1080 (Desktop)
...
Intel HD Graphics 4400
Intel HD Graphics 515
Intel HD Graphics (Broadwell)
AMD Radeon R4 (Stoney Ridge)
Intel HD Graphics 5000
AMD Radeon R6 M255DX
AMD Radeon R7 M340
Intel HD Graphics 520
AMD Radeon R6 (Carrizo)
AMD Radeon R5 M330
...
max:
NVIDIA GeForce GTX 1060 (Desktop)
» The benchmarks indicate that the game is not playable in the tested settings.
Intel HD Graphics (Braswell)
...
Intel Iris Graphics 5100
Intel HD Graphics 4400
AMD Radeon R5 M240
AMD Radeon R7 M360
Intel HD Graphics 5000
AMD Radeon R5 (Bristol Ridge)
Intel HD Graphics 520
AMD Radeon R9 M280X
AMD Radeon HD 8650G
...
max:
...
Intel HD Graphics 4400
AMD Radeon R6 M255DX
Intel Iris Graphics 5100
AMD Radeon R8 M365DX
NVIDIA GeForce 910M
AMD Radeon R6 (Carrizo)
Intel HD Graphics 5000
AMD Radeon R7 M360
AMD Radeon R6 M340DX
AMD Radeon R7 M260
AMD Radeon R5 M330
...
» With all tested laptops playable in detail settings low.
Intel HD Graphics (Bay Trail)
...
Intel HD Graphics (Haswell)
AMD Radeon HD 8350G
AMD Radeon R7 M260
AMD Radeon R5 M330
AMD Radeon RX Vega 6 (Ryzen 2000/3000)
Intel Iris Graphics 5100
AMD Radeon R5 M230
Intel HD Graphics 4400
Intel HD Graphics 5000
...
max:
NVIDIA GeForce GTX 1060 (Desktop)
Intel HD Graphics (Bay Trail)
...
AMD Radeon R5 M330
AMD Radeon HD 8350G
Intel HD Graphics 4400
AMD Radeon R7 M260
AMD Radeon R5 M230
AMD Radeon RX Vega 6 (Ryzen 2000/3000)
AMD Radeon R6 M255DX
Intel Iris Graphics 5100
Intel HD Graphics 5000
AMD Radeon R6 (Carrizo)
...
max:
NVIDIA GeForce GTX 1060 (Desktop)
AMD Radeon R5 M330
AMD Radeon R5 M230
Intel HD Graphics 4400
AMD Radeon RX Vega 6 (Ryzen 2000/3000)
AMD Radeon R7 M260
Intel HD Graphics 5000
AMD Radeon R6 M255DX
Intel Iris Graphics 5100
...
NVIDIA GeForce GTX 1080 Mobile
max:
NVIDIA GeForce GTX 1080 (Desktop)
» The benchmarks indicate that the game is not playable in the tested settings.
Intel HD Graphics (Bay Trail)
...
AMD FirePro W4190M
Intel HD Graphics 5000
AMD Radeon R5 M335
AMD Radeon R5 M330
Intel Iris Graphics 5100
AMD Radeon R5 M240
NVIDIA GeForce GT 720M
AMD Radeon R7 M260
AMD Radeon R7 (Carrizo)
Intel UHD Graphics 615
...
Intel HD Graphics (Bay Trail)
...
Intel UHD Graphics 605
Intel HD Graphics 4400
AMD Radeon R4 (Stoney Ridge)
Intel HD Graphics 5000
AMD Radeon R5 M230
AMD Radeon R5 M335
NVIDIA GeForce GT 720M
AMD Radeon R5 M330
...
Intel HD Graphics 4400
AMD Radeon R5 M230
Intel HD Graphics 5000
AMD Radeon R5 M335
NVIDIA GeForce GT 720M
Intel Iris Graphics 5100
AMD Radeon R7 M260
...
» The benchmarks indicate that the game is not playable in the tested settings.
...
AMD Radeon RX 560X (Laptop)
AMD Radeon R5 M335
NVIDIA GeForce 920M
NVIDIA GeForce GTX 765M
Intel HD Graphics 4400
AMD Radeon RX Vega 8 (Ryzen 2000/3000)
Intel HD Graphics 530
AMD Radeon R7 M260X
AMD Radeon R7 M340
AMD Radeon R5 M240
...
max:
Intel HD Graphics (Bay Trail)
...
Intel Iris Graphics 550
AMD Radeon R9 M290X
NVIDIA GeForce GTX 765M
AMD Radeon RX Vega 7
NVIDIA GeForce GTX 770M
NVIDIA GeForce GTX 950M
AMD Radeon R9 M295X
NVIDIA GeForce GTX 780M
AMD Radeon R9 M370X
NVIDIA GeForce 945M
NVIDIA Quadro K3100M
...
max:
NVIDIA GeForce GTX 1060 (Desktop)
...
NVIDIA Quadro K1100M
Intel Iris Plus Graphics G7 (Ice Lake 64 EU)
NVIDIA GeForce 940M
Intel Iris Graphics 550
NVIDIA GeForce GT 750M
AMD Radeon RX Vega 7
NVIDIA GeForce GTX 860M
AMD Radeon R9 M370X
NVIDIA GeForce GTX 950M
NVIDIA GeForce 945M
AMD Radeon R9 M290X
NVIDIA GeForce GTX 765M
...
NVIDIA GeForce GTX 1080 Mobile
...
Intel Iris Plus Graphics G4 (Ice Lake 48 EU)
NVIDIA GeForce 845M
AMD Radeon RX Vega 6 (Ryzen 2000/3000)
AMD Radeon R7 M445
Intel Iris Plus Graphics G7 (Ice Lake 64 EU)
AMD Radeon RX Vega 8 (Ryzen 2000/3000)
NVIDIA Quadro K1100M
Intel Iris Graphics 550
AMD Radeon RX Vega 10
AMD Radeon 540X
NVIDIA GeForce GT 750M
NVIDIA GeForce 940M
Intel Iris Graphics 540
...
max:
NVIDIA Titan X Pascal
» With all tested laptops playable in detail settings high.
...
Intel UHD Graphics 600
AMD Radeon HD 8400
AMD Radeon R8 M365DX
AMD Radeon R5 (Bristol Ridge)
Intel HD Graphics 4400
AMD Radeon R6 (Carrizo)
NVIDIA GeForce GT 720M
AMD Radeon R5 M240
Intel HD Graphics 5000
Intel HD Graphics 515
AMD Radeon R6 M340DX
...
Intel HD Graphics (Bay Trail)
...
AMD Radeon HD 8400
Intel HD Graphics (Broadwell)
AMD Radeon HD 8350G
AMD Radeon R4 (Stoney Ridge)
Intel HD Graphics 4400
Intel HD Graphics 515
AMD Radeon R6 M255DX
AMD Radeon R5 (Bristol Ridge)
AMD Radeon HD 8450G
Intel HD Graphics 5000
...
» With all tested laptops playable in detail settings low.
...
AMD Radeon HD 8350G
Intel HD Graphics (Haswell)
AMD Radeon HD 8400
AMD Radeon HD 8450G
Intel HD Graphics 4200
Intel HD Graphics 4400
AMD Radeon R5 M240
Intel HD Graphics 5000
AMD Radeon HD 8650G + HD 8570M Dual Graphics
AMD Radeon R7 (Carrizo)
AMD Radeon R6 (Carrizo)
AMD Radeon R6 M255DX
Intel HD Graphics 515
AMD Radeon R5 M230
...
Intel HD Graphics (Bay Trail)
...
AMD Radeon HD 8610G
AMD Radeon HD 8350G
Intel HD Graphics 4400
AMD Radeon HD 8450G
Intel HD Graphics 515
Intel HD Graphics 5000
AMD Radeon R6 (Carrizo)
AMD Radeon R5 M230
AMD Radeon R7 (Carrizo)
Intel Iris Graphics 5100
AMD Radeon HD 8650G + HD 8570M Dual Graphics
...
» The benchmarks indicate that the game is not playable in the tested settings.
Intel HD Graphics (Bay Trail)
...
AMD Radeon HD 8350G
Intel HD Graphics 515
AMD Radeon R5 M240
AMD Radeon HD 8650G
AMD Radeon HD 8450G
Intel UHD Graphics 615
AMD Radeon R5 M320
Intel HD Graphics 5000
NVIDIA GeForce GT 720M
AMD Radeon R7 (Carrizo)
Intel HD Graphics 510
AMD Radeon HD 8550G
...
NVIDIA GeForce GTX 980 (Laptop)
max:
NVIDIA Titan RTX
...
AMD Radeon R6 (Carrizo)
Intel HD Graphics 515
AMD Radeon HD 8350G
AMD Radeon HD 8450G
Intel UHD Graphics 615
Intel HD Graphics 5000
AMD Radeon HD 8650G
NVIDIA GeForce GT 720M
AMD Radeon R5 M320
AMD Radeon R6 M255DX
AMD Radeon R5 M240
Intel HD Graphics 510
...
NVIDIA GeForce GTX 980 (Laptop)
max:
NVIDIA Titan RTX
...
Intel HD Graphics 520
AMD Radeon HD 8650G + HD 8570M Dual Graphics
Intel HD Graphics 510
AMD Radeon R7 (Carrizo)
AMD Radeon R6 M255DX
AMD Radeon HD 8550G
AMD Radeon HD 8650G
AMD Radeon R5 M230
AMD Radeon R6 M340DX
AMD Radeon R5 M240
AMD Radeon R5 M330
AMD Radeon R5 (Bristol Ridge)
...
NVIDIA GeForce GTX 980 (Laptop)
max:
NVIDIA Titan RTX
...
AMD Radeon R7 (Carrizo)
AMD Radeon HD 8650G
Intel Iris Graphics 5100
Intel HD Graphics 530
Intel HD Graphics 5600
AMD Radeon R5 M330
AMD Radeon R6 M340DX
AMD Radeon R7 M260
AMD Radeon R5 (Bristol Ridge)
AMD Radeon R7 M360
NVIDIA GeForce 910M
...
max:
NVIDIA Titan RTX
» The benchmarks indicate that the game is not playable in the tested settings.
...
AMD Radeon R5 M230
Intel HD Graphics 5000
Intel HD Graphics 515
Intel HD Graphics 4400
AMD Radeon R6 M255DX
NVIDIA Quadro K610M
AMD Radeon R6 (Carrizo)
AMD Radeon R7 (Carrizo)
AMD Radeon HD 8650G
NVIDIA GeForce GT 720M
...
» The benchmarks indicate that the game is not playable in the tested settings.
...
AMD Radeon HD 8450G
Intel Iris Graphics 5100
Intel HD Graphics 515
Intel UHD Graphics 615
AMD Radeon R5 M320
AMD Radeon HD 8650G + HD 8570M Dual Graphics
AMD Radeon HD 8550G + HD 8670M Dual Graphics
...
Intel HD Graphics (Bay Trail)
...
AMD Radeon HD 8450G + Radeon HD 8570M Dual Graphics
Intel HD Graphics 515
Intel HD Graphics 510
Intel HD Graphics 5000
Intel Iris Graphics 5100
Intel UHD Graphics 615
AMD Radeon R5 M230
AMD Radeon HD 8550G + HD 8670M Dual Graphics
Intel HD Graphics 520
...
Intel HD Graphics (Bay Trail)
...
Intel HD Graphics 5000
Intel HD Graphics 515
Intel Iris Graphics 5100
Intel HD Graphics 510
Intel UHD Graphics 615
AMD Radeon R5 M230
AMD Radeon HD 8550G + HD 8670M Dual Graphics
Intel HD Graphics 520
AMD Radeon HD 8650G + HD 8570M Dual Graphics
AMD Radeon R5 M335
...
4.6 4.6 6 6 6.1 6.4 [X] Dell Latitude 7285 Intel Core i5-7Y57 1.2GHz
HD Graphics 615
min:
4 fps, max:
45.2 fps
6.7 [X] Huawei Matebook E Intel Core i5-7Y54 1.2GHz
HD Graphics 615
7.9 [X] Acer Swift 7 SF714-51T Intel Core i7-7Y75 1.3GHz
HD Graphics 615
~ 6 fps
+ Compare
- Hide Comparison
Intel HD Graphics (Bay Trail)
...
Intel HD Graphics 4400
AMD Radeon R4 (Stoney Ridge)
Intel HD Graphics 515
Intel UHD Graphics 615
Intel HD Graphics 520
AMD Radeon R5 M230
AMD Radeon HD 8650G + HD 8570M Dual Graphics
Intel HD Graphics 530
...
max:
» With most tested laptops playable in detail settings low.
...
Intel HD Graphics 5000
Intel HD Graphics 510
Intel Iris Graphics 5100
Intel UHD Graphics 615
AMD Radeon R5 M330
AMD Radeon R5 M335
AMD Radeon R5 M320
AMD FirePro M4100
AMD Radeon R6 (Carrizo)
AMD Radeon HD 8550G
AMD Radeon R5 M240
...
...
Intel HD Graphics 510
AMD Radeon R5 M230
Intel HD Graphics 5000
Intel UHD Graphics 615
AMD Radeon R5 M330
AMD Radeon R5 M320
AMD Radeon HD 8550G
...
...
Intel HD Graphics 5000
Intel HD Graphics 515
Intel HD Graphics 510
AMD Radeon R5 M230
Intel Iris Graphics 5100
AMD Radeon HD 8550G
Intel UHD Graphics 615
AMD Radeon R6 (Carrizo)
NVIDIA GeForce GT 720M
...
» With all tested laptops playable in detail settings low.
...
AMD Radeon R5 M330
Intel HD Graphics 515
AMD Radeon HD 8550G + HD 8670M Dual Graphics
AMD Radeon HD 8650G + HD 8570M Dual Graphics
AMD Radeon HD 8650G + HD 8670M Dual Graphics
Intel HD Graphics 5000
AMD Radeon HD 8350G
AMD Radeon R7 M260
AMD Radeon RX Vega 6 (Ryzen 2000/3000)
AMD Radeon R5 M230
NVIDIA GeForce GT 720M
AMD Radeon R5 M240
...
max:
NVIDIA GeForce GTX 1080 (Desktop)
...
Intel HD Graphics 4400
AMD Radeon HD 8450G + Radeon HD 8570M Dual Graphics
AMD Radeon R5 M330
AMD Radeon HD 8350G
AMD Radeon HD 8650G + HD 8670M Dual Graphics
AMD Radeon HD 8550G + HD 8670M Dual Graphics
Intel HD Graphics 515
Intel HD Graphics 5000
AMD Radeon R5 M240
AMD Radeon R7 M260
NVIDIA GeForce GT 720M
...
max:
NVIDIA GeForce GTX 1080 (Desktop)
» The benchmarks indicate that the game is not playable in the tested settings.
...
AMD Radeon HD 6620G + HD 7670M Dual Graphics
AMD Radeon R6 M255DX
AMD Radeon HD 7640G + HD 7610M Dual Graphics
AMD Radeon HD 8550G + HD 8750M Dual Graphics
AMD Radeon HD 8850M
AMD Radeon HD 8650G
AMD Radeon R7 M260
Intel HD Graphics 5000
AMD Radeon HD 8550G + HD 8670M Dual Graphics
AMD Radeon HD 8550G
AMD Radeon HD 8650G + HD 8670M Dual Graphics
AMD FirePro M4100
...
...
Intel HD Graphics 4200
AMD Radeon HD 8330
AMD Radeon HD 8650G + HD 8570M Dual Graphics
Intel HD Graphics 4400
Intel HD Graphics 5000
AMD Radeon R5 M240
AMD Radeon HD 6620G + HD 7670M Dual Graphics
AMD Radeon R6 M255DX
AMD Radeon HD 8850M
...
...
AMD Radeon HD 8330
Intel HD Graphics 5000
Intel Iris Graphics 5100
NVIDIA GeForce GT 720M
AMD Radeon R6 M255DX
AMD Radeon HD 8550G + HD 8670M Dual Graphics
AMD Radeon HD 8650G + HD 8570M Dual Graphics
AMD Radeon R5 M240
...
» The benchmarks indicate that the game is not playable in the tested settings.
...
Intel HD Graphics 515
AMD Radeon R8 M365DX
Intel UHD Graphics Xe G4 48EUs
AMD Radeon R7 M360
AMD Radeon RX Vega 6 (Ryzen 2000/3000)
Intel UHD Graphics 615
AMD Radeon HD 8550G + HD 8670M Dual Graphics
NVIDIA GeForce GT 720M
AMD Radeon R5 M335
Apple M1 7-Core GPU
Intel HD Graphics 520
...
NVIDIA GeForce GTX 1050 Max-Q
Intel Graphics Media Accelerator (GMA) 4500MHD
...
AMD Radeon HD 8400
Intel HD Graphics 4400
Intel HD Graphics 515
Intel UHD Graphics 615
AMD Radeon R6 (Carrizo)
AMD Radeon R5 M335
Intel UHD Graphics Xe G4 48EUs
AMD Radeon R5 M330
Intel HD Graphics 520
...
NVIDIA GeForce GTX 1050 Max-Q
Intel Graphics Media Accelerator (GMA) 4500MHD
...
NVIDIA GeForce 910M
Intel HD Graphics 515
AMD Radeon HD 8650G
Intel UHD Graphics 615
AMD Radeon HD 8650G + HD 8570M Dual Graphics
AMD Radeon R7 (Carrizo)
AMD Radeon R5 M335
Intel HD Graphics 520
AMD Radeon R6 (Carrizo)
AMD Radeon R5 M330
Intel UHD Graphics Xe G4 48EUs
Intel Iris Graphics 5100
...
NVIDIA GeForce GTX 780M SLI
...
AMD Radeon R4 (Kaveri)
NVIDIA GeForce G210M
AMD Radeon HD 8400
Intel HD Graphics 515
AMD Radeon R7 (Carrizo)
Intel UHD Graphics Xe G4 48EUs
Intel HD Graphics 520
AMD Radeon R5 M335
NVIDIA GeForce 910M
Intel UHD Graphics G1 (Ice Lake 32 EU)
...
NVIDIA GeForce GTX 780M SLI
max:
AMD Radeon RX 480 (Desktop)
» With all tested laptops playable in detail settings high.
...
AMD Radeon R5 (Bristol Ridge)
AMD Radeon R7 (Carrizo)
AMD Radeon R5 M240
NVIDIA GeForce 910M
Intel UHD Graphics 615
Intel HD Graphics 5000
...
...
AMD Radeon HD 8450G
AMD Radeon R4 (Stoney Ridge)
Intel HD Graphics 4400
AMD Radeon R6 (Carrizo)
AMD Radeon R5 (Bristol Ridge)
Intel UHD Graphics 615
AMD Radeon HD 8450G + Radeon HD 8570M Dual Graphics
AMD Radeon R7 (Carrizo)
...
Intel HD Graphics (Bay Trail)
...
AMD Radeon HD 8450G
AMD Radeon R4 (Stoney Ridge)
Intel HD Graphics 4400
AMD Radeon R5 M230
AMD Radeon HD 8450G + Radeon HD 8570M Dual Graphics
Intel HD Graphics 5000
AMD Radeon R6 M255DX
...
Intel HD Graphics (Bay Trail)
...
Intel HD Graphics 4400
AMD Radeon R5 M230
Intel HD Graphics 5000
Intel UHD Graphics 615
AMD Radeon R7 (Carrizo)
AMD Radeon R5 M335
Intel HD Graphics 515
AMD Radeon R6 M255DX
AMD Radeon R6 M340DX
...
NVIDIA GeForce GTX 1080 Mobile
max:
» With all tested laptops playable in detail settings med..
...
AMD Radeon R7 (Carrizo)
AMD Radeon HD 8350G
AMD Radeon HD 7640G + HD 7610M Dual Graphics
AMD Radeon R5 M240
AMD Radeon HD 8550G + HD 8670M Dual Graphics
AMD Radeon R5 (Bristol Ridge)
Intel HD Graphics 520
AMD Radeon R6 M255DX
...
...
AMD Radeon R2 (Stoney Ridge)
AMD Radeon R4 (Stoney Ridge)
AMD Radeon HD 8610G
Intel HD Graphics 5000
Intel HD Graphics 515
Intel Iris Graphics 5100
...
...
AMD Radeon HD 8250
AMD Radeon HD 8210
Intel HD Graphics (Haswell)
Intel UHD Graphics 605
AMD Radeon HD 8330
Intel UHD Graphics 600
Intel HD Graphics 4400
AMD Radeon HD 8610G
...
» With all tested laptops playable in detail settings low.
...
AMD Radeon HD 8280
AMD Radeon HD 8450G
AMD Radeon HD 8330
AMD Radeon HD 8450G + Radeon HD 8570M Dual Graphics
AMD Radeon HD 8400
Intel HD Graphics (Haswell)
Intel HD Graphics 520
NVIDIA GeForce GT 745M
NVIDIA GeForce 9400M (G) / ION (LE)
...
AMD FirePro M5100
...
ATI Mobility Radeon HD 4650
Intel HD Graphics 5000
AMD Radeon R5 M230
NVIDIA GeForce 9600M GT
Intel HD Graphics 630
NVIDIA GeForce GT 130M
Intel HD Graphics 4400
Intel HD Graphics 520
NVIDIA GeForce GT 745M
AMD Radeon RX Vega 8 (Ryzen 2000/3000)
...
AMD FirePro M6100
Intel Graphics Media Accelerator (GMA) 4500M
...
NVIDIA GeForce GTX 260M
NVIDIA GeForce GTX 280M SLI
Intel Iris Pro Graphics 5200
NVIDIA Quadro K1100M
Intel Iris Graphics 540
AMD Radeon RX Vega 7
AMD FirePro W4170M
NVIDIA Quadro K2100M
NVIDIA GeForce GT 745M
AMD FirePro M5100
...
Intel HD Graphics (Bay Trail)
AMD Radeon HD 8400
Intel HD Graphics 4400
Intel HD Graphics 5000
...
» With all tested laptops playable in detail settings high.
For more games that might be playable and a list of all games and graphics cards visit our Gaming List
v1.26
log 21. 03:37:29
#0 no ids found in url (should be separated by "_") +0s ... 0s
#1 not redirecting to Ajax server +0s ... 0s
#2 did not recreate cache, as it is less than 5 days old! Created at Fri, 19 Apr 2024 05:40:26 +0200 +0.001s ... 0.001s
#3 no comparison url found in template nbc.compare_page_1 needed +0.067s ... 0.068s
#4 no comparison url found in template nbc.compare_page_1 needed +0s ... 0.068s
#5 no comparison url found in template nbc.compare_page_1 needed +0s ... 0.069s
#6 no comparison url found in template nbc.compare_page_1 needed +0s ... 0.069s
#7 no comparison url found in template nbc.compare_page_1 needed +0s ... 0.069s
#8 no comparison url found in template nbc.compare_page_1 needed +0s ... 0.069s
#9 no comparison url found in template nbc.compare_page_1 needed +0s ... 0.069s
#10 no comparison url found in template nbc.compare_page_1 needed +0s ... 0.07s
#11 no comparison url found in template nbc.compare_page_1 needed +0s ... 0.07s
#12 no comparison url found in template nbc.compare_page_1 needed +0s ... 0.07s
#13 no comparison url found in template nbc.compare_page_1 needed +0s ... 0.07s
#14 no comparison url found in template nbc.compare_page_1 needed +0s ... 0.07s
#15 composed specs +0s ... 0.07s
#16 did output specs +0s ... 0.07s
#17 start showIntegratedCPUs +0s ... 0.07s
#18 getting avg benchmarks for device 7441 +0.034s ... 0.104s
#19 got single benchmarks 7441 +0.076s ... 0.18s
#20 got avg benchmarks for devices +0s ... 0.18s
#21 min, max, avg, median took s +1.01s ... 1.19s
#22 before gaming benchmark output +0s ... 1.19s
#23 Got 231 rows for game benchmarks. +0.053s ... 1.243s
#24 composed SQL query for gamebenchmarks +0s ... 1.243s
#25 got data and put it in $dataArray +0.063s ... 1.306s
#26 benchmarks composed for output. +1.862s ... 3.168s
#27 no comparison url found in template nbc.compare_page_1 needed +0.004s ... 3.173s
#28 return log +0s ... 3.173s
Notebook reviews with Intel HD Graphics 615 graphics card
联想Yoga Book C930(i5-7Y54, LTE, E-Ink)二合一笔记本评测 新的Yoga Book配备了一块电子墨水屏而,不是一块实体键盘,我们可以认为这是笔记本电脑,平板电脑和电子阅读器的组合。最重要的是,您还可以使用这个多面手来进行数字化文本书写和绘图。该设备与其2016年的前身在设计上基本相同,但提供了许多变化和改进,例如,它提供了更好的性能,但也至少放弃了一个功能。2018年的Yoga...
Intel Core i5-7Y54 | Intel HD Graphics 615 | 10.80" | 778 g
微软 Surface Pro (2017) (Core m3, 128GB, 4GB) 变形本简短评测 平价Surface!虽然现在已经是2017的下半年了,微软推出的这款节能型酷睿m3处理器笔记本,它的连接性依然需要重做。 快从评测中了解到它的续航能力如何,以及大品牌是否足以吸引用户。...
Intel Core m3-7Y30 | Intel HD Graphics 615 | 12.30" | 1.1 kg
酷比魔方 Thinker Laptop (Core m3-7Y30, 8 GB, 256 GB) 笔记本电脑简短评测 经济版Surface 笔记本电脑。 来自远东的笔记本电脑已经越来越好,至少在他们的外观和特色方面是。其中一个中国高端机代表是酷比魔方Thinker,它配有优雅的铝合金外壳和Surface一样的屏幕。但是,性能能否和店面里的介绍一样?...
Intel Core m3-7Y30 | Intel HD Graphics 615 | 13.50" | 1.7 kg
苹果 MacBook 12 (2017) 笔记本电脑简短评测 有新变化? 就像是更新后的Air 13那样,MacBook 12拥有一个新的处理器和更快的固态硬盘。苹果的目标是“超前”。 “是和谁或是什么作比较呢?”你可能会问。或许是和设计要素还停留在2012年的Air 13相比。那么它是成功的,某些方面的成功。...
Intel Core m3-7Y32 | Intel HD Graphics 615 | 12.00" | 920 g
联想 ThinkPad X1 Tablet Gen 2 (i5-7Y54) 平板电脑简短评测 进步而非革新。 联想的ThinkPad X1 Tablet第一代表现十分不错,但也存在不少问题。一年之后的这个最新版本得到了芯片组和其他一部分硬件的升级。不过这足够让它保持竞争力吗?...
Intel Core i5-7Y54 | Intel HD Graphics 615 | 12.00" | 1.1 kg
Dell XPS 13 9365-4537 2-in-1 : Intel Core i5-7Y54, 13.30", 1.2 kgReview » 戴尔 XPS 13 9365 (7Y54, QHD+) 变形本简短评测
Dell XPS 13-9365 2-in-1 : Intel Core i7-7Y75, 13.30", 1.2 kgReview » 戴尔 XPS 13 9365 2-in-1 变形本简短评测
Acer Swift 7 SF713-51 : Intel Core i5-7Y54, 13.30", 1.1 kgReview » 宏碁 Swift 7 SF713-51 笔记本电脑简短评测
Acer Spin 7 SP714-51-M09D : Intel Core i5-7Y54, 14.00", 1.3 kgReview » 宏碁 Spin 7 SP714-51-M09D 变形本简短评测
Chuwi UBook XPro : Intel Core i7-7Y75, 13.00", 0.9 kgExternal Review » Chuwi UBook XPro
Asus Chromebook C425TA-H50039 : Intel Pentium Gold 4415Y, 14.00", 1.3 kgExternal Review » Asus Chromebook C425TA-H50039
Acer Swift 7 SF714-51T-M4JV : Intel Core i7-7Y75, 14.00", 1.2 kgExternal Review » Acer Swift 7 SF714-51T-M4JV
Acer Swift 7 SF714-51T-M3EW : Intel Core i7-7Y75, 14.00", 1.2 kgExternal Review » Acer Swift 7 SF714-51T-M3EW
Microsoft Surface Pro (2017) m3 : Intel Core m3-7Y30, 12.30", 1.1 kgExternal Review » Microsoft Surface Pro (2017) m3
Acer Swift 7 SF714-51T-M16F : Intel Core i7-7Y75, 14.00", 1.2 kgExternal Review » Acer Swift 7 SF714-51T-M16F
Asus VivoBook Flip 14 TP401CA-EC067T : Intel Core m3-7Y30, 14.00", 1.5 kgExternal Review » Asus VivoBook Flip 14 TP401CA-EC067T
Asus VivoBook Flip 14 TP401CA-DHM4T : Intel Core m3-7Y30, 14.00", 1.5 kgExternal Review » Asus VivoBook Flip 14 TP401CA-DHM4T
Acer Swift 7 Sf714-51t-m64v : Intel Core i7-7Y75, 14.00", 1.2 kgExternal Review » Acer Swift 7 Sf714-51t-m64v
Lenovo Yoga Book C930 YB-J912F : Intel Core i5-7Y54, 10.80", 0.8 kgExternal Review » Lenovo Yoga Book C930 YB-J912F
Samsung Chromebook Plus XE521QAB-K01US : Intel Celeron 3965Y, 12.20", 1.3 kgExternal Review » Samsung Chromebook Plus XE521QAB-K01US
Microsoft Surface Go MCZ-00002 : Intel Pentium Gold 4415Y, 10.00", 0.5 kgExternal Review » Microsoft Surface Go MCZ-00002
HP Chromebook x2 12-f015nr : Intel Core m3-7Y30, 12.30", 1.4 kgExternal Review » HP Chromebook x2 12-f015nr
Asus VivoBook Flip 14 TP401CA-EC011T : Intel Core m3-7Y30, 14.00", 1.6 kgExternal Review » Asus VivoBook Flip 14 TP401CA-EC011T
Wortmann Terra Pad 1270 : Intel Core i5-7Y54, 12.10", 0.8 kgExternal Review » Wortmann Terra Pad 1270
Asus VivoBook Flip 14 TP401CA-DHM6T : Intel Core m3-7Y30, 14.00", 1.5 kgExternal Review » Asus VivoBook Flip 14 TP401CA-DHM6T
Chuwi CoreBook 13 : Intel Core m3-7Y30, 13.30", 1.1 kgExternal Review » Chuwi CoreBook 13
Teclast F6 Pro : Intel Core m3-7Y30, 13.30", 1.4 kgExternal Review » Teclast F6 Pro
Acer Swift 7 SF714-51T : Intel Core i7-7Y75, 14.00", 1.2 kgExternal Review » Acer Swift 7 SF714-51T
Dell Latitude 7285-8718 : Intel Core i5-7Y57, 12.30", 1.4 kgExternal Review » Dell Latitude 7285-8718
Asus Zenbook UX330CA-FC106T : Intel Core m3-7Y30, 13.30", 1.2 kgExternal Review » Asus Zenbook UX330CA-FC106T
Google Pixelbook : Intel Core i5-7Y57, 12.30", 1.3 kgExternal Review » Google Pixelbook
Dell Latitude 7285 : Intel Core i5-7Y57, 12.30", 1.4 kgExternal Review » Dell Latitude 7285
Lenovo ThinkPad X1 Tablet 2017, Core i5-7Y57 : unknown, 12.00", 1.1 kgExternal Review » Lenovo ThinkPad X1 Tablet 2017, Core i5-7Y57
Acer Swift 7 SF713-51-M8MF : Intel Core i5-7Y54, 13.30", 1.1 kgExternal Review » Acer Swift 7 SF713-51-M8MF
Cube i35 Thinker : Intel Core m3-7Y30, 13.50", 1.7 kgExternal Review » Cube i35 Thinker
Samsung Galaxy Book 10.6 W627N LTE : Intel Core m3-7Y30, 10.60", 0.6 kgExternal Review » Samsung Galaxy Book 10.6 W627N LTE
Lenovo ThinkPad X1 Tablet 2017, Core i7-7Y75 : Intel Core i7-7Y75, 12.00", 1.1 kgExternal Review » Lenovo ThinkPad X1 Tablet 2017, Core i7-7Y75
Apple MacBook 12 2017 : Intel Core m3-7Y32, 12.00", 0.9 kgExternal Review » Apple MacBook 12 2017
Huawei Matebook E : Intel Core i5-7Y54, 12.10", 1.1 kgExternal Review » Huawei Matebook E
Microsoft Surface Pro (2017) m3 : Intel Core m3-7Y32, 12.30", 0.8 kgExternal Review » Microsoft Surface Pro (2017)
Dell XPS 13 9365-4537 2-in-1 : Intel Core i5-7Y54, 13.30", 1.2 kgExternal Review » Dell XPS 13 9365-4537
Acer Swift 7 SF713-51-M90J : Intel Core i5-7Y54, 13.30", 1.1 kgExternal Review » Acer Swift 7 SF713-51-M90J
Lenovo Yoga 710-11IKB-80V6001RGE : Intel Core m3-7Y30, 11.60", 1 kgExternal Review » Lenovo Yoga 710-11IKB-80V6001RGE
Dell Inspiron 11 3179 : Intel Core m3-7Y30, 11.60", 1.4 kgExternal Review » Dell Inspiron 11 3179
Acer Swift 7 SF713-51-M2SB : Intel Core i5-7Y54, 13.30", 1.1 kgExternal Review » Acer Swift 7 SF713-51-M2SB
Asus Zenbook Flip UX360CA-C4171T : Intel Core m3-7Y30, 13.30", 1.3 kgExternal Review » Asus Zenbook Flip UX360CA-C4171T
Cube Mix Plus : Intel Core m3-7Y30, 10.60", 0.7 kgExternal Review » Cube Mix Plus
Dell XPS 13 9365-4544 2-in-1 : Intel Core i7-7Y75, 13.30", 1.2 kgExternal Review » Dell XPS 13 9365-4544 2-in-1
HP Pro x2 612 G2 : Intel Core m3-7Y30, 12.10", 1.2 kgExternal Review » HP Pro x2 612 G2
Lenovo ThinkPad X1 Tablet 2017 : Intel Core m3-7Y30, 12.20", 1.1 kgExternal Review » Lenovo ThinkPad X1 Tablet 2017
Dell XPS 13-9365 2-in-1 : Intel Core i7-7Y75, 13.30", 1.2 kgExternal Review » Dell XPS 13-9365
Acer Swift 7 SF713-51-M2LH : Intel Core i5-7Y54, 13.30", 1.1 kgExternal Review » Acer Swift 7 SF713-51-M2LH
Acer Spin 7 SP714-51-M37P : Intel Core i7-7Y75, 14.00", 1.6 kgExternal Review » Acer Spin 7 SP714-51-M37P
Asus Transformer 3 T305CA-GW019T : Intel Core m3-7Y30, 12.60", 0.7 kgExternal Review » Asus Transformer 3 T305CA-GW019T
Acer Spin 7 SP714-51-M339 : Intel Core i5-7Y54, 14.00", 1.3 kgExternal Review » Acer Spin 7 SP714-51-M339
Dell XPS 13 2-in-1 : Intel Core i5-7Y54, 13.30", 1.2 kgExternal Review » Dell XPS 13 2-in-1
Acer Spin 7 SP714-51-M4YD : Intel Core i7-7Y75, 14.00", 1.3 kgExternal Review » Acer Spin 7 SP714-51-M4YD
Asus Zenbook UX360CA-C4172T : Intel Core i5-7Y54, 13.30", 1.3 kgExternal Review » Asus Zenbook UX360CA-C4172T
Acer Spin 7 SP714-51-M09D : Intel Core i5-7Y54, 14.00", 1.3 kgExternal Review » Acer Spin 7 SP714-51-M09D
Acer Aspire R14 R7-471T-M613 : Intel Core i7-7Y75, 14.00", 1.2 kgExternal Review » Acer Aspire R14 R7-471T-M613
Asus Transformer 3 T305CA-GW015T : Intel Core m3-7Y30, 12.60", 0.7 kgExternal Review » Asus Transformer 3 T305CA-GW015T
Acer Spin 7 SP714-51-M6LT : Intel Core i7-7Y75, 14.00", 1.6 kgExternal Review » Acer Spin 7 SP714-51-M6LT
Acer Swift 7 SF713-51 : Intel Core i5-7Y54, 13.30", 1.1 kgExternal Review » Acer Swift 7 SF713-51
Please share our article, every link counts!
» Comparison of GPUs
» Benchmark List
» Notebook Gaming List
Class 1 GeForce RTX 2080 Super Mobile
Class 2 M1 Max 32-Core GPU *
GeForce RTX 2070 Super Mobile
M1 Max 24-Core GPU *
Quadro RTX 5000 Max-Q
Radeon RX 5700M *
GeForce GTX 1080 Mobile
Quadro RTX 4000 (Laptop)
M1 Pro 16-Core GPU *
Radeon PRO W6600M *
GeForce RTX 2070 Super Max-Q
Quadro RTX 4000 Max-Q *
M1 Pro 14-Core GPU *
Quadro P5200
Quadro RTX 3000 Max-Q *
Quadro P4200
Quadro P5000 Max-Q *
GeForce GTX 980 (Laptop)
Quadro P4000
Quadro P4000 Max-Q
Quadro P3200
Radeon RX 580X (Laptop) *
Radeon RX 580 (Laptop)
Radeon Pro 5300M
Radeon RX 5300M
Quadro P3000 Max-Q *
Quadro T2000 Max-Q *
Radeon Pro WX 7100 *
Radeon RX 570X (Laptop) *
Radeon RX 570 (Laptop) *
Radeon RX 470 (Laptop) *
Quadro T1000 Max-Q *
Class 3 Vega M GH
Quadro M5000M
GeForce GTX 1050 Ti Mobile
Radeon 680M
Quadro P2000
Quadro P2000 Max-Q
Quadro M4000M
T500 Laptop GPU *
Radeon R9 M395X
GeForce GTX 1050 Ti Max-Q *
Radeon Pro Vega 16
WX Vega M GL
Radeon R9 M485X
Quadro M3000M
FirePro W7170M
Radeon R9 M395
GeForce GTX 1050 Max-Q *
Radeon 660M
Radeon Pro WX 4150 *
Radeon RX 560X (Laptop)
Radeon RX 560 (Laptop)
Radeon RX 460 (Laptop)
Quadro P1000
Radeon R9 M390
Xe MAX
Radeon Pro 560X
Radeon Pro 560
Radeon Pro 460
Radeon Pro WX 4130 *
GeForce GTX 960M
Quadro P620 *
Radeon RX 550X (Laptop)
Radeon Pro WX 3200 *
Radeon Pro 555X
Radeon Pro 555
Radeon Pro 455
Quadro P600
Quadro M2000M
Radeon RX 540X *
Radeon Pro WX 2100 *
Radeon Pro WX 3100 *
GeForce GTX 950M
Radeon Pro 450
Radeon 630
Radeon 540X *
Radeon R9 M385X
Quadro P520
Quadro M1000M
GeForce 945M
Quadro P500 *
Iris Plus Graphics G7 (Ice Lake 64 EU) *
Vega 10 *
Iris Pro Graphics 580
FirePro W5170M *
Radeon R9 M370X
Vega 9
FirePro W5130M
UHD Graphics Xe G4 48EUs *
UHD Graphics 32EUs
UHD Graphics Xe 32EUs (Tiger Lake-H) *
UHD Graphics 750
Vega 7
Radeon R7 M465
Iris Pro Graphics 6200
Vega 8
GeForce 940M
Iris Plus Graphics G4 (Ice Lake 48 EU)
Quadro M600M
FirePro W4190M
Radeon R9 M375
Radeon R7 M445
Iris Plus Graphics 650
Iris Graphics 550
Radeon 625
Vega 6 *
Iris Plus Graphics 640
Iris Graphics 540
UHD Graphics 24EUs (Alder Lake-N) *
Radeon R7 M360
GeForce 920M
Radeon 620
Radeon R7 M340
Radeon 610
Radeon 610M *
Vega 6 *
UHD Graphics G1 (Ice Lake 32 EU)
UHD Graphics Xe 16EUs (Tiger Lake-H) *
HD Graphics 530
Radeon R5 (Bristol Ridge)
Adreno 690 *
Adreno 685 *
Adreno 680 *
Radeon R5 M330
GeForce 910M
HD Graphics 520
Class 4 UHD Graphics 730
Radeon R5 M320 *
Radeon R5 M315 *
Radeon R5 M420 *
Vega 2 *
UHD Graphics 617
UHD Graphics 615
HD Graphics 515
UHD Graphics 610
HD Graphics 510
UHD Graphics 605
Radeon R4 (Stoney Ridge)
Radeon R2 (Stoney Ridge)
HD Graphics (Broadwell)
UHD Graphics 600
HD Graphics (Braswell)
Class 5 * Approximate position of the graphics adapter
Klaus Hinum (Update: 2016-09-25)
 Deutsch
 English
 Español
 Français
 Italiano
 Nederlands
 Polski
 Português
 Русский
 Türkçe
 Svenska
 Chinese
 Magyar