 Deutsch
 English
 Español
 Français
 Italiano
 Nederlands
 Polski
 Português
 Русский
 Türkçe
 Svenska
 Chinese
 Magyar
戴尔 Inspiron 15 7558 变形本简短评测

| |||||||||||||||||||||||||
Brightness Distribution: 91 %
Center on Battery: 208.6 cd/m²
Contrast: 841:1 (Black: 0.248 cd/m²)
ΔE Color 5.62 | 0.5-29.43 Ø5
ΔE Greyscale 4.44 | 0.57-98 Ø5.3
63.1% sRGB (Argyll 1.6.3 3D)
40.2% AdobeRGB 1998 (Argyll 1.6.3 3D)
43.77% AdobeRGB 1998 (Argyll 2.2.0 3D)
63.5% sRGB (Argyll 2.2.0 3D)
42.35% Display P3 (Argyll 2.2.0 3D)
Gamma: 2.06
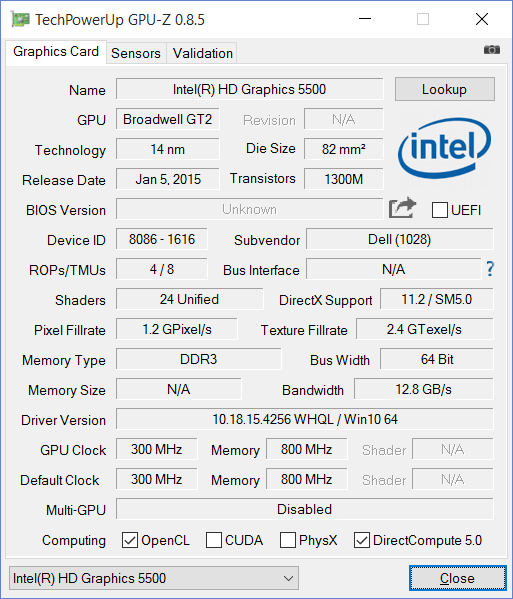
| Dell Inspiron 15 7558 HD Graphics 5500, 5200U, Sandisk X300 SD7SB6S-256G-1012 | Dell Inspiron 15-7548 Radeon R7 M270, 5500U, Liteon IT LCS-256L9S-11 | Dell Inspiron 15-7537 GeForce GT 750M, 4500U, Samsung SSD SM841 256GB MZ7PD256HAFV | Asus Zenbook Pro UX501JW-FI218H GeForce GTX 960M, 4720HQ, SanDisk SD7SN3Q128G1002 | Toshiba Satellite L50-B-1TD Radeon R7 M260, 4510U, Toshiba HG6 THNSNJ256GMCU | |
|---|---|---|---|---|---|
| Display | 34% | 12% | 33% | ||
| Display P3 Coverage | 42.35 | 61.7 46% | 47.47 12% | 61.5 45% | |
| sRGB Coverage | 63.5 | 78.9 24% | 71.5 13% | 78.1 23% | |
| AdobeRGB 1998 Coverage | 43.77 | 57.3 31% | 49.05 12% | 57.1 30% | |
| Response Times | |||||
| Response Time Grey 50% / Grey 80% * | 43.2 ? | ||||
| Response Time Black / White * | 27.2 ? | ||||
| PWM Frequency | |||||
| Screen | -50% | 7% | -21% | -10% | |
| Brightness middle | 208.6 | 214 3% | 271 30% | 302 45% | 299 43% |
| Brightness | 204 | 204 0% | 267 31% | 307 50% | 299 47% |
| Brightness Distribution | 91 | 77 -15% | 84 -8% | 87 -4% | 77 -15% |
| Black Level * | 0.248 | 0.76 -206% | 0.25 -1% | 0.79 -219% | 0.54 -118% |
| Contrast | 841 | 282 -66% | 1084 29% | 382 -55% | 554 -34% |
| Colorchecker dE 2000 * | 5.62 | 5.83 -4% | 6.22 -11% | 5.4 4% | 5.96 -6% |
| Greyscale dE 2000 * | 4.44 | 7.17 -61% | 6.72 -51% | 5.99 -35% | 5.52 -24% |
| Gamma | 2.06 107% | 1.94 113% | 2.47 89% | 2.32 95% | 2.29 96% |
| CCT | 5889 110% | 5617 116% | 5736 113% | 6670 97% | 5831 111% |
| Color Space (Percent of AdobeRGB 1998) | 40.2 | 55 37% | 45 12% | 51 27% | |
| Color Space (Percent of sRGB) | 63.1 | 71 13% | |||
| Total Average (Program / Settings) | -50% /
-50% | 21% /
14% | -5% /
-13% | 12% /
2% |
* ... smaller is better
| Cinebench R15 | |
| CPU Single 64Bit (sort by value) | |
| Dell Inspiron 15 7558 | |
| Dell Inspiron 15-7548 | |
| Dell Inspiron 15-7537 | |
| Asus Zenbook Pro UX501JW-FI218H | |
| Toshiba Satellite L50-B-1TD | |
| CPU Multi 64Bit (sort by value) | |
| Dell Inspiron 15 7558 | |
| Dell Inspiron 15-7548 | |
| Dell Inspiron 15-7537 | |
| Asus Zenbook Pro UX501JW-FI218H | |
| Toshiba Satellite L50-B-1TD | |
| Ref. Match 64Bit (sort by value) | |
| Dell Inspiron 15 7558 | |
| Dell Inspiron 15-7548 | |
| Dell Inspiron 15-7537 | |
| Asus Zenbook Pro UX501JW-FI218H | |
| Toshiba Satellite L50-B-1TD | |
| OpenGL 64Bit (sort by value) | |
| Dell Inspiron 15 7558 | |
| Dell Inspiron 15-7548 | |
| Dell Inspiron 15-7537 | |
| Asus Zenbook Pro UX501JW-FI218H | |
| Toshiba Satellite L50-B-1TD | |
| Cinebench R10 | |
| Shading 64Bit (sort by value) | |
| Dell Inspiron 15 7558 | |
| Dell Inspiron 15-7537 | |
| Rendering Multiple CPUs 64Bit (sort by value) | |
| Dell Inspiron 15 7558 | |
| Dell Inspiron 15-7537 | |
| Rendering Single CPUs 64Bit (sort by value) | |
| Dell Inspiron 15 7558 | |
| Dell Inspiron 15-7537 | |
| Shading 32Bit (sort by value) | |
| Dell Inspiron 15 7558 | |
| Dell Inspiron 15-7548 | |
| Dell Inspiron 15-7537 | |
| Asus Zenbook Pro UX501JW-FI218H | |
| Toshiba Satellite L50-B-1TD | |
| Rendering Multiple CPUs 32Bit (sort by value) | |
| Dell Inspiron 15 7558 | |
| Dell Inspiron 15-7548 | |
| Dell Inspiron 15-7537 | |
| Asus Zenbook Pro UX501JW-FI218H | |
| Toshiba Satellite L50-B-1TD | |
| Rendering Single 32Bit (sort by value) | |
| Dell Inspiron 15 7558 | |
| Dell Inspiron 15-7548 | |
| Dell Inspiron 15-7537 | |
| Asus Zenbook Pro UX501JW-FI218H | |
| Toshiba Satellite L50-B-1TD | |
| Cinebench R11.5 | |
| CPU Single 64Bit (sort by value) | |
| Dell Inspiron 15 7558 | |
| Dell Inspiron 15-7548 | |
| Dell Inspiron 15-7537 | |
| Asus Zenbook Pro UX501JW-FI218H | |
| Toshiba Satellite L50-B-1TD | |
| CPU Multi 64Bit (sort by value) | |
| Dell Inspiron 15 7558 | |
| Dell Inspiron 15-7548 | |
| Dell Inspiron 15-7537 | |
| Asus Zenbook Pro UX501JW-FI218H | |
| Toshiba Satellite L50-B-1TD | |
| OpenGL 64Bit (sort by value) | |
| Dell Inspiron 15 7558 | |
| Dell Inspiron 15-7548 | |
| Dell Inspiron 15-7537 | |
| Asus Zenbook Pro UX501JW-FI218H | |
| Toshiba Satellite L50-B-1TD | |
| PCMark 7 Score | 4680 points | |
| PCMark 8 Home Score Accelerated v2 | 2848 points | |
| PCMark 8 Creative Score Accelerated v2 | 3359 points | |
| PCMark 8 Work Score Accelerated v2 | 3876 points | |
Help | ||
| PCMark 8 | |
| Work Score Accelerated v2 (sort by value) | |
| Dell Inspiron 15 7558 | |
| Dell Inspiron 15-7548 | |
| Toshiba Satellite L50-B-1TD | |
| Creative Score Accelerated v2 (sort by value) | |
| Dell Inspiron 15 7558 | |
| Dell Inspiron 15-7548 | |
| Toshiba Satellite L50-B-1TD | |
| Home Score Accelerated v2 (sort by value) | |
| Dell Inspiron 15 7558 | |
| Dell Inspiron 15-7548 | |
| Toshiba Satellite L50-B-1TD | |
| PCMark 7 - Score (sort by value) | |
| Dell Inspiron 15 7558 | |
| Dell Inspiron 15-7548 | |
| Asus Zenbook Pro UX501JW-FI218H | |

| 3DMark 11 Performance | 1174 points | |
| 3DMark Ice Storm Standard Score | 42527 points | |
| 3DMark Cloud Gate Standard Score | 4561 points | |
| 3DMark Fire Strike Score | 618 points | |
Help | ||
| 3DMark 11 | |
| 1280x720 Performance Combined (sort by value) | |
| Dell Inspiron 15 7558 | |
| Dell Inspiron 15-7548 | |
| Dell Inspiron 15-7537 | |
| Asus Zenbook Pro UX501JW-FI218H | |
| Toshiba Satellite L50-B-1TD | |
| 1280x720 Performance Physics (sort by value) | |
| Dell Inspiron 15 7558 | |
| Dell Inspiron 15-7548 | |
| Dell Inspiron 15-7537 | |
| Asus Zenbook Pro UX501JW-FI218H | |
| Toshiba Satellite L50-B-1TD | |
| 1280x720 Performance GPU (sort by value) | |
| Dell Inspiron 15 7558 | |
| Dell Inspiron 15-7548 | |
| Dell Inspiron 15-7537 | |
| Asus Zenbook Pro UX501JW-FI218H | |
| Toshiba Satellite L50-B-1TD | |
| 1280x720 Performance (sort by value) | |
| Dell Inspiron 15 7558 | |
| Dell Inspiron 15-7548 | |
| Dell Inspiron 15-7537 | |
| Asus Zenbook Pro UX501JW-FI218H | |
| Toshiba Satellite L50-B-1TD | |
| 3DMark 06 - 1280x1024 Standard Score AA:0x AF:0x (sort by value) | |
| Dell Inspiron 15-7548 | |
| Dell Inspiron 15-7537 | |
| low | med. | high | ultra | |
| BioShock Infinite (2013) | 29.42 | 18.53 | 14.99 | 4.7 |
Noise Level
| Idle |
| 28.1 / 28.2 / 28.3 dB(A) |
| Load |
| 33.1 / 33.1 dB(A) |
 | ||
30 dB silent 40 dB(A) audible 50 dB(A) loud |
||
min: | ||
(+) The maximum temperature on the upper side is 39.2 °C / 103 F, compared to the average of 35.3 °C / 96 F, ranging from 19.6 to 55.7 °C for the class Convertible.
(-) The bottom heats up to a maximum of 50.4 °C / 123 F, compared to the average of 36.8 °C / 98 F
(+) In idle usage, the average temperature for the upper side is 30 °C / 86 F, compared to the device average of 30.2 °C / 86 F.
(+) The palmrests and touchpad are cooler than skin temperature with a maximum of 31.6 °C / 88.9 F and are therefore cool to the touch.
(-) The average temperature of the palmrest area of similar devices was 28.1 °C / 82.6 F (-3.5 °C / -6.3 F).
| Dell Inspiron 15 7558 HD Graphics 5500, 5200U, Sandisk X300 SD7SB6S-256G-1012 | Dell Inspiron 15-7548 Radeon R7 M270, 5500U, Liteon IT LCS-256L9S-11 | Dell Inspiron 15-7537 GeForce GT 750M, 4500U, Samsung SSD SM841 256GB MZ7PD256HAFV | Asus Zenbook Pro UX501JW-FI218H GeForce GTX 960M, 4720HQ, SanDisk SD7SN3Q128G1002 | Toshiba Satellite L50-B-1TD Radeon R7 M260, 4510U, Toshiba HG6 THNSNJ256GMCU | |
|---|---|---|---|---|---|
| Heat | 1% | 6% | -3% | 0% | |
| Maximum Upper Side * | 39.2 | 43.5 -11% | 51.1 -30% | 46.2 -18% | 45.4 -16% |
| Maximum Bottom * | 50.4 | 54 -7% | 44.6 12% | 52.5 -4% | 57.7 -14% |
| Idle Upper Side * | 31.8 | 29.8 6% | 26.3 17% | 32 -1% | 26.9 15% |
| Idle Bottom * | 36.4 | 31 15% | 27 26% | 32.7 10% | 30.4 16% |
* ... smaller is better
| Dell Inspiron 15 7558 | Dell Inspiron 15-7537 | Dell Inspiron 15-7548 | HP Envy 15-k203ng | Acer Aspire V15 Nitro VN7-571G-574H | Toshiba Satellite L50-B-1TD | |
|---|---|---|---|---|---|---|
| Battery Runtime | -31% | -23% | -2% | 25% | ||
| Reader / Idle | 885 | 727 -18% | 633 -28% | 797 -10% | ||
| WiFi v1.3 | 294 | 264 -10% | 289 -2% | 448 52% | ||
| Load | 120 | 67 -44% | 81 -32% | 161 34% | ||
| WiFi | 392 | 328 | ||||
| H.264 | 238 | 427 |
Pros
Cons
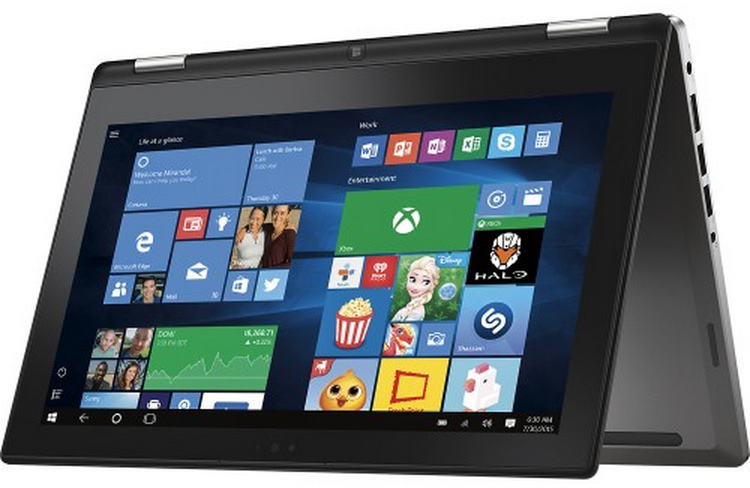
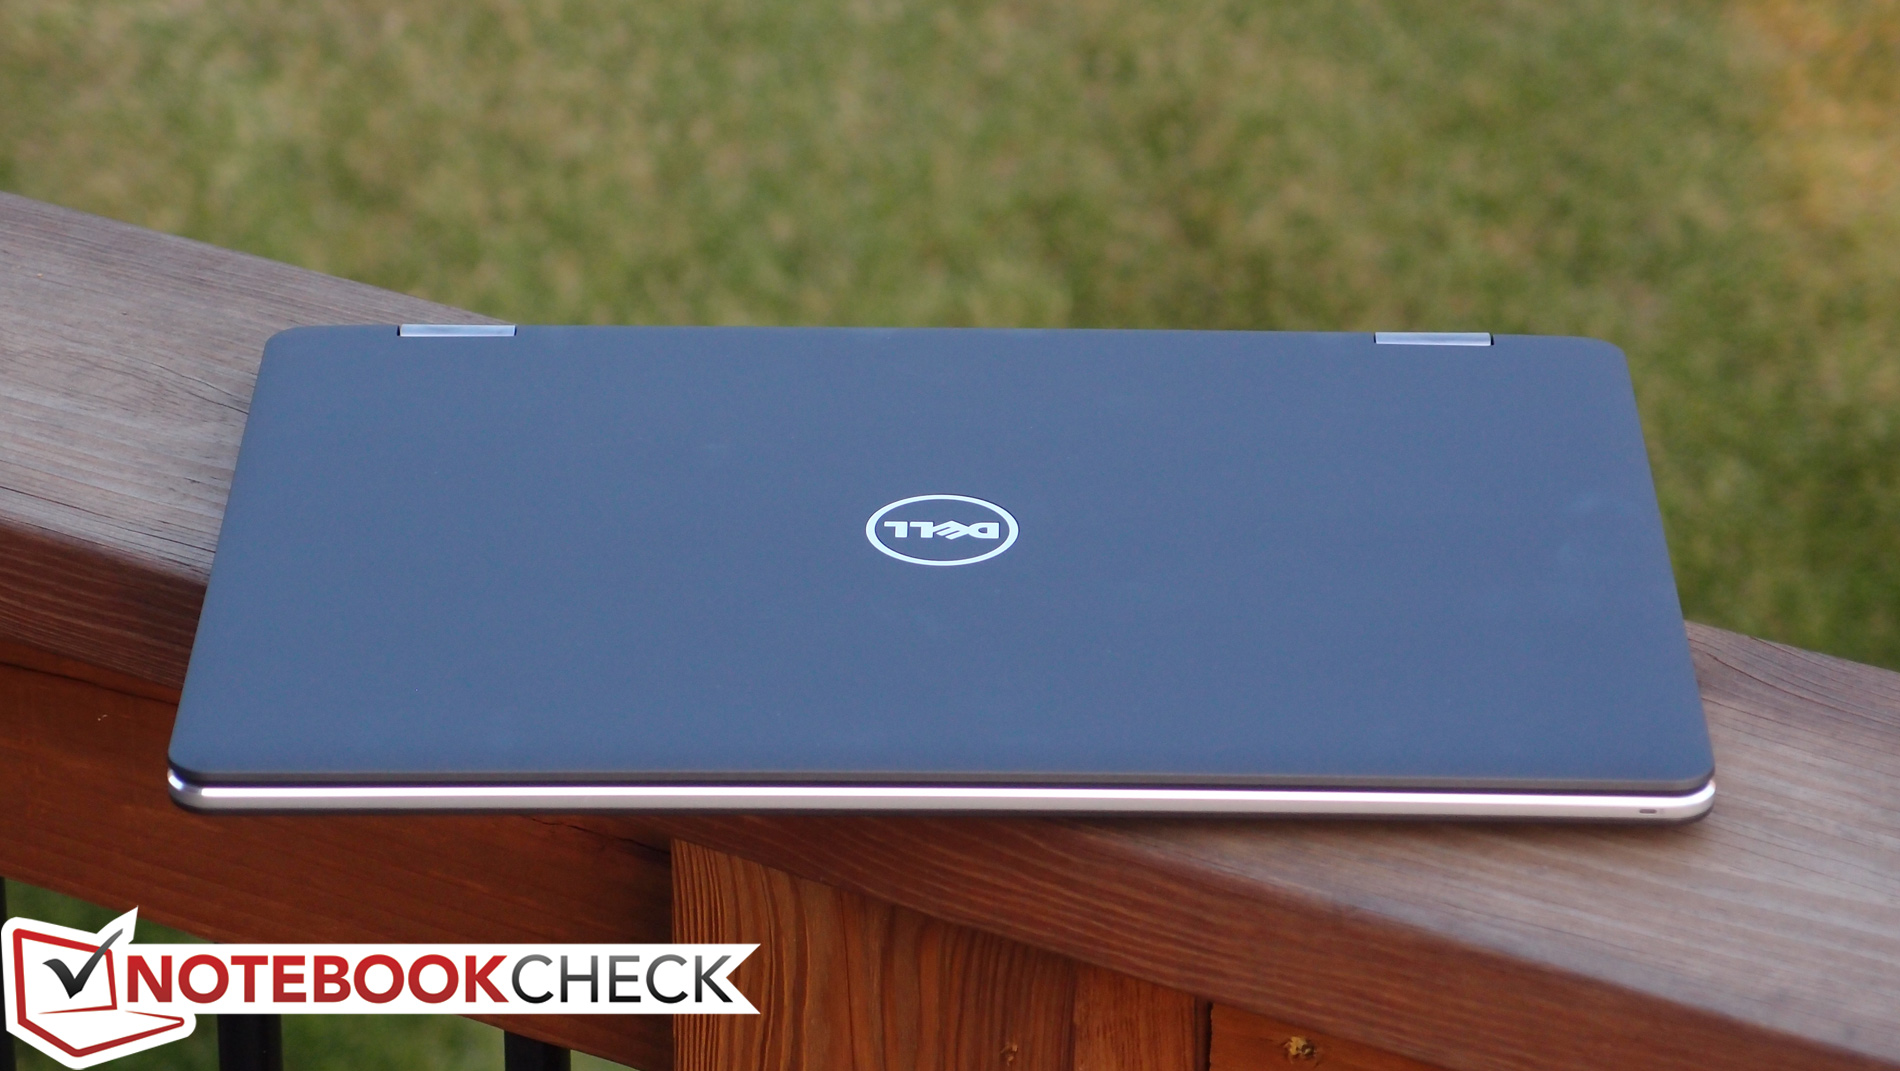
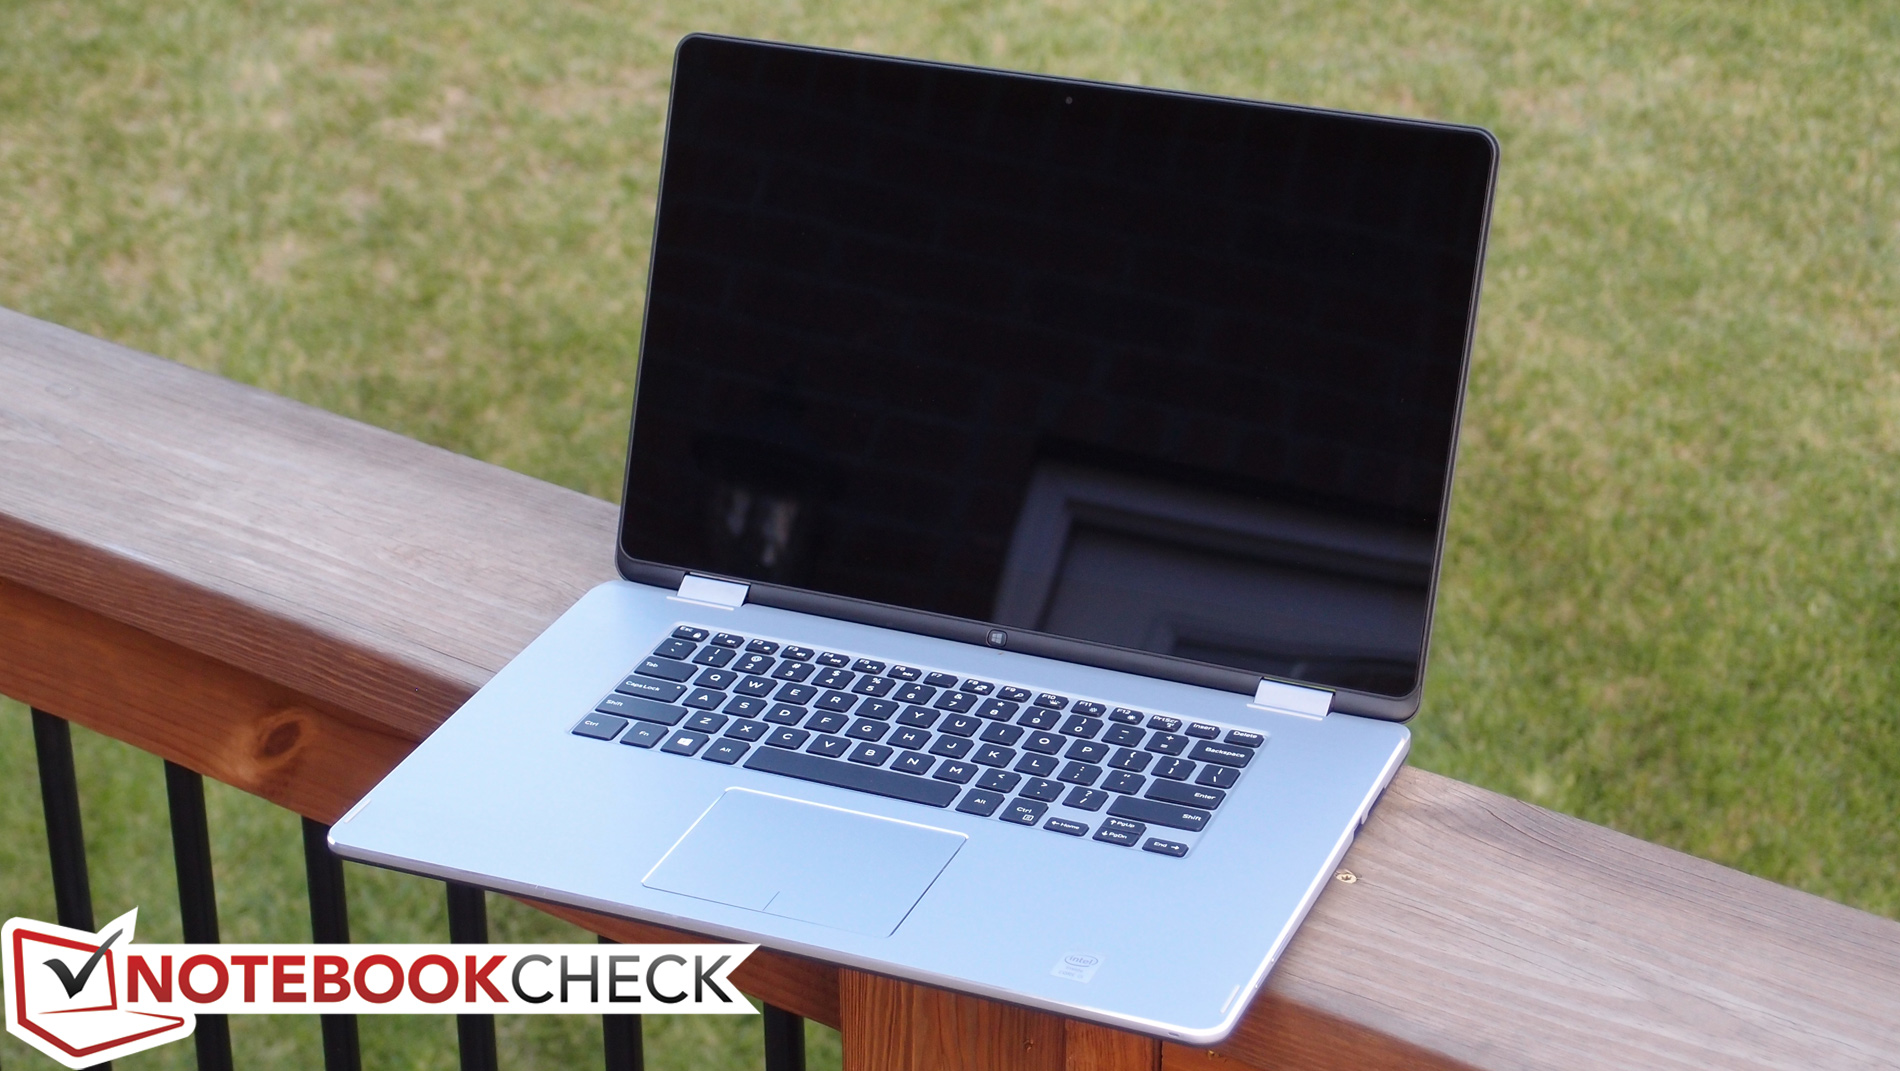
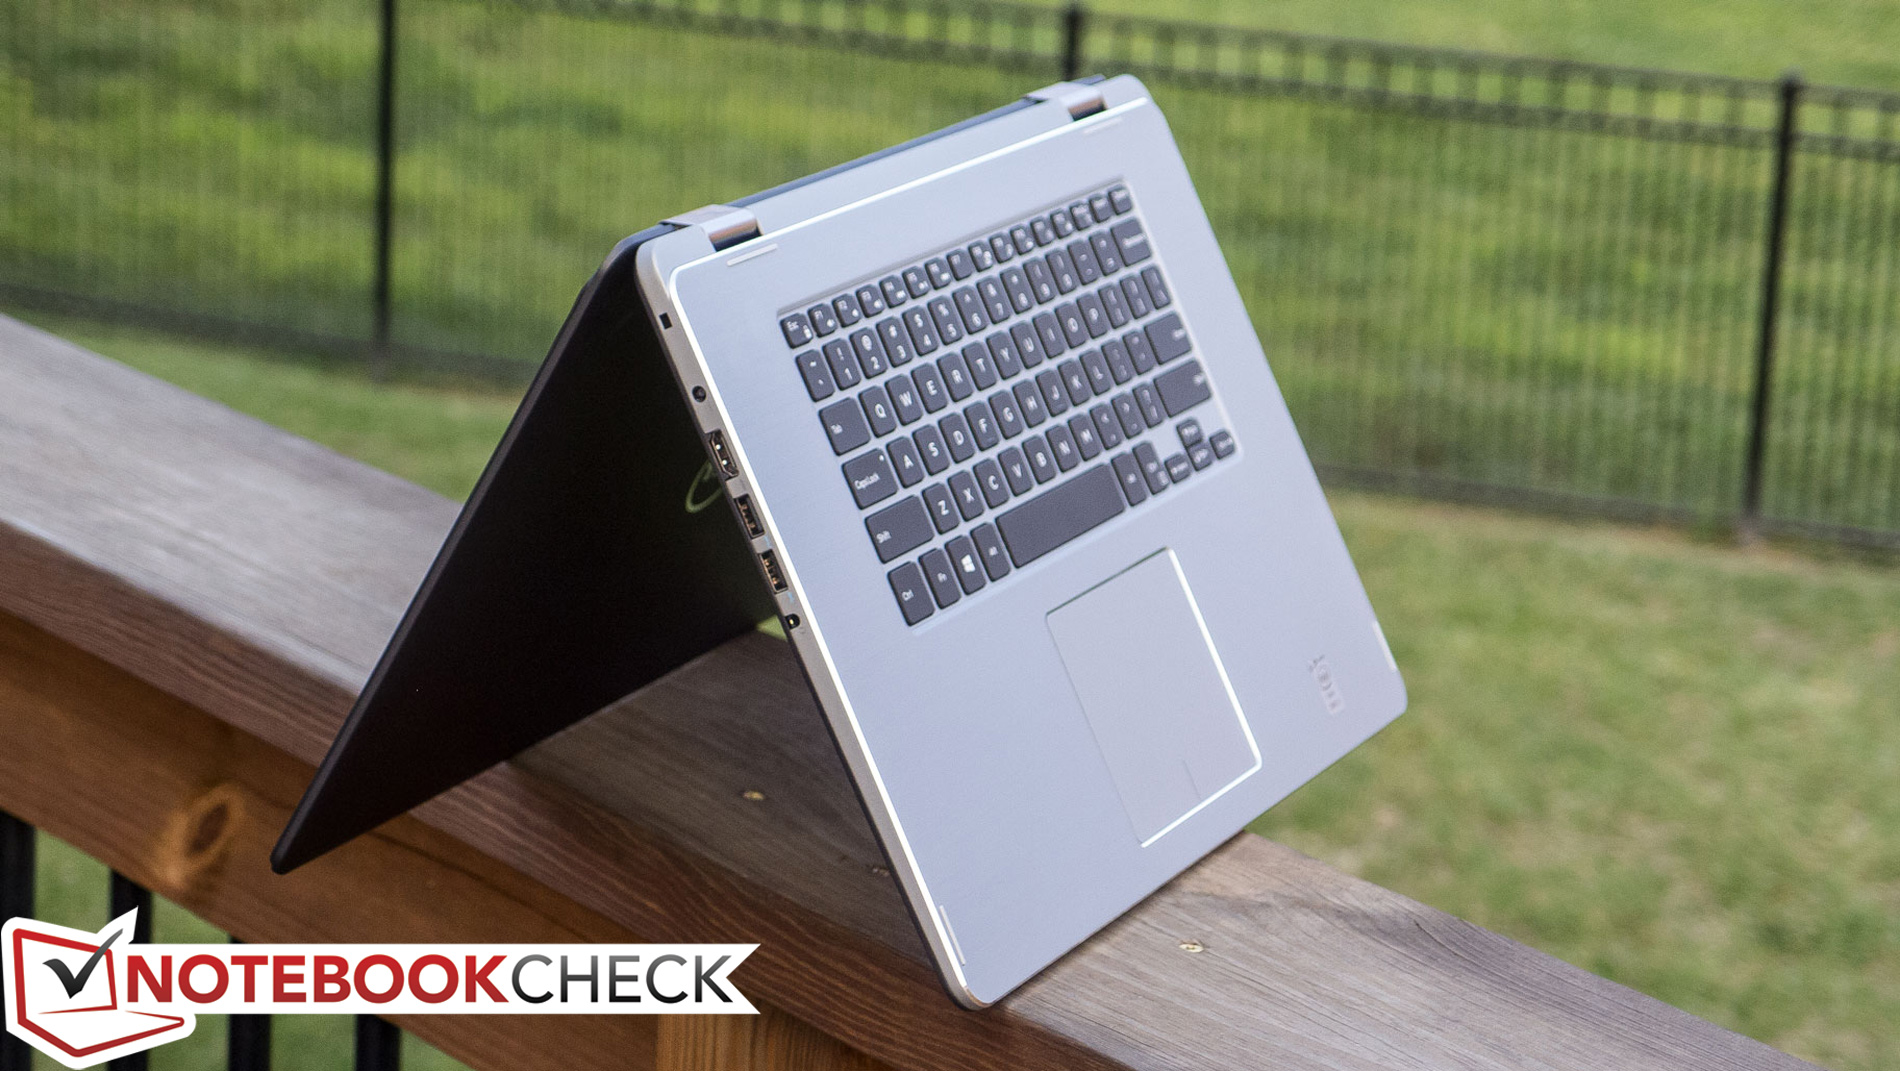
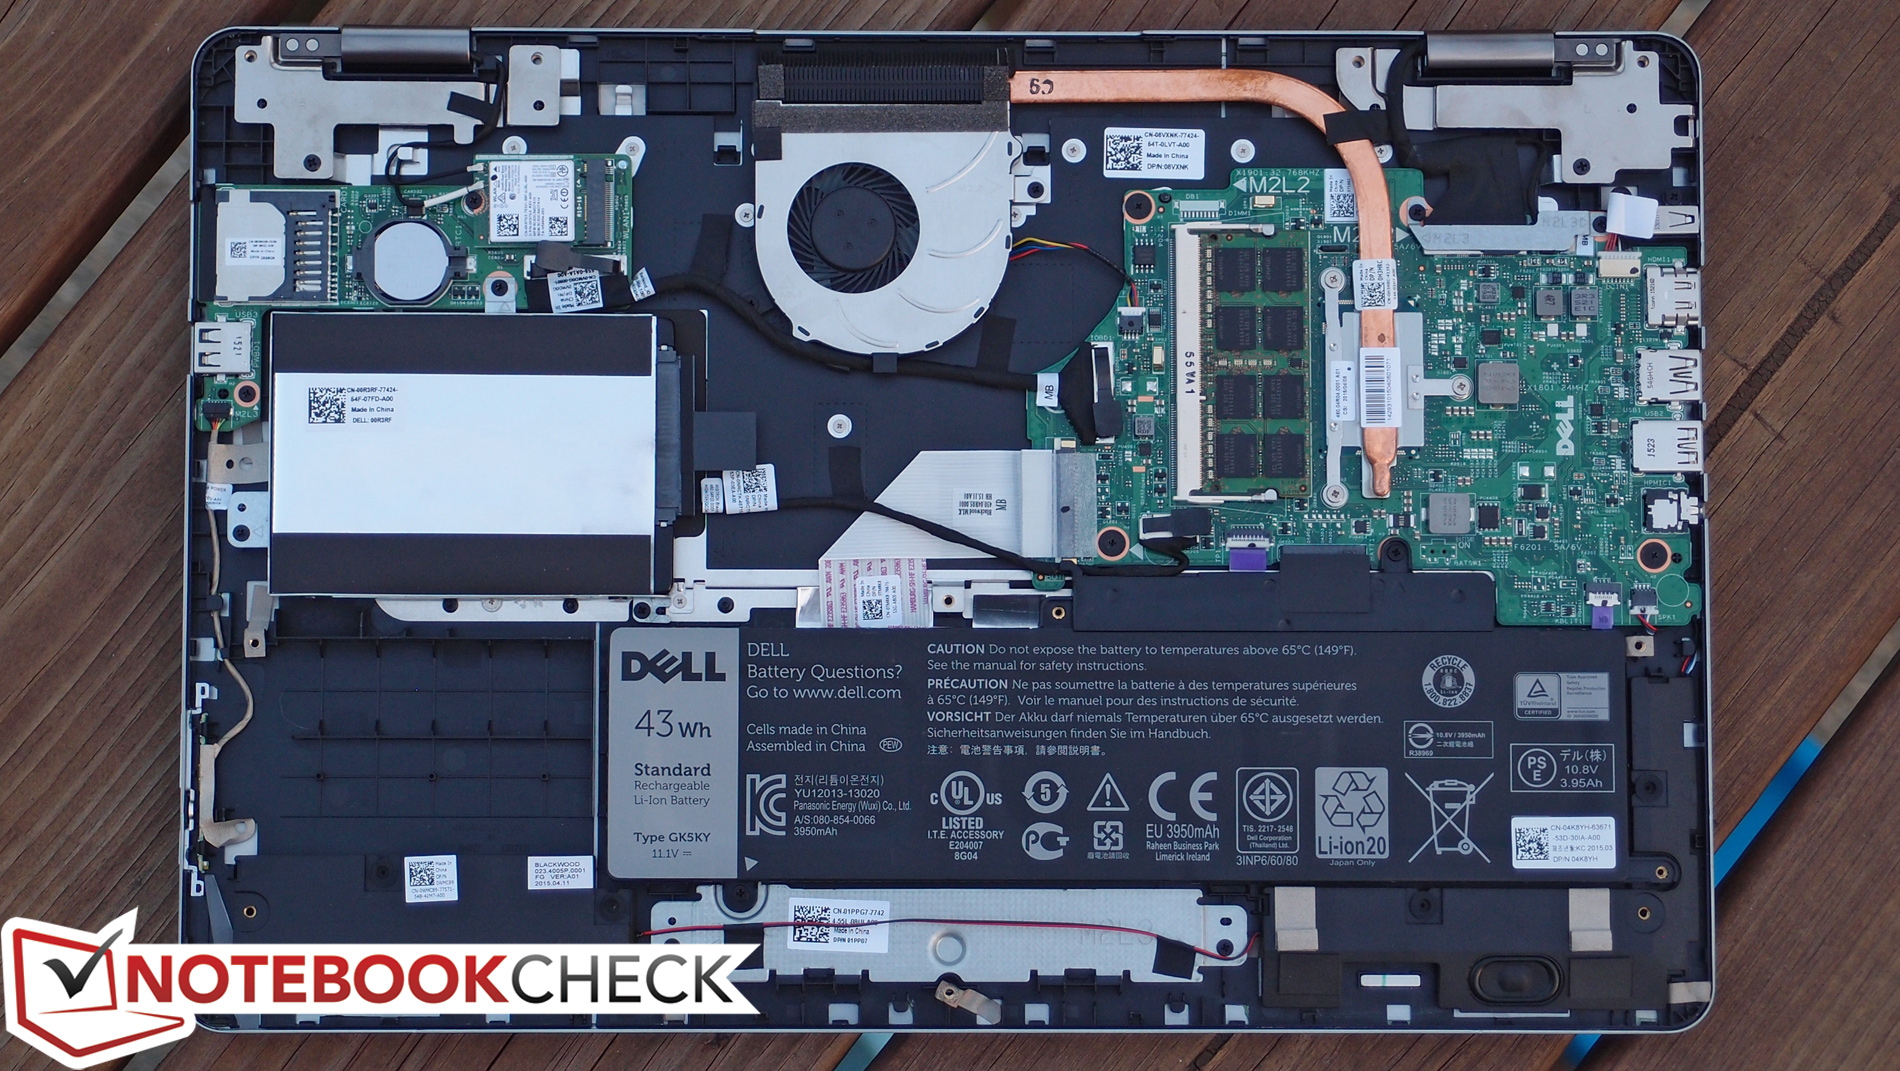
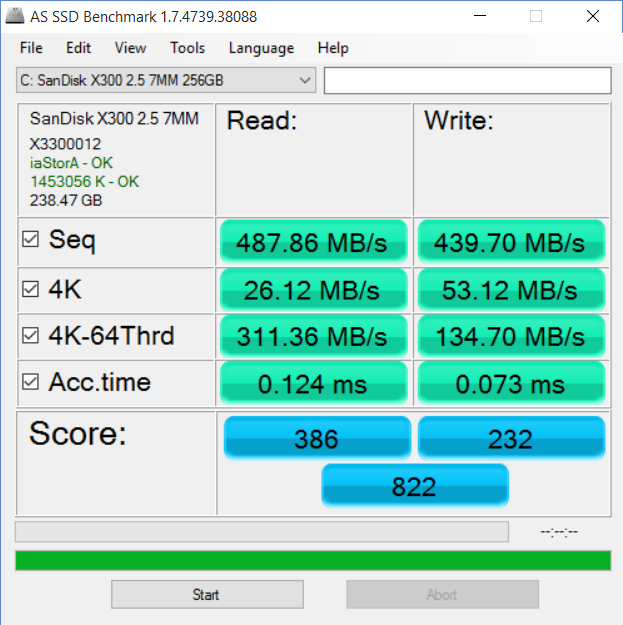
Inspiron 15 7558从它注重显示性能、内存容量的前代产品设计转而注重全能性和创新。部分采用金属材质的机身在同类产品中仍然十分值得称道(尽管不是特别坚固),舒适的手感和外观特点更像是ZenBook而非Inspiron。传统的输入设备品质优秀;键盘很顺手,也相对安静,触控板尽管采用了一体式按键,由于尺寸较大表面材质舒适也十分易于使用。它的屏幕略微欠缺校准而影响了色彩准确度,同时亮度较低,不过它至少是IPS全高清面板,甚至是最低售价的型号(550美元)也搭配了同样的屏幕。我们的测试机有幸配备了256 GB固态硬盘,让这台售价900美元(约5703人民币)的笔记本电脑配置更加合理。
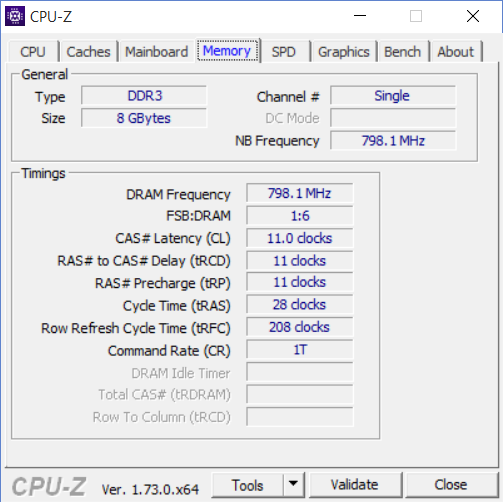
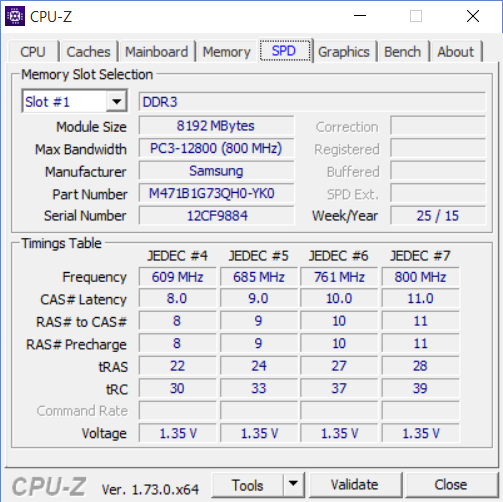
它的其他特性相比就比较平淡无奇了。性能的表现优劣并存,尽管搭配了强劲的双核处理器,但缺少前代Inspiron 7000产品所具备的独立显卡。系统内存也是如此;虽然从低端型号到高价型号容量翻了一倍(4 GB到8 GB),但都是单通道内存,因为它只有一个内存槽。机身的温度在几个位置会变得很高(不过没有过热降频的问题)。
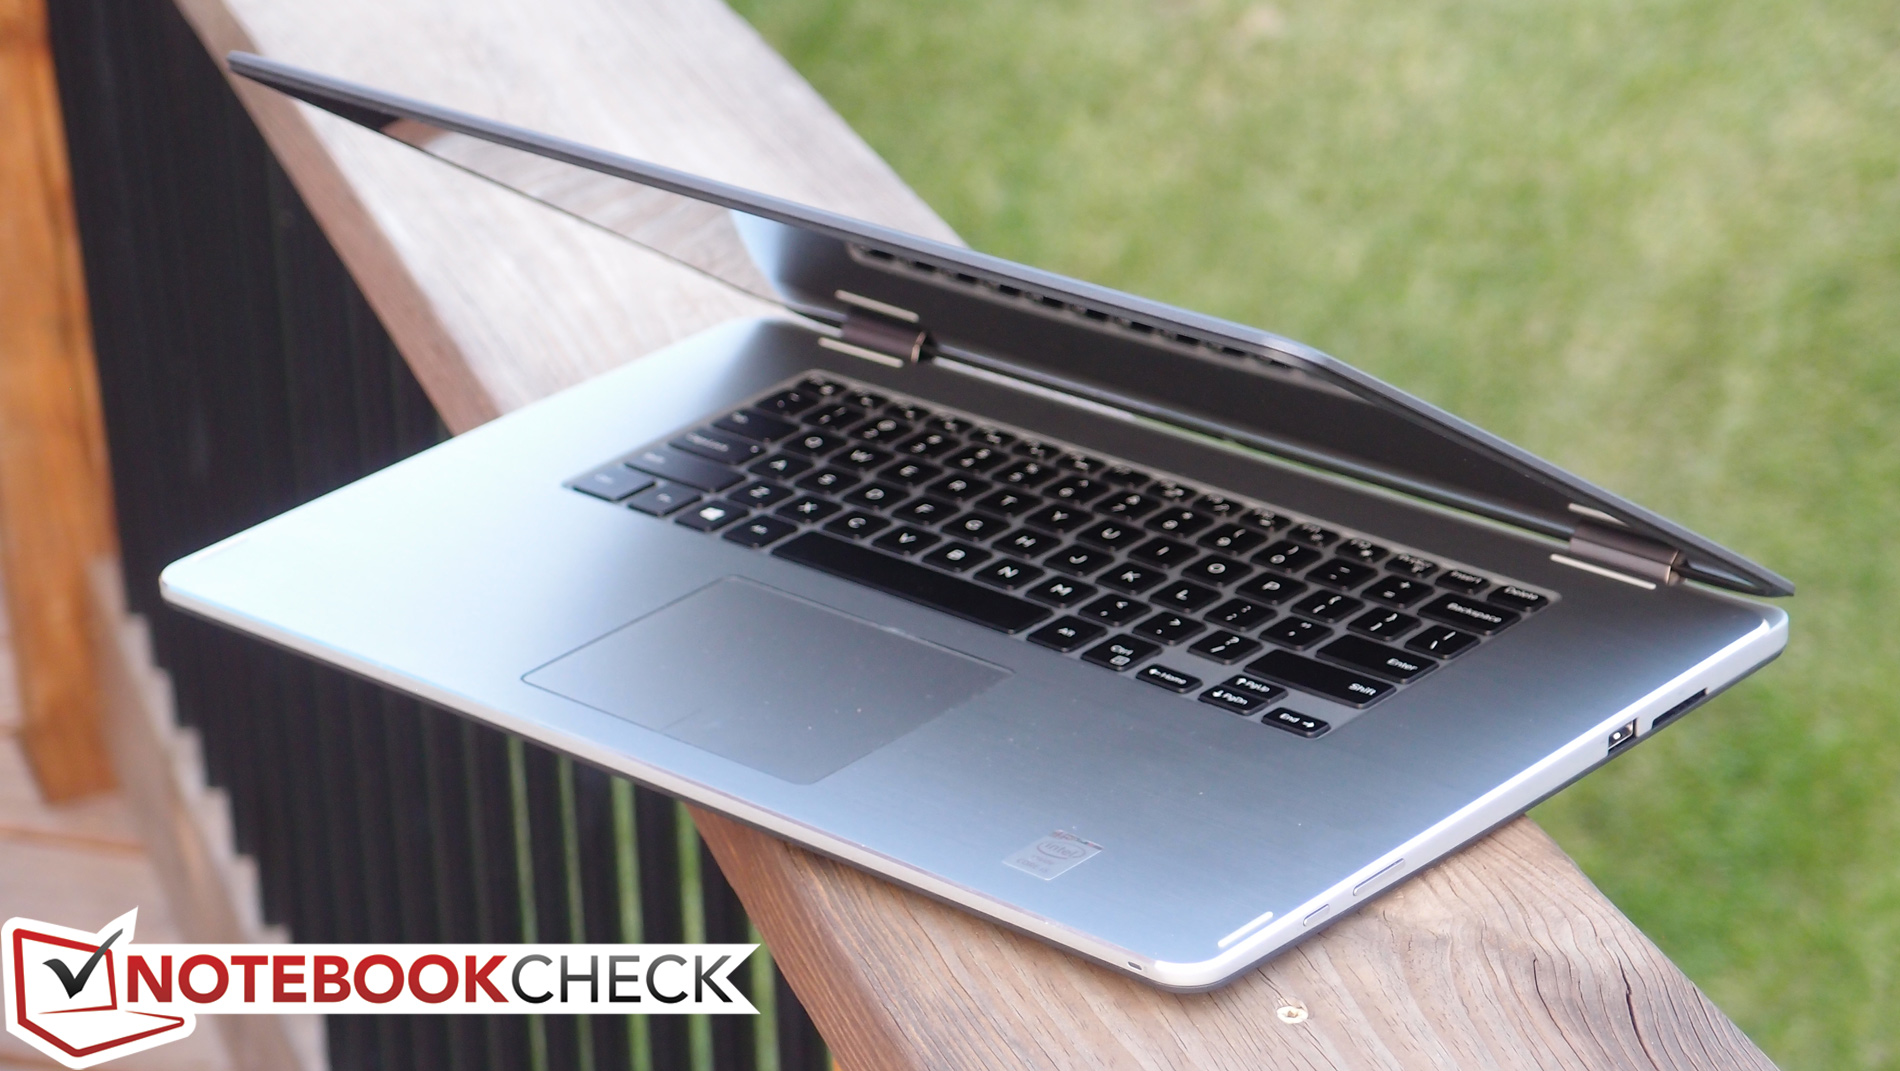
那这一切又是为了什么呢?更长的续航时间?看起来不像——7558缩小了电池的容量(相比我们测试过搭配独立显卡的7548)以降低整机重量,这让它的电池续航时间相比更强劲的前代产品仅有略微的提高。新的变形设计又如何呢?尽管这是戴尔推广这款产品的核心功能,实际上它只能算是它功能中的一个脚注,因为它的尺寸过于臃肿,很难真正作为平板电脑使用,模式转换也不是非常方便。因此7558在从7548的改变中并没有获得很多的加强,而舍弃了很多,它的设计理念似乎有些走上了弯路。
考虑到Ispiron 15 7558的笨重变形本设计,以及除了节省成本之外的相应牺牲,似乎它的前代产品Inspiron 15 7548反而更加值得推荐。
我们的测试机型建议零售价为900美元(约5703人民币),而搭配Core i7处理器,16 GB双通道内存和AMD Radeon R7 M270显卡的7548相比仅高50美元(不过它没有搭配固态硬盘,而是更慢的1 TB 5400转机械硬盘,不过用户可以自行升级)。因此,尽管它也有一些优势,我们建议用户在选购之前也考虑一下市场上的其他产品。
注:本文是基于完整评测的缩减版本,阅读完整的英文评测,请点击这里。
Dell Inspiron 15 7558
-
09/16/2015 v4(old)
Steve Schardein
Pricecompare
