 Deutsch
 English
 Español
 Français
 Italiano
 Nederlands
 Polski
 Português
 Русский
 Türkçe
 Svenska
 Chinese
 Magyar
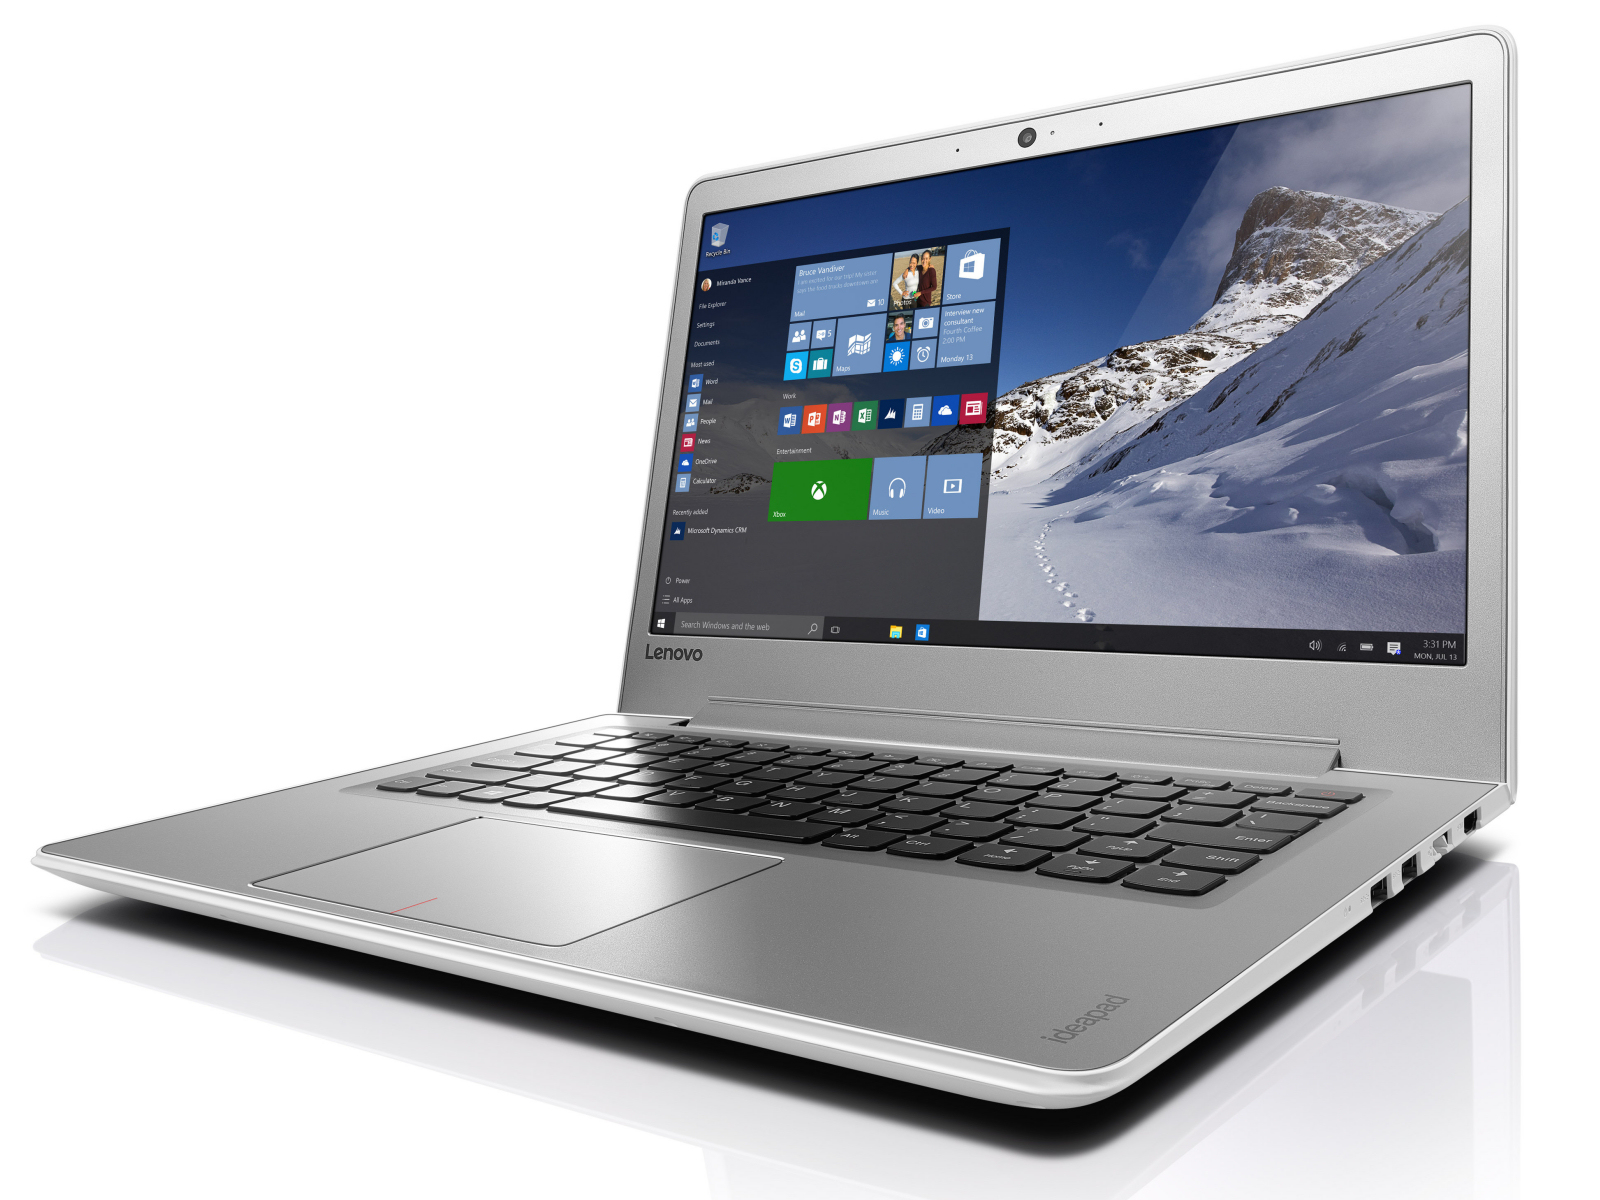
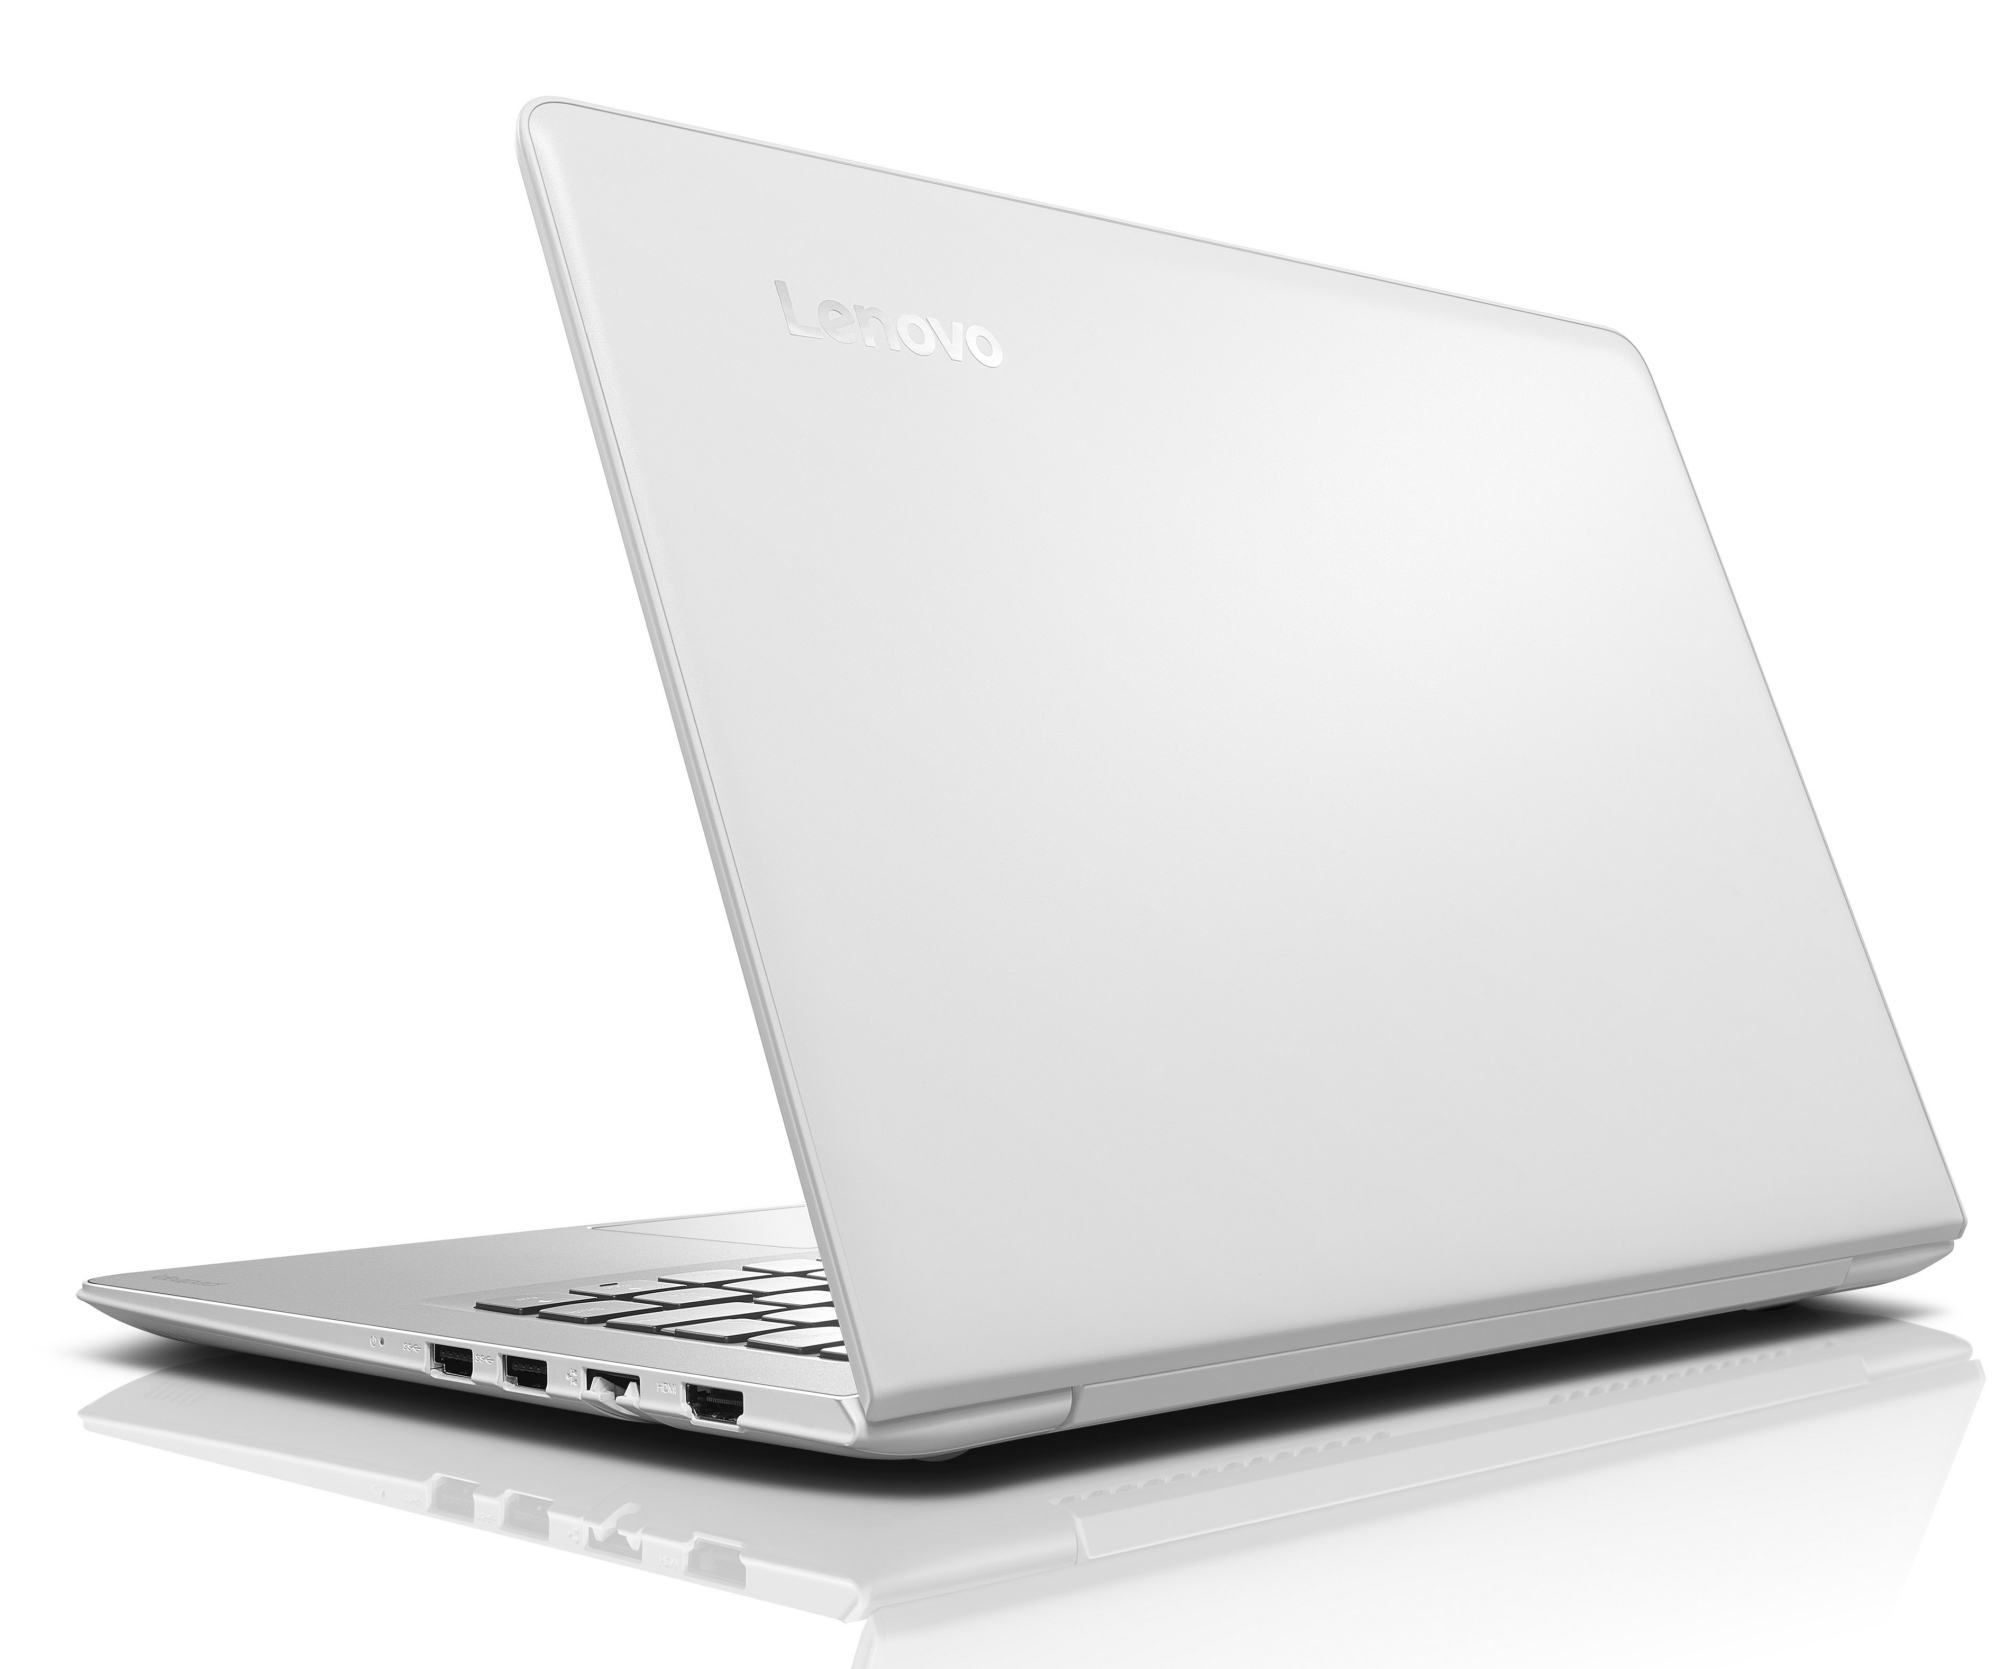
联想 Ideapad 510S-13ISK 亚笔记本电脑简短评测
| SD Card Reader | |
| average JPG Copy Test (av. of 3 runs) | |
| Asus Zenbook UX303UA-R4051T | |
| Asus Zenbook UX303UA-FN121T | |
| HP Envy 13-d020ng | |
| Lenovo Ideapad 510S-13ISK | |
| Asus X302UV-FN016T | |
| Acer Aspire V3-372-57CW | |
| Lenovo IdeaPad 500S-13ISK | |
| Lenovo E31-70 80KX015RGE | |
| maximum AS SSD Seq Read Test (1GB) | |
| Asus Zenbook UX303UA-FN121T | |
| Asus Zenbook UX303UA-R4051T | |
| HP Envy 13-d020ng | |
| Lenovo Ideapad 510S-13ISK | |
| Asus X302UV-FN016T | |
| Lenovo E31-70 80KX015RGE | |
| Acer Aspire V3-372-57CW | |
| Lenovo IdeaPad 500S-13ISK | |
| Networking | |
| iperf Server (receive) TCP 1 m | |
| Apple MacBook 12 (Early 2016) 1.1 GHz | |
| Lenovo Ideapad 510S-13ISK (seb) | |
| Lenovo IdeaPad 510S-14ISK | |
| iperf Client (transmit) TCP 1 m | |
| Apple MacBook 12 (Early 2016) 1.1 GHz | |
| Lenovo IdeaPad 510S-14ISK | |
| Lenovo Ideapad 510S-13ISK (seb) | |
| |||||||||||||||||||||||||
Brightness Distribution: 90 %
Center on Battery: 265 cd/m²
Contrast: 803:1 (Black: 0.33 cd/m²)
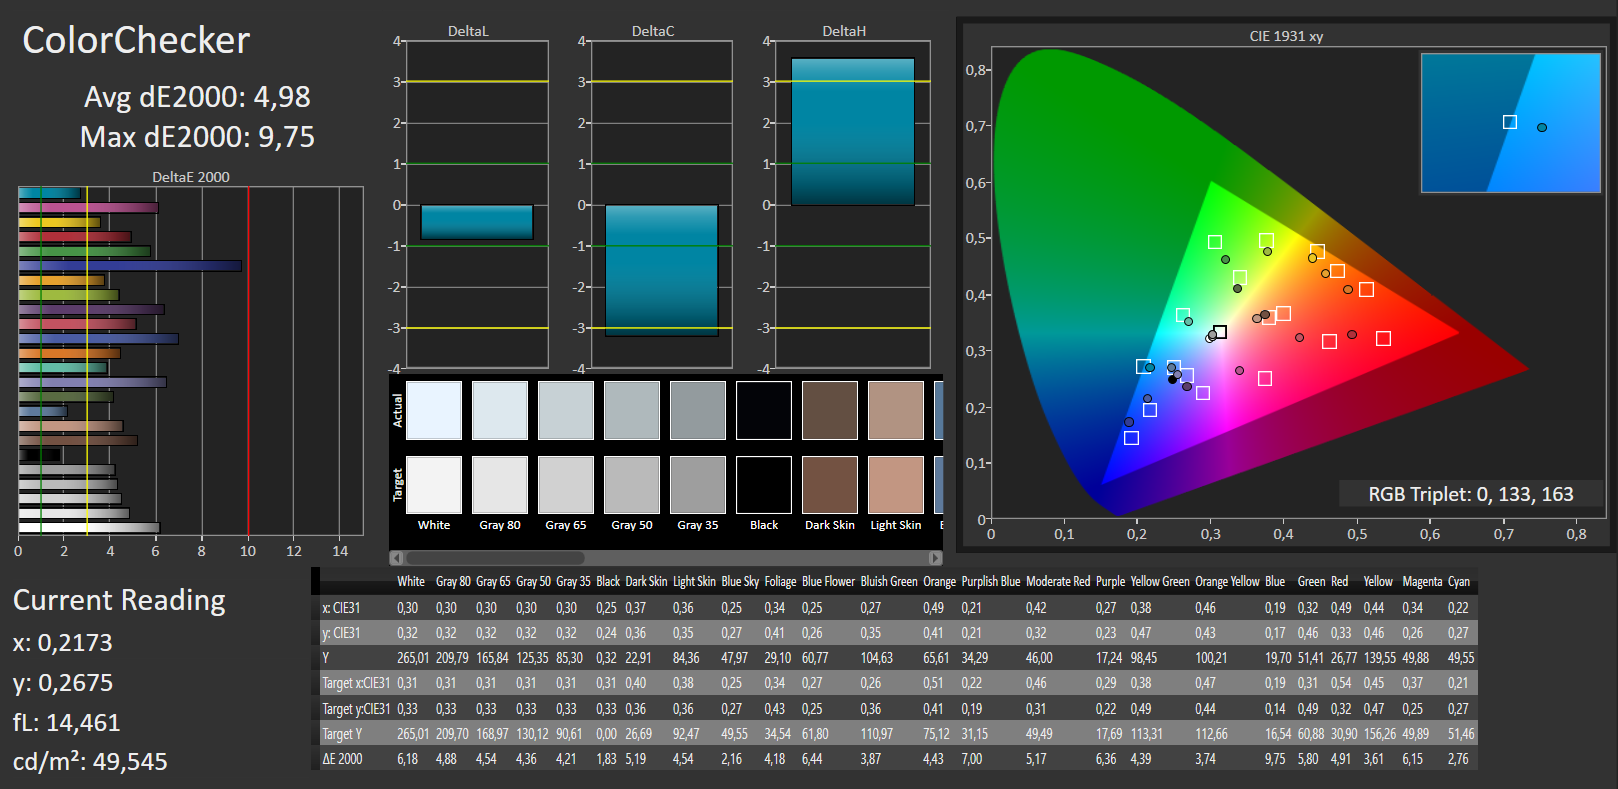
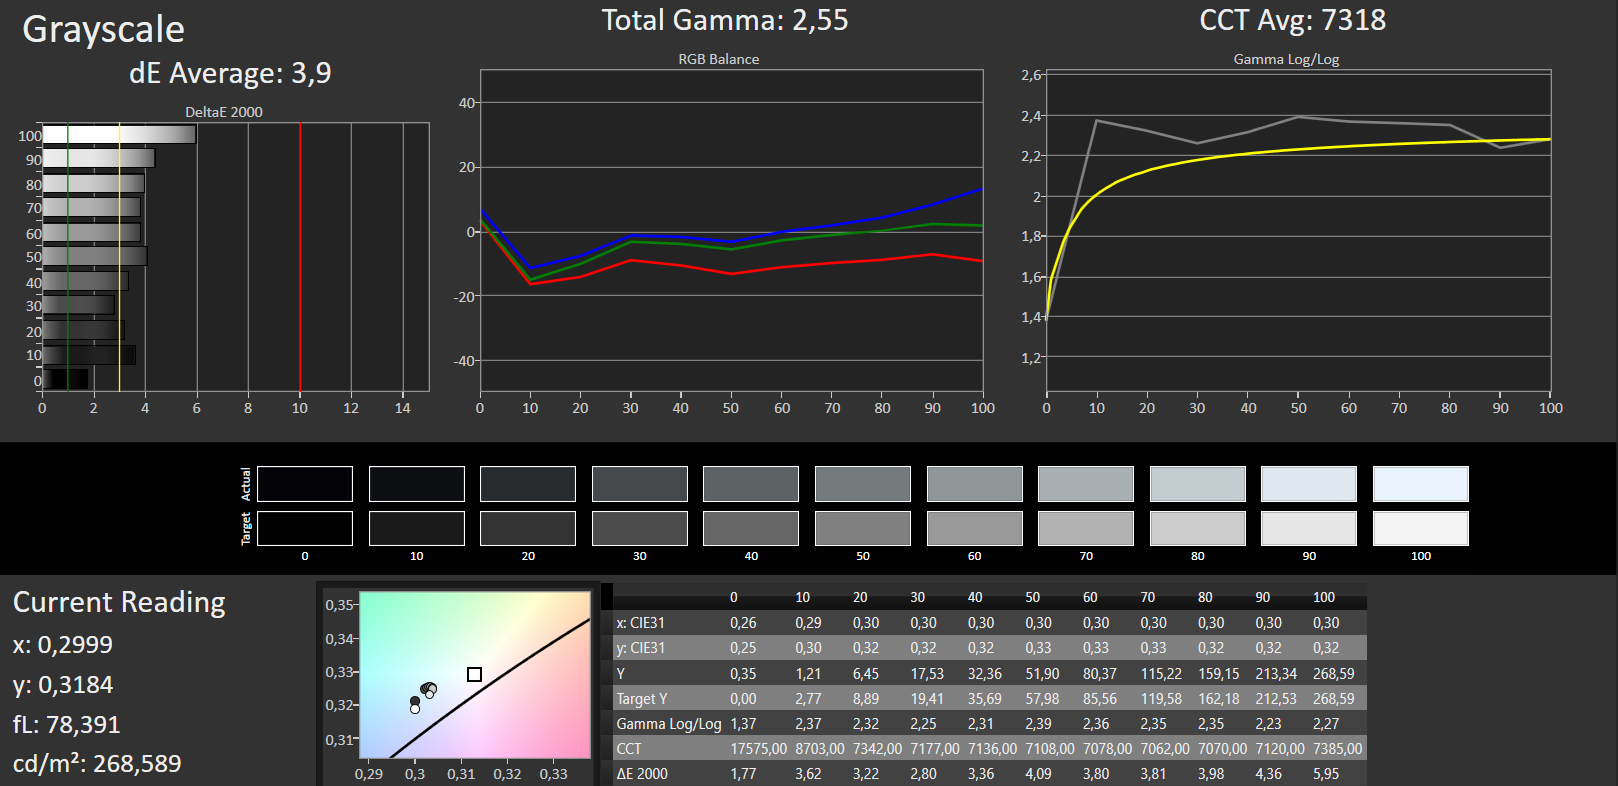
ΔE Color 4.98 | 0.5-29.43 Ø5
ΔE Greyscale 3.9 | 0.57-98 Ø5.3
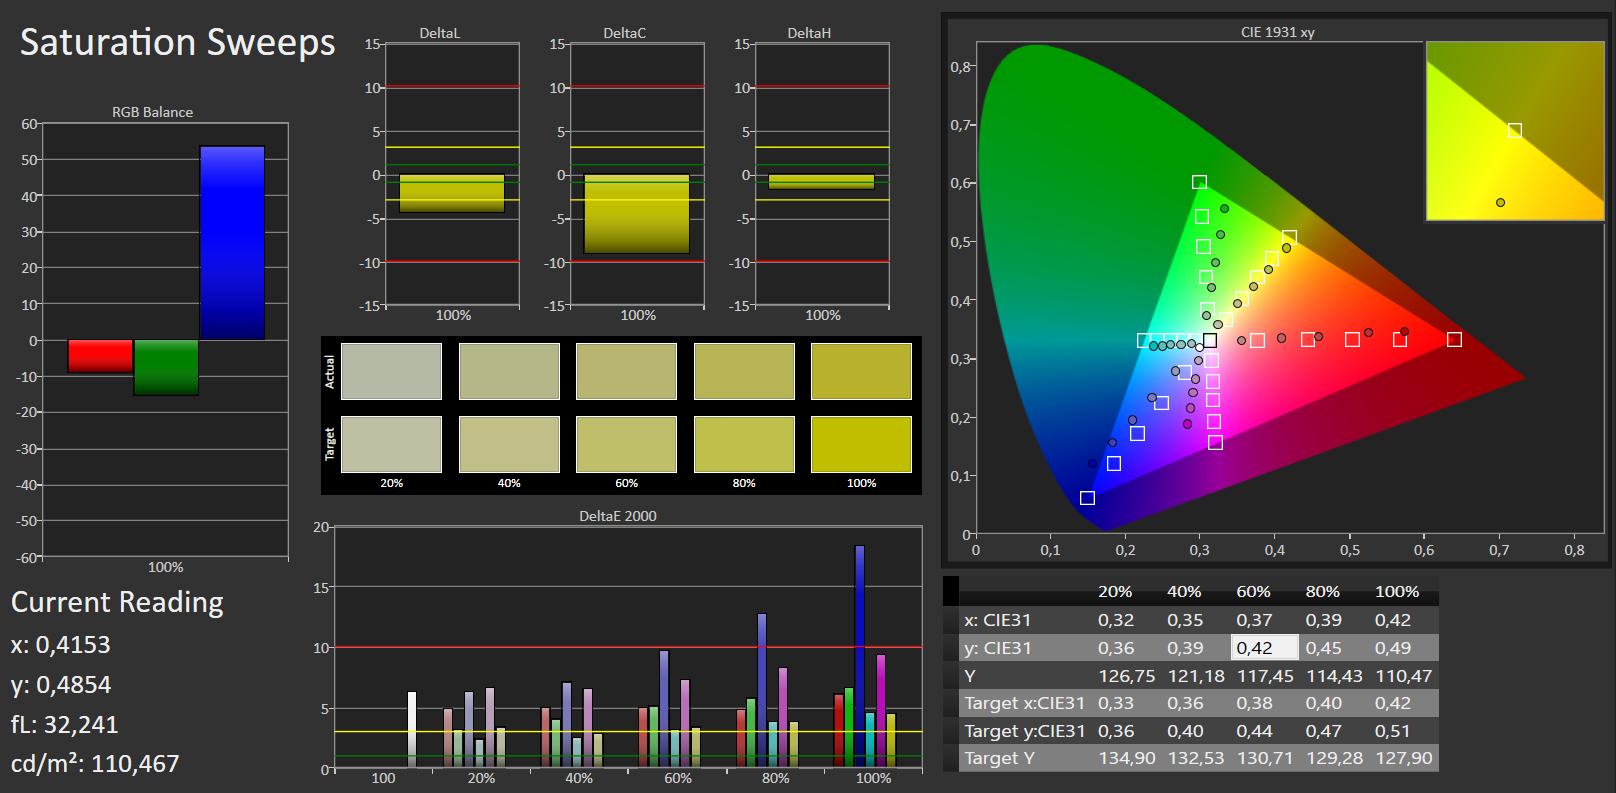
59% sRGB (Argyll 1.6.3 3D)
38% AdobeRGB 1998 (Argyll 1.6.3 3D)
40.8% AdobeRGB 1998 (Argyll 2.2.0 3D)
59.2% sRGB (Argyll 2.2.0 3D)
39.48% Display P3 (Argyll 2.2.0 3D)
Gamma: 2.55
| Lenovo Ideapad 510S-13ISK LG Philips LP133WF2-SPL1, IPS | Lenovo IdeaPad 500S-13ISK LGD048C (LP133WF2-SPL1), IPS | Asus X302UV-FN016T InfoVision M133NWN1 R3, TN LED | Acer Aspire V3-372-57CW LG LP133WF2-SPL3, IPS | HP Envy 13-d020ng AU Optronics AUO272D, IPS | Asus Zenbook UX303UA-R4051T ChiMei N133HSE-EA3 (CMN1361), IPS | Apple MacBook Air 13 inch 2015-03 Apple APP9CF0, TN LED | |
|---|---|---|---|---|---|---|---|
| Display | 1% | 23% | -1% | 59% | 64% | 2% | |
| Display P3 Coverage | 39.48 | 40.74 3% 38.91 -1% | 48.37 23% | 39.18 -1% | 63.7 61% | 67.5 71% | 40.1 2% |
| sRGB Coverage | 59.2 | 60.6 2% 58.5 -1% | 72.6 23% | 58.6 -1% | 93 57% | 92.5 56% | 59.8 1% |
| AdobeRGB 1998 Coverage | 40.8 | 42.15 3% 40.21 -1% | 49.98 23% | 40.51 -1% | 65.1 60% | 67.7 66% | 41.51 2% |
| Response Times | -18% | -9% | -37% | 103% | 102% | ||
| Response Time Grey 50% / Grey 80% * | 33 ? | 46 ? -39% | 42 ? -27% | 41 ? -24% | 34 ? -3% | 31 ? 6% | |
| Response Time Black / White * | 23 ? | 22 ? 4% | 23 ? -0% | 34.4 ? -50% | 24 ? -4% | 22 ? 4% | |
| PWM Frequency | 50 ? | 50 ? 0% | 208 ? 316% | 198 ? 296% | |||
| Screen | -8% | -7% | -16% | 24% | 19% | 7% | |
| Brightness middle | 265 | 219 -17% | 218 -18% | 247 -7% | 345 30% | 357 35% | 329 24% |
| Brightness | 261 | 212 -19% | 210 -20% | 239 -8% | 335 28% | 351 34% | 310 19% |
| Brightness Distribution | 90 | 82 -9% | 88 -2% | 81 -10% | 95 6% | 90 0% | 82 -9% |
| Black Level * | 0.33 | 0.35 -6% | 0.5 -52% | 0.38 -15% | 0.25 24% | 0.58 -76% | 0.405 -23% |
| Contrast | 803 | 626 -22% | 436 -46% | 650 -19% | 1380 72% | 616 -23% | 812 1% |
| Colorchecker dE 2000 * | 4.98 | 4.95 1% | 3.89 22% | 5.95 -19% | 4.94 1% | 3.39 32% | 3.96 20% |
| Colorchecker dE 2000 max. * | 9.75 | 11.17 -15% | 7.11 27% | 14.2 -46% | 8.85 9% | 6.76 31% | 7.51 23% |
| Greyscale dE 2000 * | 3.9 | 3.45 12% | 4.9 -26% | 5.25 -35% | 5.85 -50% | 2.36 39% | 3.51 10% |
| Gamma | 2.55 86% | 2.34 94% | 2.41 91% | 2.42 91% | 2.25 98% | 2.2 100% | 3.83 57% |
| CCT | 7318 89% | 6815 95% | 7860 83% | 6736 96% | 7105 91% | 6653 98% | 6711 97% |
| Color Space (Percent of AdobeRGB 1998) | 38 | 37 -3% | 46 21% | 37.28 -2% | 60 58% | 60 58% | 38.4 1% |
| Color Space (Percent of sRGB) | 59 | 58 -2% | 73 24% | 58.37 -1% | 93 58% | 93 58% | 59.8 1% |
| Total Average (Program / Settings) | -8% /
-6% | 2% /
-2% | -18% /
-16% | 62% /
45% | 62% /
43% | 5% /
6% |
* ... smaller is better
Screen Flickering / PWM (Pulse-Width Modulation)
| Screen flickering / PWM detected | 50 Hz | ≤ 80 % brightness setting | 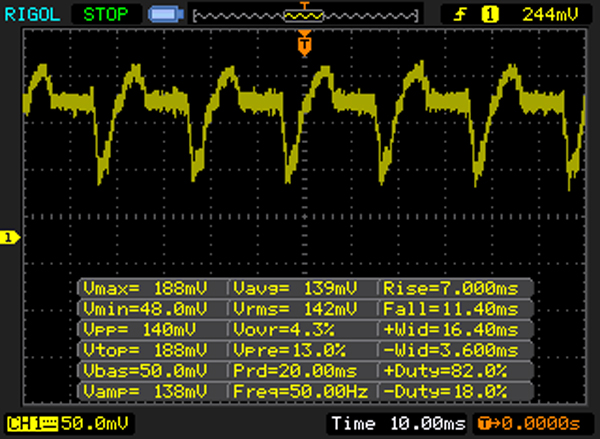 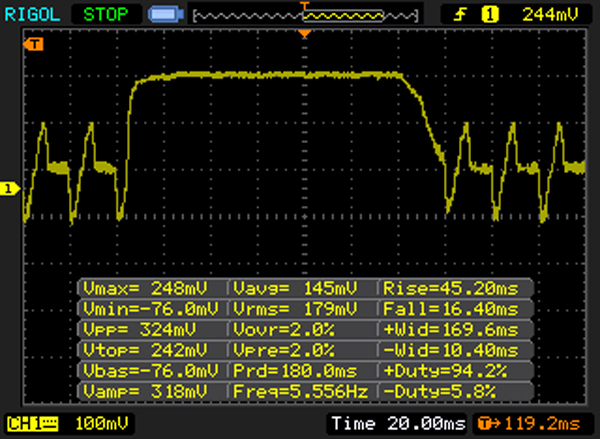 |
The display backlight flickers at 50 Hz (worst case, e.g., utilizing PWM) Flickering detected at a brightness setting of 80 % and below. There should be no flickering or PWM above this brightness setting. The frequency of 50 Hz is very low, so the flickering may cause eyestrain and headaches after extended use. In comparison: 53 % of all tested devices do not use PWM to dim the display. If PWM was detected, an average of 17900 (minimum: 5 - maximum: 3846000) Hz was measured. | |||
Display Response Times
| ↔ Response Time Black to White | ||
|---|---|---|
| 23 ms ... rise ↗ and fall ↘ combined | ↗ 5 ms rise | 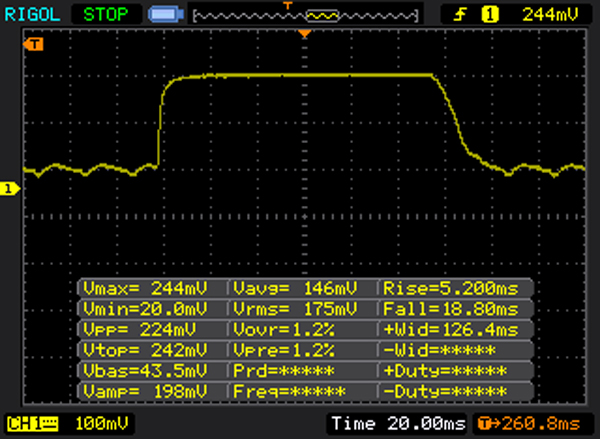 |
| ↘ 18 ms fall | ||
| The screen shows good response rates in our tests, but may be too slow for competitive gamers. In comparison, all tested devices range from 0.1 (minimum) to 240 (maximum) ms. » 45 % of all devices are better. This means that the measured response time is similar to the average of all tested devices (21.5 ms). | ||
| ↔ Response Time 50% Grey to 80% Grey | ||
| 33 ms ... rise ↗ and fall ↘ combined | ↗ 12 ms rise |  |
| ↘ 21 ms fall | ||
| The screen shows slow response rates in our tests and will be unsatisfactory for gamers. In comparison, all tested devices range from 0.2 (minimum) to 636 (maximum) ms. » 38 % of all devices are better. This means that the measured response time is similar to the average of all tested devices (33.7 ms). | ||
| Cinebench R15 | |
| CPU Single 64Bit | |
| Acer Aspire V3-372-57CW | |
| Asus Zenbook UX303UA-R4051T | |
| Lenovo IdeaPad 500S-13ISK | |
| Asus X302UV-FN016T | |
| Apple MacBook Air 13 inch 2015-03 | |
| HP Envy 13-d020ng | |
| Asus Zenbook UX303UA-FN121T | |
| Lenovo Ideapad 510S-13ISK | |
| Apple MacBook 12 (Early 2016) 1.1 GHz | |
| Apple MacBook 12 (Early 2016) 1.1 GHz | |
| Lenovo E31-70 80KX015RGE | |
| CPU Multi 64Bit | |
| Acer Aspire V3-372-57CW | |
| Asus Zenbook UX303UA-R4051T | |
| Apple MacBook Air 13 inch 2015-03 | |
| Asus X302UV-FN016T | |
| Lenovo Ideapad 510S-13ISK | |
| Asus Zenbook UX303UA-FN121T | |
| HP Envy 13-d020ng | |
| Lenovo IdeaPad 500S-13ISK | |
| Apple MacBook 12 (Early 2016) 1.1 GHz | |
| Lenovo E31-70 80KX015RGE | |
| PCMark 8 | |
| Home Score Accelerated v2 | |
| Acer Aspire V3-372-57CW | |
| Apple MacBook Air 13 inch 2015-03 | |
| Asus X302UV-FN016T | |
| Asus Zenbook UX303UA-R4051T | |
| HP Envy 13-d020ng | |
| Asus Zenbook UX303UA-FN121T | |
| Lenovo Ideapad 510S-13ISK | |
| Lenovo IdeaPad 500S-13ISK | |
| Lenovo E31-70 80KX015RGE | |
| Apple MacBook 12 (Early 2016) 1.1 GHz | |
| Work Score Accelerated v2 | |
| Acer Aspire V3-372-57CW | |
| Asus X302UV-FN016T | |
| Apple MacBook Air 13 inch 2015-03 | |
| Asus Zenbook UX303UA-R4051T | |
| HP Envy 13-d020ng | |
| Asus Zenbook UX303UA-FN121T | |
| Lenovo IdeaPad 500S-13ISK | |
| Lenovo Ideapad 510S-13ISK | |
| Apple MacBook 12 (Early 2016) 1.1 GHz | |
| PCMark 7 Score | 2846 points | |
| PCMark 8 Home Score Accelerated v2 | 3077 points | |
| PCMark 8 Creative Score Accelerated v2 | 3560 points | |
| PCMark 8 Work Score Accelerated v2 | 3629 points | |
Help | ||

| Lenovo Ideapad 510S-13ISK WDC Slim WD10SPCX-24HWST1 | Lenovo IdeaPad 500S-13ISK Seagate ST500LM000 Solid State Hybrid Drive | Asus X302UV-FN016T Hynix HFS128G3MND | Acer Aspire V3-372-57CW Kingston RBU-SNS8152S3256GG2 | Lenovo E31-70 80KX015RGE Seagate ST500LM000 Solid State Hybrid Drive | HP Envy 13-d020ng Samsung MZRPC256HADR-000SO | Asus Zenbook UX303UA-FN121T Hitachi Travelstar Z5K500 HTS545050A7E680 | |
|---|---|---|---|---|---|---|---|
| CrystalDiskMark 3.0 | 23% | 5639% | 8603% | 35% | 8596% | -20% | |
| Read Seq | 108.3 | 108.1 0% | 428.2 295% | 515 376% | 116.4 7% | 478.7 342% | 97.7 -10% |
| Write Seq | 109 | 113 4% | 178.6 64% | 338 210% | 120.7 11% | 268.5 146% | 94.5 -13% |
| Read 512 | 35.24 | 37.68 7% | 282.6 702% | 368.1 945% | 37.01 5% | 386.6 997% | 31.27 -11% |
| Write 512 | 53.3 | 61.2 15% | 179.1 236% | 338.6 535% | 73.1 37% | 268.8 404% | 35.06 -34% |
| Read 4k | 0.395 | 0.48 22% | 6.559 1561% | 28.88 7211% | 0.507 28% | 26.88 6705% | 0.379 -4% |
| Write 4k | 1.19 | 3.439 189% | 71.2 5883% | 74.2 6135% | 4.156 249% | 78.7 6513% | 0.862 -28% |
| Read 4k QD32 | 1.139 | 1.026 -10% | 253 22112% | 319.9 27986% | 0.967 -15% | 369.4 32332% | 0.792 -30% |
| Write 4k QD32 | 1.212 | 0.673 -44% | 174 14256% | 309.4 25428% | 0.652 -46% | 259.7 21327% | 0.871 -28% |
| 3DMark 06 Standard Score | 5463 points | |
| 3DMark 11 Performance | 1488 points | |
| 3DMark Ice Storm Standard Score | 49866 points | |
| 3DMark Cloud Gate Standard Score | 5341 points | |
| 3DMark Fire Strike Score | 749 points | |
Help | ||
| 3DMark 11 - 1280x720 Performance GPU | |
| Acer Aspire V3-372-57CW | |
| Asus X302UV-FN016T | |
| Asus Zenbook UX303UA-R4051T | |
| Lenovo Ideapad 510S-13ISK | |
| Apple MacBook Air 13 inch 2015-03 | |
| HP Envy 13-d020ng | |
| Asus Zenbook UX303UA-FN121T | |
| Lenovo IdeaPad 500S-13ISK | |
| Apple MacBook 12 (Early 2016) 1.1 GHz | |
| Lenovo E31-70 80KX015RGE | |
| 3DMark | |
| 1280x720 Cloud Gate Standard Graphics | |
| Acer Aspire V3-372-57CW | |
| Asus Zenbook UX303UA-R4051T | |
| Asus X302UV-FN016T | |
| Apple MacBook Air 13 inch 2015-03 | |
| HP Envy 13-d020ng | |
| Lenovo Ideapad 510S-13ISK | |
| Asus Zenbook UX303UA-FN121T | |
| Apple MacBook 12 (Early 2016) 1.1 GHz | |
| Lenovo IdeaPad 500S-13ISK | |
| 1920x1080 Fire Strike Graphics | |
| Acer Aspire V3-372-57CW | |
| Asus X302UV-FN016T | |
| Apple MacBook Air 13 inch 2015-03 | |
| Asus Zenbook UX303UA-R4051T | |
| HP Envy 13-d020ng | |
| Asus Zenbook UX303UA-FN121T | |
| Lenovo Ideapad 510S-13ISK | |
| Apple MacBook 12 (Early 2016) 1.1 GHz | |
| Lenovo IdeaPad 500S-13ISK | |
| low | med. | high | ultra | |
| Tomb Raider (2013) | 68.3 | 34.6 | 20.3 | 9.5 |
| BioShock Infinite (2013) | 42.2 | 24.7 | 20.5 | 6 |
| Battlefield 4 (2013) | 32 | 25.3 | 16.8 | 5.4 |
Noise Level
| Idle |
| 32.1 / 32.1 / 32.1 dB(A) |
| HDD |
| 32.1 dB(A) |
| Load |
| 40 / 40.9 dB(A) |
 | ||
30 dB silent 40 dB(A) audible 50 dB(A) loud |
||
min: | ||
| Lenovo Ideapad 510S-13ISK 6200U, HD Graphics 520 | Lenovo IdeaPad 500S-13ISK 6200U, HD Graphics 520 | Asus X302UV-FN016T 6200U, GeForce 920MX | Acer Aspire V3-372-57CW 6267U, Iris Graphics 550 | HP Envy 13-d020ng 6200U, HD Graphics 520 | Asus Zenbook UX303UA-R4051T 6500U, HD Graphics 520 | Apple MacBook Air 13 inch 2015-03 5650U, HD Graphics 6000 | |
|---|---|---|---|---|---|---|---|
| Noise | 3% | 4% | 3% | 4% | 7% | 3% | |
| off / environment * | 31.2 | 31.3 -0% | 31.2 -0% | 29.1 7% | 31.3 -0% | ||
| Idle Minimum * | 32.1 | 31.3 2% | 32.9 -2% | 29.1 9% | 32.5 -1% | 31.3 2% | 29.2 9% |
| Idle Average * | 32.1 | 31.7 1% | 32.9 -2% | 29.1 9% | 32.5 -1% | 31.3 2% | 29.2 9% |
| Idle Maximum * | 32.1 | 31.8 1% | 33 -3% | 29.1 9% | 32.4 -1% | 31.5 2% | 29.2 9% |
| Load Average * | 40 | 36.7 8% | 33 17% | 41.1 -3% | 36 10% | 33.2 17% | 40.2 -1% |
| Load Maximum * | 40.9 | 39.4 4% | 34.6 15% | 46.4 -13% | 36.5 11% | 34.1 17% | 46.3 -13% |
* ... smaller is better
(+) The maximum temperature on the upper side is 38 °C / 100 F, compared to the average of 35.9 °C / 97 F, ranging from 21.4 to 59 °C for the class Subnotebook.
(+) The bottom heats up to a maximum of 39.1 °C / 102 F, compared to the average of 39.4 °C / 103 F
(+) In idle usage, the average temperature for the upper side is 28.1 °C / 83 F, compared to the device average of 30.7 °C / 87 F.
(+) The palmrests and touchpad are cooler than skin temperature with a maximum of 29.6 °C / 85.3 F and are therefore cool to the touch.
(±) The average temperature of the palmrest area of similar devices was 28.3 °C / 82.9 F (-1.3 °C / -2.4 F).
| Lenovo Ideapad 510S-13ISK 6200U, HD Graphics 520 | Lenovo IdeaPad 500S-13ISK 6200U, HD Graphics 520 | Asus X302UV-FN016T 6200U, GeForce 920MX | Acer Aspire V3-372-57CW 6267U, Iris Graphics 550 | HP Envy 13-d020ng 6200U, HD Graphics 520 | Asus Zenbook UX303UA-R4051T 6500U, HD Graphics 520 | Apple MacBook Air 13 inch 2015-03 5650U, HD Graphics 6000 | |
|---|---|---|---|---|---|---|---|
| Heat | 5% | 13% | -6% | -3% | 8% | -2% | |
| Maximum Upper Side * | 38 | 35.9 6% | 29.6 22% | 37.1 2% | 51 -34% | 38.1 -0% | 43.8 -15% |
| Maximum Bottom * | 39.1 | 39.1 -0% | 41 -5% | 43.2 -10% | 46 -18% | 40.3 -3% | 42.1 -8% |
| Idle Upper Side * | 30.7 | 27.8 9% | 24.8 19% | 32.1 -5% | 25.5 17% | 25.8 16% | 28.5 7% |
| Idle Bottom * | 31.1 | 29.1 6% | 26.6 14% | 34.4 -11% | 24.4 22% | 25.5 18% | 28.9 7% |
* ... smaller is better
Lenovo Ideapad 510S-13ISK audio analysis
(-) | not very loud speakers (64 dB)
Bass 100 - 315 Hz
(-) | nearly no bass - on average 19.7% lower than median
(±) | linearity of bass is average (11.2% delta to prev. frequency)
Mids 400 - 2000 Hz
(+) | balanced mids - only 1.3% away from median
(+) | mids are linear (6.9% delta to prev. frequency)
Highs 2 - 16 kHz
(+) | balanced highs - only 1.7% away from median
(+) | highs are linear (6% delta to prev. frequency)
Overall 100 - 16.000 Hz
(±) | linearity of overall sound is average (19.6% difference to median)
Compared to same class
» 56% of all tested devices in this class were better, 7% similar, 37% worse
» The best had a delta of 5%, average was 19%, worst was 53%
Compared to all devices tested
» 44% of all tested devices were better, 7% similar, 49% worse
» The best had a delta of 4%, average was 25%, worst was 134%
Apple MacBook 12 (Early 2016) 1.1 GHz audio analysis
(+) | speakers can play relatively loud (83.6 dB)
Bass 100 - 315 Hz
(±) | reduced bass - on average 11.3% lower than median
(±) | linearity of bass is average (14.2% delta to prev. frequency)
Mids 400 - 2000 Hz
(+) | balanced mids - only 2.4% away from median
(+) | mids are linear (5.5% delta to prev. frequency)
Highs 2 - 16 kHz
(+) | balanced highs - only 2% away from median
(+) | highs are linear (4.5% delta to prev. frequency)
Overall 100 - 16.000 Hz
(+) | overall sound is linear (10.2% difference to median)
Compared to same class
» 5% of all tested devices in this class were better, 2% similar, 93% worse
» The best had a delta of 5%, average was 19%, worst was 53%
Compared to all devices tested
» 3% of all tested devices were better, 1% similar, 96% worse
» The best had a delta of 4%, average was 25%, worst was 134%
| Off / Standby | |
| Idle | |
| Load |
|
| Lenovo Ideapad 510S-13ISK 6200U, HD Graphics 520 | Lenovo IdeaPad 500S-13ISK 6200U, HD Graphics 520 | Asus X302UV-FN016T 6200U, GeForce 920MX | Acer Aspire V3-372-57CW 6267U, Iris Graphics 550 | HP Envy 13-d020ng 6200U, HD Graphics 520 | Asus Zenbook UX303UA-R4051T 6500U, HD Graphics 520 | Apple MacBook Air 13 inch 2015-03 5650U, HD Graphics 6000 | |
|---|---|---|---|---|---|---|---|
| Power Consumption | 10% | 16% | -5% | -2% | 14% | 18% | |
| Idle Minimum * | 5 | 5.2 -4% | 3.3 34% | 3.4 32% | 4.2 16% | 3.5 30% | 2.7 46% |
| Idle Average * | 7.2 | 6.9 4% | 5.1 29% | 6.5 10% | 7.4 -3% | 7.3 -1% | 5.7 21% |
| Idle Maximum * | 8.7 | 7.2 17% | 5.2 40% | 7 20% | 10.1 -16% | 7.9 9% | 6 31% |
| Load Average * | 32 | 26.7 17% | 29.5 8% | 44.5 -39% | 33.4 -4% | 26.6 17% | 32.1 -0% |
| Load Maximum * | 33 | 28.2 15% | 44 -33% | 49.5 -50% | 34.7 -5% | 28 15% | 36.2 -10% |
* ... smaller is better
| Lenovo Ideapad 510S-13ISK 35 Wh | Lenovo IdeaPad 500S-13ISK 35 Wh | Asus X302UV-FN016T 38 Wh | Acer Aspire V3-372-57CW 51 Wh | HP Envy 13-d020ng 45 Wh | Asus Zenbook UX303UA-R4051T 50 Wh | Apple MacBook Air 13 inch 2015-03 54 Wh | |
|---|---|---|---|---|---|---|---|
| Battery Runtime | -5% | 12% | 74% | 9% | 16% | 88% | |
| Reader / Idle | 555 | 615 11% | 1035 86% | 1572 183% | |||
| H.264 | 325 | 311 -4% | |||||
| WiFi v1.3 | 351 | 301 -14% | 392 12% | 412 17% | 381 9% | 407 16% | 620 77% |
| Load | 94 | 81 -14% | 206 119% | 97 3% |
Pros
Cons
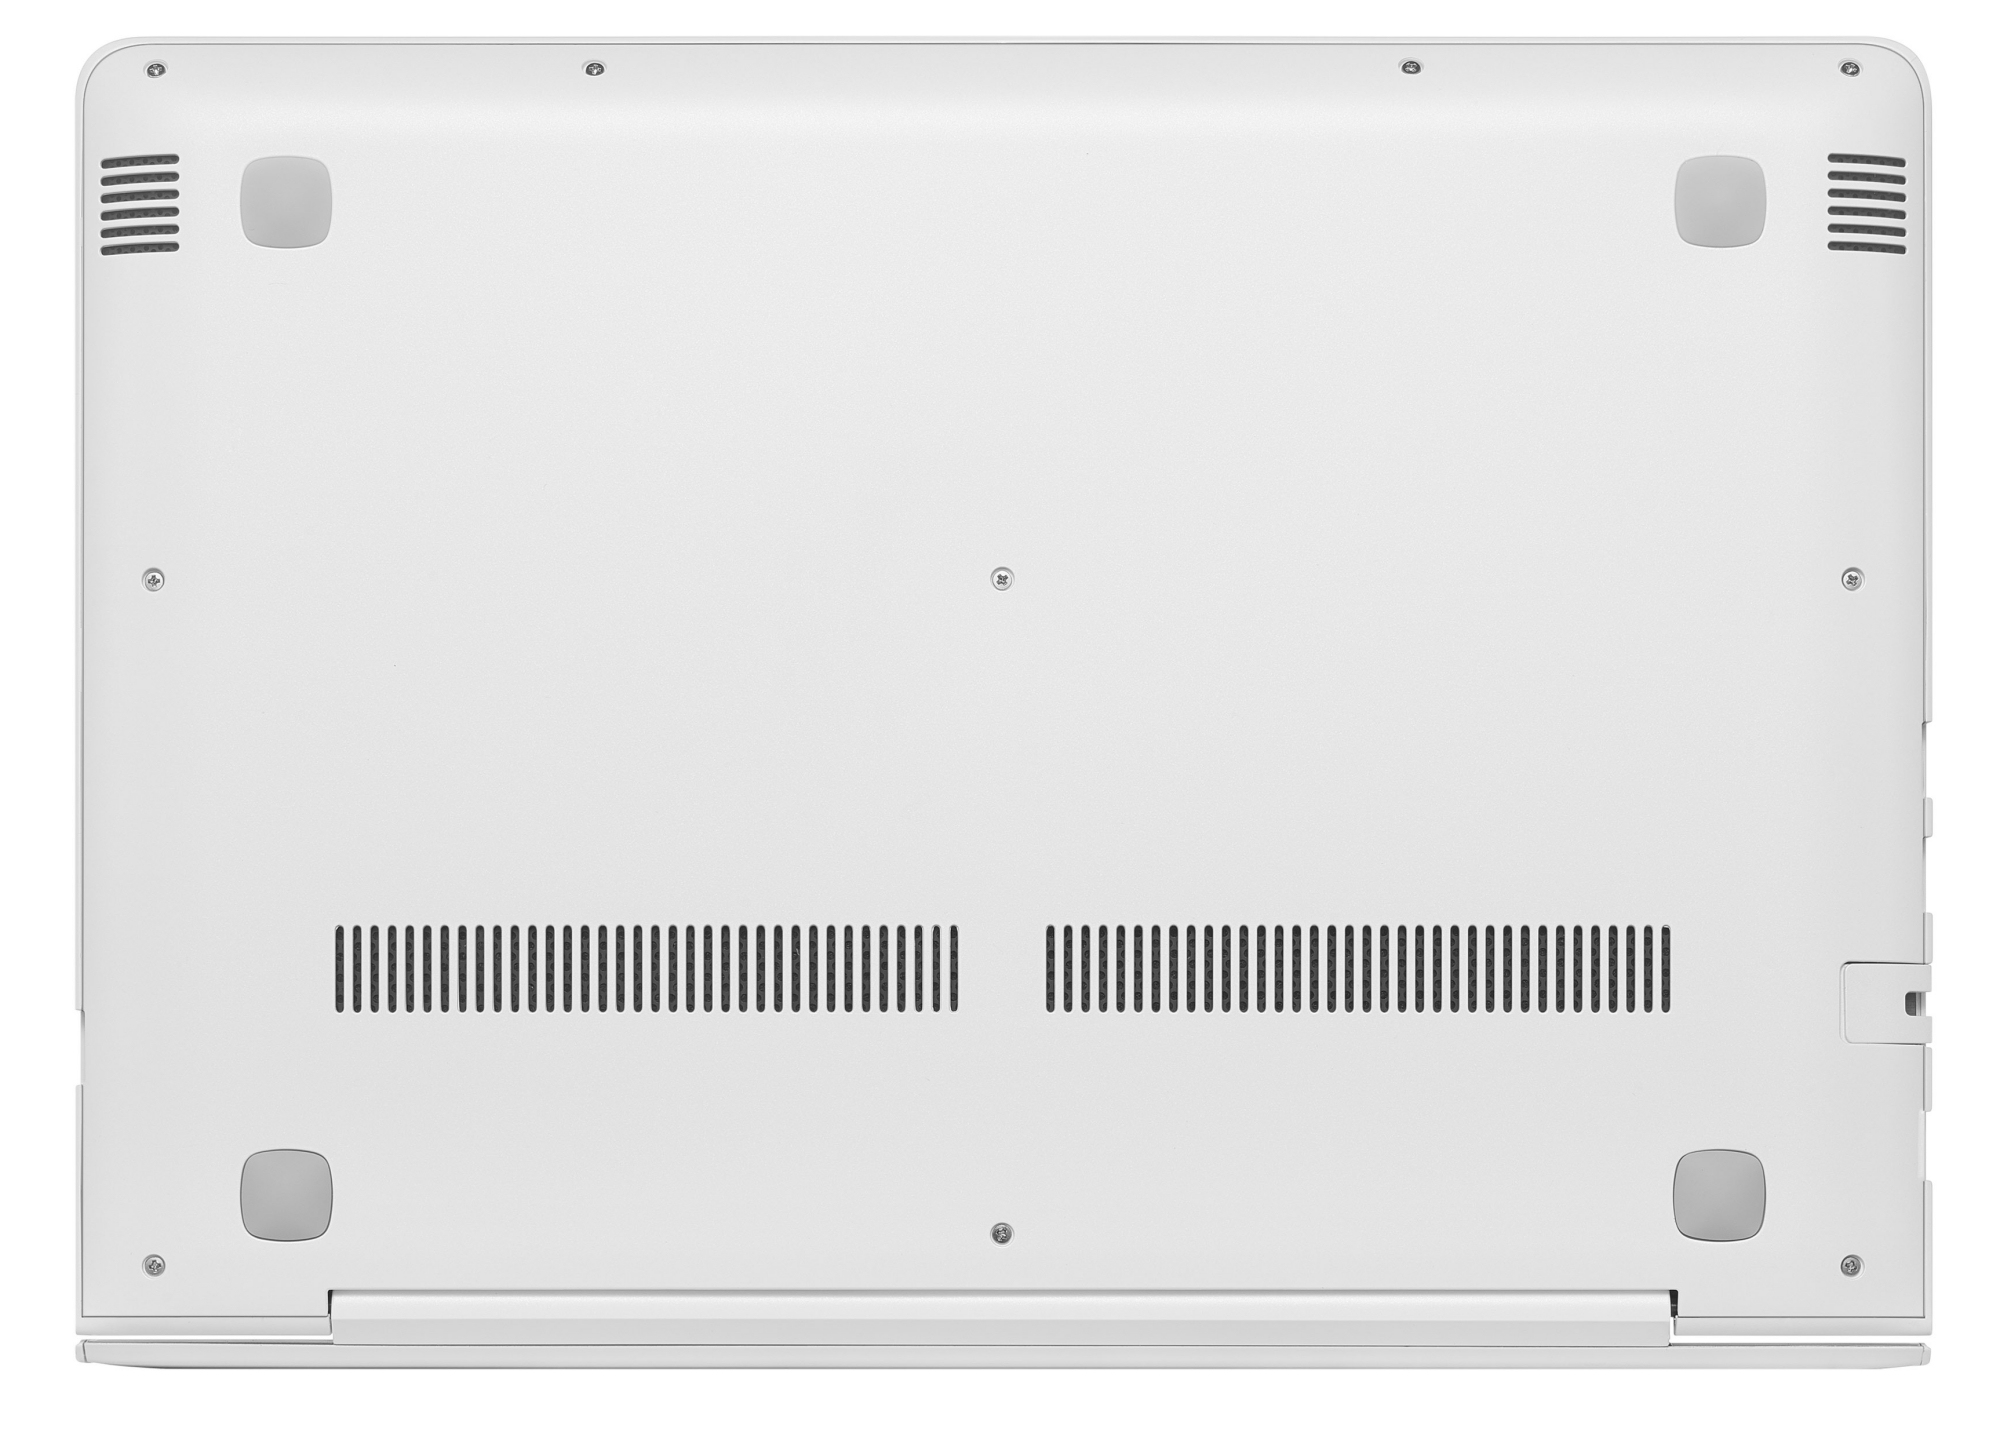
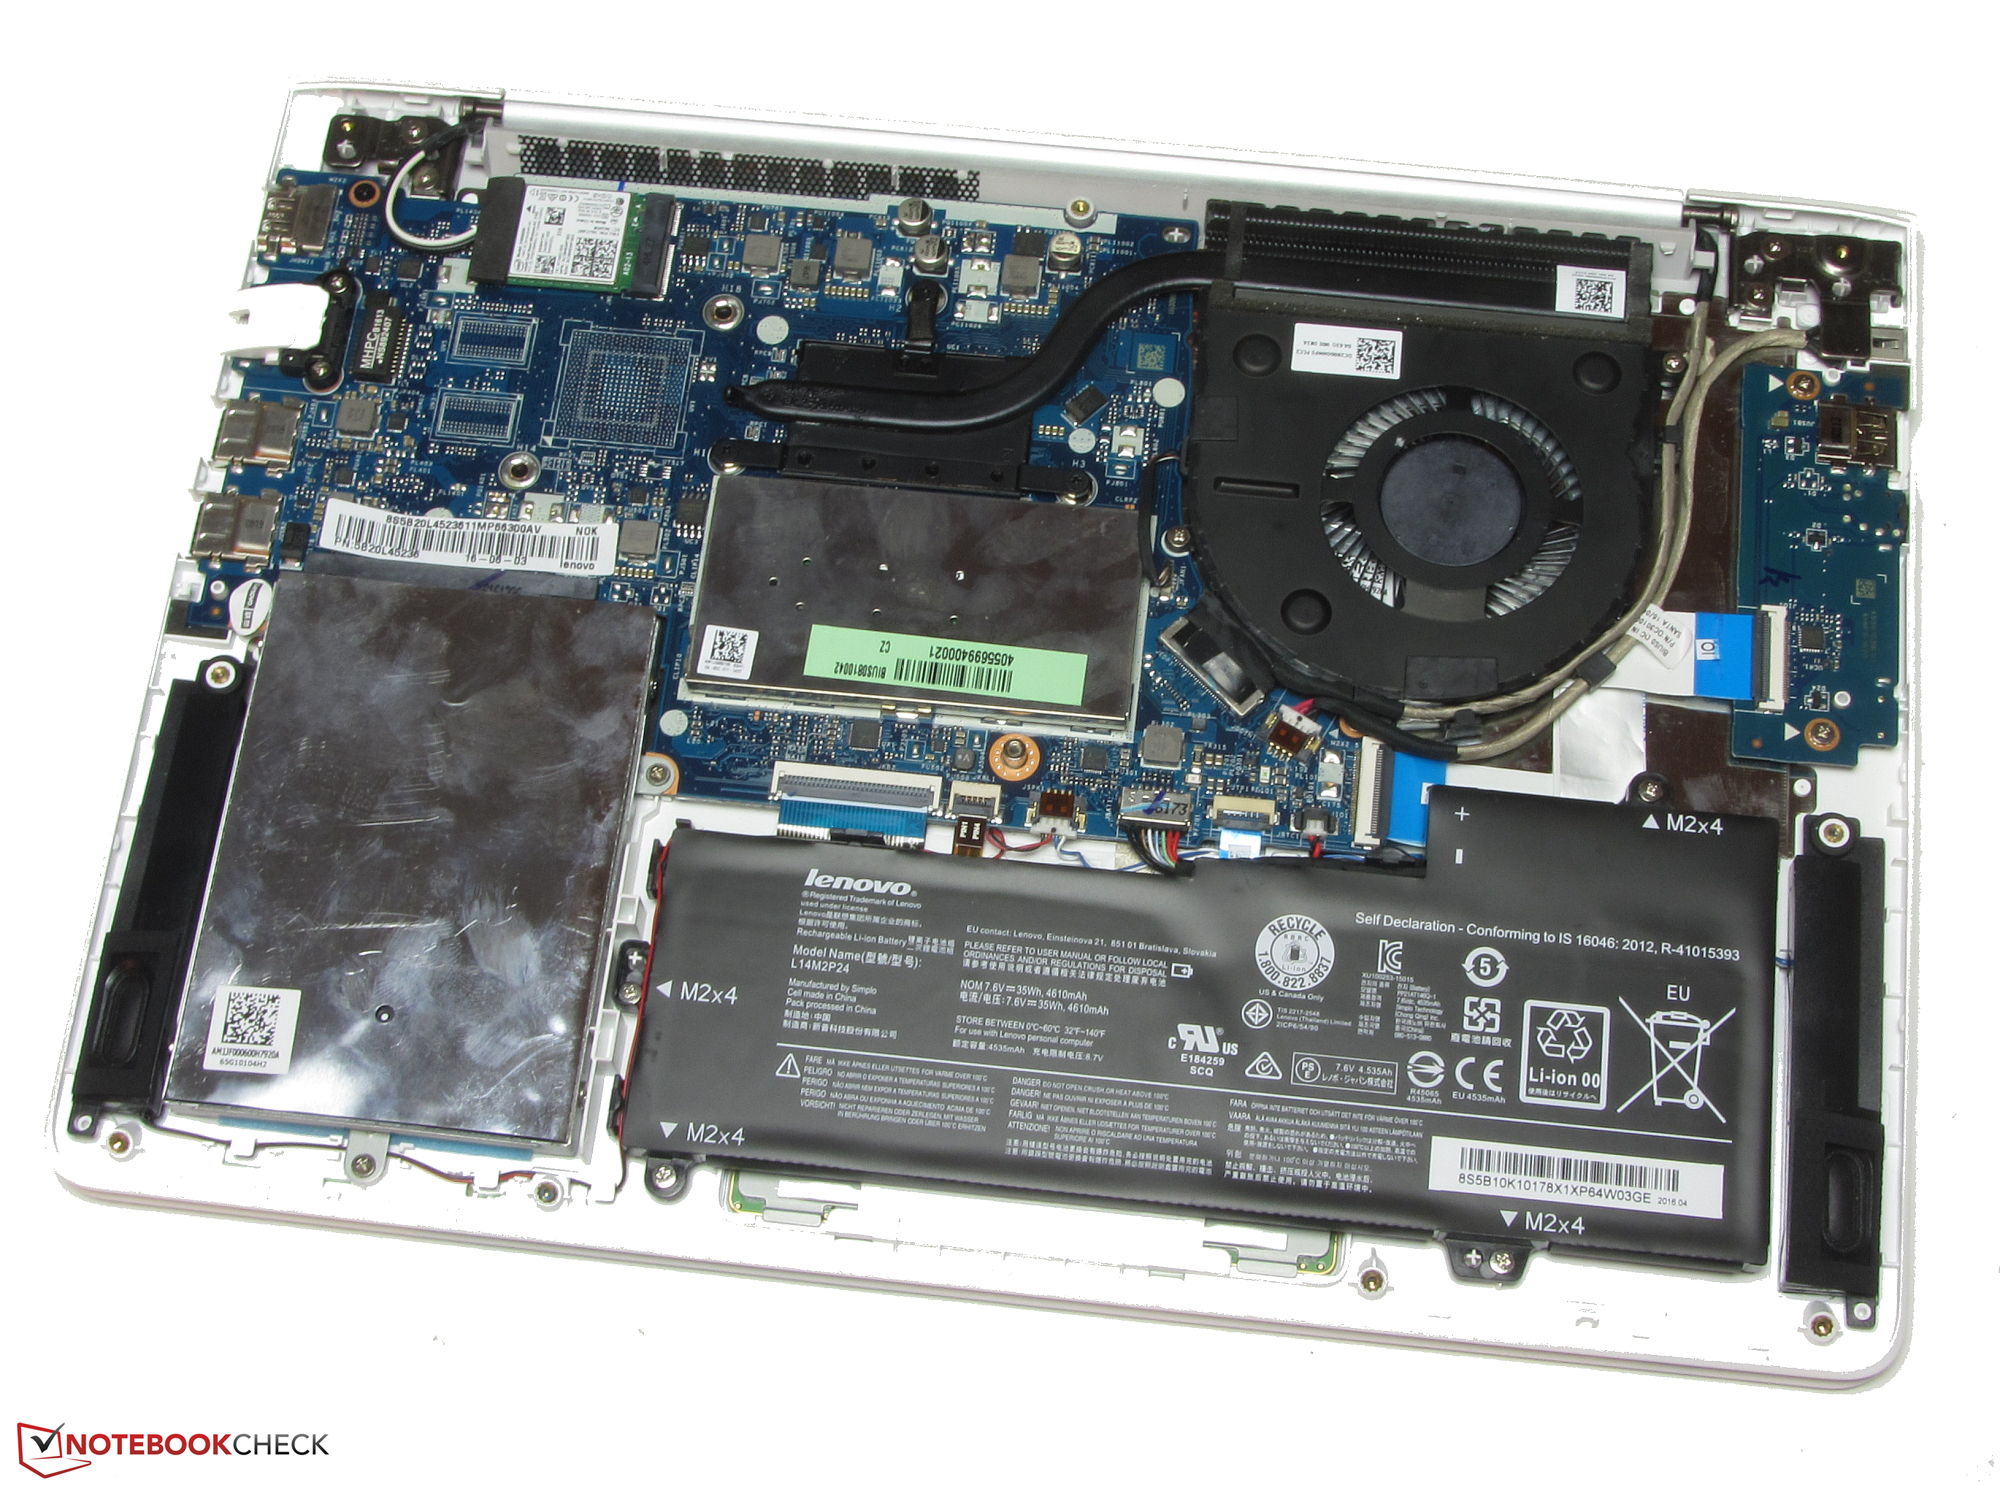
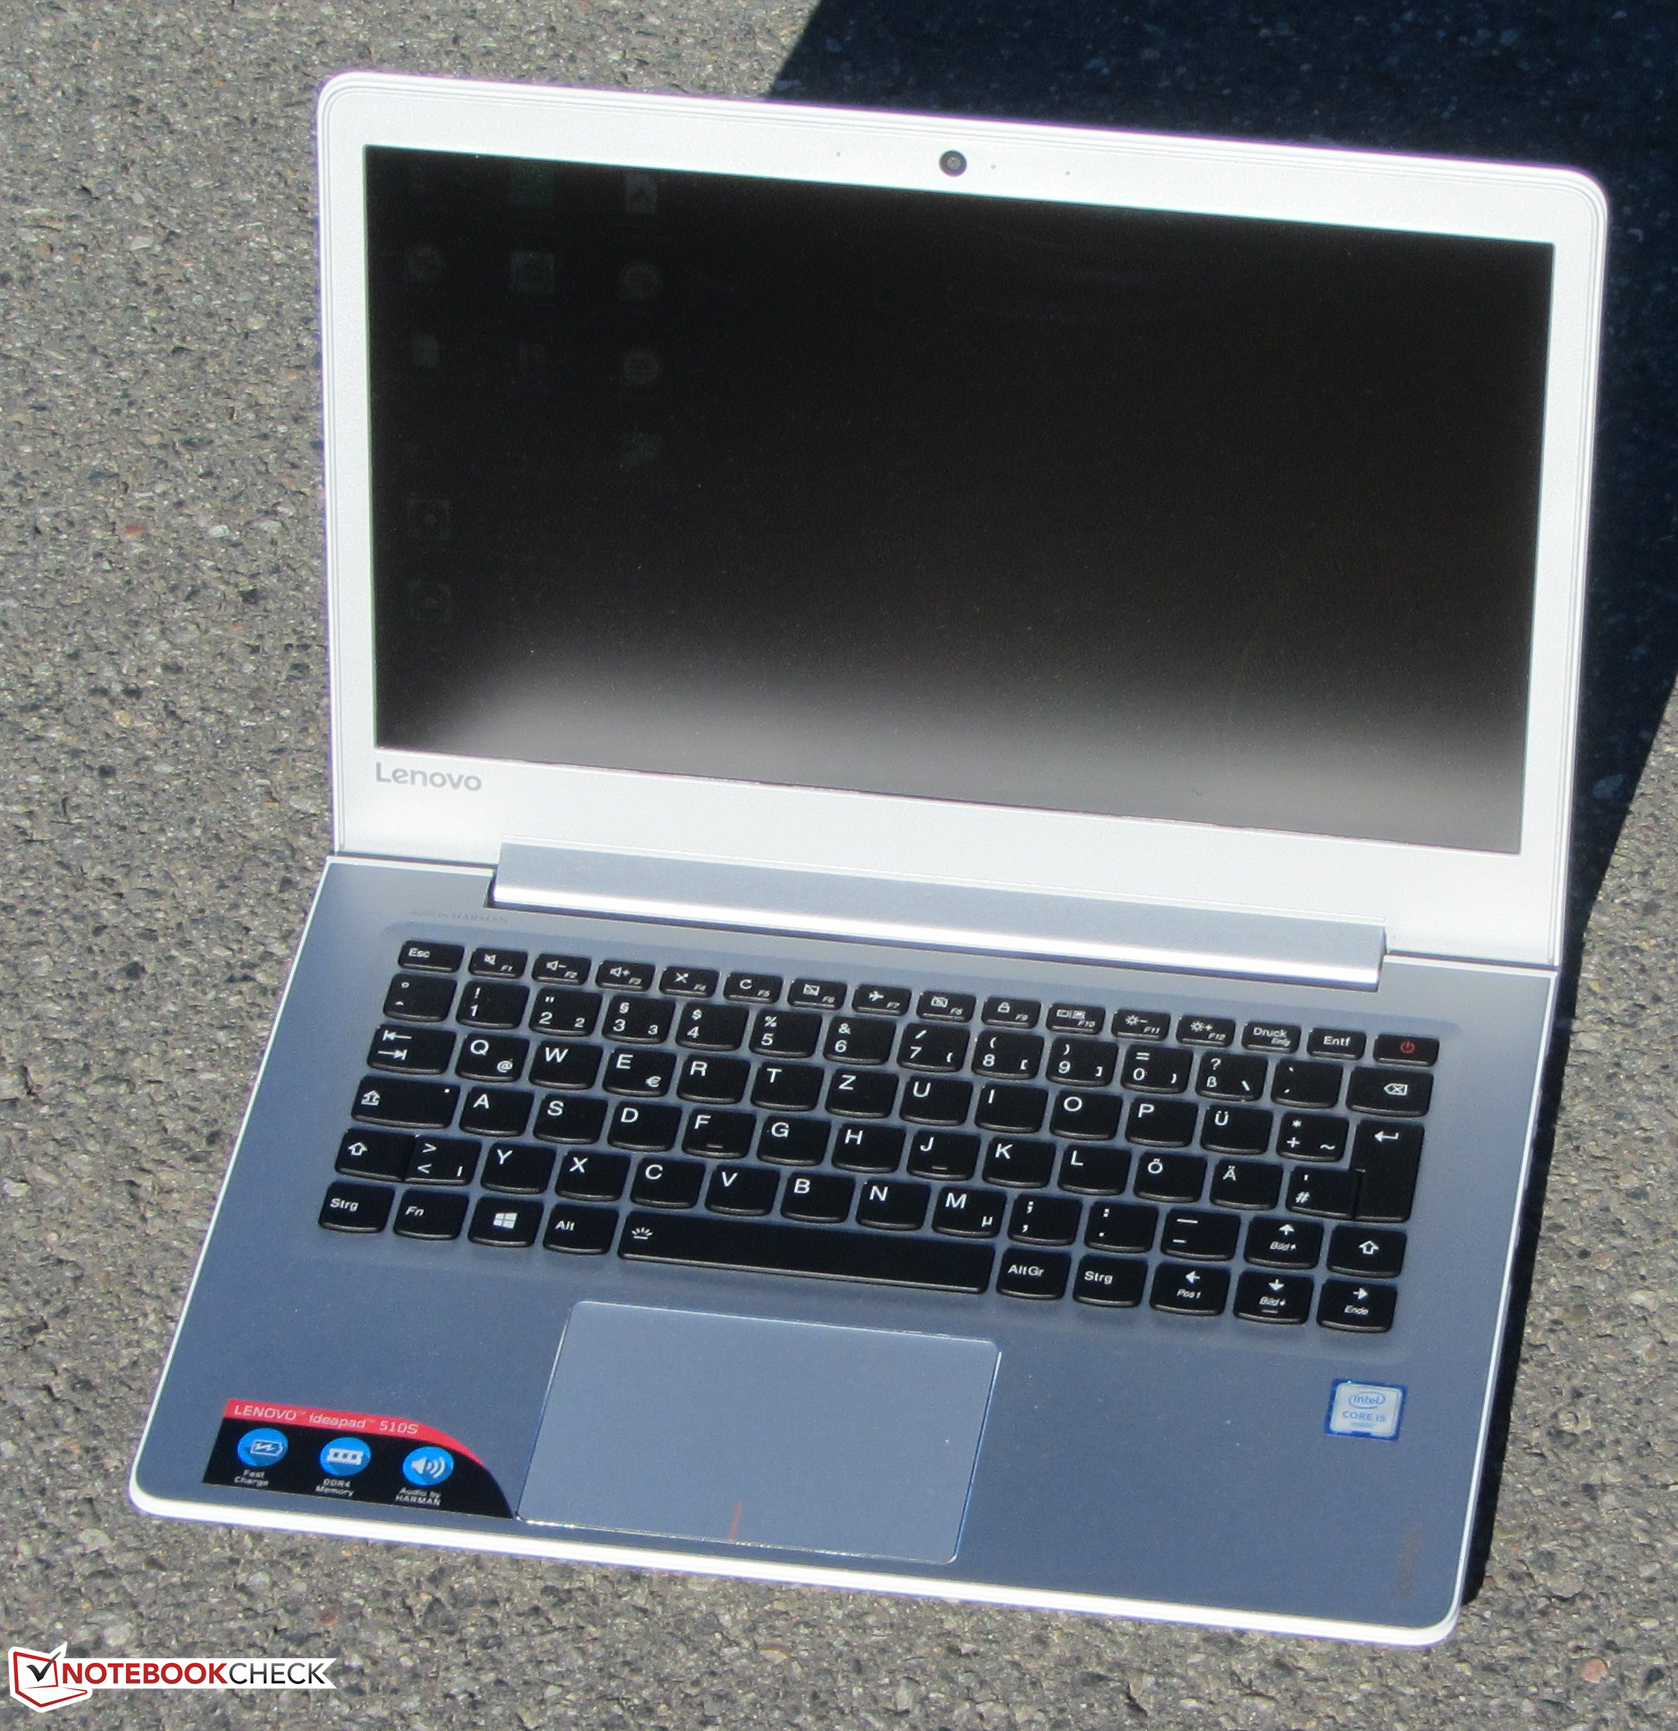
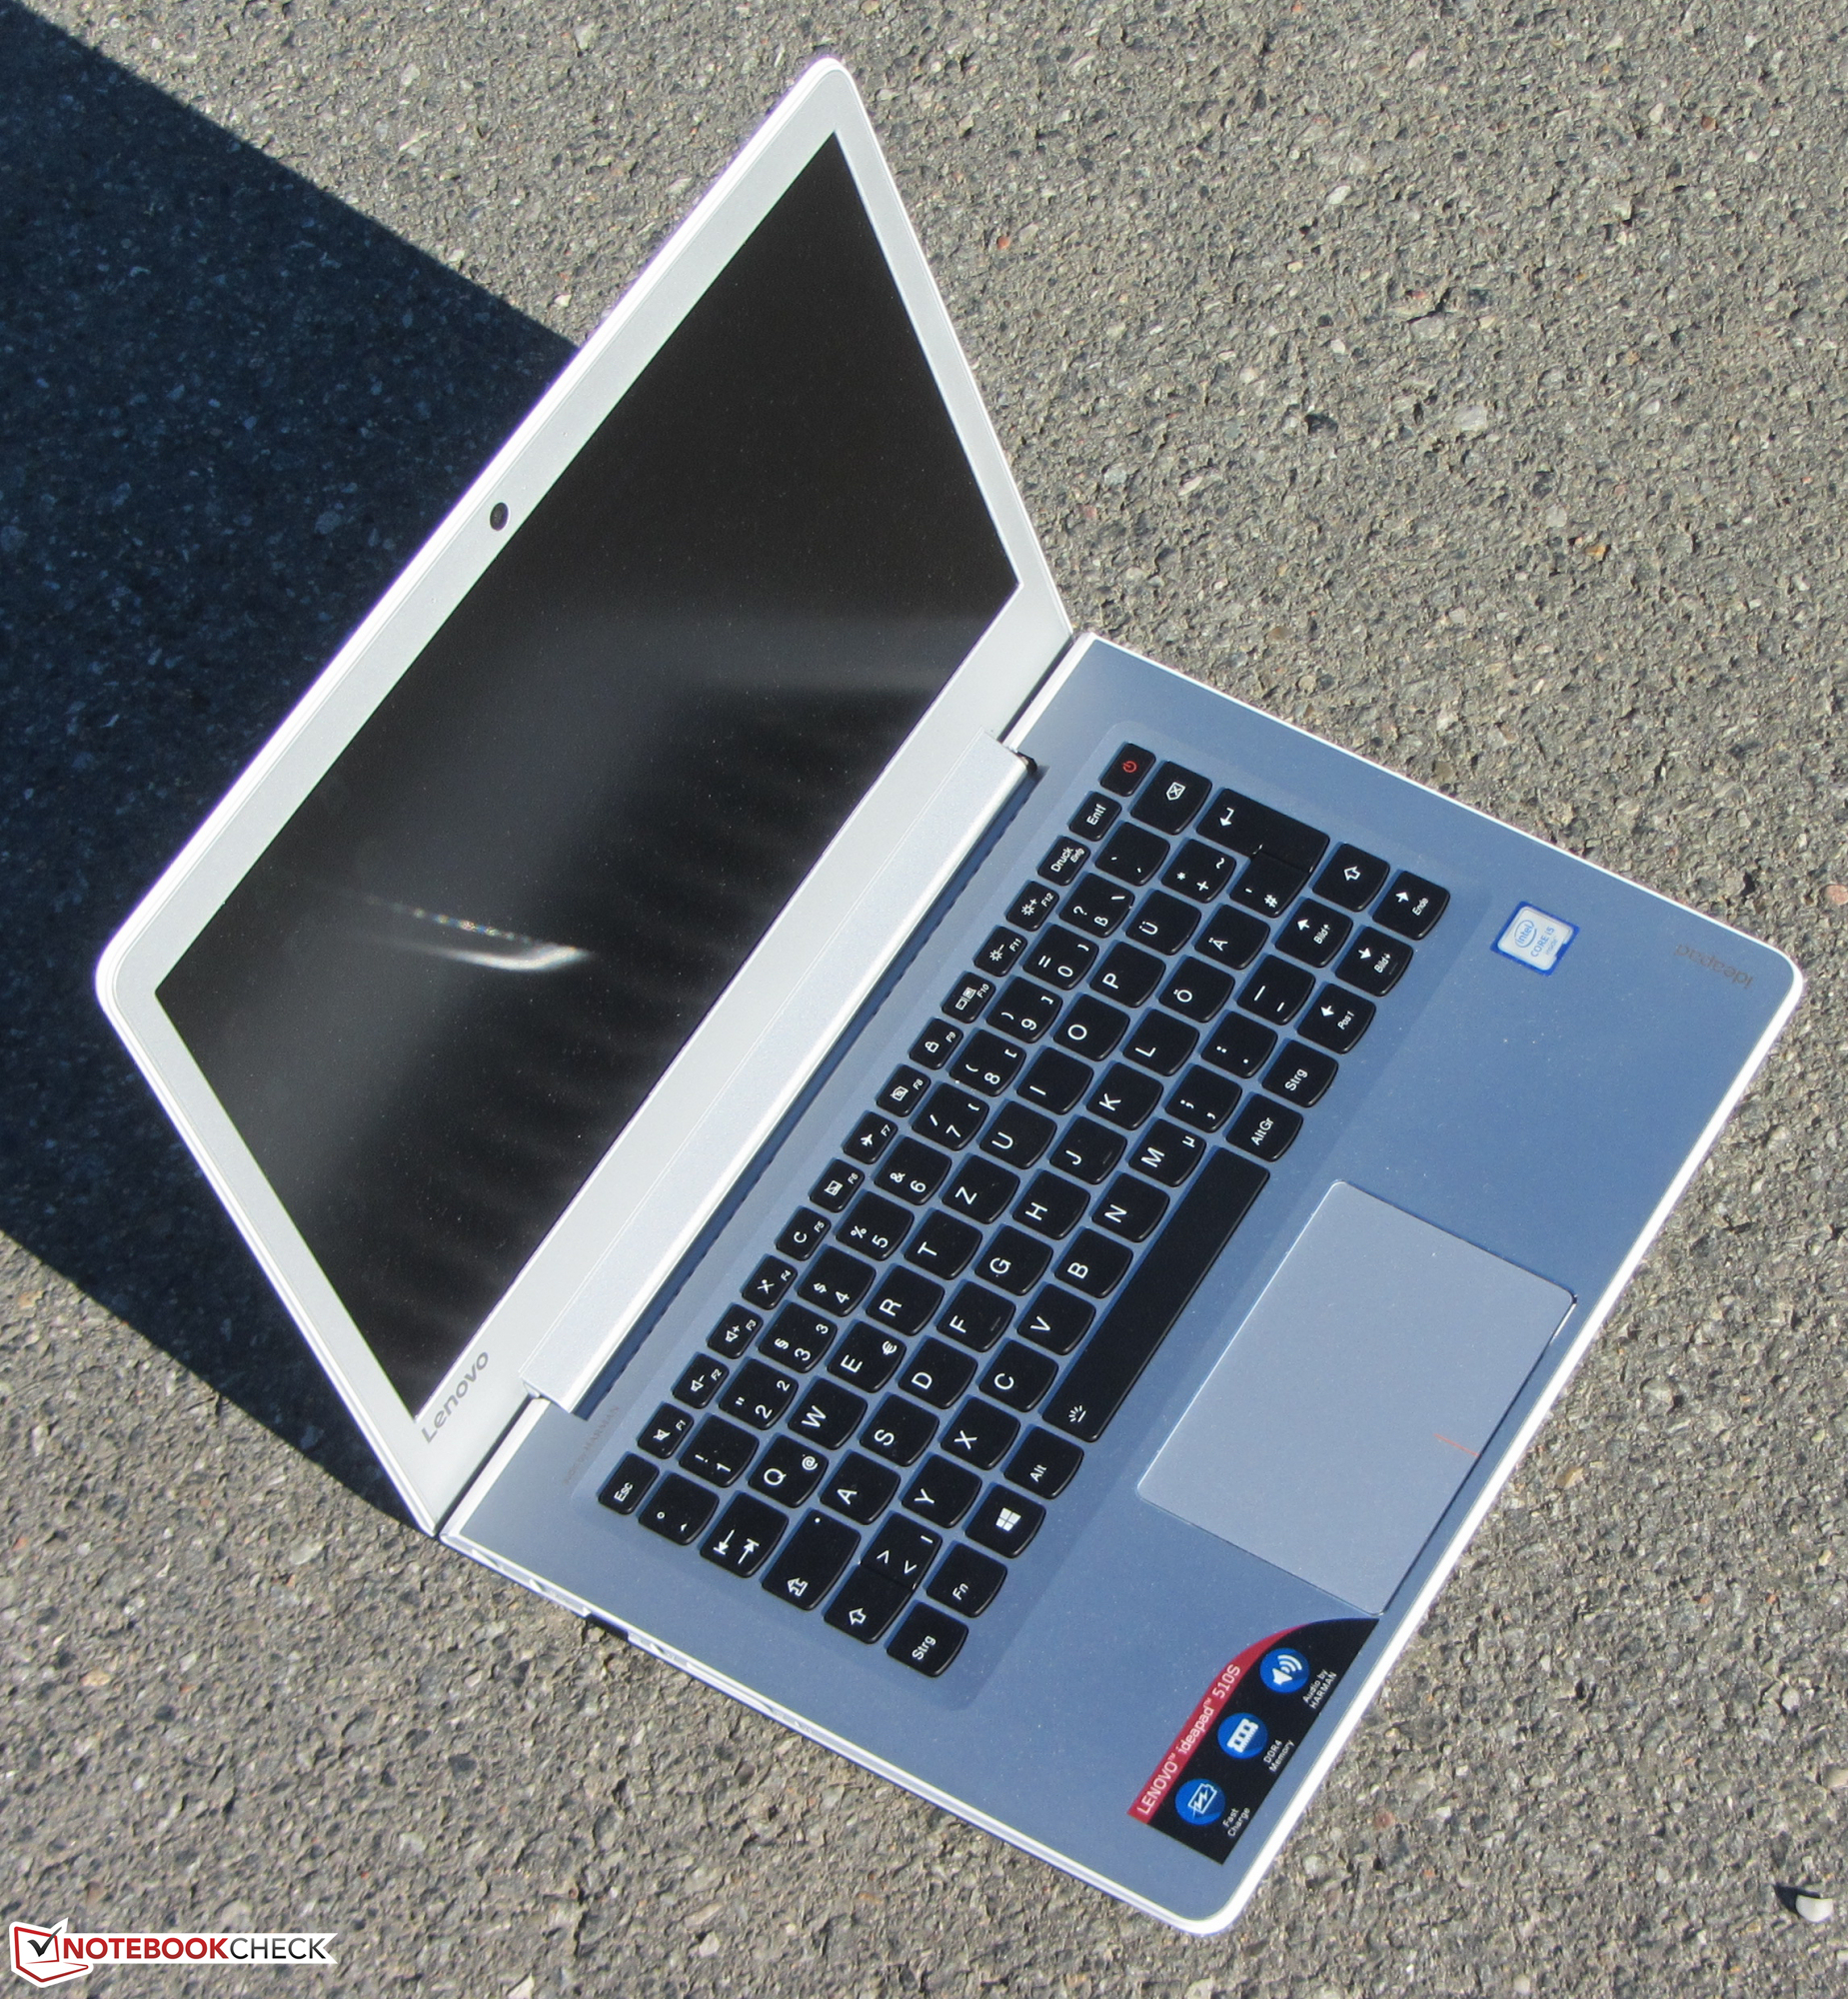
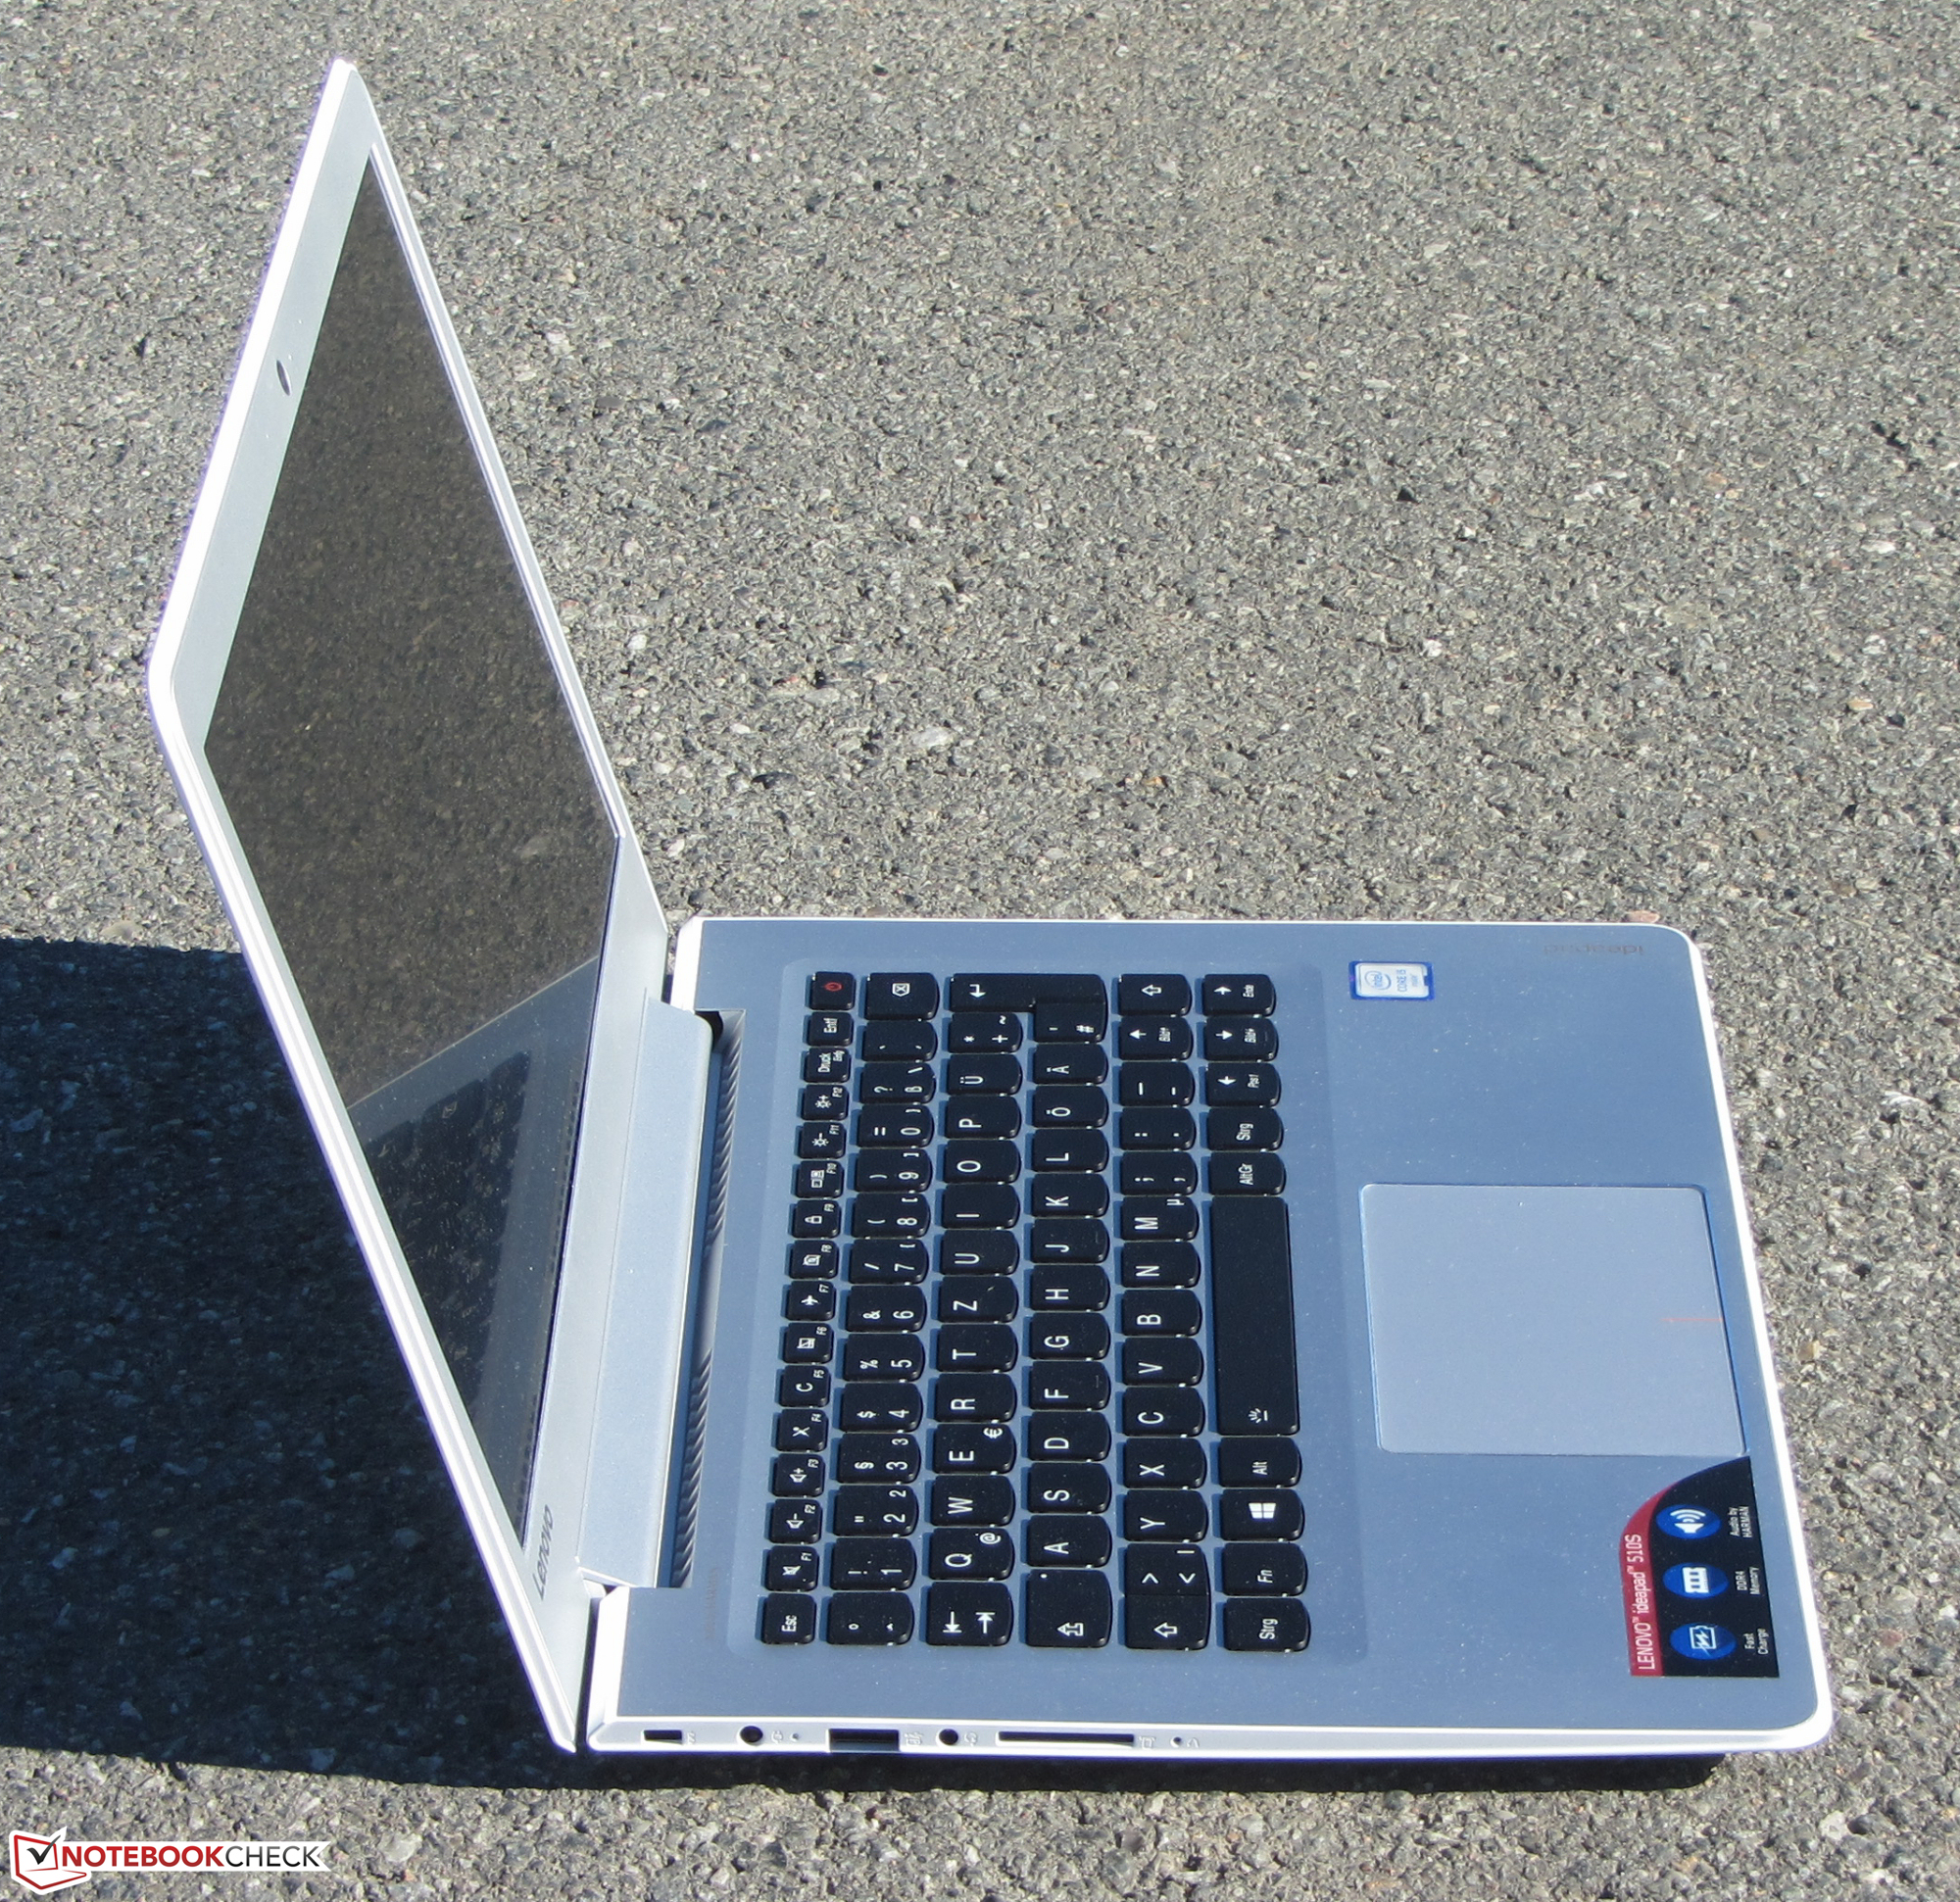
13.3寸的联想Ideapad 510S-13ISK提供了日常使用足够的性能。这台笔记本电脑不会在使用中制造太大的噪音或变的太热。由于搭配了传统硬盘,用户可以得到充裕的1TB存储空间。用户也可以自行选择升级速度更快的固态硬盘,为此用户需要打开笔记本电脑的底盖,幸运的是这并不是很复杂。它的键盘提供了背光,也适合工作使用。这台笔记本电脑的电池续航相对优秀,不过其他的13.3寸设备也证明了它还可以做得更好。全高清IPS屏幕的表现可能不是特别优异,不过也无可厚非。
这台Ideapad是学生的理想笔记本电脑。不过它的电池续航如果更长就更好了。
如果你可以接受不算出色的电池续航,那么80SJ0019GE机型是个不错的选择。售价599欧元(约4487人民币),它搭配了酷睿 i3-6100U处理器,128GB固态硬盘和全高清屏幕。搭配传统硬盘的Ideapad 500S-13ISK售价550欧元。
注:本文是基于完整评测的缩减版本,阅读完整的英文评测,请点击这里。
Lenovo Ideapad 510S-13ISK
-
12/05/2016 v6(old)
Sascha Mölck