 Deutsch
 English
 Español
 Français
 Italiano
 Nederlands
 Polski
 Português
 Русский
 Türkçe
 Svenska
 Chinese
 Magyar
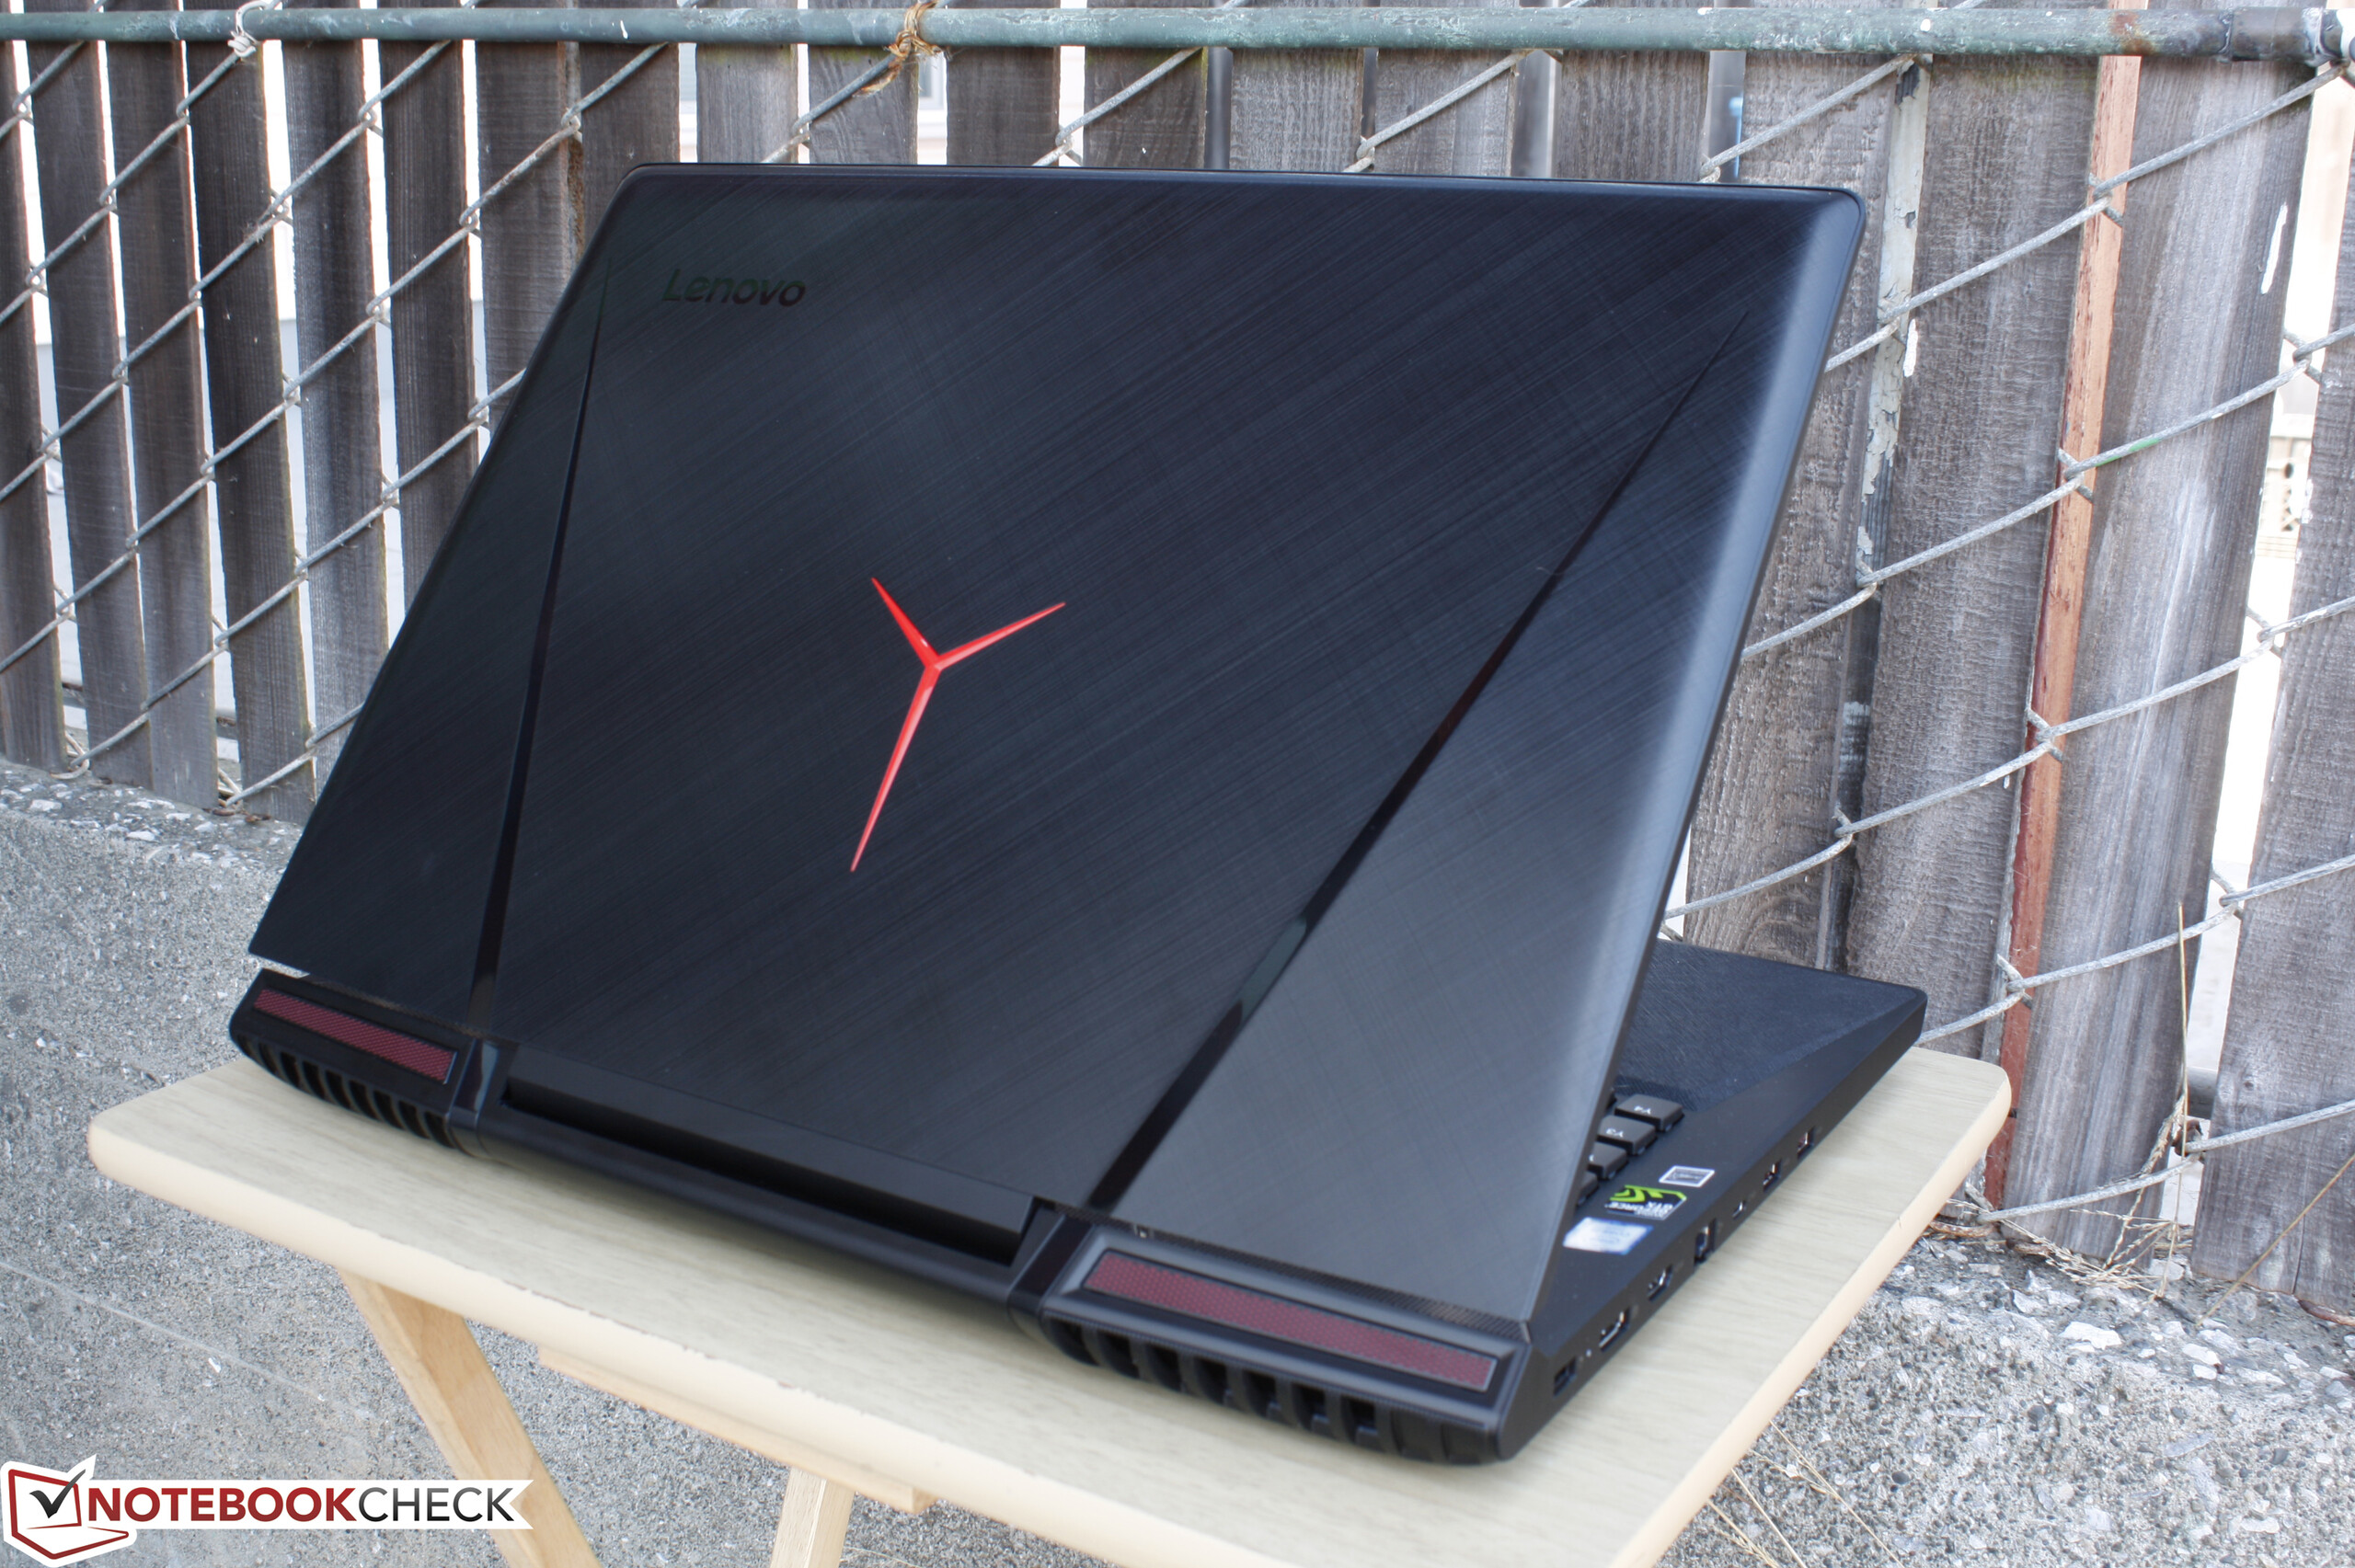
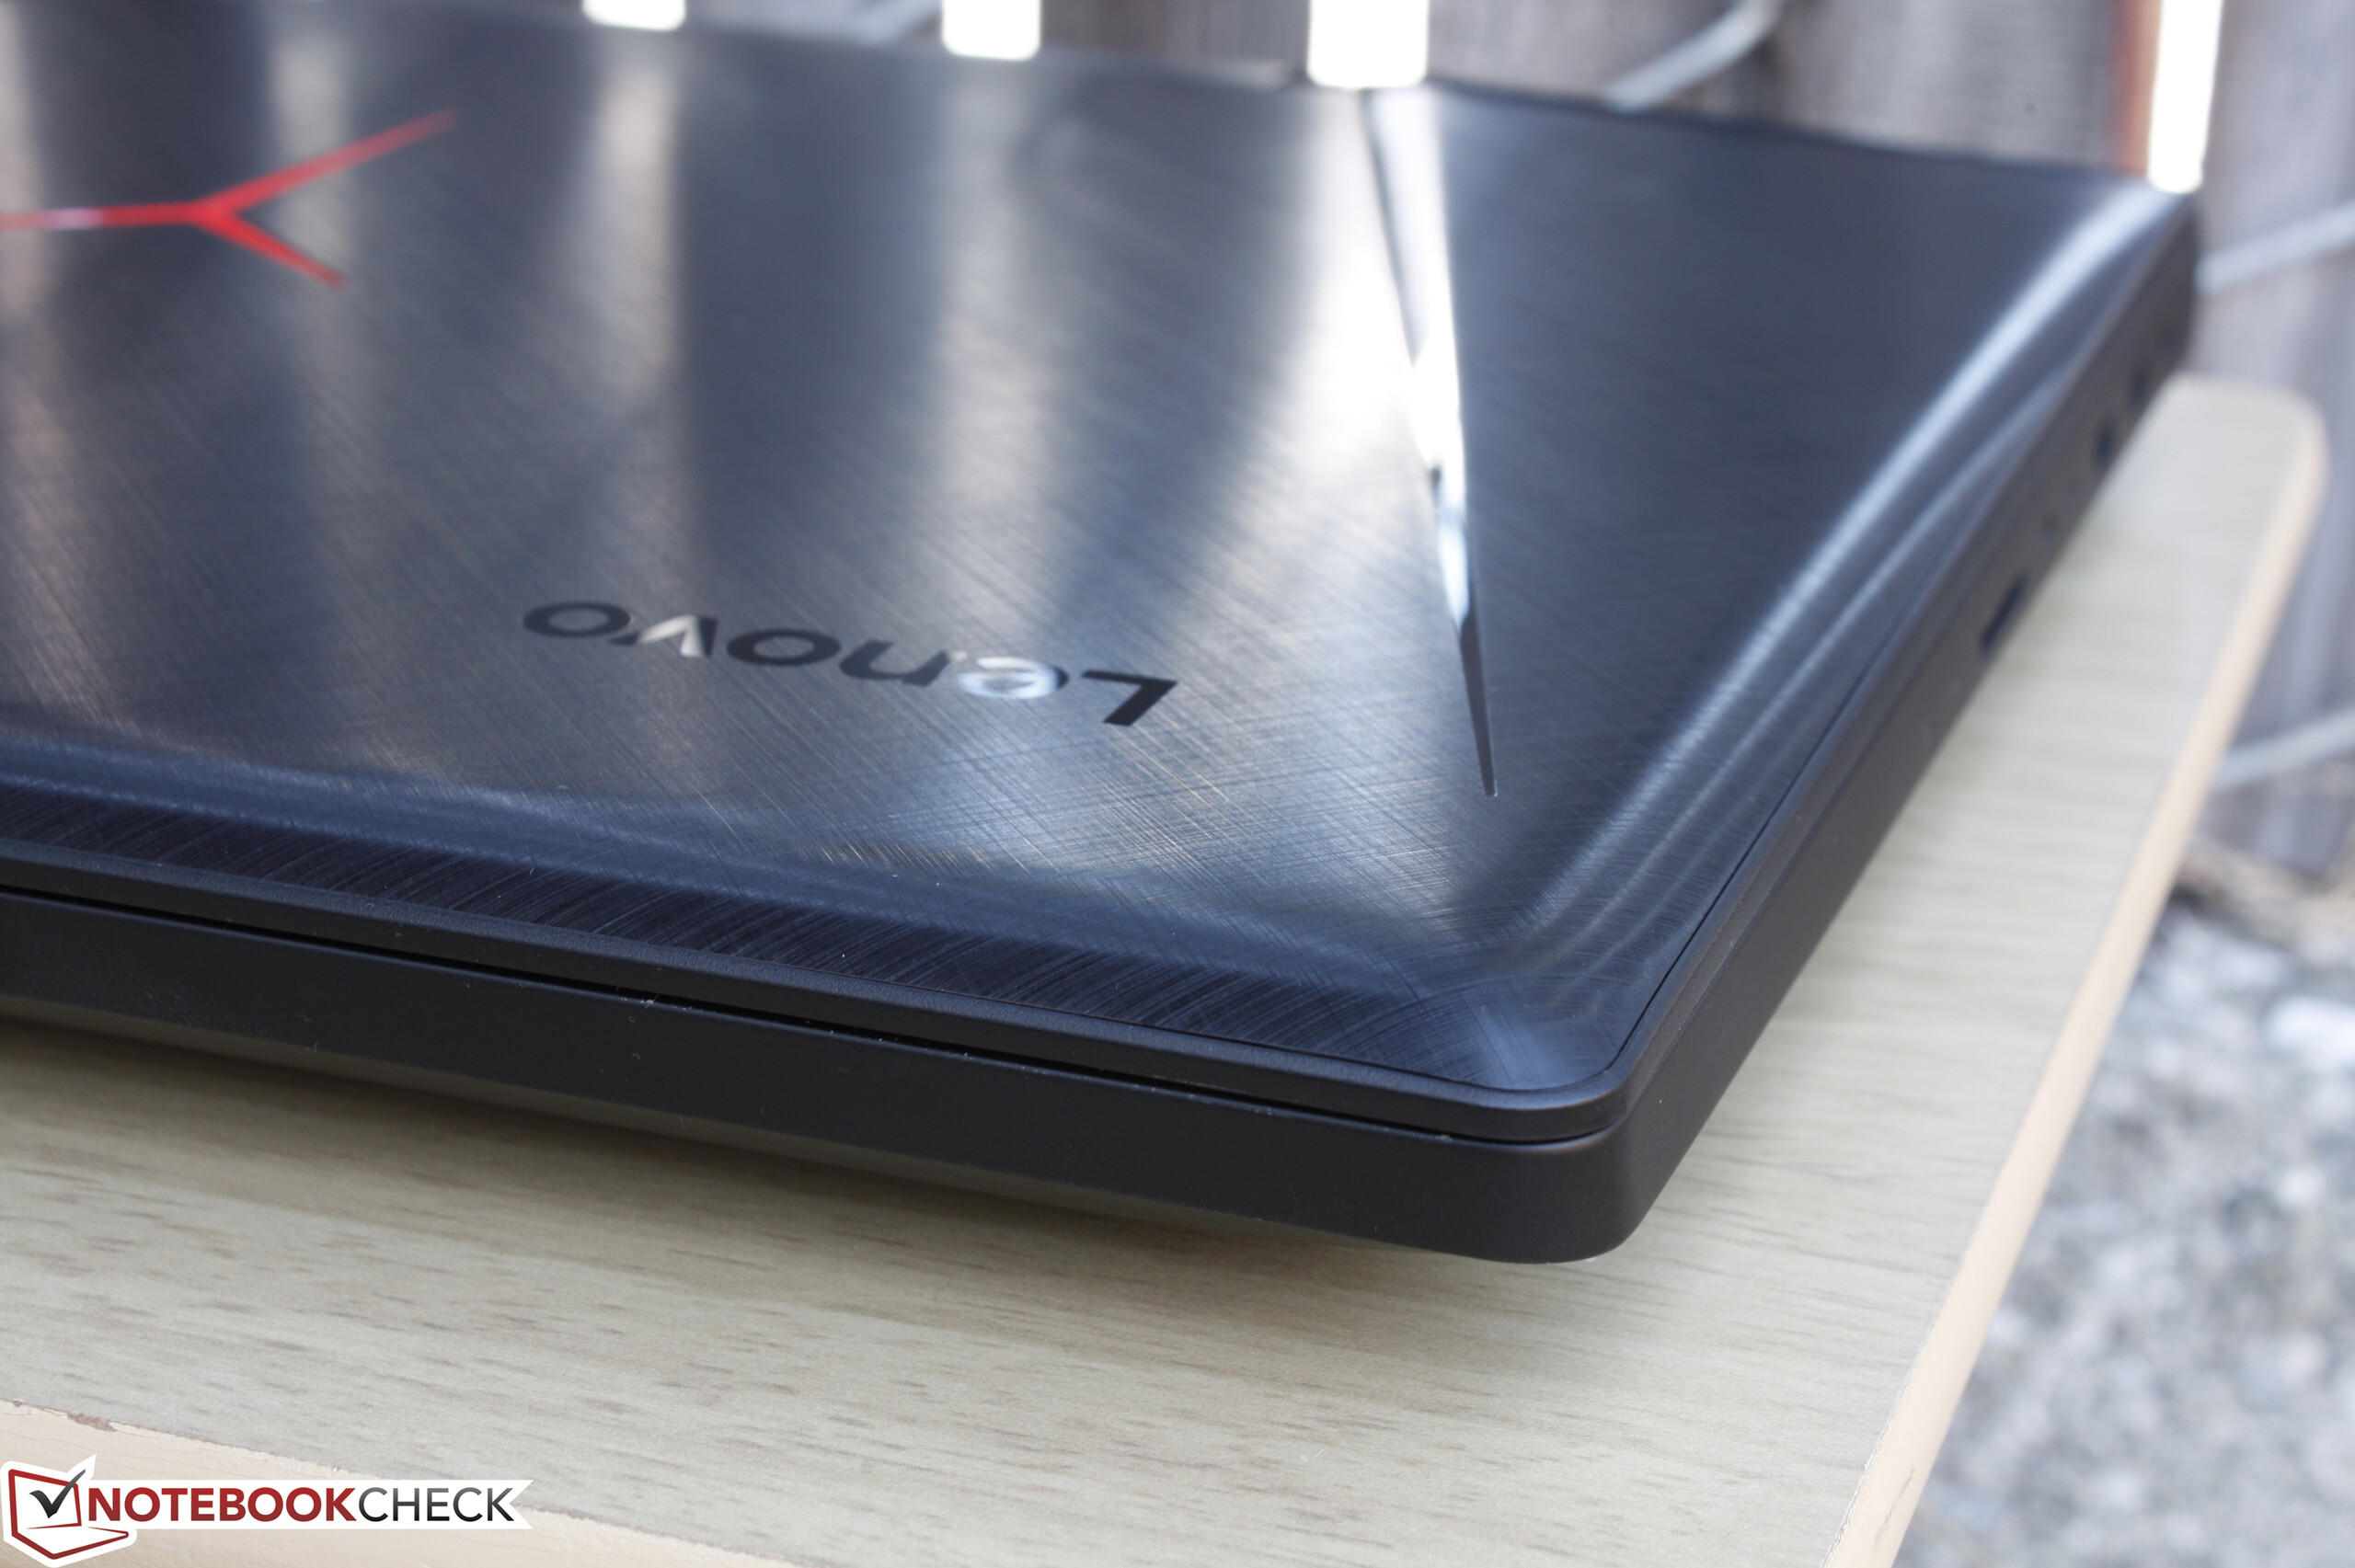
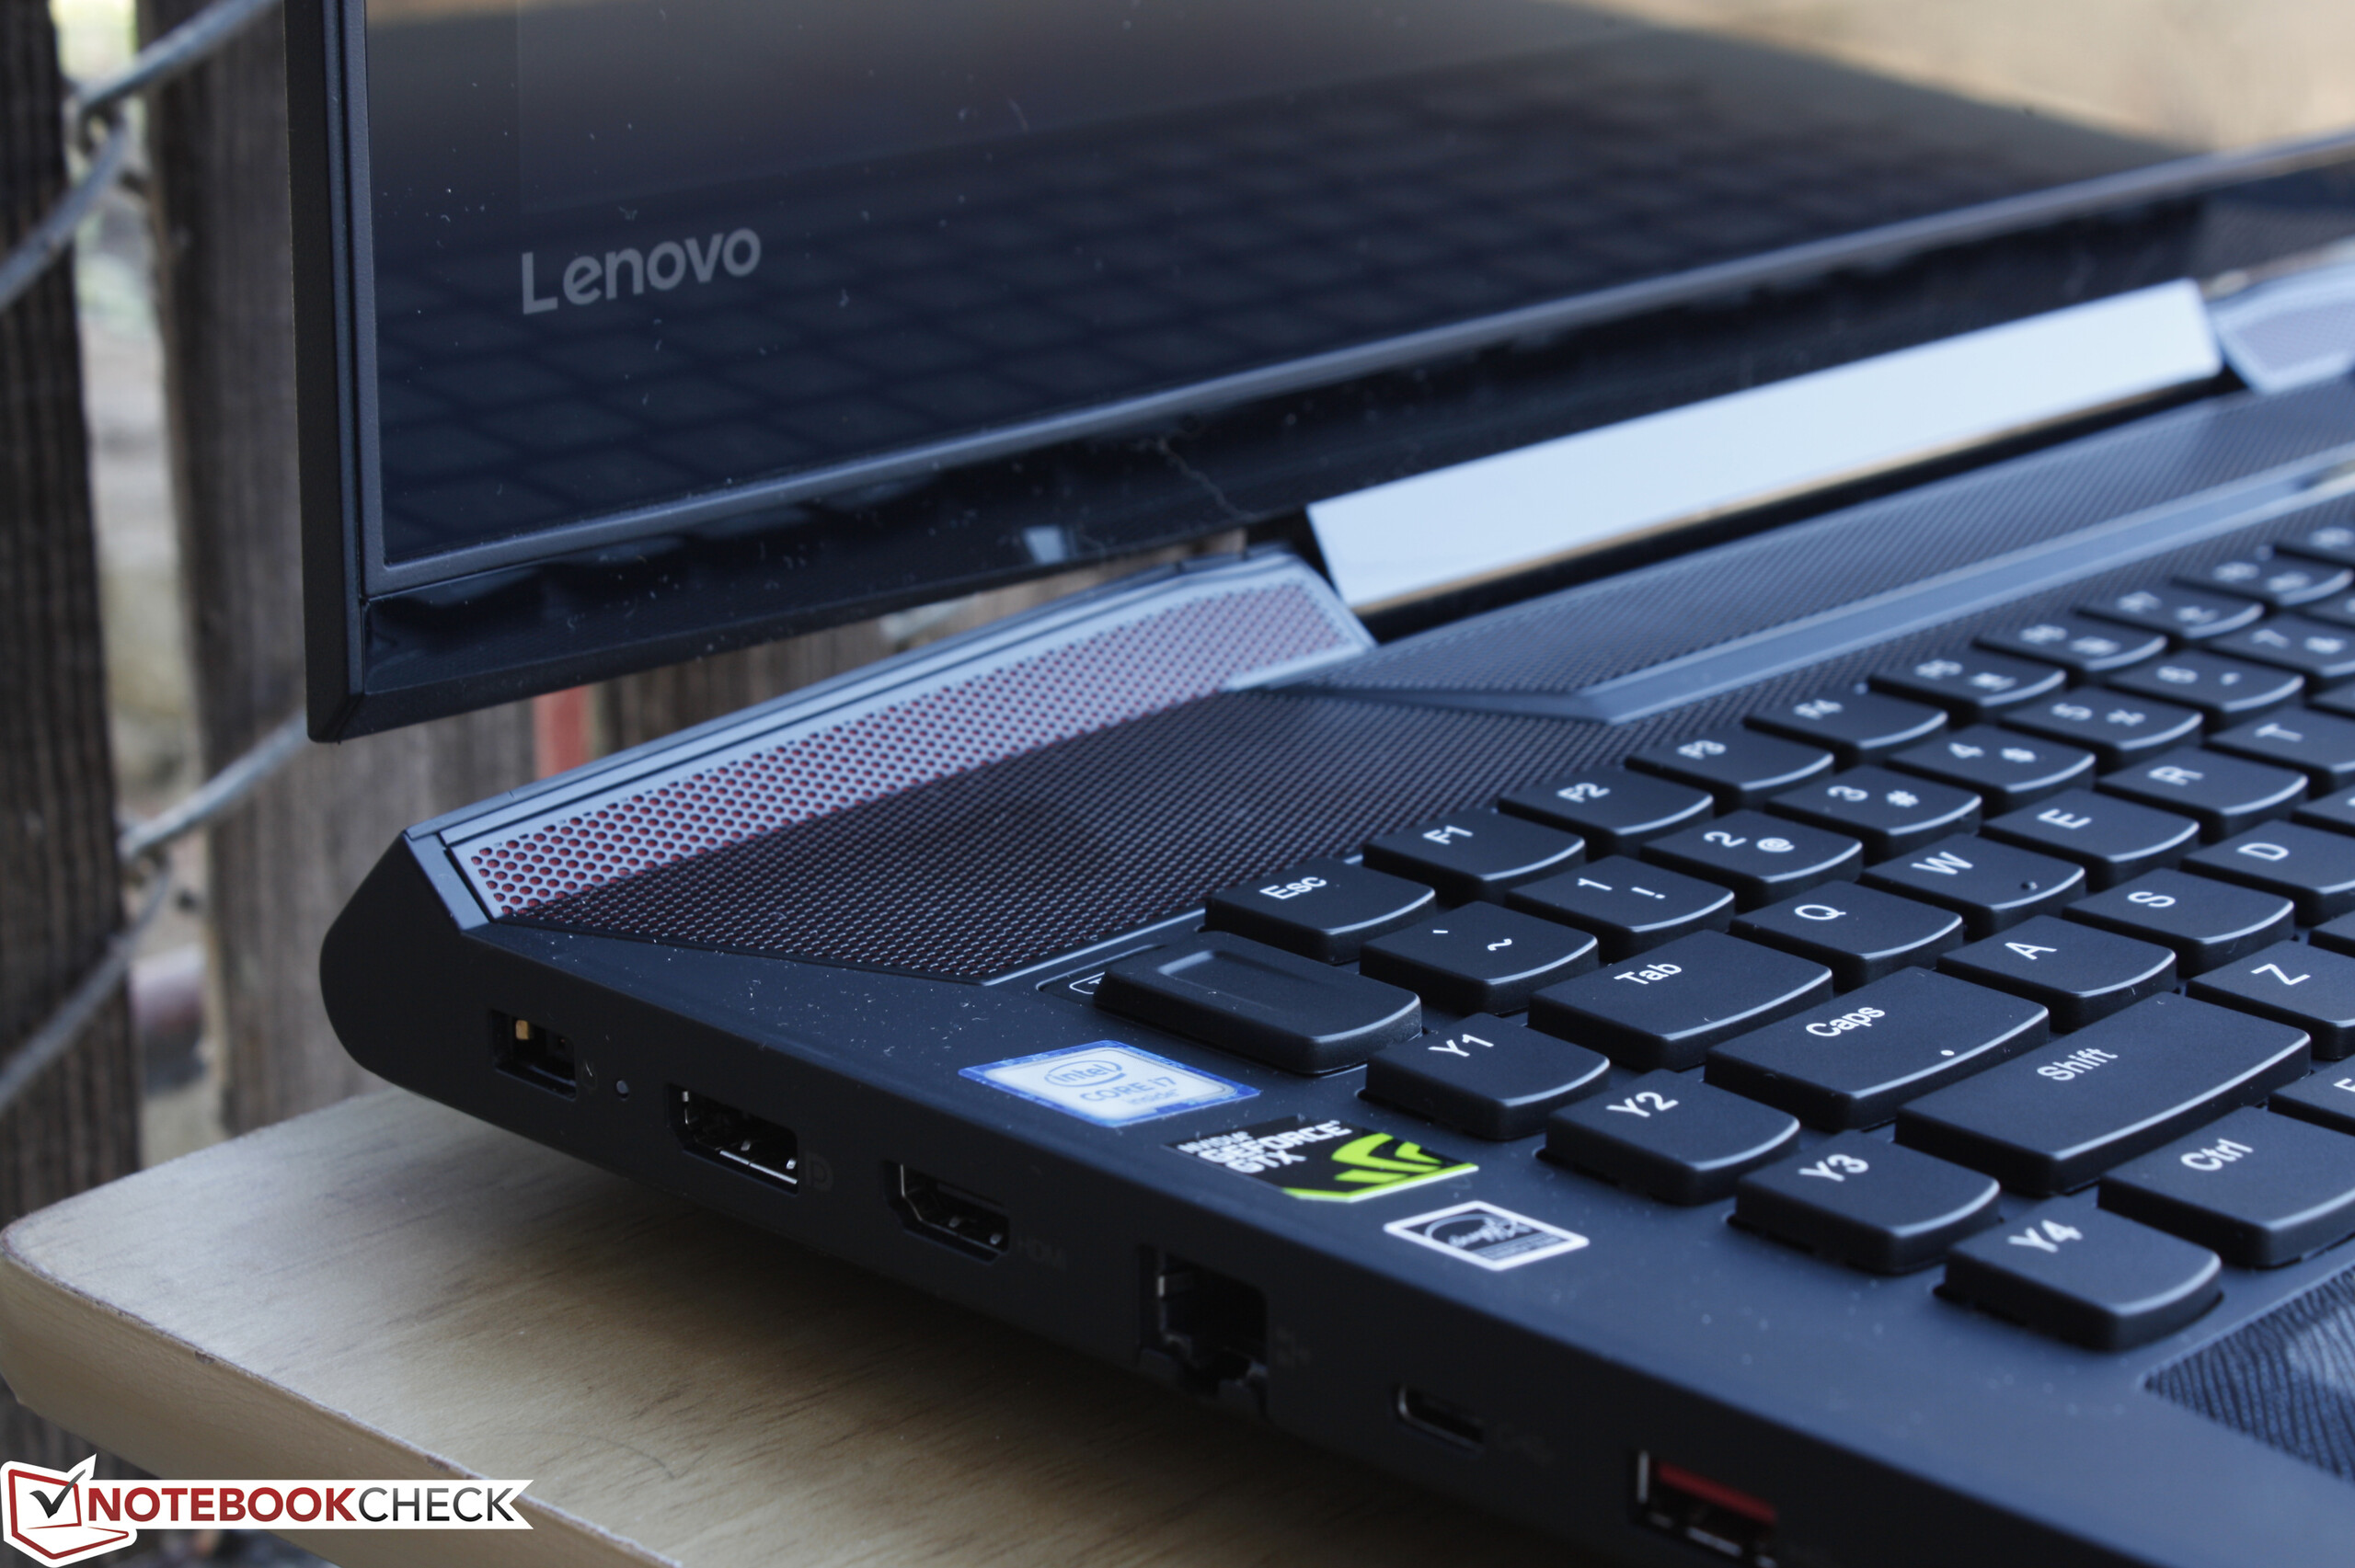
联想 IdeaPad Y900 17ISK 笔记本电脑简短评测


| SD Card Reader | |
| average JPG Copy Test (av. of 3 runs) | |
| MSI GT72VR 6RE-015US | |
| Lenovo IdeaPad Y900 | |
| MSI GS73VR 6RF | |
| maximum AS SSD Seq Read Test (1GB) | |
| MSI GT72VR 6RE-015US | |
| Lenovo IdeaPad Y900 | |
| MSI GS73VR 6RF | |
| Networking | |
| iperf Client (transmit) TCP 1 m 512KB | |
| MSI GT72VR 6RE-015US | |
| Lenovo IdeaPad Y900 | |
| iperf Server (receive) TCP 1 m 512KB | |
| Lenovo IdeaPad Y900 | |
| MSI GT72VR 6RE-015US | |
| |||||||||||||||||||||||||
Brightness Distribution: 86 %
Center on Battery: 344.9 cd/m²
Contrast: 988:1 (Black: 0.349 cd/m²)
ΔE Color 4.49 | 0.5-29.43 Ø5
ΔE Greyscale 4.63 | 0.57-98 Ø5.3
86.4% sRGB (Argyll 1.6.3 3D)
56.7% AdobeRGB 1998 (Argyll 1.6.3 3D)
63.2% AdobeRGB 1998 (Argyll 2.2.0 3D)
86.3% sRGB (Argyll 2.2.0 3D)
67.4% Display P3 (Argyll 2.2.0 3D)
Gamma: 2.11
| Lenovo IdeaPad Y900 17.30, 1920x1080 | Lenovo Ideapad Y700 17ISK 80Q0 IPS, 17.30, 1920x1080 | MSI GT72VR 6RE-015US LG Philips LGD046E, IPS, 17.30, 1920x1080 | Acer Predator 17 G9-793-77LG AU Optronics B173ZAN01.0 (AUO109B), IPS, 17.30, 3840x2160 | EVGA SC17 IPS, 17.30, 3840x2160 | Asus G752VS-XB78K LG Philips LP173WF4-SPF3 (LGD04E8), IPS, 17.30, 1920x1080 | |
|---|---|---|---|---|---|---|
| Display | -1% | 0% | 34% | 34% | -1% | |
| Display P3 Coverage | 67.4 | 67.4 0% | 68.3 1% | 86.9 29% | 87.6 30% | 66.9 -1% |
| sRGB Coverage | 86.3 | 84.8 -2% | 86.7 0% | 100 16% | 100 16% | 85.2 -1% |
| AdobeRGB 1998 Coverage | 63.2 | 62 -2% | 63.4 0% | 99.4 57% | 99 57% | 62.3 -1% |
| Response Times | -41% | 2% | 0% | -78% | 3% | |
| Response Time Grey 50% / Grey 80% * | 34.8 ? | 51.6 ? -48% | 34.4 ? 1% | 37 ? -6% | 69.6 ? -100% | 38 ? -9% |
| Response Time Black / White * | 25.6 ? | 34.4 ? -34% | 25.2 ? 2% | 24 ? 6% | 40 ? -56% | 22 ? 14% |
| PWM Frequency | 1000 ? | |||||
| Screen | 7% | 8% | 18% | 4% | 7% | |
| Brightness middle | 344.9 | 349.7 1% | 348.7 1% | 336 -3% | 394.1 14% | 328 -5% |
| Brightness | 329 | 332 1% | 327 -1% | 320 -3% | 368 12% | 317 -4% |
| Brightness Distribution | 86 | 90 5% | 89 3% | 88 2% | 83 -3% | 88 2% |
| Black Level * | 0.349 | 0.304 13% | 0.323 7% | 0.25 28% | 0.439 -26% | 0.3 14% |
| Contrast | 988 | 1150 16% | 1080 9% | 1344 36% | 898 -9% | 1093 11% |
| Colorchecker dE 2000 * | 4.49 | 3.99 11% | 4.09 9% | 3.61 20% | 5.79 -29% | 3.74 17% |
| Colorchecker dE 2000 max. * | 8.72 | 8.74 -0% | 9.02 -3% | 6.02 31% | 8.44 3% | 8.97 -3% |
| Greyscale dE 2000 * | 4.63 | 3.34 28% | 2.14 54% | 4.78 -3% | 4.23 9% | 2.67 42% |
| Gamma | 2.11 104% | 2.23 99% | 2.25 98% | 2.32 95% | 2.11 104% | 2.41 91% |
| CCT | 6905 94% | 6111 106% | 6885 94% | 6185 105% | 7479 87% | 6861 95% |
| Color Space (Percent of AdobeRGB 1998) | 56.7 | 55.8 -2% | 56.9 0% | 88 55% | 86.6 53% | 56 -1% |
| Color Space (Percent of sRGB) | 86.4 | 84.8 -2% | 86.5 0% | 100 16% | 100 16% | 85 -2% |
| Total Average (Program / Settings) | -12% /
-1% | 3% /
6% | 17% /
19% | -13% /
-1% | 3% /
5% |
* ... smaller is better
Display Response Times
| ↔ Response Time Black to White | ||
|---|---|---|
| 25.6 ms ... rise ↗ and fall ↘ combined | ↗ 4.8 ms rise | 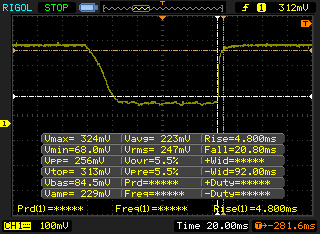 |
| ↘ 20.8 ms fall | ||
| The screen shows relatively slow response rates in our tests and may be too slow for gamers. In comparison, all tested devices range from 0.1 (minimum) to 240 (maximum) ms. » 56 % of all devices are better. This means that the measured response time is worse than the average of all tested devices (21.5 ms). | ||
| ↔ Response Time 50% Grey to 80% Grey | ||
| 34.8 ms ... rise ↗ and fall ↘ combined | ↗ 14 ms rise | 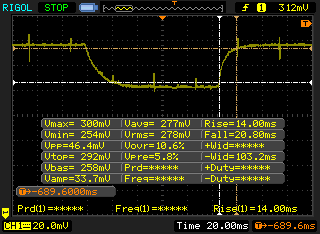 |
| ↘ 20.8 ms fall | ||
| The screen shows slow response rates in our tests and will be unsatisfactory for gamers. In comparison, all tested devices range from 0.2 (minimum) to 636 (maximum) ms. » 42 % of all devices are better. This means that the measured response time is similar to the average of all tested devices (33.7 ms). | ||
Screen Flickering / PWM (Pulse-Width Modulation)
| Screen flickering / PWM not detected | 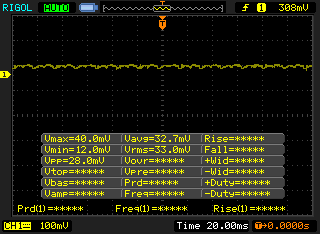 | ||
In comparison: 53 % of all tested devices do not use PWM to dim the display. If PWM was detected, an average of 17900 (minimum: 5 - maximum: 3846000) Hz was measured. | |||
| Cinebench R10 | |
| Rendering Multiple CPUs 32Bit | |
| DogHouse Systems Mobius SS | |
| Lenovo IdeaPad Y900 | |
| MSI GP62-2QEi781FD | |
| Rendering Single 32Bit | |
| DogHouse Systems Mobius SS | |
| Lenovo IdeaPad Y900 | |
| MSI GP62-2QEi781FD | |
| wPrime 2.10 - 1024m | |
| Lenovo IdeaPad Y900 | |
| MSI GP62-2QEi781FD | |
| DogHouse Systems Mobius SS | |
| Super Pi Mod 1.5 XS 32M - 32M | |
| MSI GP62-2QEi781FD | |
| Lenovo IdeaPad Y900 | |
| DogHouse Systems Mobius SS | |
* ... smaller is better
| PCMark 8 | |
| Home Score Accelerated v2 | |
| Lenovo IdeaPad Y900 | |
| MSI GT72VR 6RE-015US | |
| Acer Predator 17 G9-793-77LG | |
| Lenovo Ideapad Y700 17ISK 80Q0 | |
| Work Score Accelerated v2 | |
| Lenovo IdeaPad Y900 | |
| MSI GT72VR 6RE-015US | |
| Lenovo Ideapad Y700 17ISK 80Q0 | |
| Creative Score Accelerated v2 | |
| MSI GT72VR 6RE-015US | |
| Lenovo IdeaPad Y900 | |
| Lenovo Ideapad Y700 17ISK 80Q0 | |
| Acer Predator 17 G9-793-77LG | |
| PCMark 8 Home Score Accelerated v2 | 4952 points | |
| PCMark 8 Creative Score Accelerated v2 | 6609 points | |
| PCMark 8 Work Score Accelerated v2 | 5533 points | |
Help | ||
| Lenovo IdeaPad Y900 Samsung SM951 MZVPV256 m.2 | Lenovo Ideapad Y700 17ISK 80Q0 Samsung MZNLN128HCGR-000L2 | MSI GT72VR 6RE-015US SanDisk SD8SNAT256G1122 | EVGA SC17 Samsung SSD 950 Pro 512GB m.2 NVMe | Asus G752VS-XB78K Toshiba NVMe THNSN5512GPU7 | |
|---|---|---|---|---|---|
| CrystalDiskMark 3.0 | -55% | -58% | 21% | 23% | |
| Read Seq | 1559 | 513 -67% | 529 -66% | 2247 44% | 1718 10% |
| Write Seq | 1254 | 156.3 -88% | 338.5 -73% | 1534 22% | 1305 4% |
| Read 512 | 850 | 435.6 -49% | 288.9 -66% | 1113 31% | 1250 47% |
| Write 512 | 1228 | 156.5 -87% | 319.2 -74% | 1490 21% | 1438 17% |
| Read 4k | 49.32 | 36.89 -25% | 23.1 -53% | 52.1 6% | 44.42 -10% |
| Write 4k | 140.3 | 96.9 -31% | 99.4 -29% | 149.2 6% | 154.4 10% |
| Read 4k QD32 | 539 | 358.8 -33% | 147.5 -73% | 635 18% | 744 38% |
| Write 4k QD32 | 345.3 | 138.9 -60% | 236.9 -31% | 422 22% | 578 67% |

| 3DMark | |
| 1920x1080 Fire Strike Graphics | |
| Asus G701VO-CS74K | |
| MSI GT72VR 6RD-063US | |
| Lenovo IdeaPad Y900 | |
| Asus Strix GL502VY-DS71 | |
| Lenovo Ideapad Y700 17ISK 80Q0 | |
| 3840x2160 Fire Strike Ultra Graphics | |
| Asus G701VO-CS74K | |
| MSI GT72VR 6RD-063US | |
| Lenovo IdeaPad Y900 | |
| Asus Strix GL502VY-DS71 | |
| Lenovo Ideapad Y700 17ISK 80Q0 | |
| Fire Strike Extreme Graphics | |
| Asus G701VO-CS74K | |
| MSI GT72VR 6RD-063US | |
| Lenovo IdeaPad Y900 | |
| Asus Strix GL502VY-DS71 | |
| Lenovo Ideapad Y700 17ISK 80Q0 | |
| 3DMark 11 | |
| 1280x720 Performance GPU | |
| Asus G701VO-CS74K | |
| Lenovo IdeaPad Y900 | |
| MSI GT72VR 6RD-063US | |
| Asus Strix GL502VY-DS71 | |
| Lenovo Ideapad Y700 17ISK 80Q0 | |
| 1280x720 Performance Combined | |
| Lenovo IdeaPad Y900 | |
| Asus G701VO-CS74K | |
| Asus Strix GL502VY-DS71 | |
| MSI GT72VR 6RD-063US | |
| Lenovo Ideapad Y700 17ISK 80Q0 | |
| 3DMark 11 Performance | 12267 points | |
| 3DMark Ice Storm Standard Score | 134877 points | |
| 3DMark Cloud Gate Standard Score | 26493 points | |
| 3DMark Fire Strike Score | 8653 points | |
| 3DMark Fire Strike Extreme Score | 4478 points | |
Help | ||
| Sleeping Dogs - 1920x1080 Extreme Preset AA:Extreme | |
| Asus G701VO-CS74K | |
| Lenovo IdeaPad Y900 | |
| Asus Strix GL502VY-DS71 | |
| Asus Strix GL502VT-DS74 | |
| Guild Wars 2 - 1920x1080 All Maximum / On AA:FX | |
| Lenovo IdeaPad Y900 | |
| MSI GT72VR 6RD-063US | |
| BioShock Infinite - 1920x1080 Ultra Preset, DX11 (DDOF) | |
| Asus G701VO-CS74K | |
| MSI GT72VR 6RD-063US | |
| Lenovo IdeaPad Y900 | |
| Asus Strix GL502VY-DS71 | |
| Asus Strix GL502VT-DS74 | |
| Metro: Last Light - 1920x1080 Very High (DX11) AF:16x | |
| Asus G701VO-CS74K | |
| MSI GT72VR 6RD-063US | |
| Lenovo IdeaPad Y900 | |
| Asus Strix GL502VT-DS74 | |
| Thief - 1920x1080 Very High Preset AA:FXAA & High SS AF:8x | |
| MSI GT72VR 6RD-063US | |
| Asus G701VO-CS74K | |
| Lenovo IdeaPad Y900 | |
| Asus Strix GL502VY-DS71 | |
| Asus Strix GL502VT-DS74 | |
| Batman: Arkham Knight - 1920x1080 High / On AA:SM AF:16x | |
| Asus G701VO-CS74K | |
| MSI GT72VR 6RD-063US | |
| Lenovo IdeaPad Y900 | |
| Asus Strix GL502VT-DS74 | |
| Metal Gear Solid V - 1920x1080 Extra High / On | |
| Lenovo IdeaPad Y900 | |
| Asus Strix GL502VT-DS74 | |
| Asus Strix GL502VY-DS71 | |
| Asus G701VO-CS74K | |
| MSI GT72VR 6RD-063US | |
| Fallout 4 - 1920x1080 Ultra Preset AA:T AF:16x | |
| Asus G701VO-CS74K | |
| MSI GT72VR 6RD-063US | |
| Asus Strix GL502VY-DS71 | |
| Lenovo IdeaPad Y900 | |
| Asus Strix GL502VT-DS74 | |
| Rise of the Tomb Raider - 1920x1080 Very High Preset AA:FX AF:16x | |
| MSI GT72VR 6RD-063US | |
| Asus G701VO-CS74K | |
| Asus Strix GL502VY-DS71 | |
| Lenovo IdeaPad Y900 | |
| Asus Strix GL502VT-DS74 | |
| Doom - 1920x1080 Ultra Preset AA:SM | |
| MSI GT72VR 6RD-063US | |
| Asus G701VO-CS74K | |
| Lenovo IdeaPad Y900 | |
| Asus Strix GL502VY-DS71 | |
| Overwatch - 1920x1080 Epic (Render Scale 100 %) AA:SM AF:16x | |
| Asus G701VO-CS74K | |
| MSI GT72VR 6RD-063US | |
| Asus Strix GL502VY-DS71 | |
| Lenovo IdeaPad Y900 | |
| low | med. | high | ultra | |
| Sleeping Dogs (2012) | 58.1 | |||
| Guild Wars 2 (2012) | 58.2 | |||
| BioShock Infinite (2013) | 90.2 | |||
| Metro: Last Light (2013) | 66.8 | |||
| Thief (2014) | 62.1 | |||
| Batman: Arkham Knight (2015) | 51 | |||
| Metal Gear Solid V (2015) | 60 | |||
| Fallout 4 (2015) | 57.4 | |||
| Rise of the Tomb Raider (2016) | 50.6 | |||
| Doom (2016) | 82.3 | |||
| Overwatch (2016) | 85.7 |
Noise Level
| Idle |
| 29.4 / 32.4 / 48 dB(A) |
| Load |
| 42.5 / 48.5 dB(A) |
 | ||
30 dB silent 40 dB(A) audible 50 dB(A) loud |
||
min: | ||
| Lenovo IdeaPad Y900 GeForce GTX 980M, 6820HK, Samsung SM951 MZVPV256 m.2 | Lenovo Ideapad Y700 17ISK 80Q0 GeForce GTX 960M, 6700HQ, Samsung MZNLN128HCGR-000L2 | MSI GT72VR 6RE-015US GeForce GTX 1070 Mobile, 6700HQ, SanDisk SD8SNAT256G1122 | Asus G752VS-XB78K GeForce GTX 1070 Mobile, 6820HK, Toshiba NVMe THNSN5512GPU7 | Acer Predator 17 G9-793-77LG GeForce GTX 1070 Mobile, 6700HQ, Toshiba NVMe THNSN5256GPU7 | |
|---|---|---|---|---|---|
| Noise | 10% | 4% | 5% | -3% | |
| off / environment * | 28.8 | 28.9 -0% | 30 -4% | 31 -8% | |
| Idle Minimum * | 29.4 | 28 5% | 32.4 -10% | 31 -5% | 33 -12% |
| Idle Average * | 32.4 | 28.1 13% | 32.4 -0% | 32 1% | 34 -5% |
| Idle Maximum * | 48 | 31.5 34% | 32.4 32% | 33 31% | 40 17% |
| Load Average * | 42.5 | 40.6 4% | 39.4 7% | 40 6% | 44 -4% |
| Load Maximum * | 48.5 | 51 -5% | 52 -7% | 47 3% | 50 -3% |
* ... smaller is better
(-) The maximum temperature on the upper side is 49 °C / 120 F, compared to the average of 40.4 °C / 105 F, ranging from 21.2 to 68.8 °C for the class Gaming.
(+) The bottom heats up to a maximum of 39.2 °C / 103 F, compared to the average of 43.2 °C / 110 F
(+) In idle usage, the average temperature for the upper side is 28 °C / 82 F, compared to the device average of 33.8 °C / 93 F.
(+) The palmrests and touchpad are cooler than skin temperature with a maximum of 28.8 °C / 83.8 F and are therefore cool to the touch.
(±) The average temperature of the palmrest area of similar devices was 28.9 °C / 84 F (+0.1 °C / 0.2 F).
Lenovo IdeaPad Y900 audio analysis
(+) | speakers can play relatively loud (87.1 dB)
Bass 100 - 315 Hz
(-) | nearly no bass - on average 87.1% lower than median
(+) | bass is linear (0% delta to prev. frequency)
Mids 400 - 2000 Hz
(-) | nearly no mids - on average 87.1% lower than median
(+) | mids are linear (0% delta to prev. frequency)
Highs 2 - 16 kHz
(-) | nearly no highs - on average 87.1% lower than median
(+) | highs are linear (0% delta to prev. frequency)
Overall 100 - 16.000 Hz
(-) | overall sound is not linear (132% difference to median)
Compared to same class
» 100% of all tested devices in this class were better, 0% similar, 0% worse
» The best had a delta of 6%, average was 18%, worst was 132%
Compared to all devices tested
» 100% of all tested devices were better, 0% similar, 0% worse
» The best had a delta of 4%, average was 25%, worst was 134%
Apple MacBook 12 (Early 2016) 1.1 GHz audio analysis
(+) | speakers can play relatively loud (83.6 dB)
Bass 100 - 315 Hz
(±) | reduced bass - on average 11.3% lower than median
(±) | linearity of bass is average (14.2% delta to prev. frequency)
Mids 400 - 2000 Hz
(+) | balanced mids - only 2.4% away from median
(+) | mids are linear (5.5% delta to prev. frequency)
Highs 2 - 16 kHz
(+) | balanced highs - only 2% away from median
(+) | highs are linear (4.5% delta to prev. frequency)
Overall 100 - 16.000 Hz
(+) | overall sound is linear (10.2% difference to median)
Compared to same class
» 5% of all tested devices in this class were better, 2% similar, 93% worse
» The best had a delta of 5%, average was 19%, worst was 53%
Compared to all devices tested
» 3% of all tested devices were better, 1% similar, 96% worse
» The best had a delta of 4%, average was 25%, worst was 134%
| Off / Standby | |
| Idle | |
| Load |
|
| Lenovo IdeaPad Y900 6820HK, GeForce GTX 980M, Samsung SM951 MZVPV256 m.2, , 1920x1080, 17.30 | Asus Strix GL502VY-DS71 6700HQ, GeForce GTX 980M, SanDisk SD8SN8U1T001122, IPS, 1920x1080, 15.60 | Acer Predator 17 G9-793-77LG 6700HQ, GeForce GTX 1070 Mobile, Toshiba NVMe THNSN5256GPU7, IPS, 3840x2160, 17.30 | MSI GS73VR 6RF 6700HQ, GeForce GTX 1060 Mobile, SanDisk SD8SN8U1T001122, TN LED, 1920x1080, 17.30 | HP Pavilion 17 FHD V3A33AV 6700HQ, GeForce GTX 960M, SanDisk Z400s SD8SNAT-128G, IPS, 1920x1080, 17.30 | |
|---|---|---|---|---|---|
| Power Consumption | 9% | -20% | -3% | 54% | |
| Idle Minimum * | 24.3 | 20.6 15% | 25 -3% | 22.6 7% | 5.3 78% |
| Idle Average * | 29.6 | 22.1 25% | 35 -18% | 32.7 -10% | 10.6 64% |
| Idle Maximum * | 29.9 | 22.5 25% | 46 -54% | 32.8 -10% | 11.8 61% |
| Load Average * | 110.1 | 130.6 -19% | 103 6% | 114.7 -4% | 70.9 36% |
| Load Maximum * | 171.4 | 177.2 -3% | 223 -30% | 167.9 2% | 119.8 30% |
* ... smaller is better
| Lenovo IdeaPad Y900 6820HK, GeForce GTX 980M, 90 Wh | Lenovo Ideapad Y700 17ISK 80Q0 6700HQ, GeForce GTX 960M, 60 Wh | Asus Strix GL502VY-DS71 6700HQ, GeForce GTX 980M, 64 Wh | Asus G752VS-XB78K 6820HK, GeForce GTX 1070 Mobile, 90 Wh | MSI GT72VR 6RD-063US 6700HQ, GeForce GTX 1060 Mobile, 83 Wh | |
|---|---|---|---|---|---|
| Battery Runtime | 33% | -30% | -21% | -17% | |
| Reader / Idle | 349 | 688 97% | 273 -22% | 311 -11% | 323 -7% |
| WiFi v1.3 | 248 | 334 35% | 187 -25% | 210 -15% | 221 -11% |
| Load | 136 | 91 -33% | 76 -44% | 84 -38% | 93 -32% |
Pros
Cons
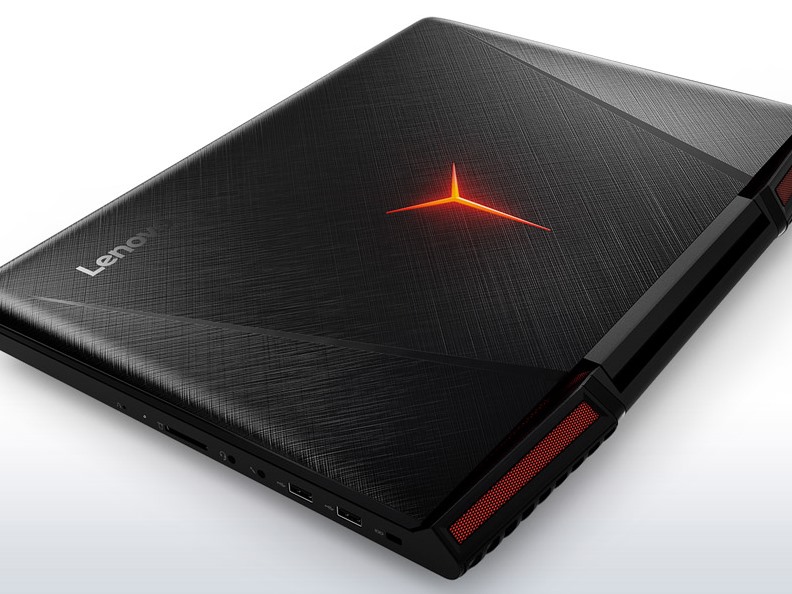
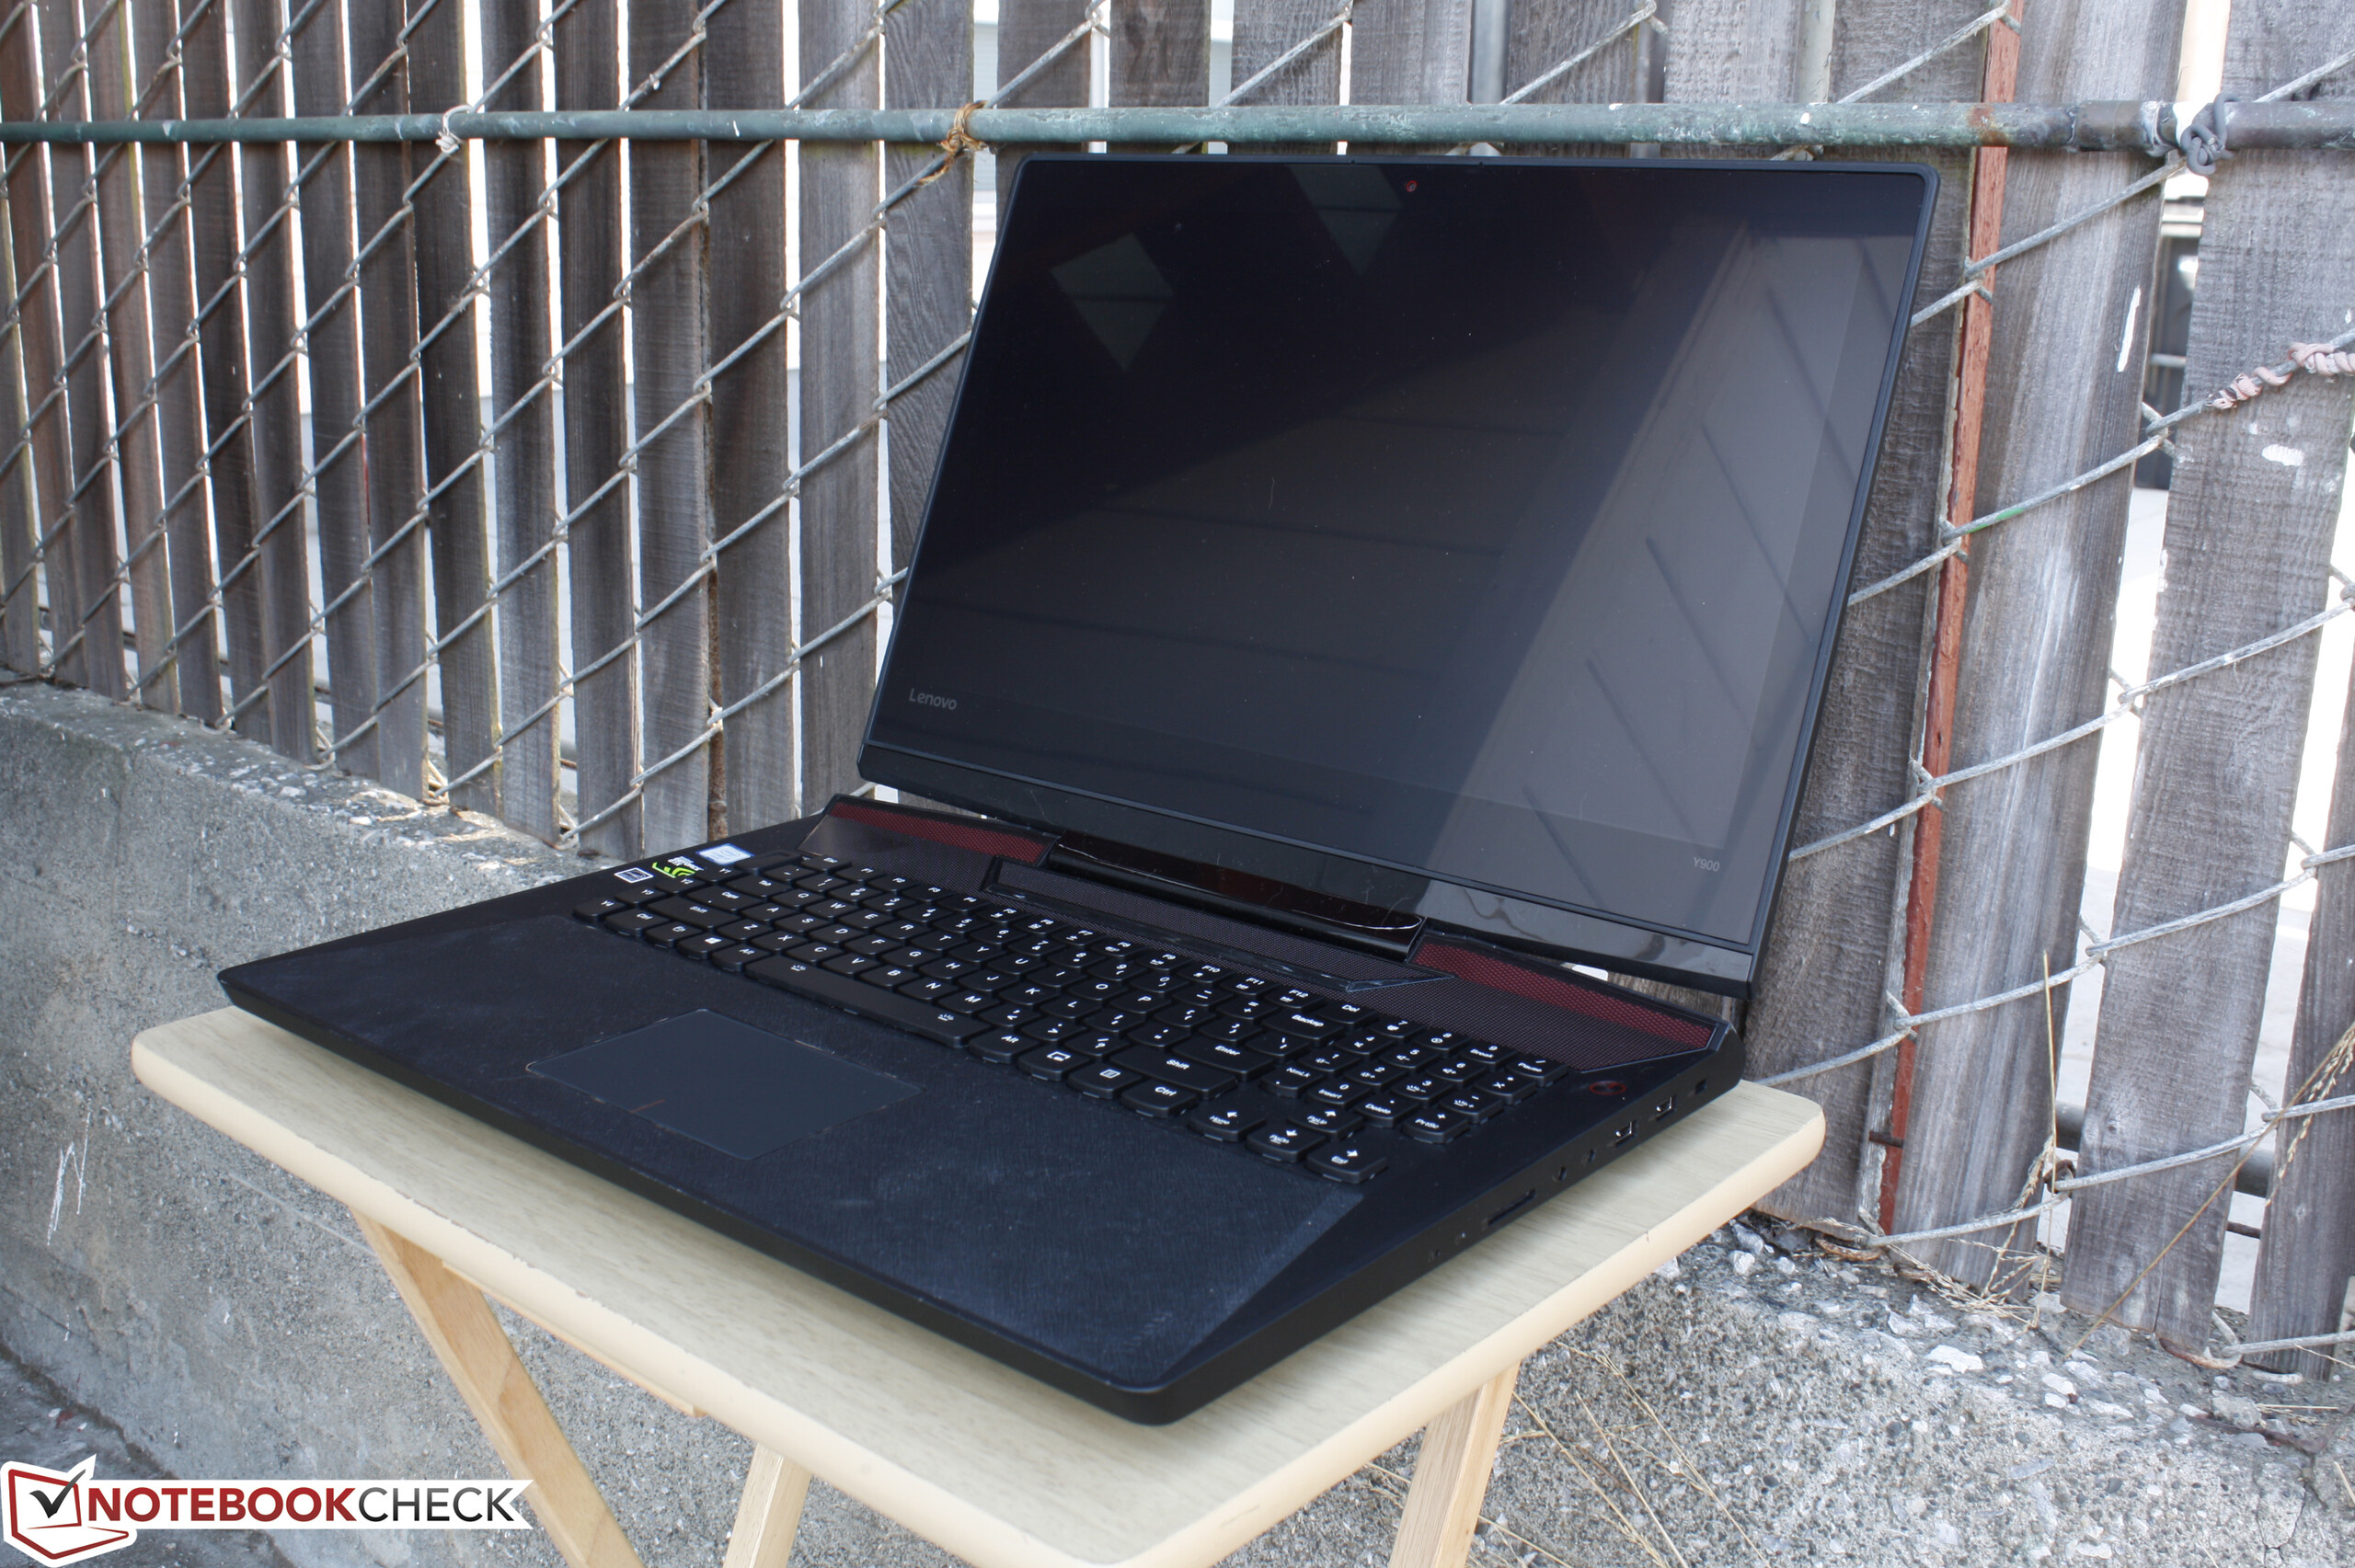
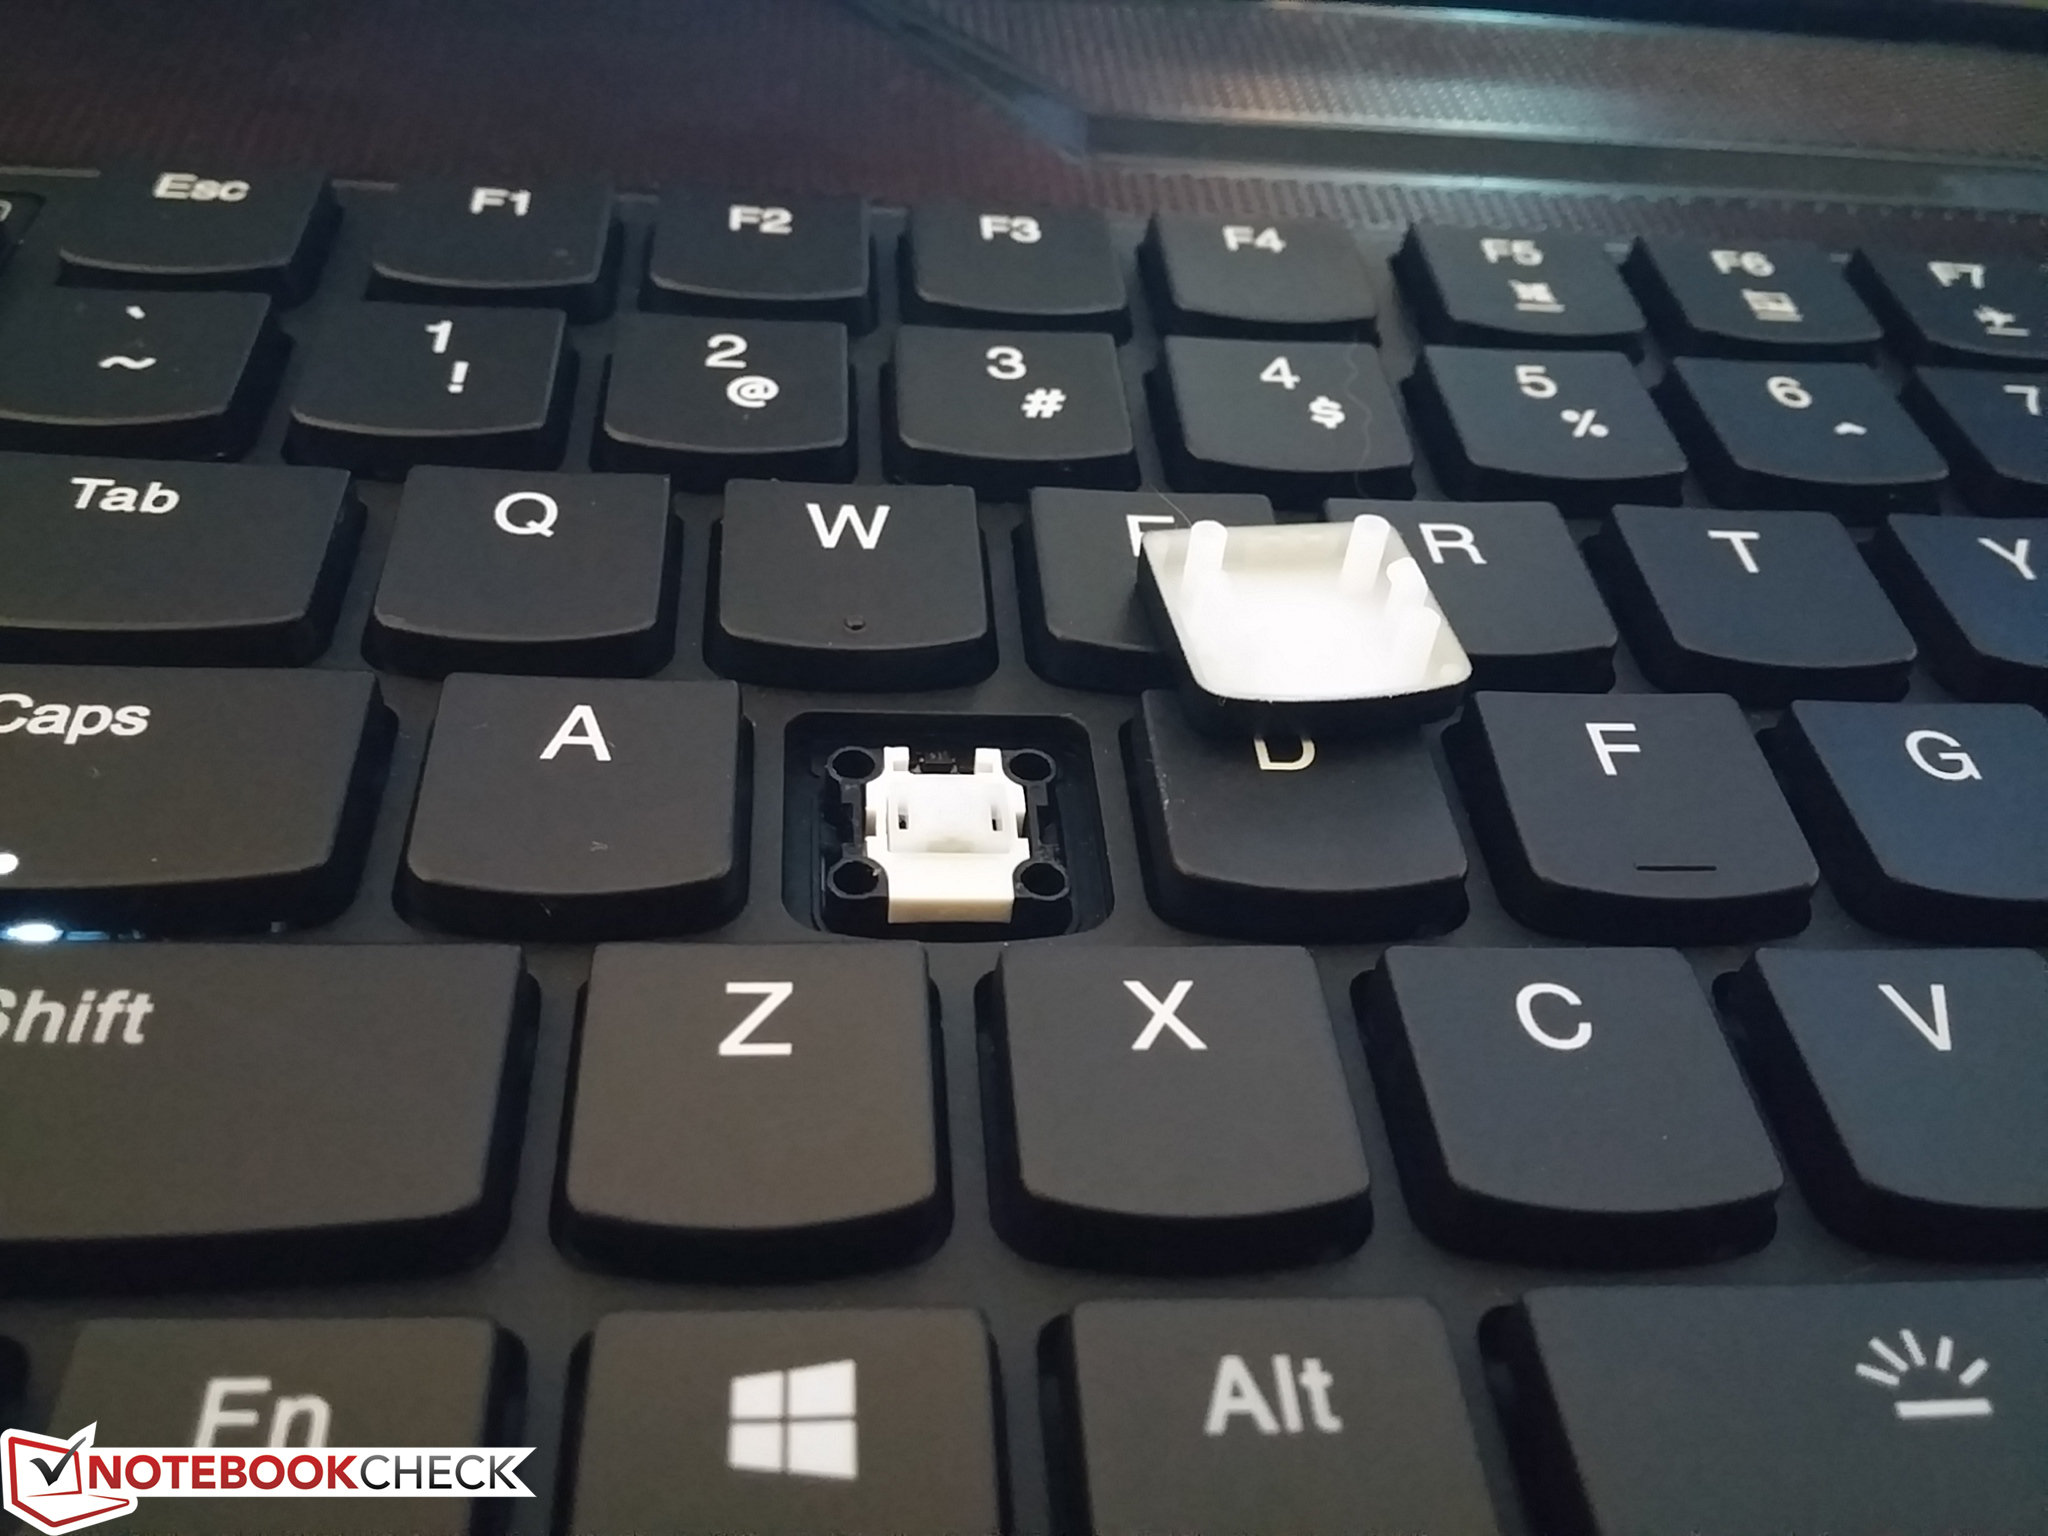
联想最新的Y900挂着的2000美元(约13337人民币)价签说明它走上了完全不同的路线。尽管它的设计和工艺都不错,但新的机械键盘和加速模式则给了我们很复杂的感受。它的键盘按键较软,也不够均匀,一些用户可能不会喜欢它独特的反馈。同时,加速模式在游戏中可以提供不多的一点优势,我们建议在游戏中保持开启,因为关上它并没有什么其他好处。
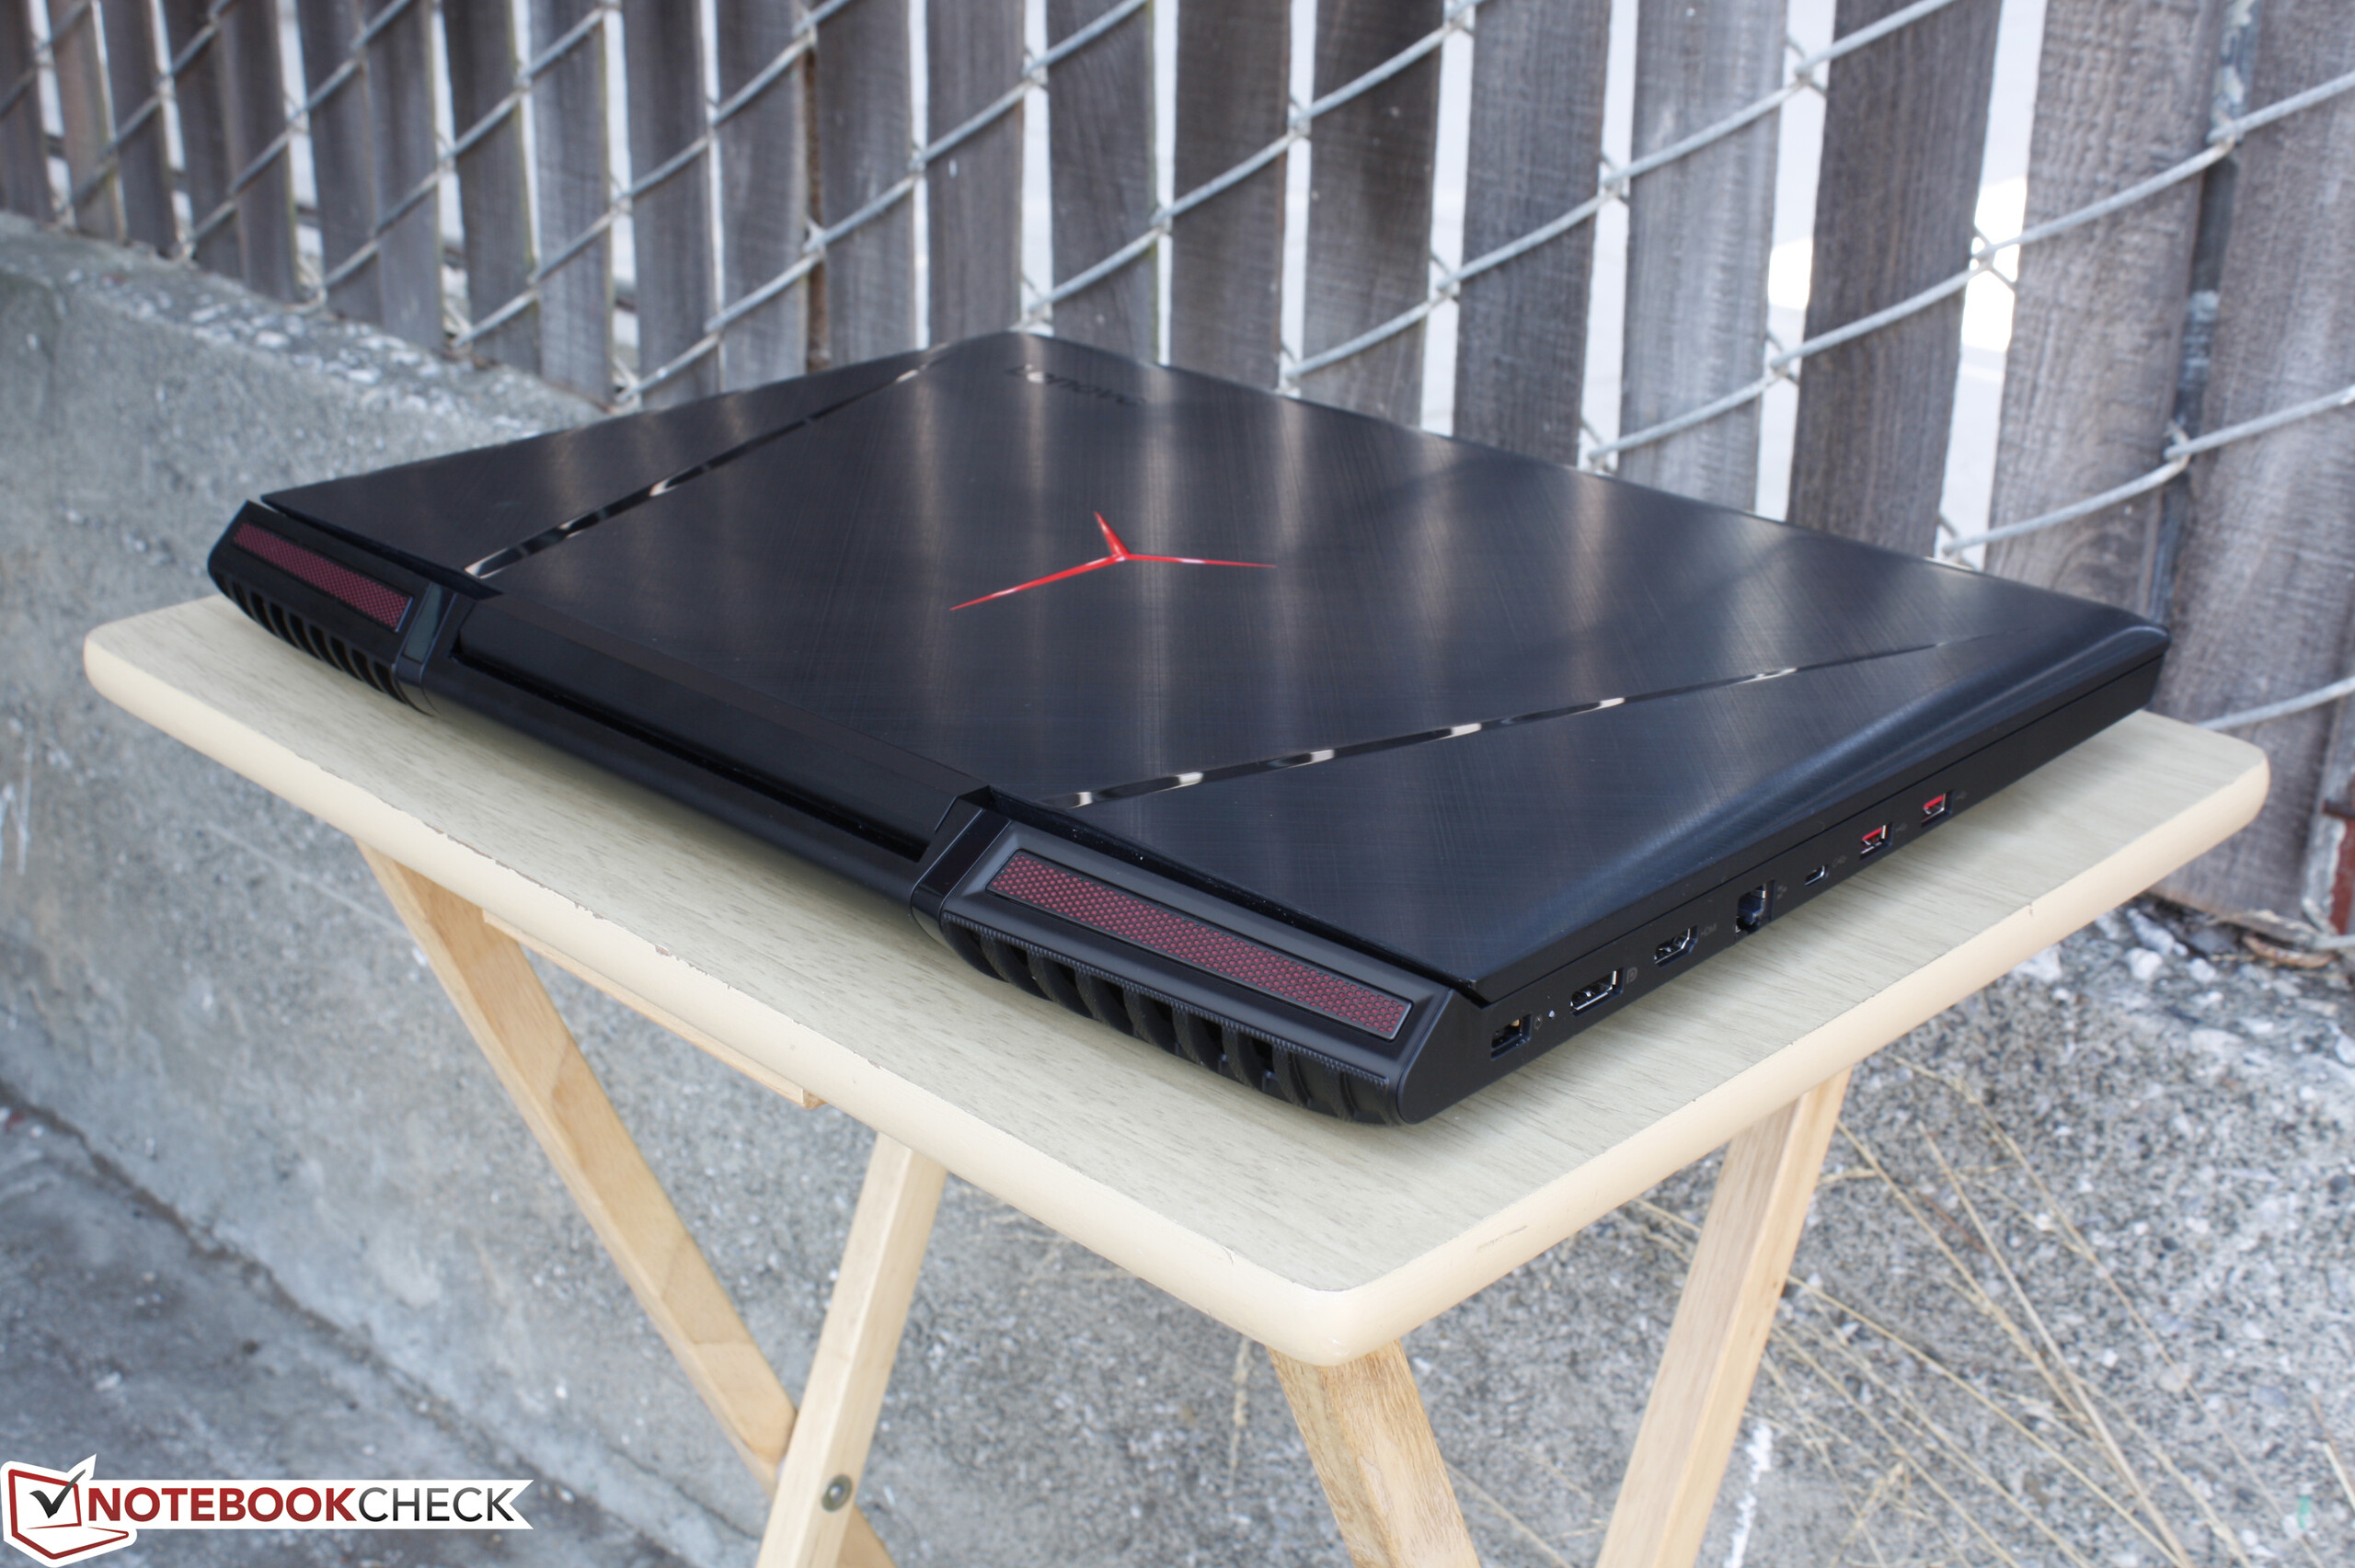
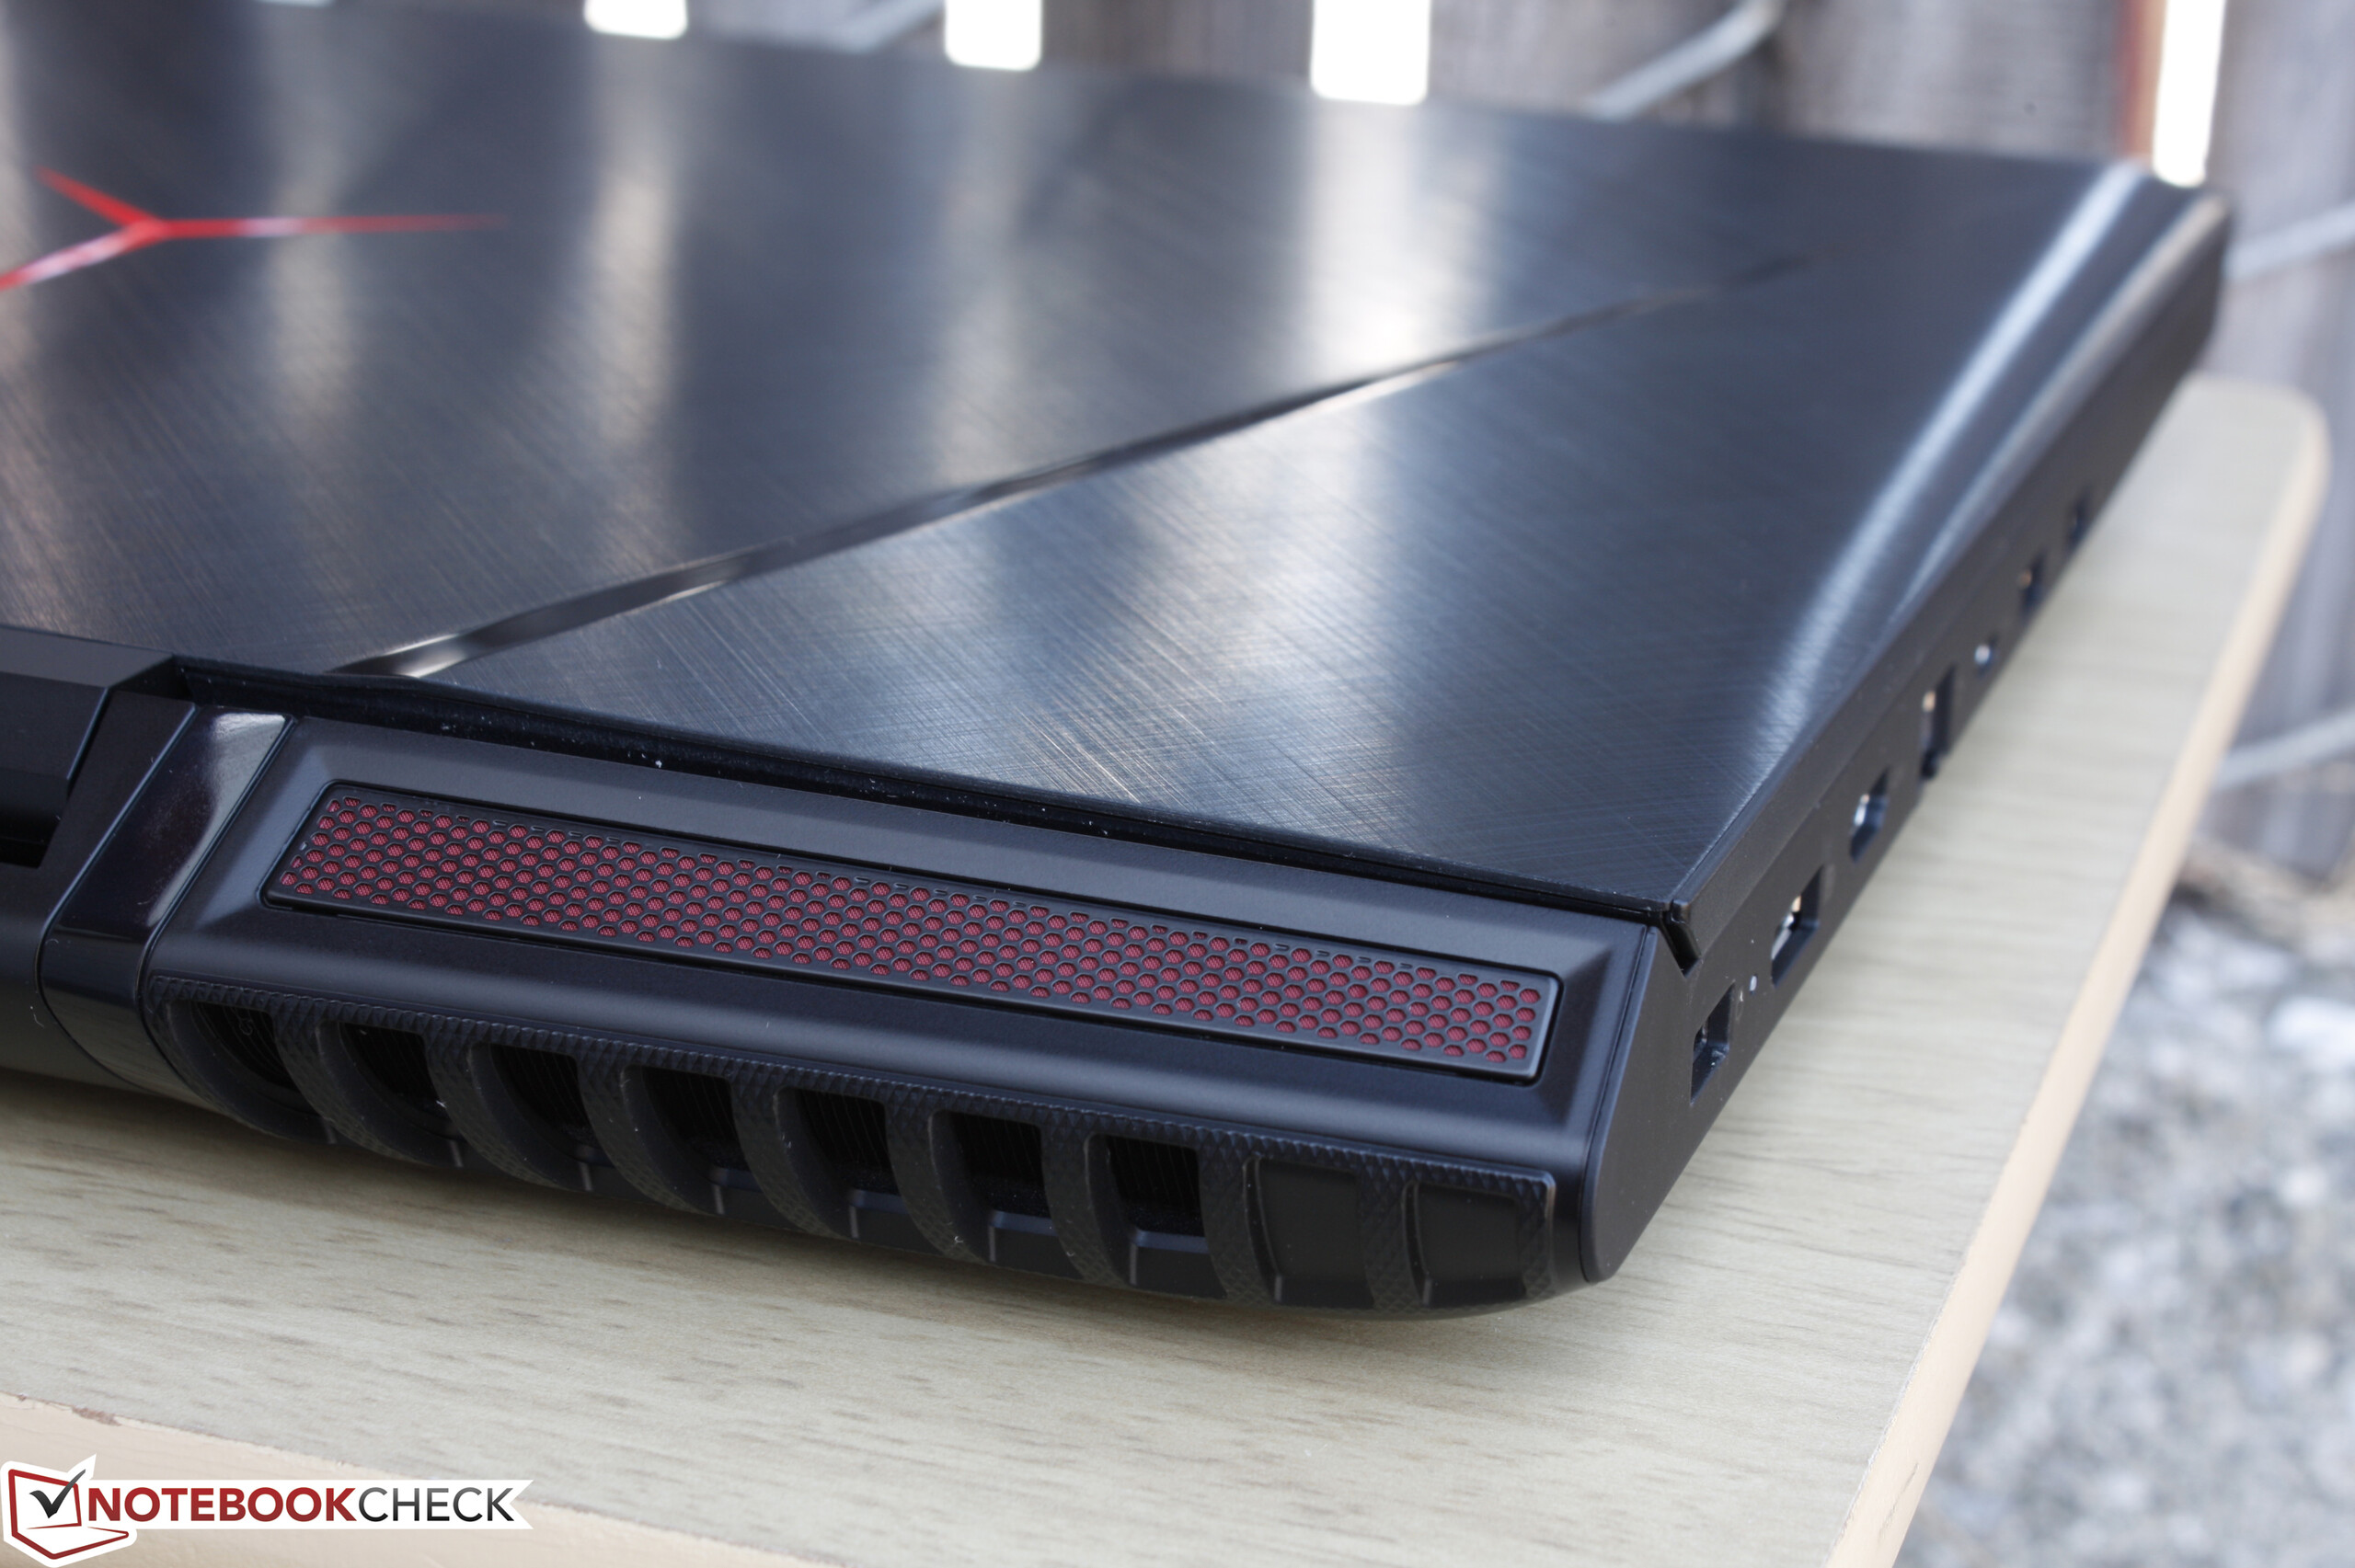
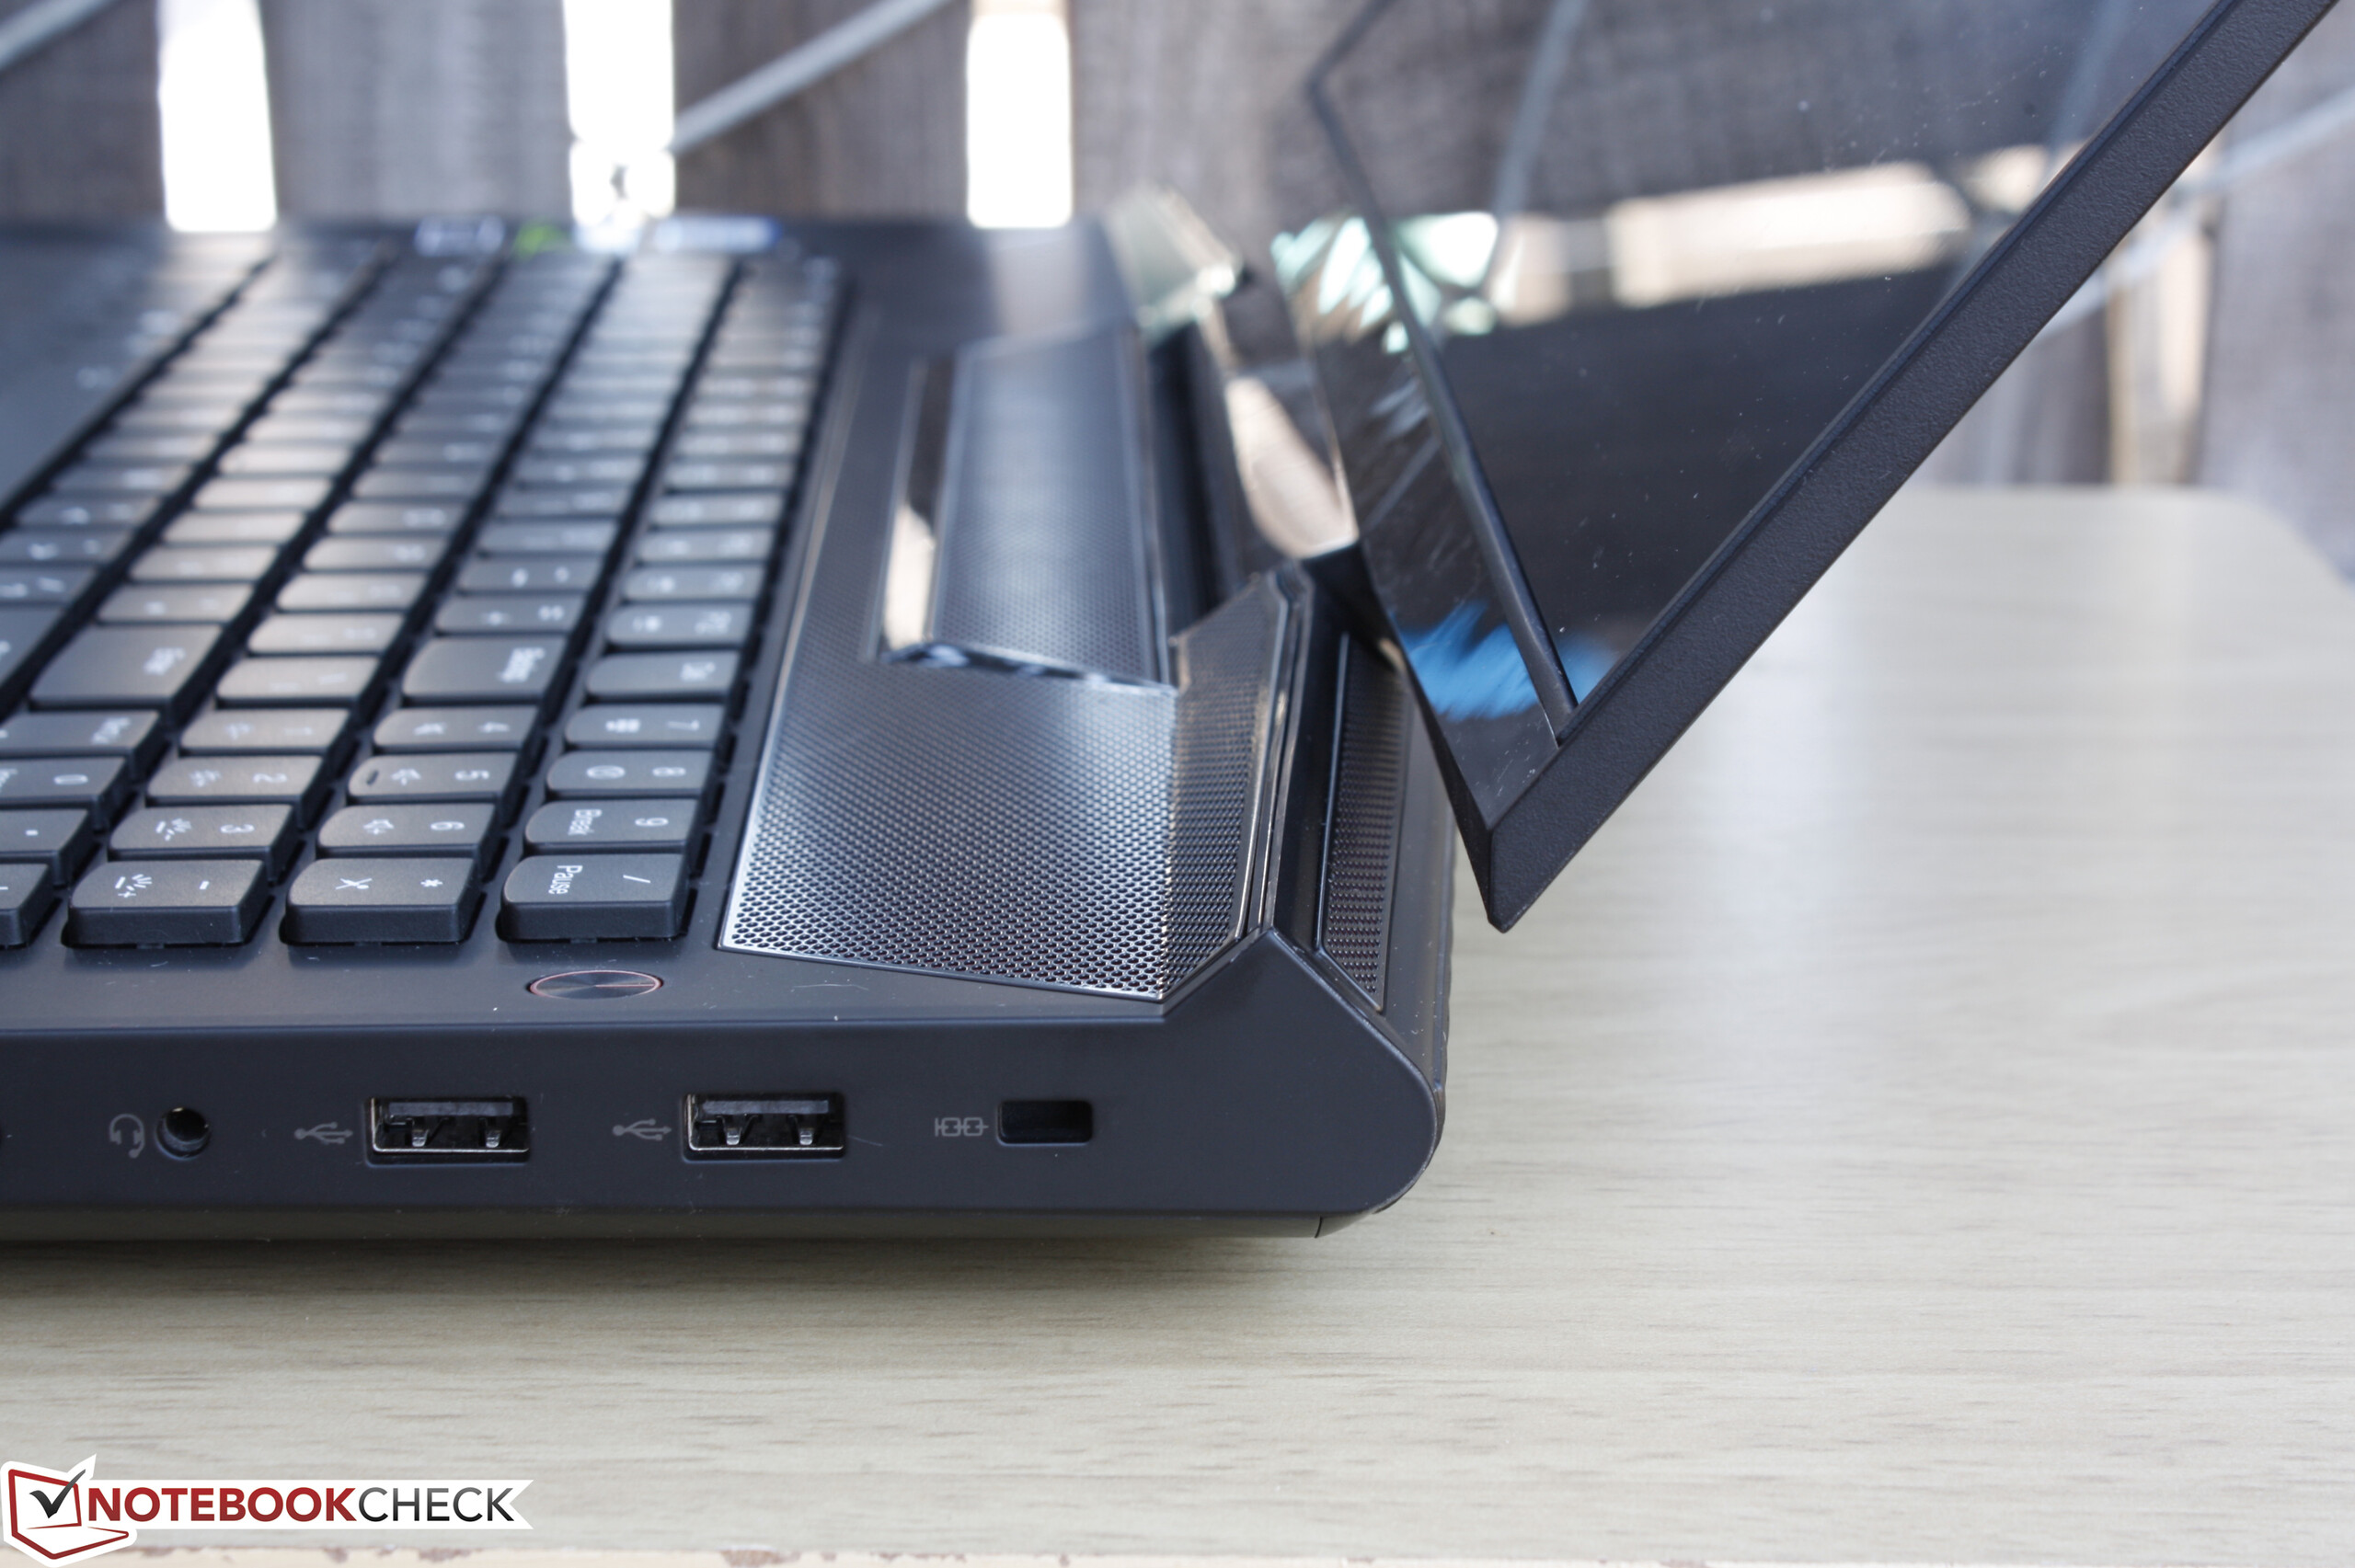
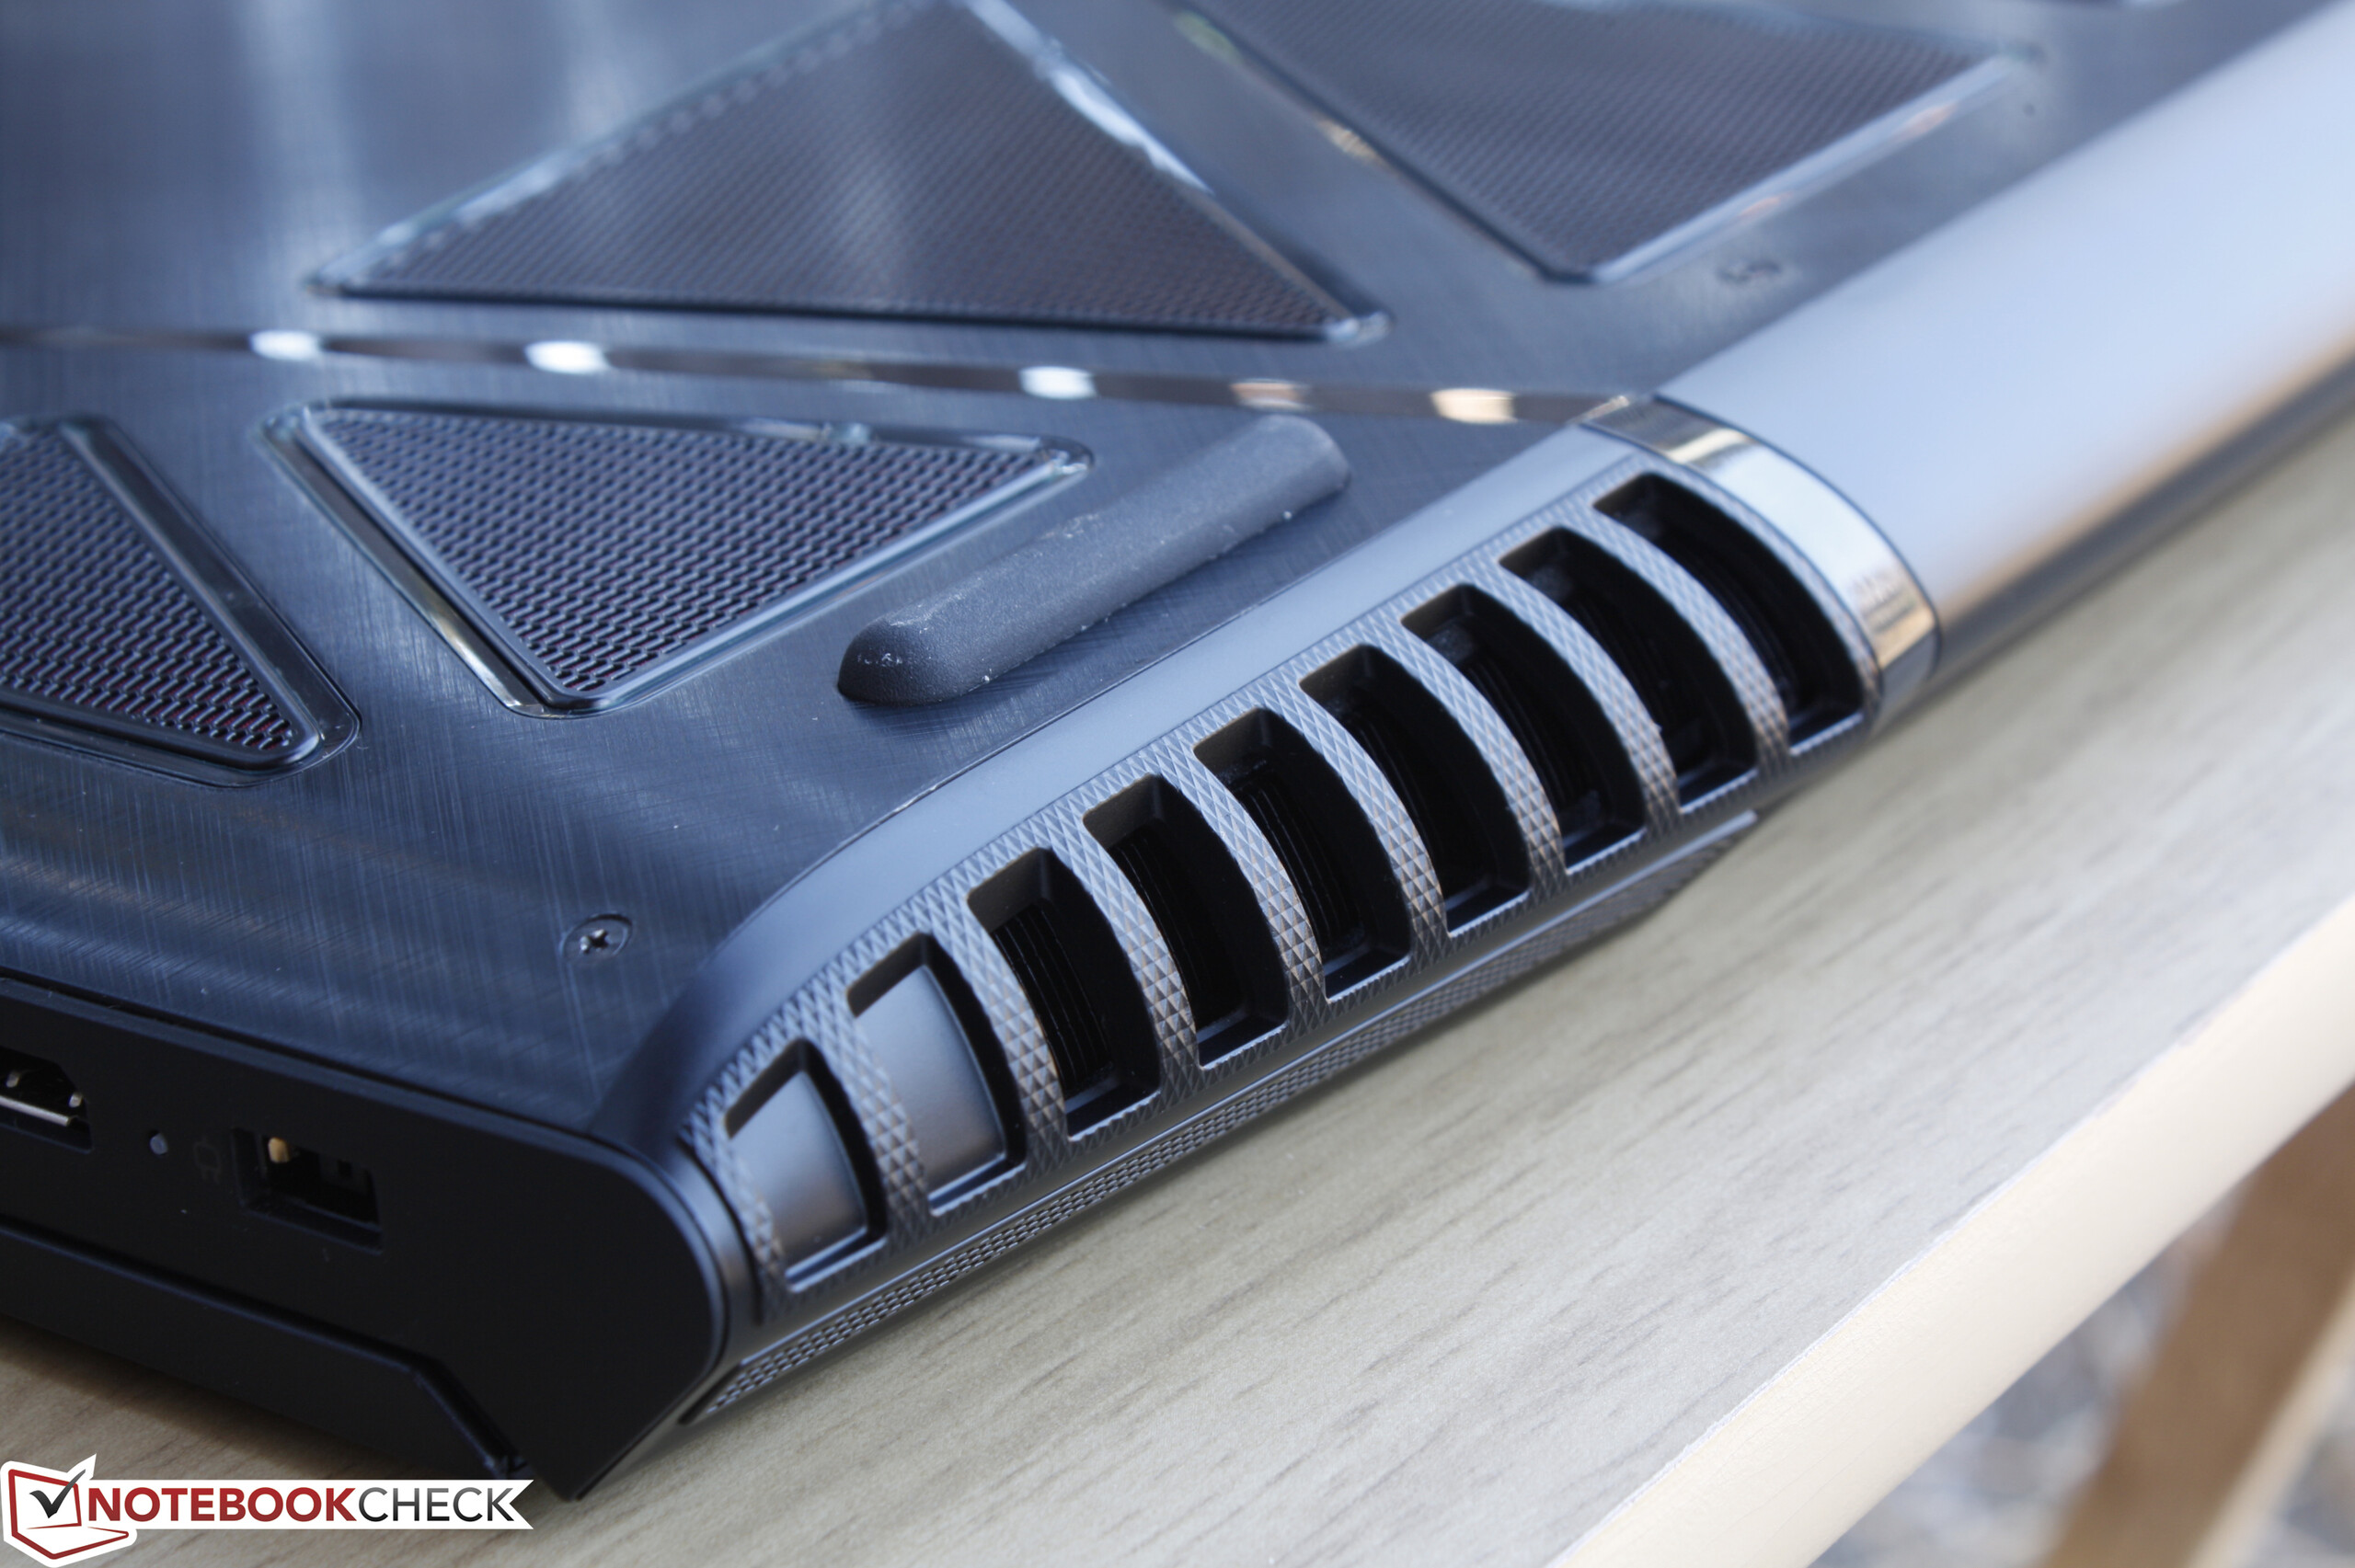
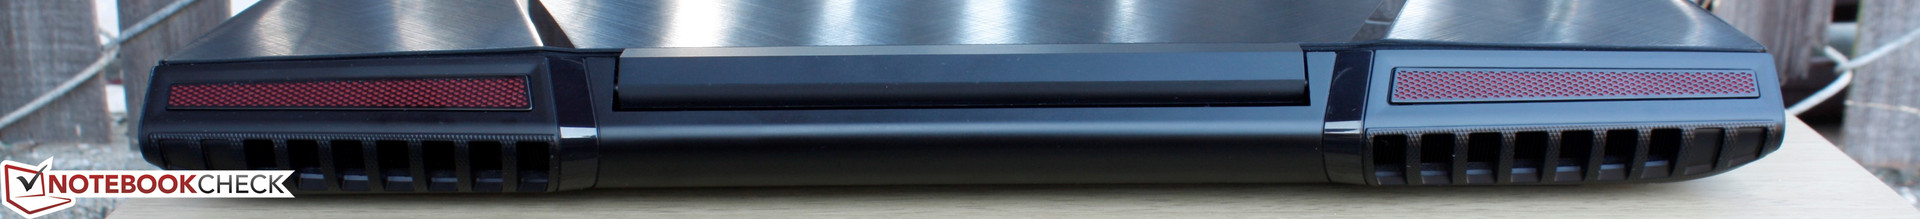
这个系统的另外一个缺点是风扇的奇怪脉冲行为,同时在我们测试时它没有手动控制功能。虽然可能这一点会通过更新得到改进,但用户不得不避免在安静的公共场所使用它,即使是开启节能模式。它的风扇噪音相比除了微星GS73VR和技嘉同类机型外的大部分其他17寸笔记本电脑都更吵。
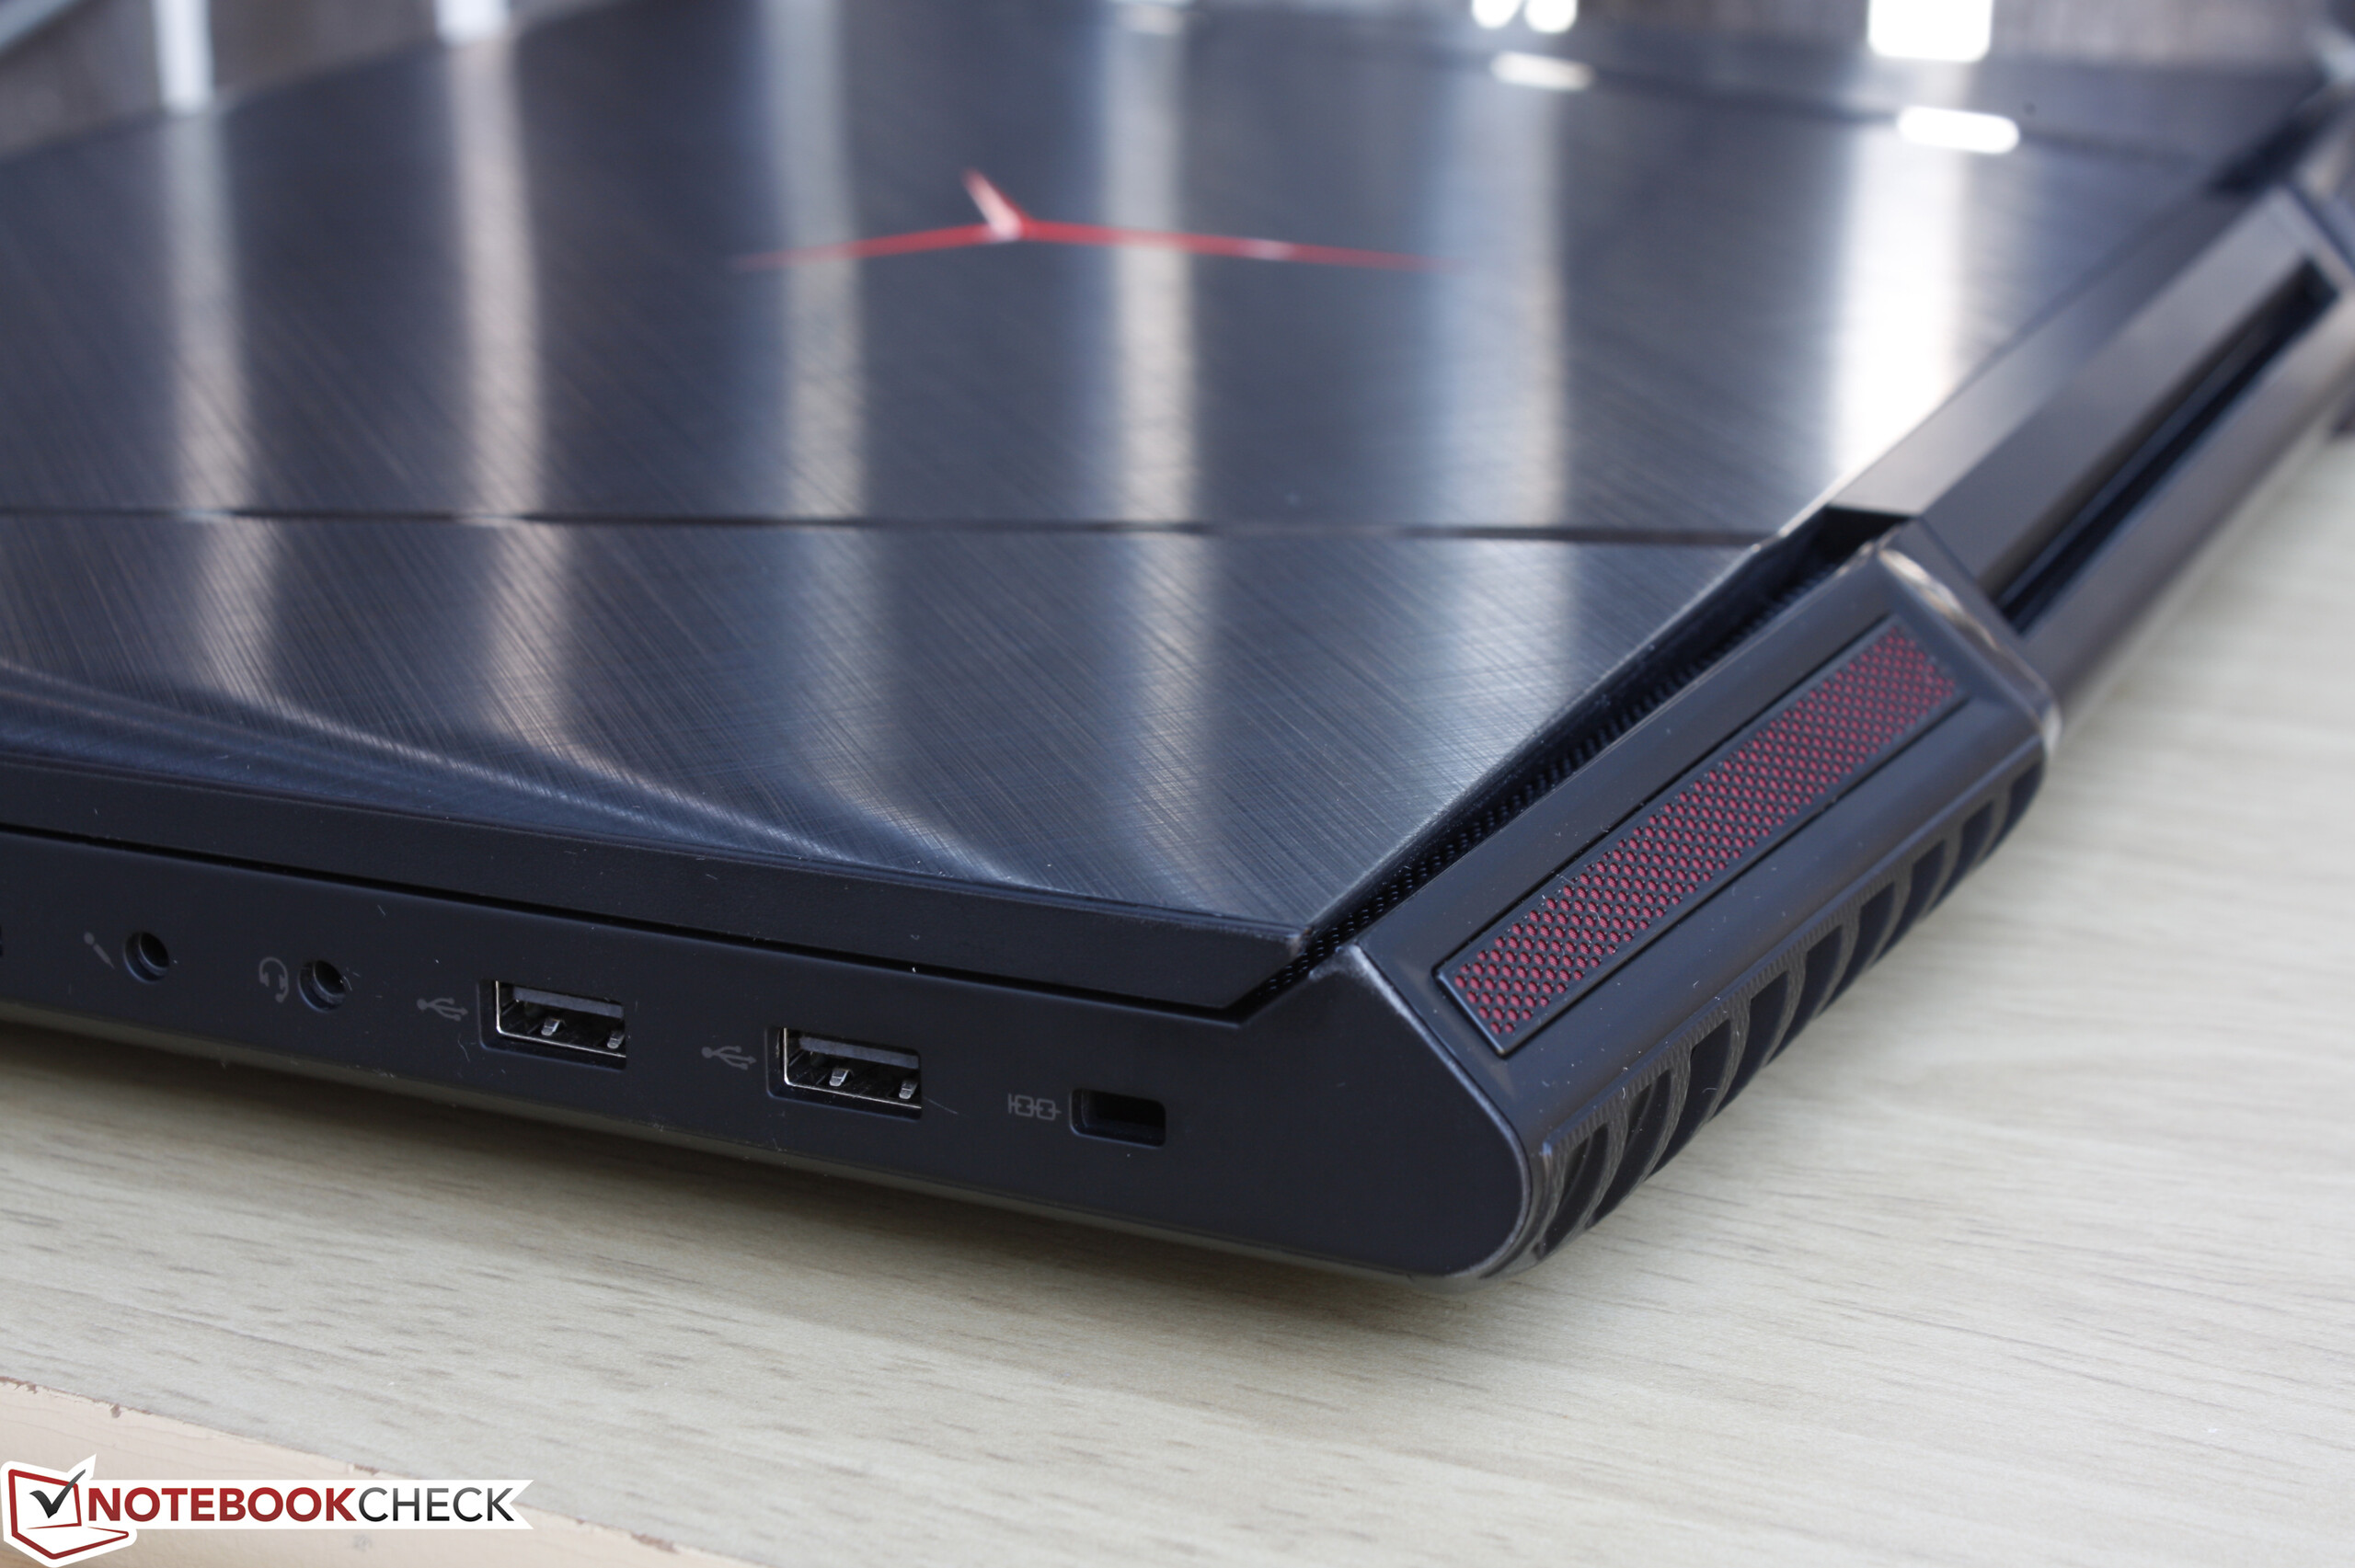
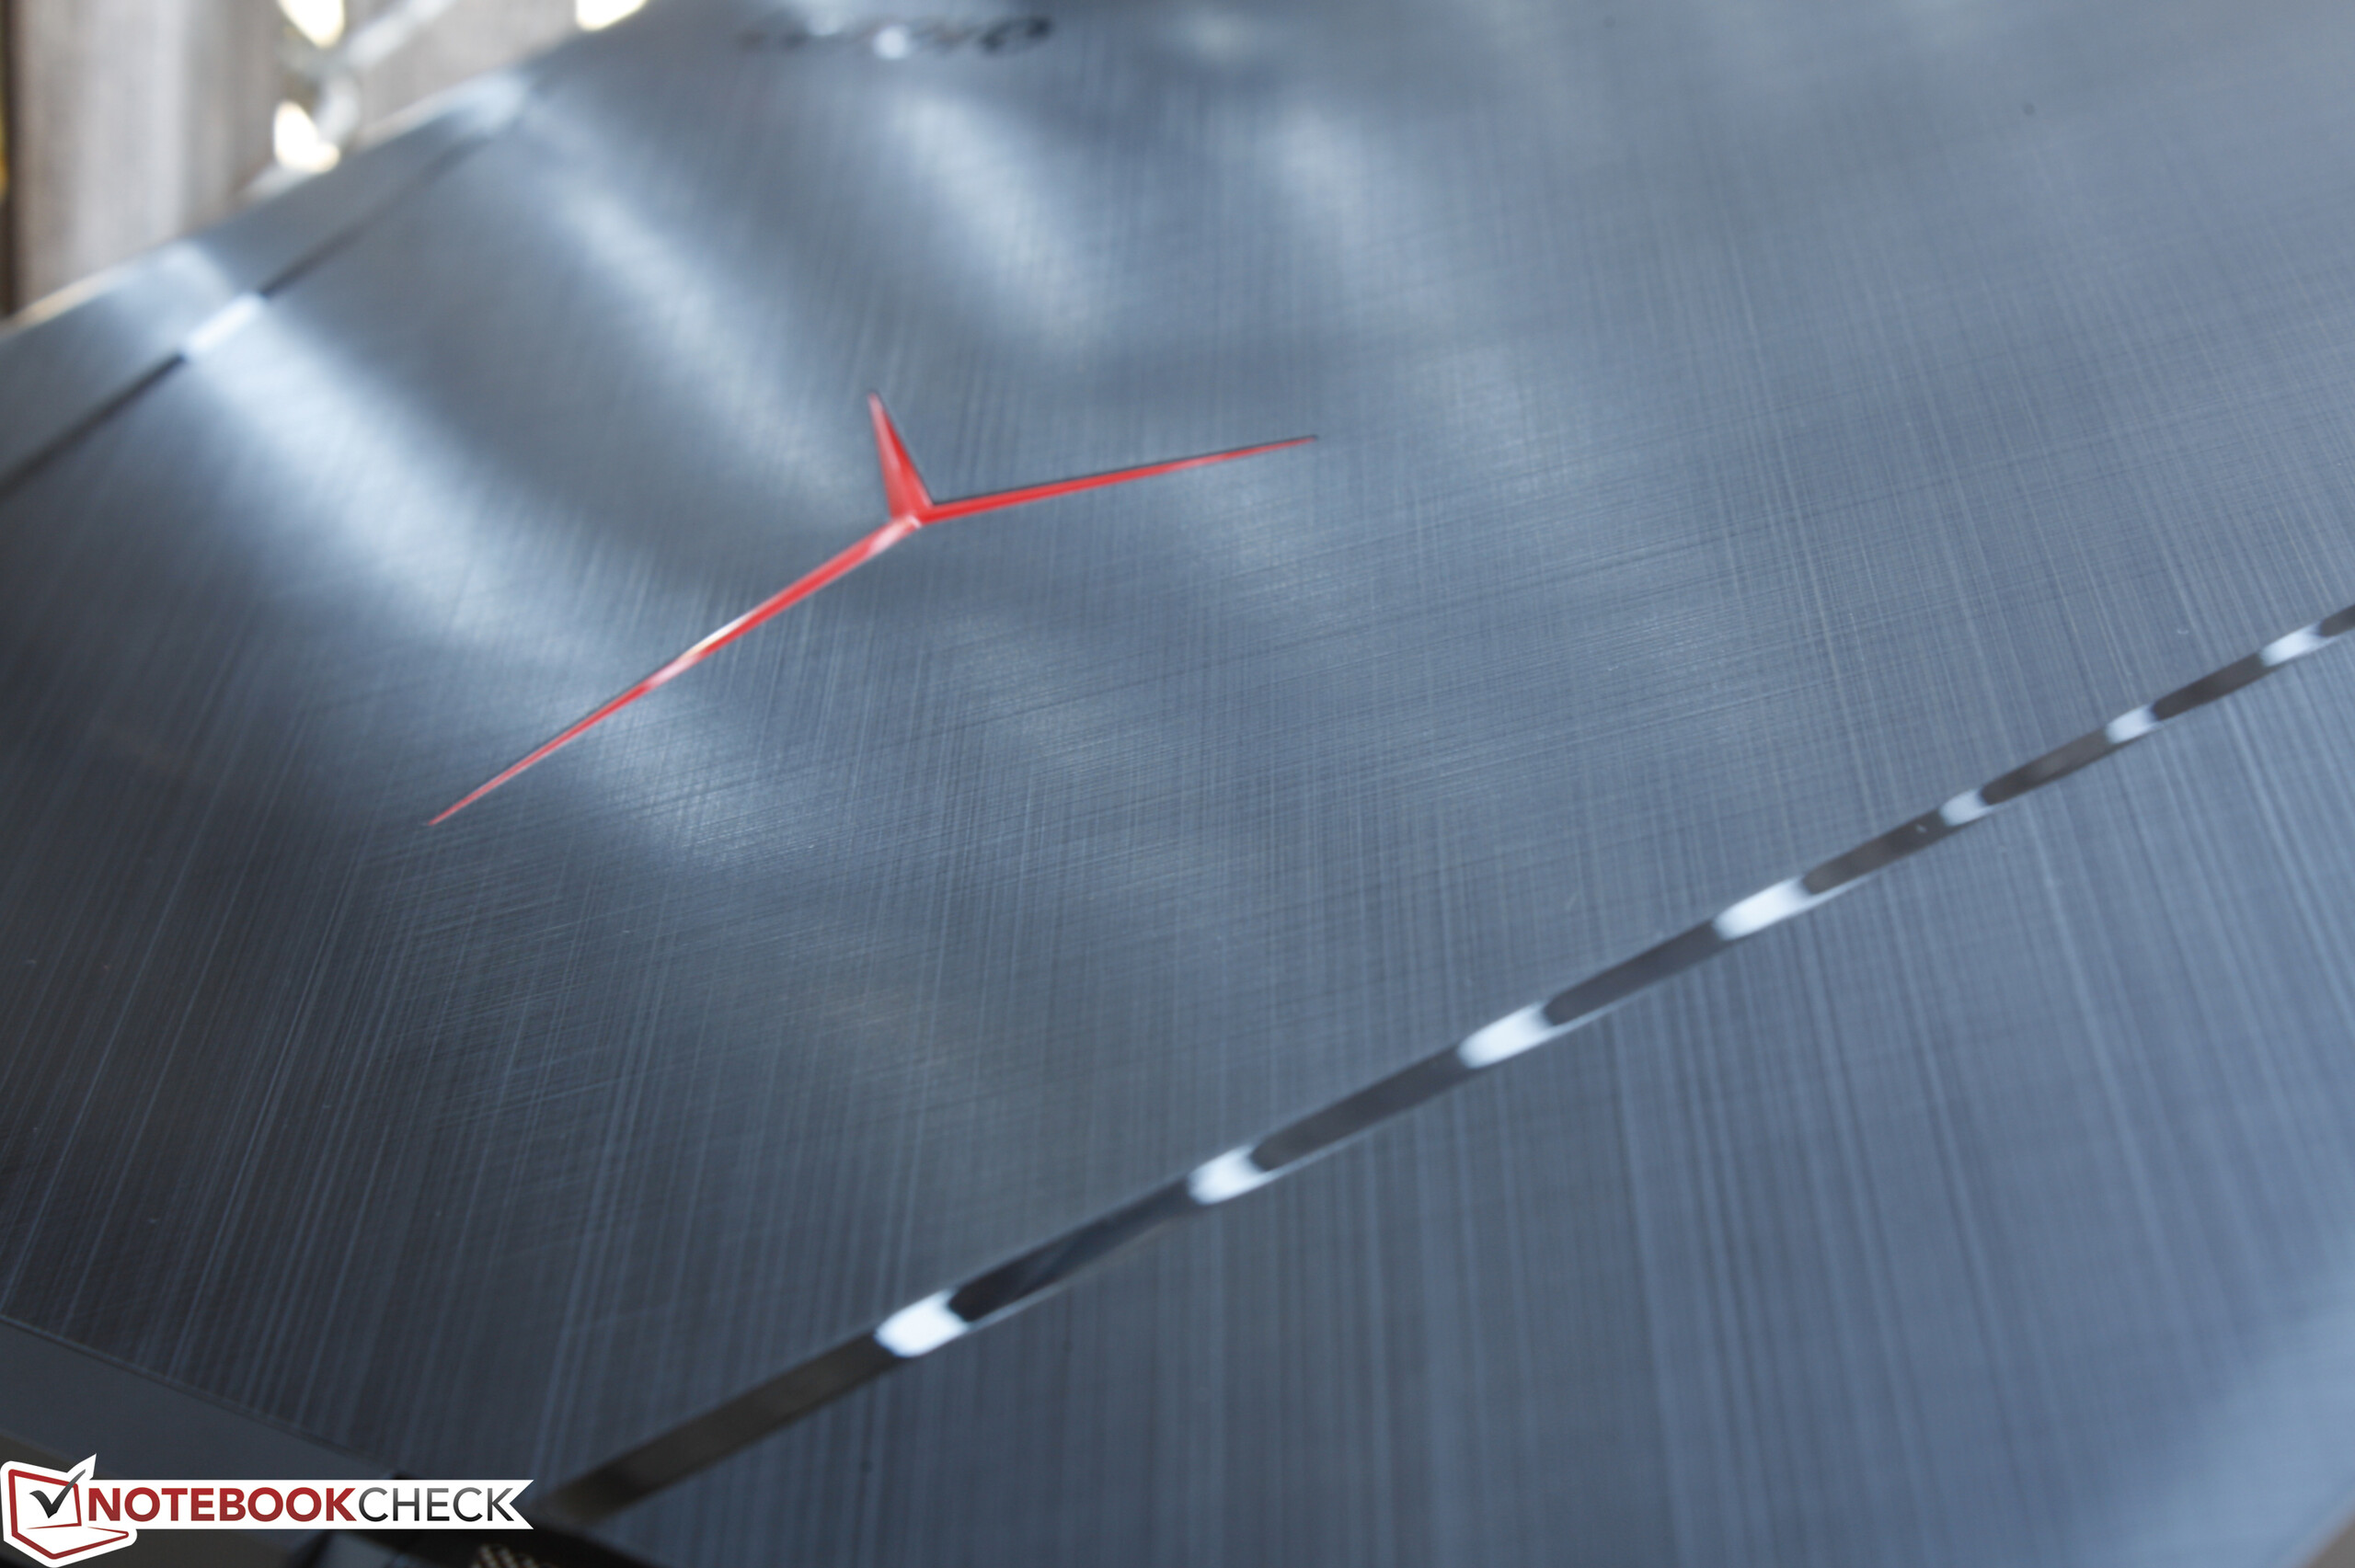
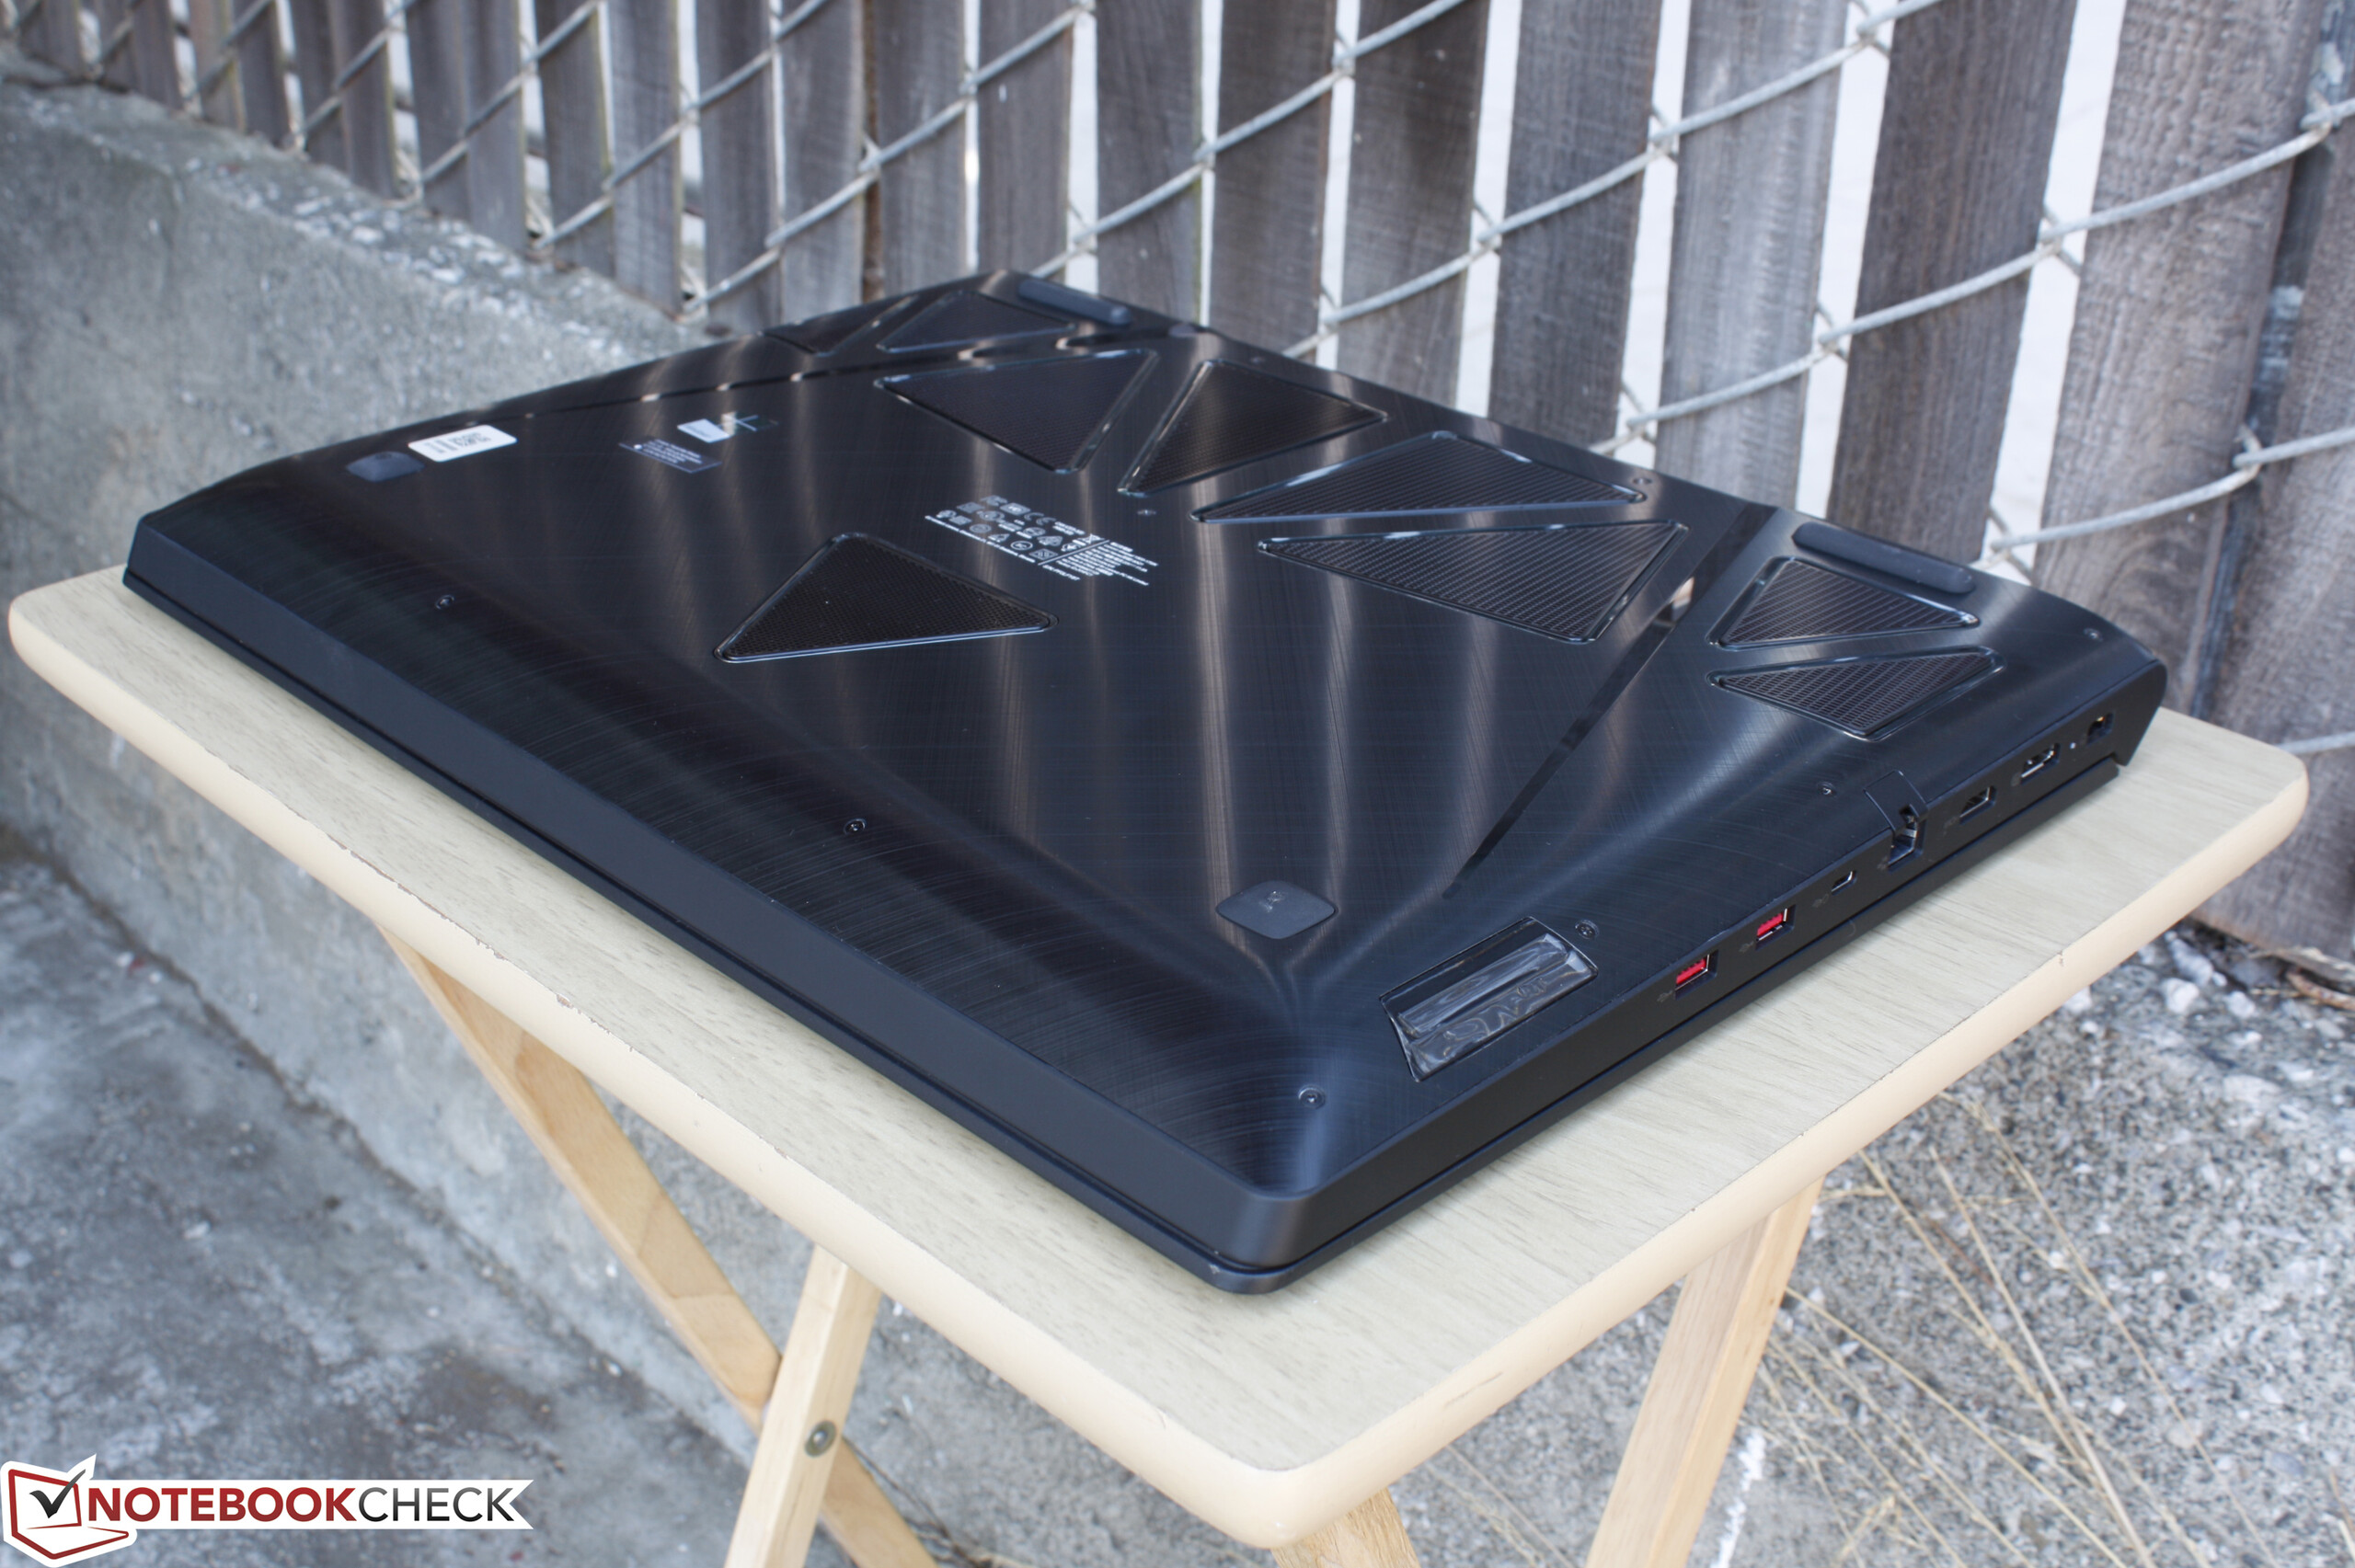
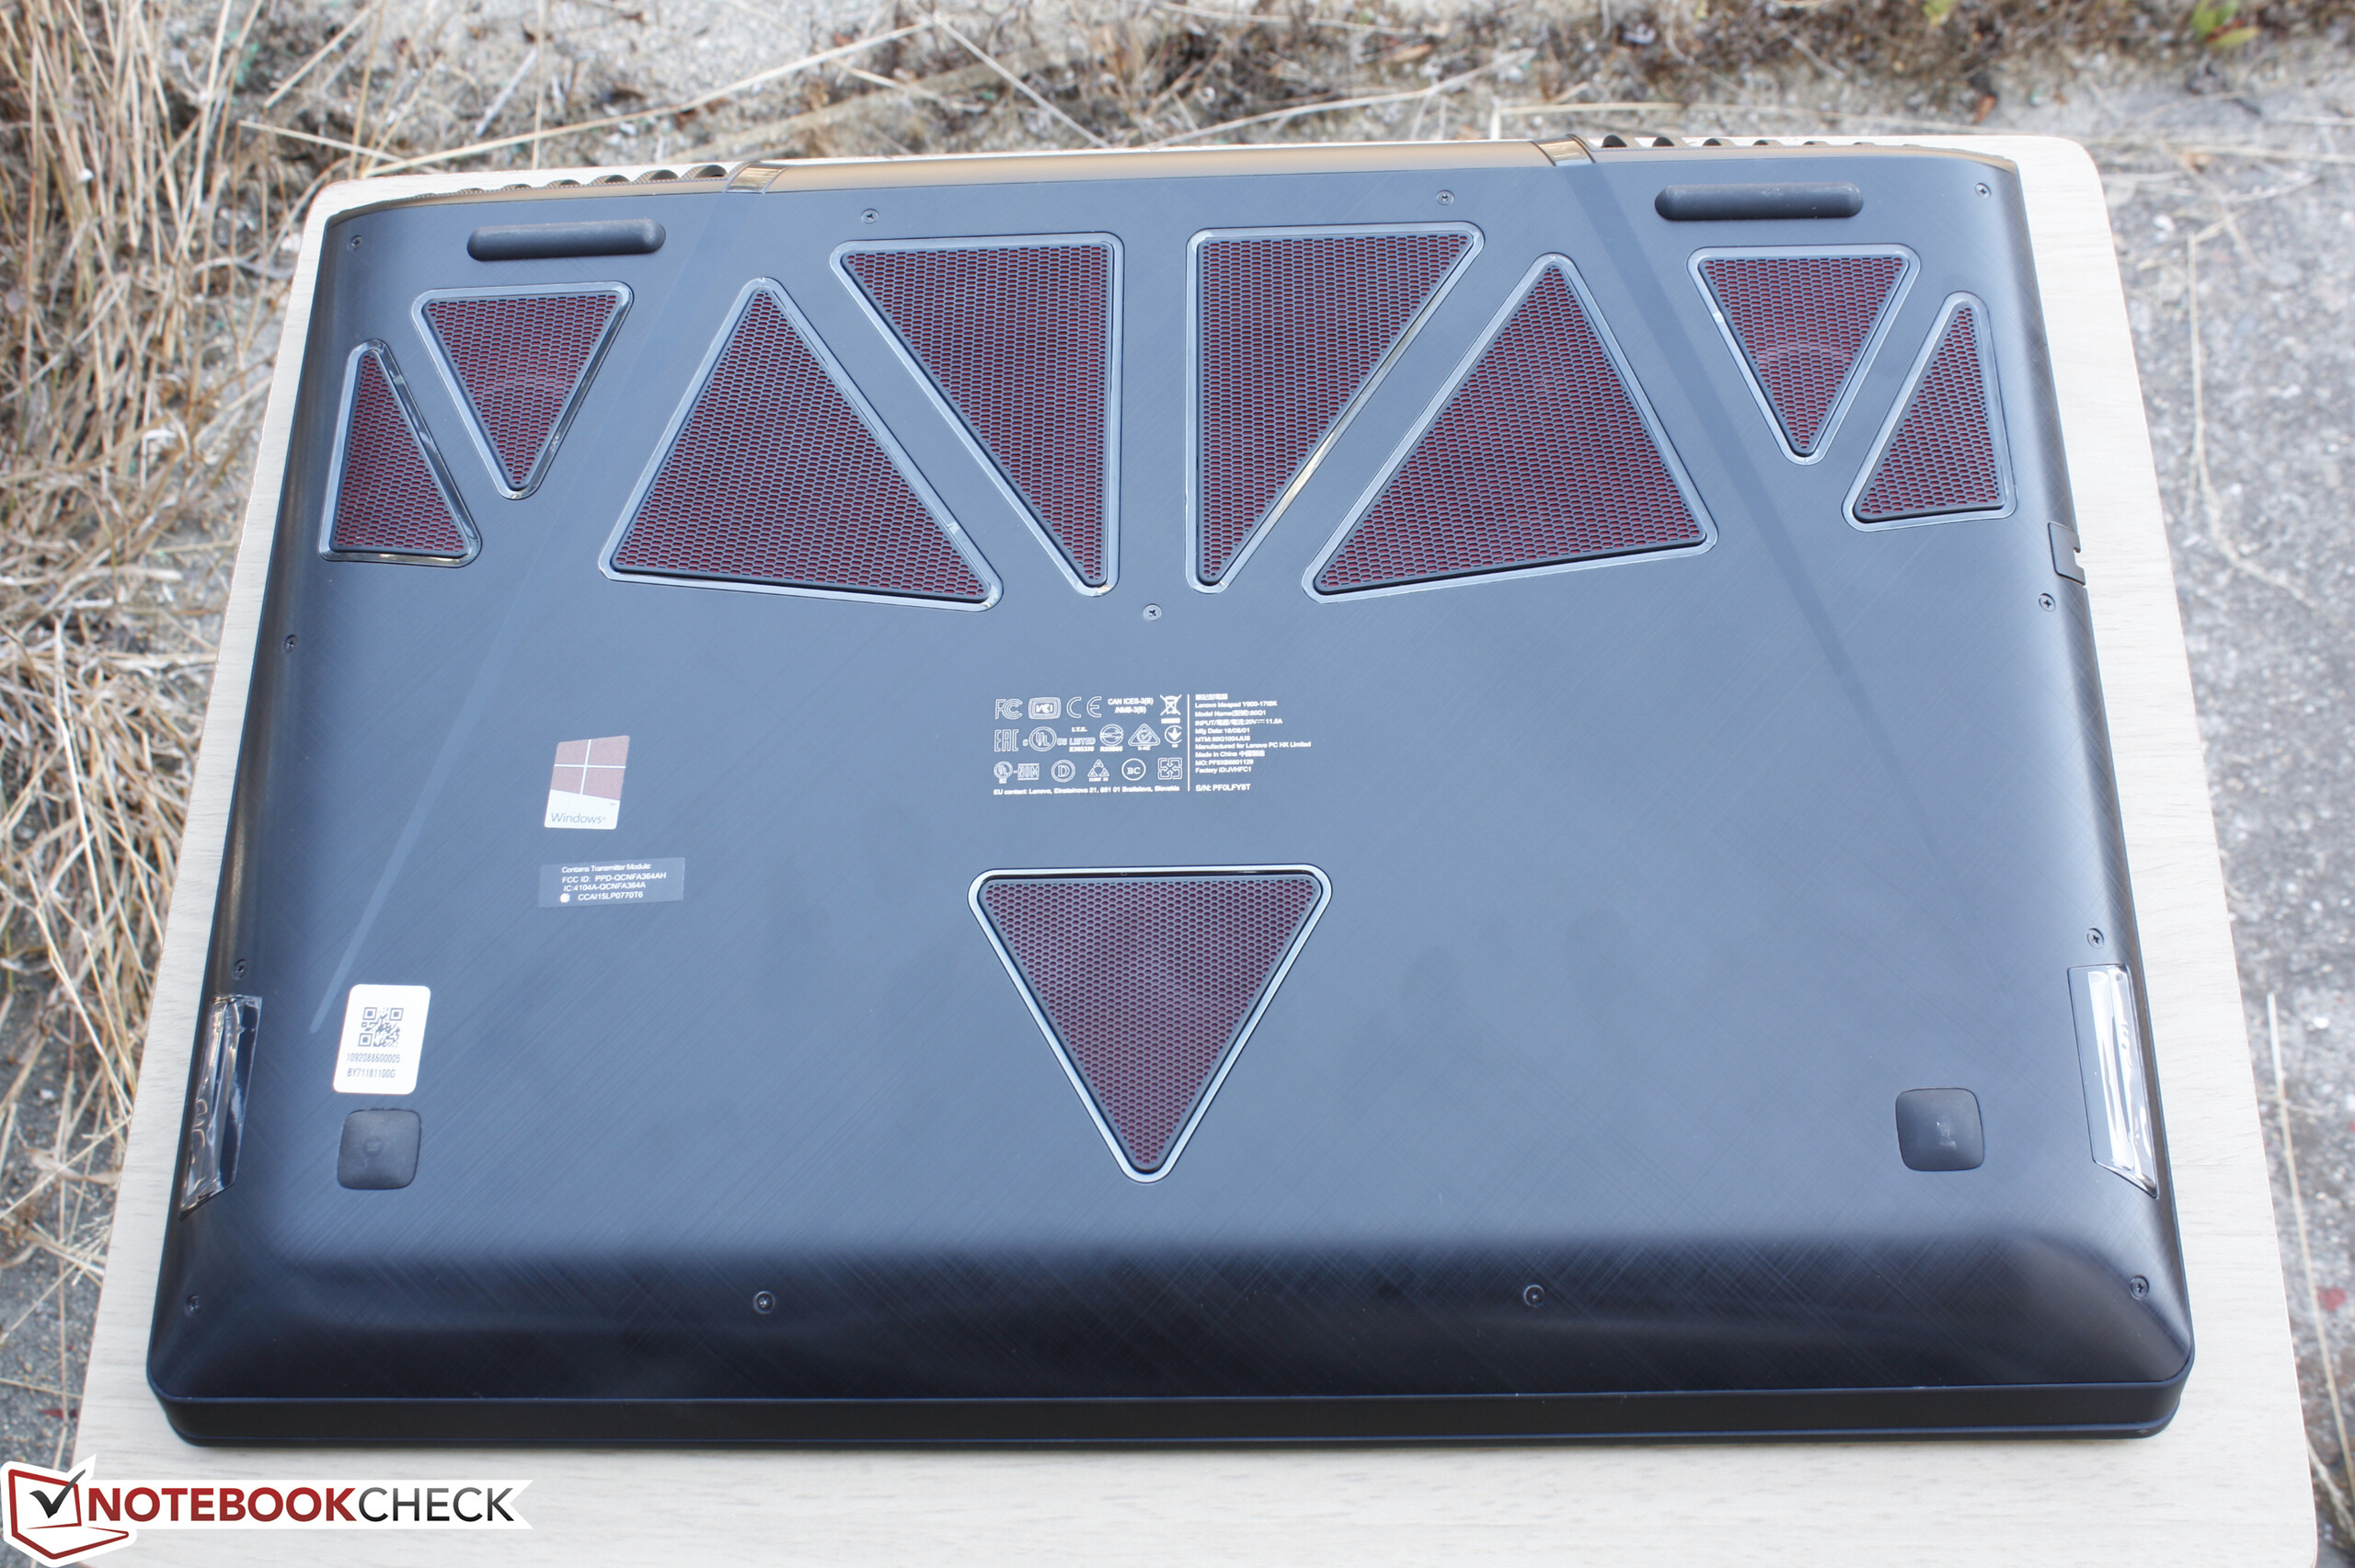
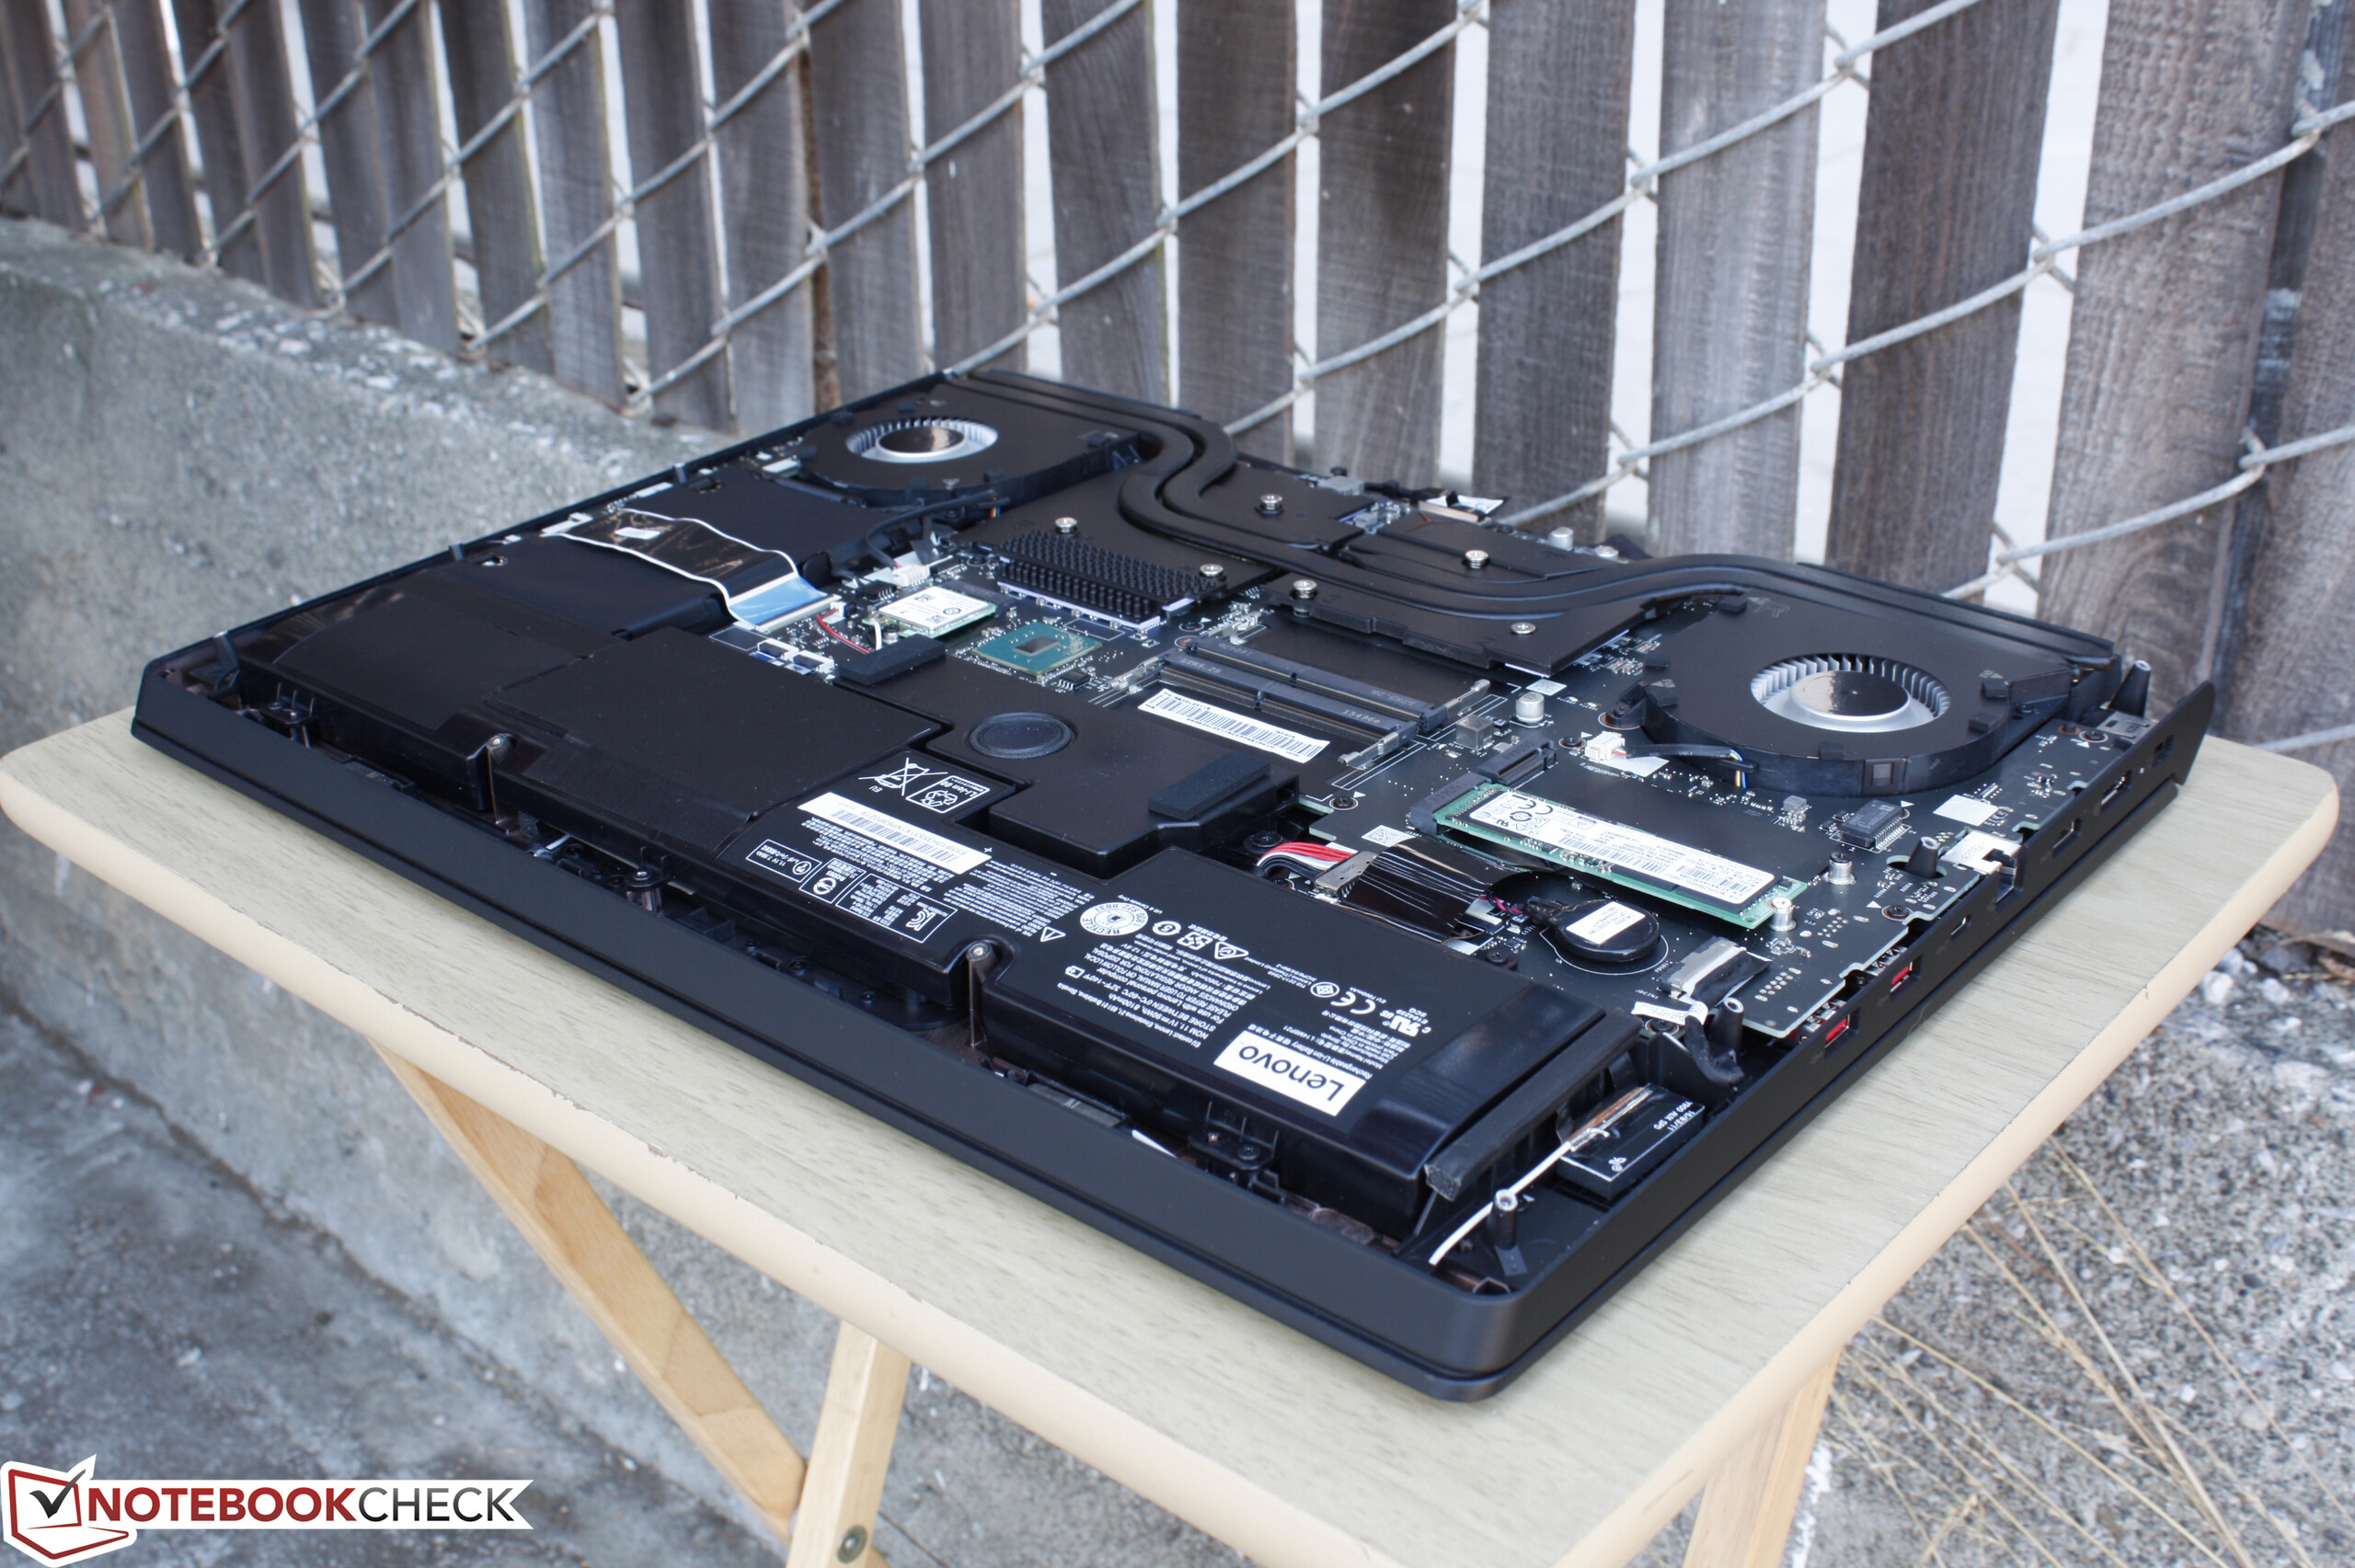
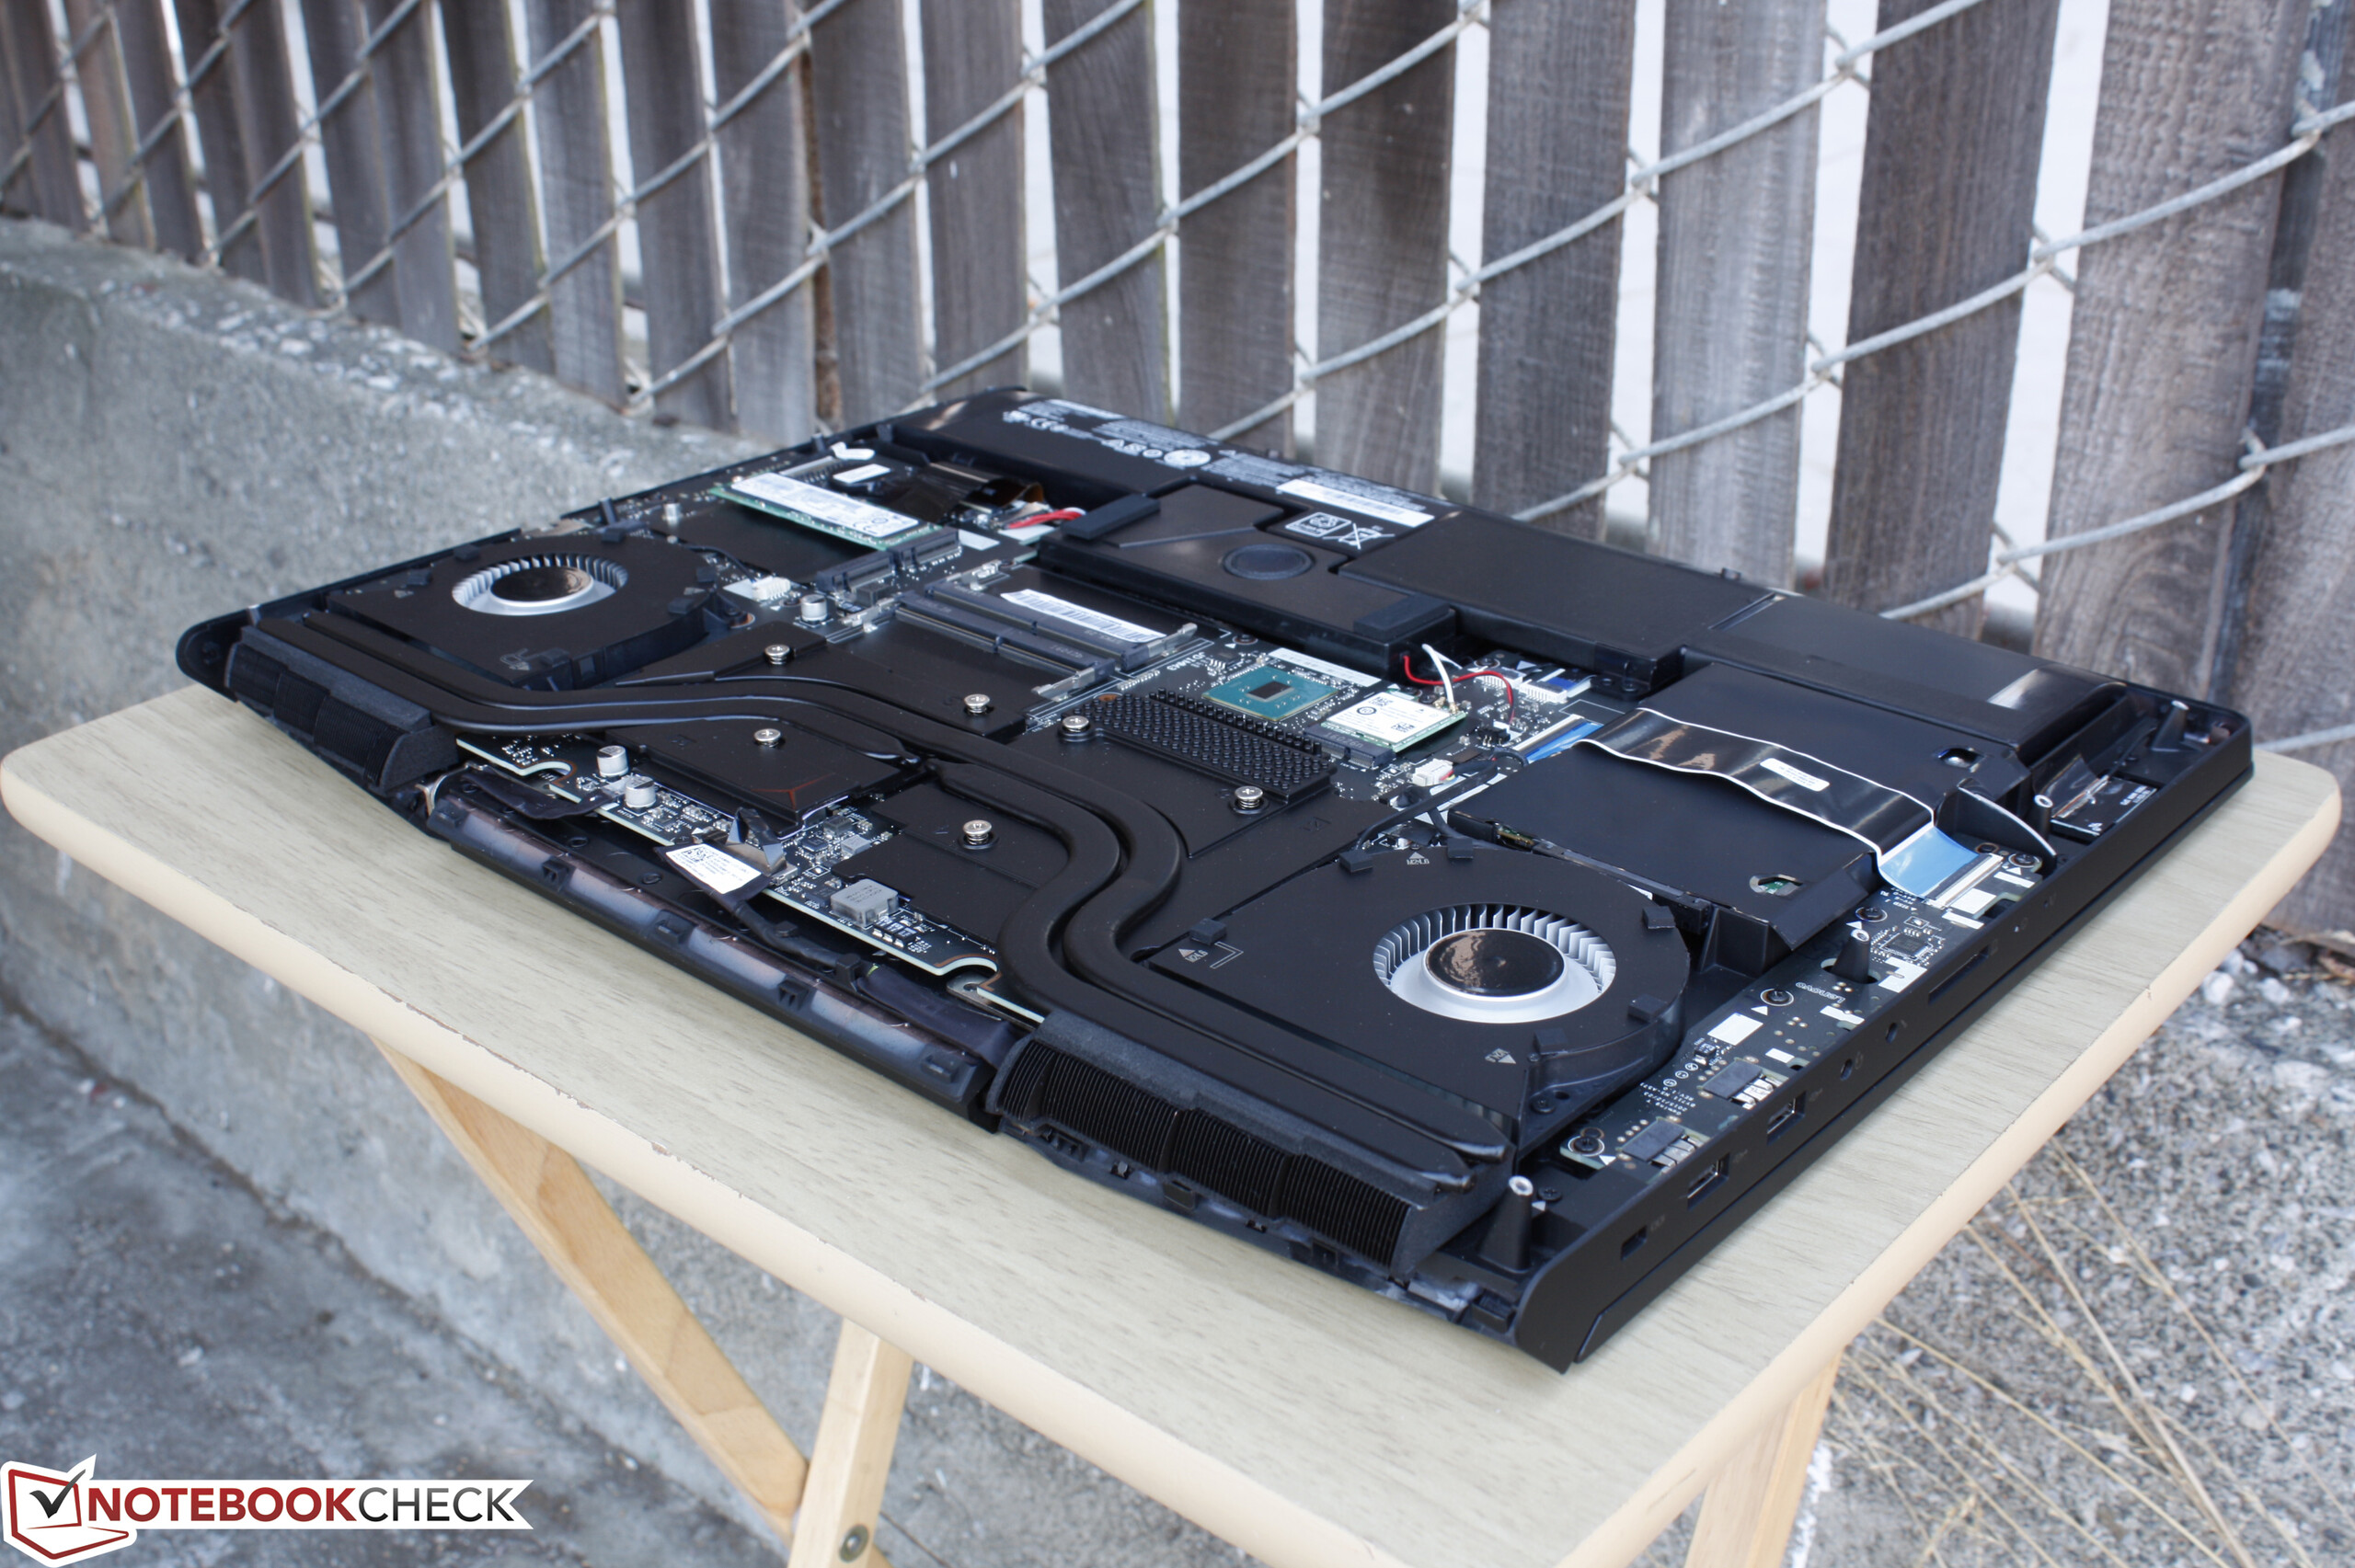
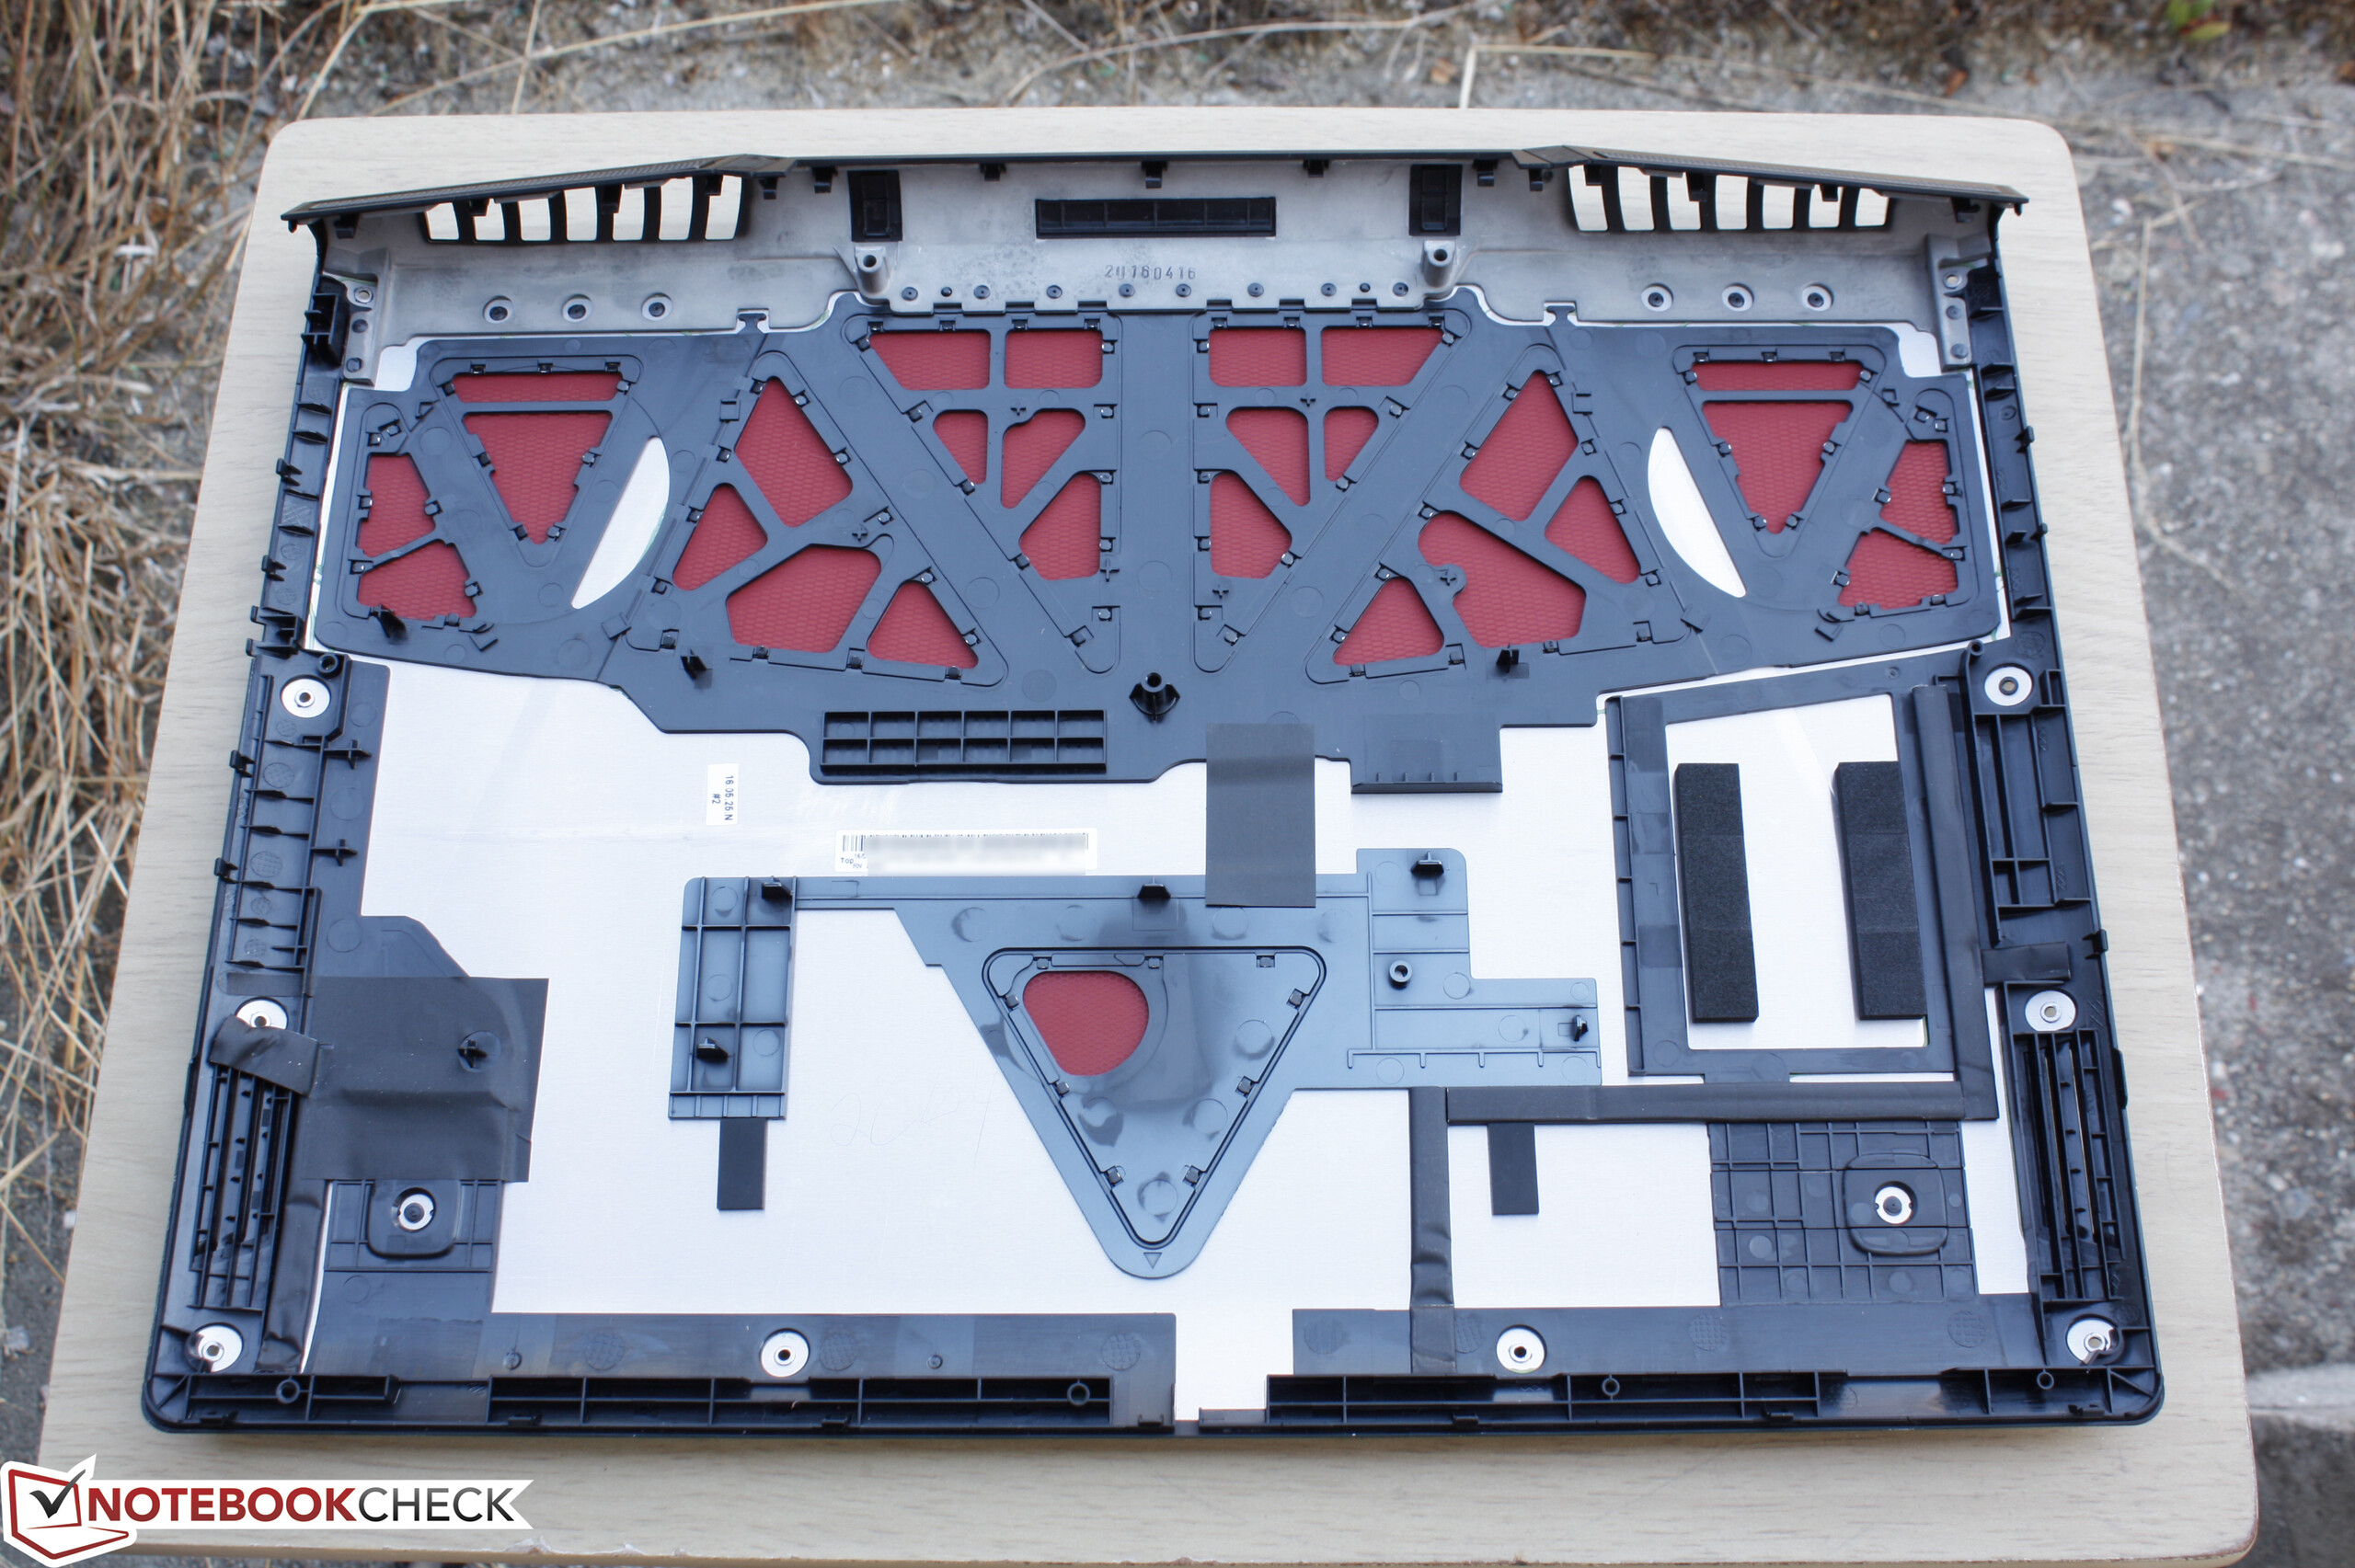
Y900的优势是它强大的性能,无处理器或显卡降频,和较低的机身温度。不过我们在考虑它是否值得推荐时犹豫再三,因为它相比更便宜的一些机型的优势并不明显,如易于维护升级、搭配MXM 3.0b显卡插槽的GT72VR。
联想的最新旗舰游戏本在品质和设计上是一次重要的改进,不过它受到吵闹的风扇、缺少屏幕升级选项、较软的孤岛式机械键盘和较低的性价比的拖累,特别是现在的竞争机型都搭配了更高效的GTX 1060显卡。
注:本文是基于完整评测的缩减版本,阅读完整的英文评测,请点击这里。
Lenovo IdeaPad Y900
-
10/10/2016 v5.1(old)
Allen Ngo
Pricecompare
