 Deutsch
 English
 Español
 Français
 Italiano
 Nederlands
 Polski
 Português
 Русский
 Türkçe
 Svenska
 Chinese
 Magyar
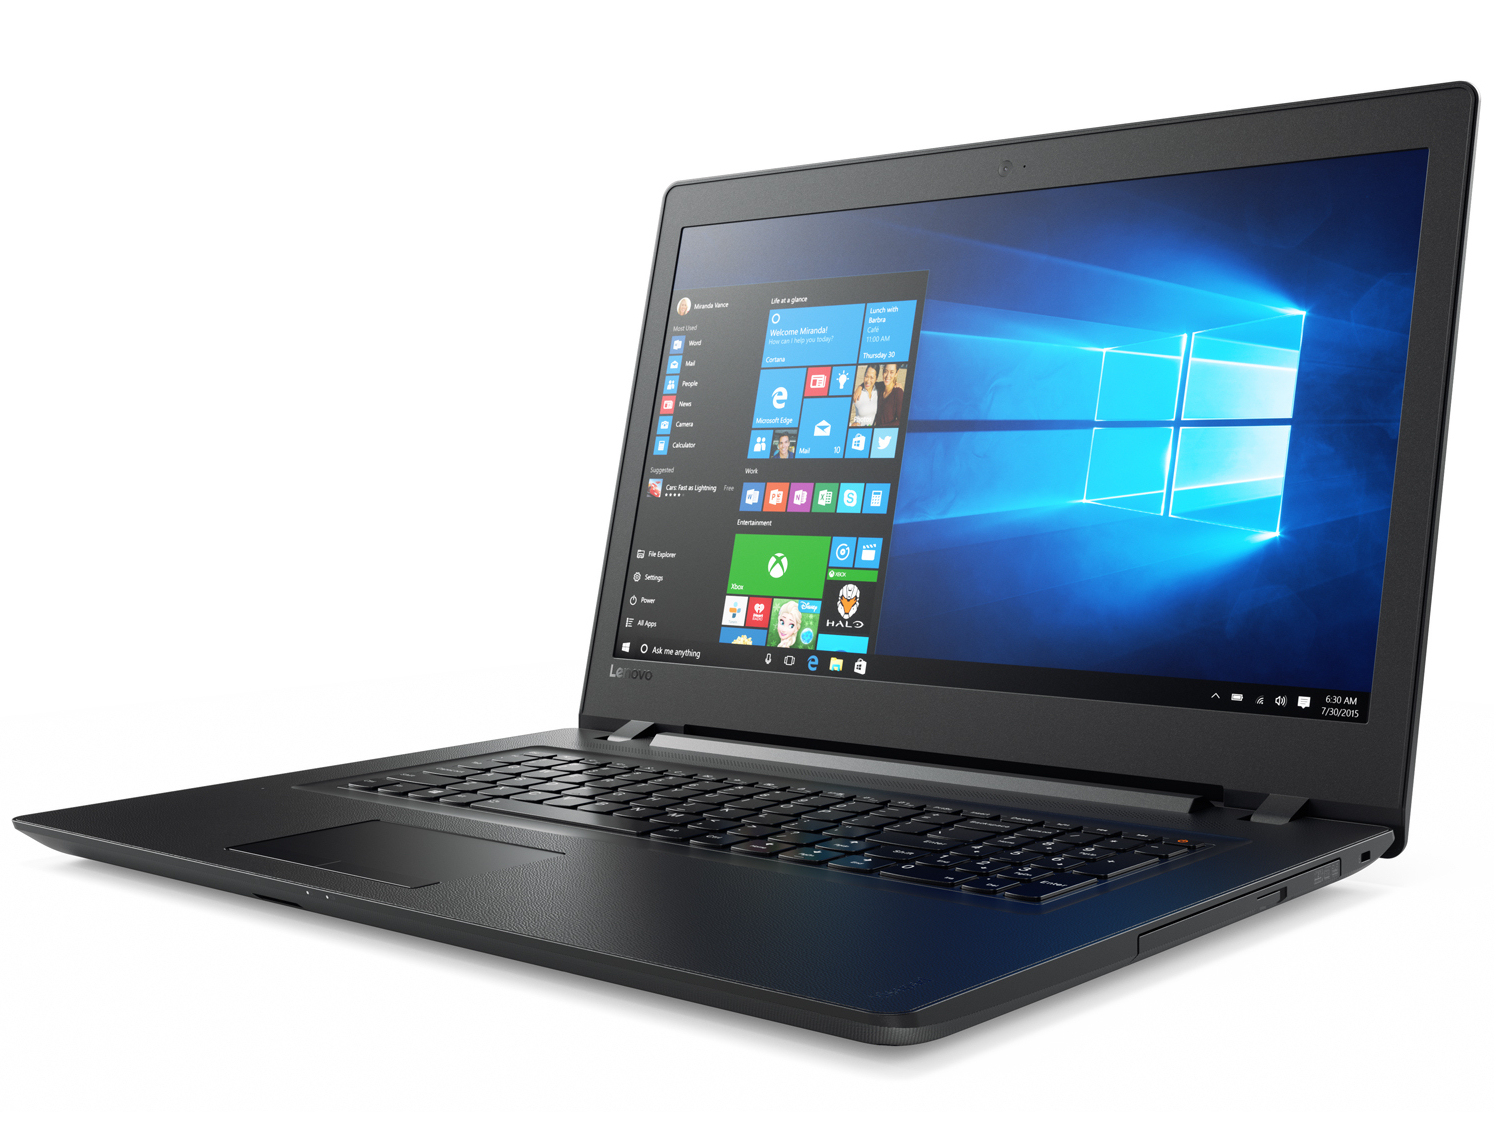
联想 IdeaPad V110-17IKB 80V20006GE 笔记本电脑简短评测

| SD Card Reader | |
| average JPG Copy Test (av. of 3 runs) | |
| Acer Aspire E5-774-54HJ | |
| Acer Aspire E5-722-662J | |
| Lenovo IdeaPad V110-17IKB 80V20006GE | |
| Dell Inspiron 17 5759-5118 | |
| Lenovo IdeaPad 300-17ISK 80QH001EGE | |
| maximum AS SSD Seq Read Test (1GB) | |
| Acer Aspire E5-774-54HJ | |
| Acer Aspire E5-722-662J | |
| Lenovo IdeaPad V110-17IKB 80V20006GE | |
| Lenovo IdeaPad 300-17ISK 80QH001EGE | |
| Dell Inspiron 17 5759-5118 | |
| Networking | |
| iperf Server (receive) TCP 1 m | |
| Acer Aspire E5-774-54HJ (jseb) | |
| iperf Client (transmit) TCP 1 m | |
| Acer Aspire E5-774-54HJ (jseb) | |
| iperf3 transmit AX12 | |
| Lenovo IdeaPad V110-17IKB 80V20006GE | |
| iperf3 receive AX12 | |
| Lenovo IdeaPad V110-17IKB 80V20006GE | |
| |||||||||||||||||||||||||
Brightness Distribution: 86 %
Center on Battery: 213 cd/m²
Contrast: 318:1 (Black: 0.67 cd/m²)
ΔE Color 12.3 | 0.5-29.43 Ø5
ΔE Greyscale 14.13 | 0.57-98 Ø5.3
77% sRGB (Argyll 1.6.3 3D)
50% AdobeRGB 1998 (Argyll 1.6.3 3D)
56.5% AdobeRGB 1998 (Argyll 2.2.0 3D)
77.2% sRGB (Argyll 2.2.0 3D)
56.6% Display P3 (Argyll 2.2.0 3D)
Gamma: 2.11
| Lenovo IdeaPad V110-17IKB 80V20006GE TN LED, 1600x900, 17.30 | Acer Aspire E5-774-54HJ TN LED, 1920x1080, 17.30 | Dell Inspiron 17 5759-5118 TN LED, 1920x1080, 17.30 | Acer Aspire E5-722-662J TN LED, 1600x900, 17.30 | Lenovo IdeaPad 300-17ISK 80QH001EGE TN LED, 1600x900, 17.30 | |
|---|---|---|---|---|---|
| Display | 21% | 19% | 0% | -4% | |
| Display P3 Coverage | 56.6 | 71.3 26% | 69.3 22% | 54.5 -4% | 52.4 -7% |
| sRGB Coverage | 77.2 | 91.7 19% | 90.6 17% | 81.8 6% | 76.1 -1% |
| AdobeRGB 1998 Coverage | 56.5 | 67.1 19% | 66.3 17% | 56.1 -1% | 54.2 -4% |
| Response Times | 638% | 70% | 660% | 5% | |
| Response Time Grey 50% / Grey 80% * | 44 ? | 42 ? 5% | 86 ? -95% | 48 ? -9% | 42 ? 5% |
| Response Time Black / White * | 25 ? | 23 ? 8% | 24 ? 4% | 24 ? 4% | 24 ? 4% |
| PWM Frequency | 50 ? | 1000 ? 1900% | 200 ? 300% | 1042 ? 1984% | |
| Screen | 51% | 39% | 38% | 12% | |
| Brightness middle | 213 | 353 66% | 304 43% | 216 1% | 205 -4% |
| Brightness | 203 | 320 58% | 292 44% | 199 -2% | 182 -10% |
| Brightness Distribution | 86 | 82 -5% | 84 -2% | 80 -7% | 77 -10% |
| Black Level * | 0.67 | 0.38 43% | 0.37 45% | 0.17 75% | 0.43 36% |
| Contrast | 318 | 929 192% | 822 158% | 1271 300% | 477 50% |
| Colorchecker dE 2000 * | 12.3 | 5.07 59% | 10.62 14% | 12.2 1% | 9.75 21% |
| Colorchecker dE 2000 max. * | 21.48 | 10.12 53% | 20.4 5% | 16.02 25% | |
| Greyscale dE 2000 * | 14.13 | 13.38 5% | 11.78 17% | 13.3 6% | 12.09 14% |
| Gamma | 2.11 104% | 2.69 82% | 2.39 92% | 2.15 102% | 2.62 84% |
| CCT | 17705 37% | 15991 41% | 12997 50% | 15963 41% | 12875 50% |
| Color Space (Percent of AdobeRGB 1998) | 50 | 60.1 20% | 59 18% | 52 4% | 49 -2% |
| Color Space (Percent of sRGB) | 77 | 91.6 19% | 90 17% | 76 -1% | 76 -1% |
| Total Average (Program / Settings) | 237% /
155% | 43% /
41% | 233% /
148% | 4% /
8% |
* ... smaller is better
Screen Flickering / PWM (Pulse-Width Modulation)
| Screen flickering / PWM detected | 50 Hz | ≤ 50 % brightness setting | 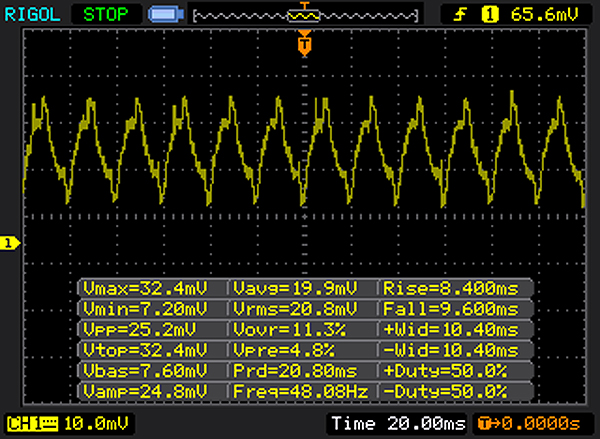 |
The display backlight flickers at 50 Hz (worst case, e.g., utilizing PWM) Flickering detected at a brightness setting of 50 % and below. There should be no flickering or PWM above this brightness setting. The frequency of 50 Hz is very low, so the flickering may cause eyestrain and headaches after extended use. In comparison: 53 % of all tested devices do not use PWM to dim the display. If PWM was detected, an average of 17924 (minimum: 5 - maximum: 3846000) Hz was measured. | |||
Display Response Times
| ↔ Response Time Black to White | ||
|---|---|---|
| 25 ms ... rise ↗ and fall ↘ combined | ↗ 7 ms rise | 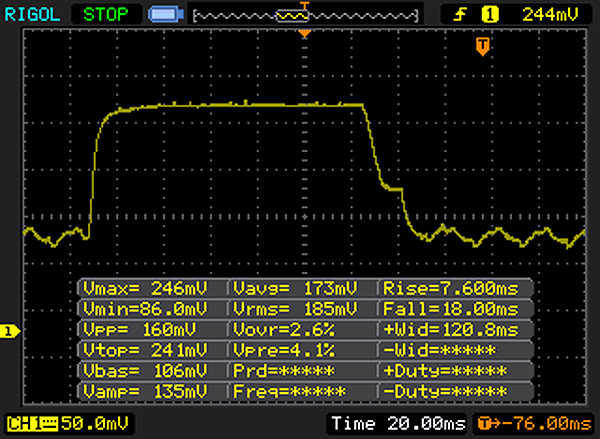 |
| ↘ 18 ms fall | ||
| The screen shows relatively slow response rates in our tests and may be too slow for gamers. In comparison, all tested devices range from 0.1 (minimum) to 240 (maximum) ms. » 53 % of all devices are better. This means that the measured response time is worse than the average of all tested devices (21.5 ms). | ||
| ↔ Response Time 50% Grey to 80% Grey | ||
| 44 ms ... rise ↗ and fall ↘ combined | ↗ 22 ms rise | 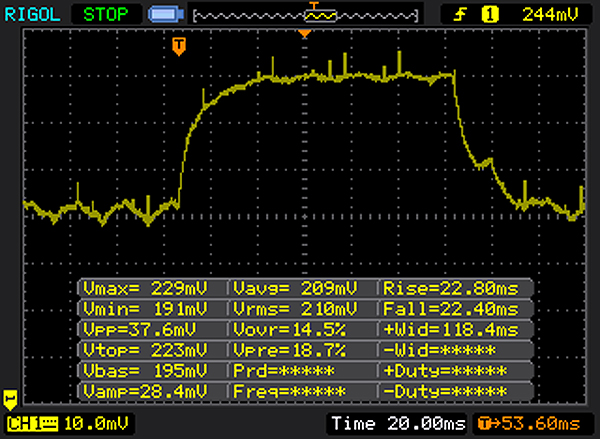 |
| ↘ 22 ms fall | ||
| The screen shows slow response rates in our tests and will be unsatisfactory for gamers. In comparison, all tested devices range from 0.2 (minimum) to 636 (maximum) ms. » 69 % of all devices are better. This means that the measured response time is worse than the average of all tested devices (33.7 ms). | ||
| Cinebench R15 | |
| CPU Single 64Bit | |
| Lenovo IdeaPad V110-17IKB 80V20006GE | |
| Acer Aspire E5-774-54HJ | |
| Lenovo IdeaPad 300-17ISK 80QH001EGE | |
| Lenovo B70-80 80MR0006GE | |
| Dell Inspiron 17 5759-5118 | |
| Acer Aspire E5-722-662J | |
| Acer Aspire ES1-731G-P5UR | |
| CPU Multi 64Bit | |
| Acer Aspire E5-774-54HJ | |
| Lenovo IdeaPad V110-17IKB 80V20006GE | |
| Dell Inspiron 17 5759-5118 | |
| Lenovo IdeaPad 300-17ISK 80QH001EGE | |
| Lenovo B70-80 80MR0006GE | |
| Acer Aspire E5-722-662J | |
| Acer Aspire ES1-731G-P5UR | |
| Cinebench R10 | |
| Rendering Multiple CPUs 32Bit | |
| Acer Aspire E5-774-54HJ | |
| Lenovo IdeaPad V110-17IKB 80V20006GE | |
| Lenovo IdeaPad 300-17ISK 80QH001EGE | |
| Dell Inspiron 17 5759-5118 | |
| Lenovo B70-80 80MR0006GE | |
| Acer Aspire E5-722-662J | |
| Acer Aspire ES1-731G-P5UR | |
| Rendering Single 32Bit | |
| Lenovo IdeaPad V110-17IKB 80V20006GE | |
| Acer Aspire E5-774-54HJ | |
| Lenovo IdeaPad 300-17ISK 80QH001EGE | |
| Dell Inspiron 17 5759-5118 | |
| Lenovo B70-80 80MR0006GE | |
| Acer Aspire E5-722-662J | |
| Acer Aspire ES1-731G-P5UR | |
| Geekbench 3 | |
| 32 Bit Single-Core Score | |
| Lenovo IdeaPad V110-17IKB 80V20006GE | |
| Acer Aspire E5-774-54HJ | |
| Dell Inspiron 17 5759-5118 | |
| Lenovo IdeaPad 300-17ISK 80QH001EGE | |
| 32 Bit Multi-Core Score | |
| Lenovo IdeaPad V110-17IKB 80V20006GE | |
| Acer Aspire E5-774-54HJ | |
| Dell Inspiron 17 5759-5118 | |
| Lenovo IdeaPad 300-17ISK 80QH001EGE | |
| Geekbench 4.0 | |
| 64 Bit Single-Core Score | |
| Lenovo IdeaPad V110-17IKB 80V20006GE | |
| Acer Aspire E5-774-54HJ | |
| 64 Bit Multi-Core Score | |
| Lenovo IdeaPad V110-17IKB 80V20006GE | |
| Acer Aspire E5-774-54HJ | |
| JetStream 1.1 - Total Score | |
| Lenovo IdeaPad V110-17IKB 80V20006GE | |
| Acer Aspire E5-774-54HJ | |
| Lenovo IdeaPad 300-17ISK 80QH001EGE | |
| Dell Inspiron 17 5759-5118 | |
| PCMark 8 Home Score Accelerated v2 | 3611 points | |
Help | ||
| PCMark 8 - Home Score Accelerated v2 | |
| Lenovo IdeaPad V110-17IKB 80V20006GE | |
| Dell Inspiron 17 5759-5118 | |
| Lenovo IdeaPad 300-17ISK 80QH001EGE | |
| Acer Aspire E5-774-54HJ | |
| Lenovo B70-80 80MR0006GE | |
| Acer Aspire E5-722-662J | |
| Acer Aspire ES1-731G-P5UR | |

| Lenovo IdeaPad V110-17IKB 80V20006GE WDC Scorpio Blue WD10JPCX-24UE4T0 | Acer Aspire E5-774-54HJ Western Digital Scorpio Blue WD5000LPCX-24C6HT0 | Dell Inspiron 17 5759-5118 Seagate Momentus SpinPoint M8 ST1000LM024 HN-M101MBB | Lenovo IdeaPad 300-17ISK 80QH001EGE Toshiba MQ01ABD100 | Acer Aspire ES1-731G-P5UR Toshiba MQ01ABD100 | |
|---|---|---|---|---|---|
| CrystalDiskMark 3.0 | -20% | -39% | -30% | -28% | |
| Read Seq | 115.2 | 88.9 -23% | 91.8 -20% | 100.6 -13% | 105 -9% |
| Write Seq | 112.8 | 70.9 -37% | 84.7 -25% | 96.3 -15% | 96 -15% |
| Read 512 | 39.67 | 33.01 -17% | 26.59 -33% | 28.15 -29% | 32.89 -17% |
| Write 512 | 55.9 | 51.6 -8% | 32.7 -42% | 43.34 -22% | 25.77 -54% |
| Read 4k | 0.487 | 0.381 -22% | 0.288 -41% | 0.312 -36% | 0.324 -33% |
| Write 4k | 1.287 | 1.117 -13% | 0.638 -50% | 0.792 -38% | 0.755 -41% |
| Read 4k QD32 | 1.175 | 0.891 -24% | 0.59 -50% | 0.708 -40% | 0.892 -24% |
| Write 4k QD32 | 1.37 | 1.13 -18% | 0.642 -53% | 0.764 -44% | 1 -27% |
| 3DMark 11 Performance | 1691 points | |
Help | ||
| 3DMark 11 - 1280x720 Performance GPU | |
| Dell Inspiron 17 5759-5118 | |
| Lenovo B70-80 80MR0006GE | |
| Lenovo IdeaPad V110-17IKB 80V20006GE | |
| Lenovo IdeaPad 300-17ISK 80QH001EGE | |
| Acer Aspire ES1-731G-P5UR | |
| Acer Aspire E5-774-54HJ | |
| Acer Aspire E5-722-662J | |
| low | med. | high | ultra | |
| BioShock Infinite (2013) | 53.4 | 30.2 | 25.2 |
Noise Level
| Idle |
| 31.2 / 31.2 / 31.2 dB(A) |
| HDD |
| 31.8 dB(A) |
| DVD |
| 35.5 / dB(A) |
| Load |
| 32.6 / 32.6 dB(A) |
 | ||
30 dB silent 40 dB(A) audible 50 dB(A) loud |
||
min: | ||
(+) The maximum temperature on the upper side is 34.1 °C / 93 F, compared to the average of 34.2 °C / 94 F, ranging from 21.2 to 62.5 °C for the class Office.
(+) The bottom heats up to a maximum of 38.1 °C / 101 F, compared to the average of 36.7 °C / 98 F
(+) In idle usage, the average temperature for the upper side is 22.1 °C / 72 F, compared to the device average of 29.5 °C / 85 F.
(+) The palmrests and touchpad are reaching skin temperature as a maximum (33.5 °C / 92.3 F) and are therefore not hot.
(-) The average temperature of the palmrest area of similar devices was 27.7 °C / 81.9 F (-5.8 °C / -10.4 F).
Lenovo IdeaPad V110-17IKB 80V20006GE audio analysis
(-) | not very loud speakers (65 dB)
Bass 100 - 315 Hz
(-) | nearly no bass - on average 23% lower than median
(±) | linearity of bass is average (13.9% delta to prev. frequency)
Mids 400 - 2000 Hz
(±) | higher mids - on average 6.2% higher than median
(±) | linearity of mids is average (11.3% delta to prev. frequency)
Highs 2 - 16 kHz
(+) | balanced highs - only 3.6% away from median
(+) | highs are linear (6.8% delta to prev. frequency)
Overall 100 - 16.000 Hz
(-) | overall sound is not linear (31% difference to median)
Compared to same class
» 91% of all tested devices in this class were better, 2% similar, 6% worse
» The best had a delta of 7%, average was 22%, worst was 53%
Compared to all devices tested
» 88% of all tested devices were better, 3% similar, 10% worse
» The best had a delta of 4%, average was 25%, worst was 134%
Apple MacBook 12 (Early 2016) 1.1 GHz audio analysis
(+) | speakers can play relatively loud (83.6 dB)
Bass 100 - 315 Hz
(±) | reduced bass - on average 11.3% lower than median
(±) | linearity of bass is average (14.2% delta to prev. frequency)
Mids 400 - 2000 Hz
(+) | balanced mids - only 2.4% away from median
(+) | mids are linear (5.5% delta to prev. frequency)
Highs 2 - 16 kHz
(+) | balanced highs - only 2% away from median
(+) | highs are linear (4.5% delta to prev. frequency)
Overall 100 - 16.000 Hz
(+) | overall sound is linear (10.2% difference to median)
Compared to same class
» 5% of all tested devices in this class were better, 2% similar, 93% worse
» The best had a delta of 5%, average was 19%, worst was 53%
Compared to all devices tested
» 3% of all tested devices were better, 1% similar, 96% worse
» The best had a delta of 4%, average was 25%, worst was 134%
| Off / Standby | |
| Idle | |
| Load |
|
| Battery Runtime - WiFi Websurfing | |
| Lenovo IdeaPad 300-17ISK 80QH001EGE | |
| Lenovo B70-80 80MR0006GE | |
| Acer Aspire E5-774-54HJ | |
| Dell Inspiron 17 5759-5118 | |
| Acer Aspire ES1-731G-P5UR | |
| Lenovo IdeaPad V110-17IKB 80V20006GE | |
| Acer Aspire E5-722-662J | |
Pros
Cons
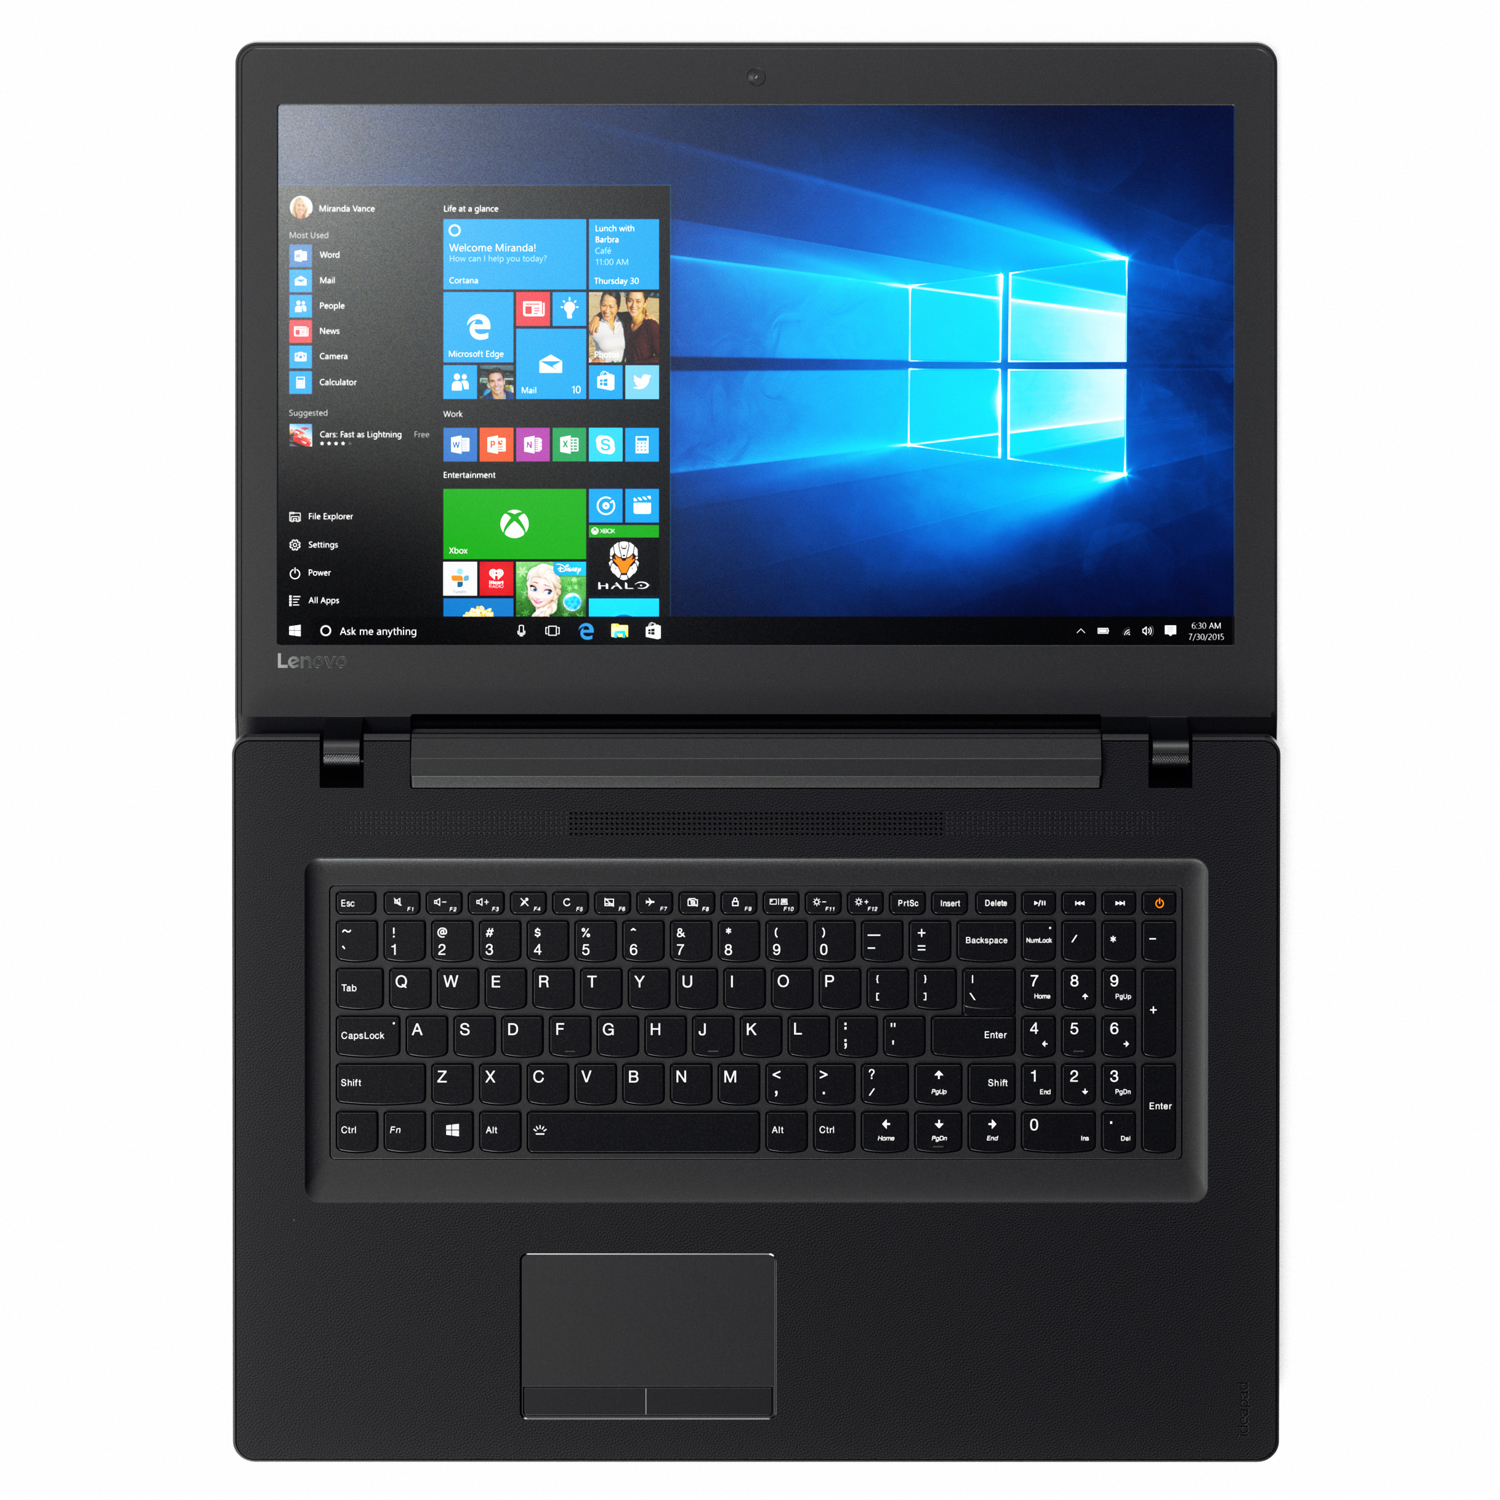
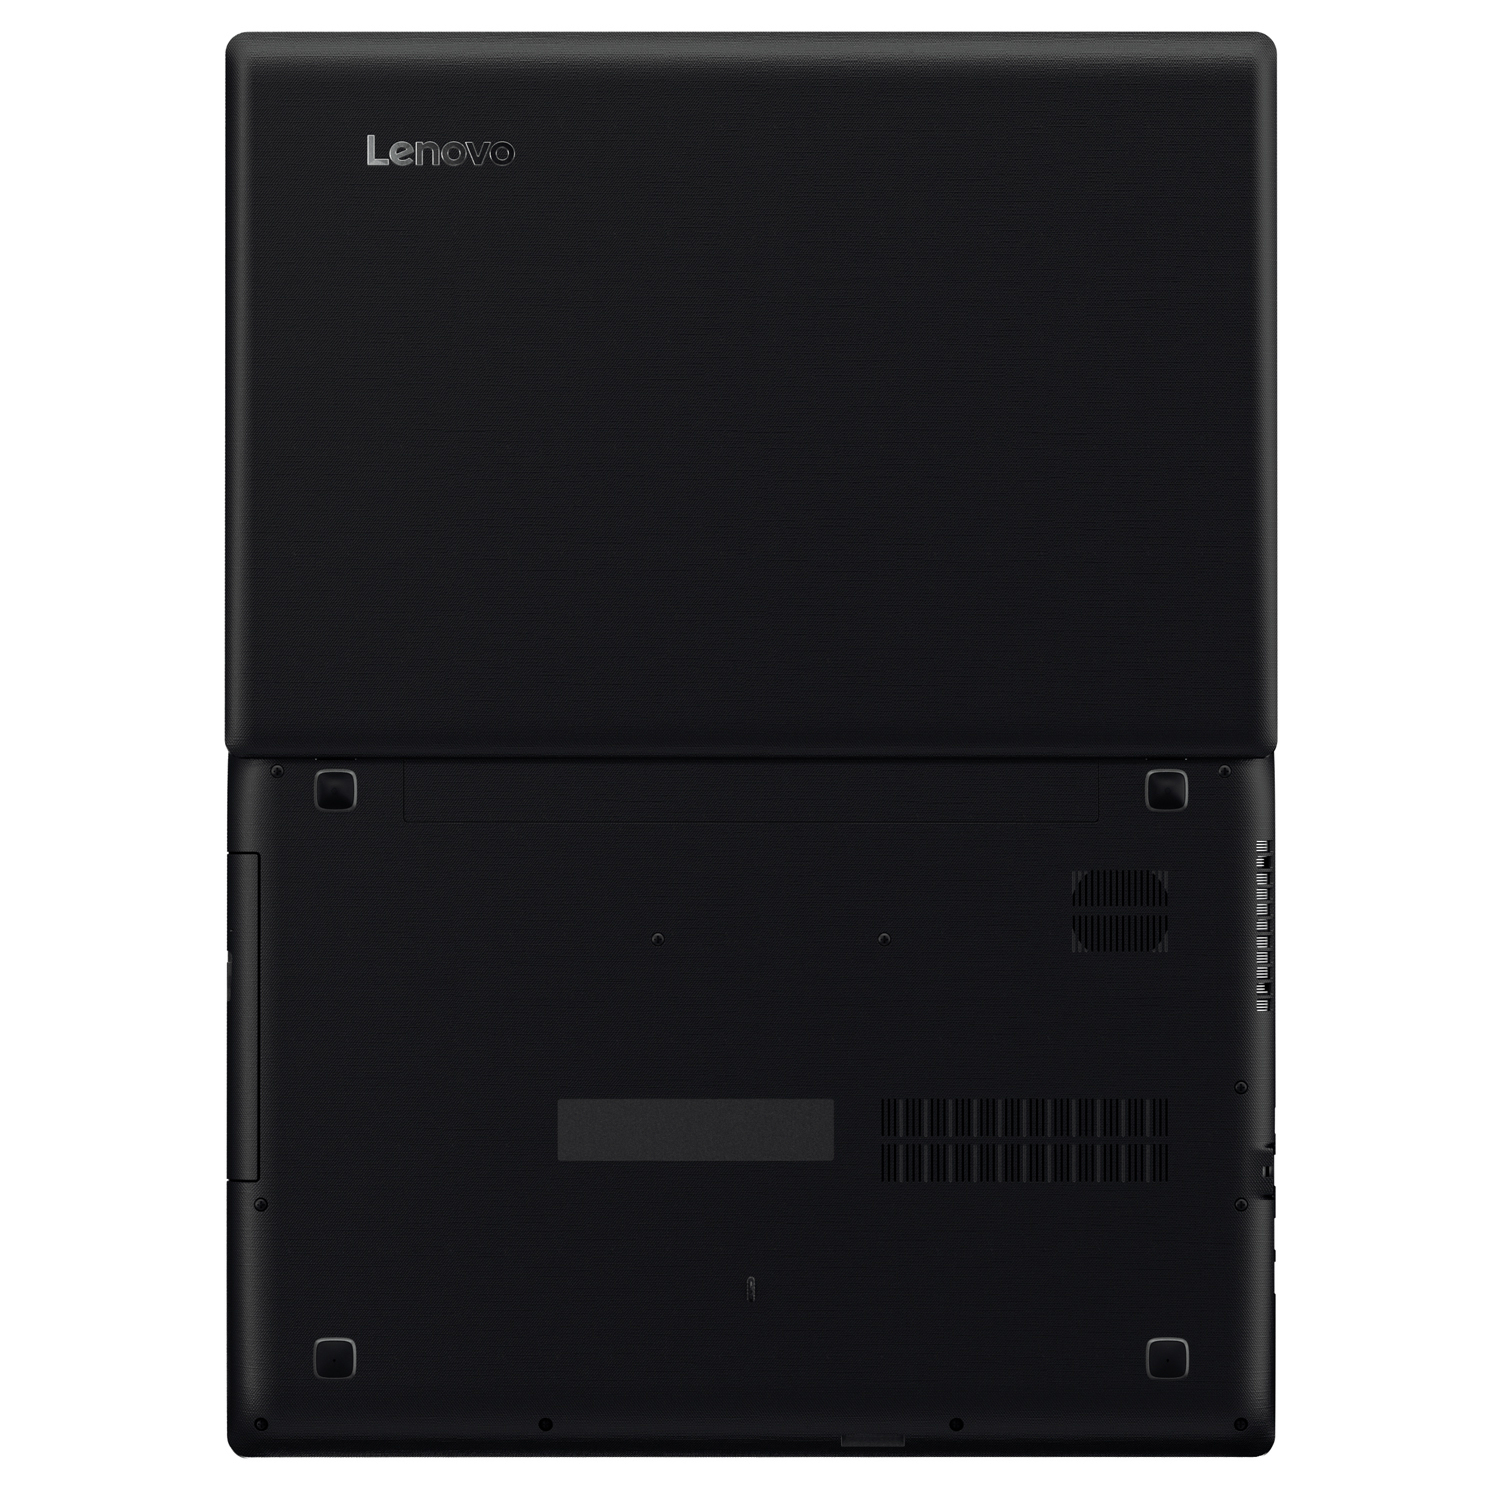
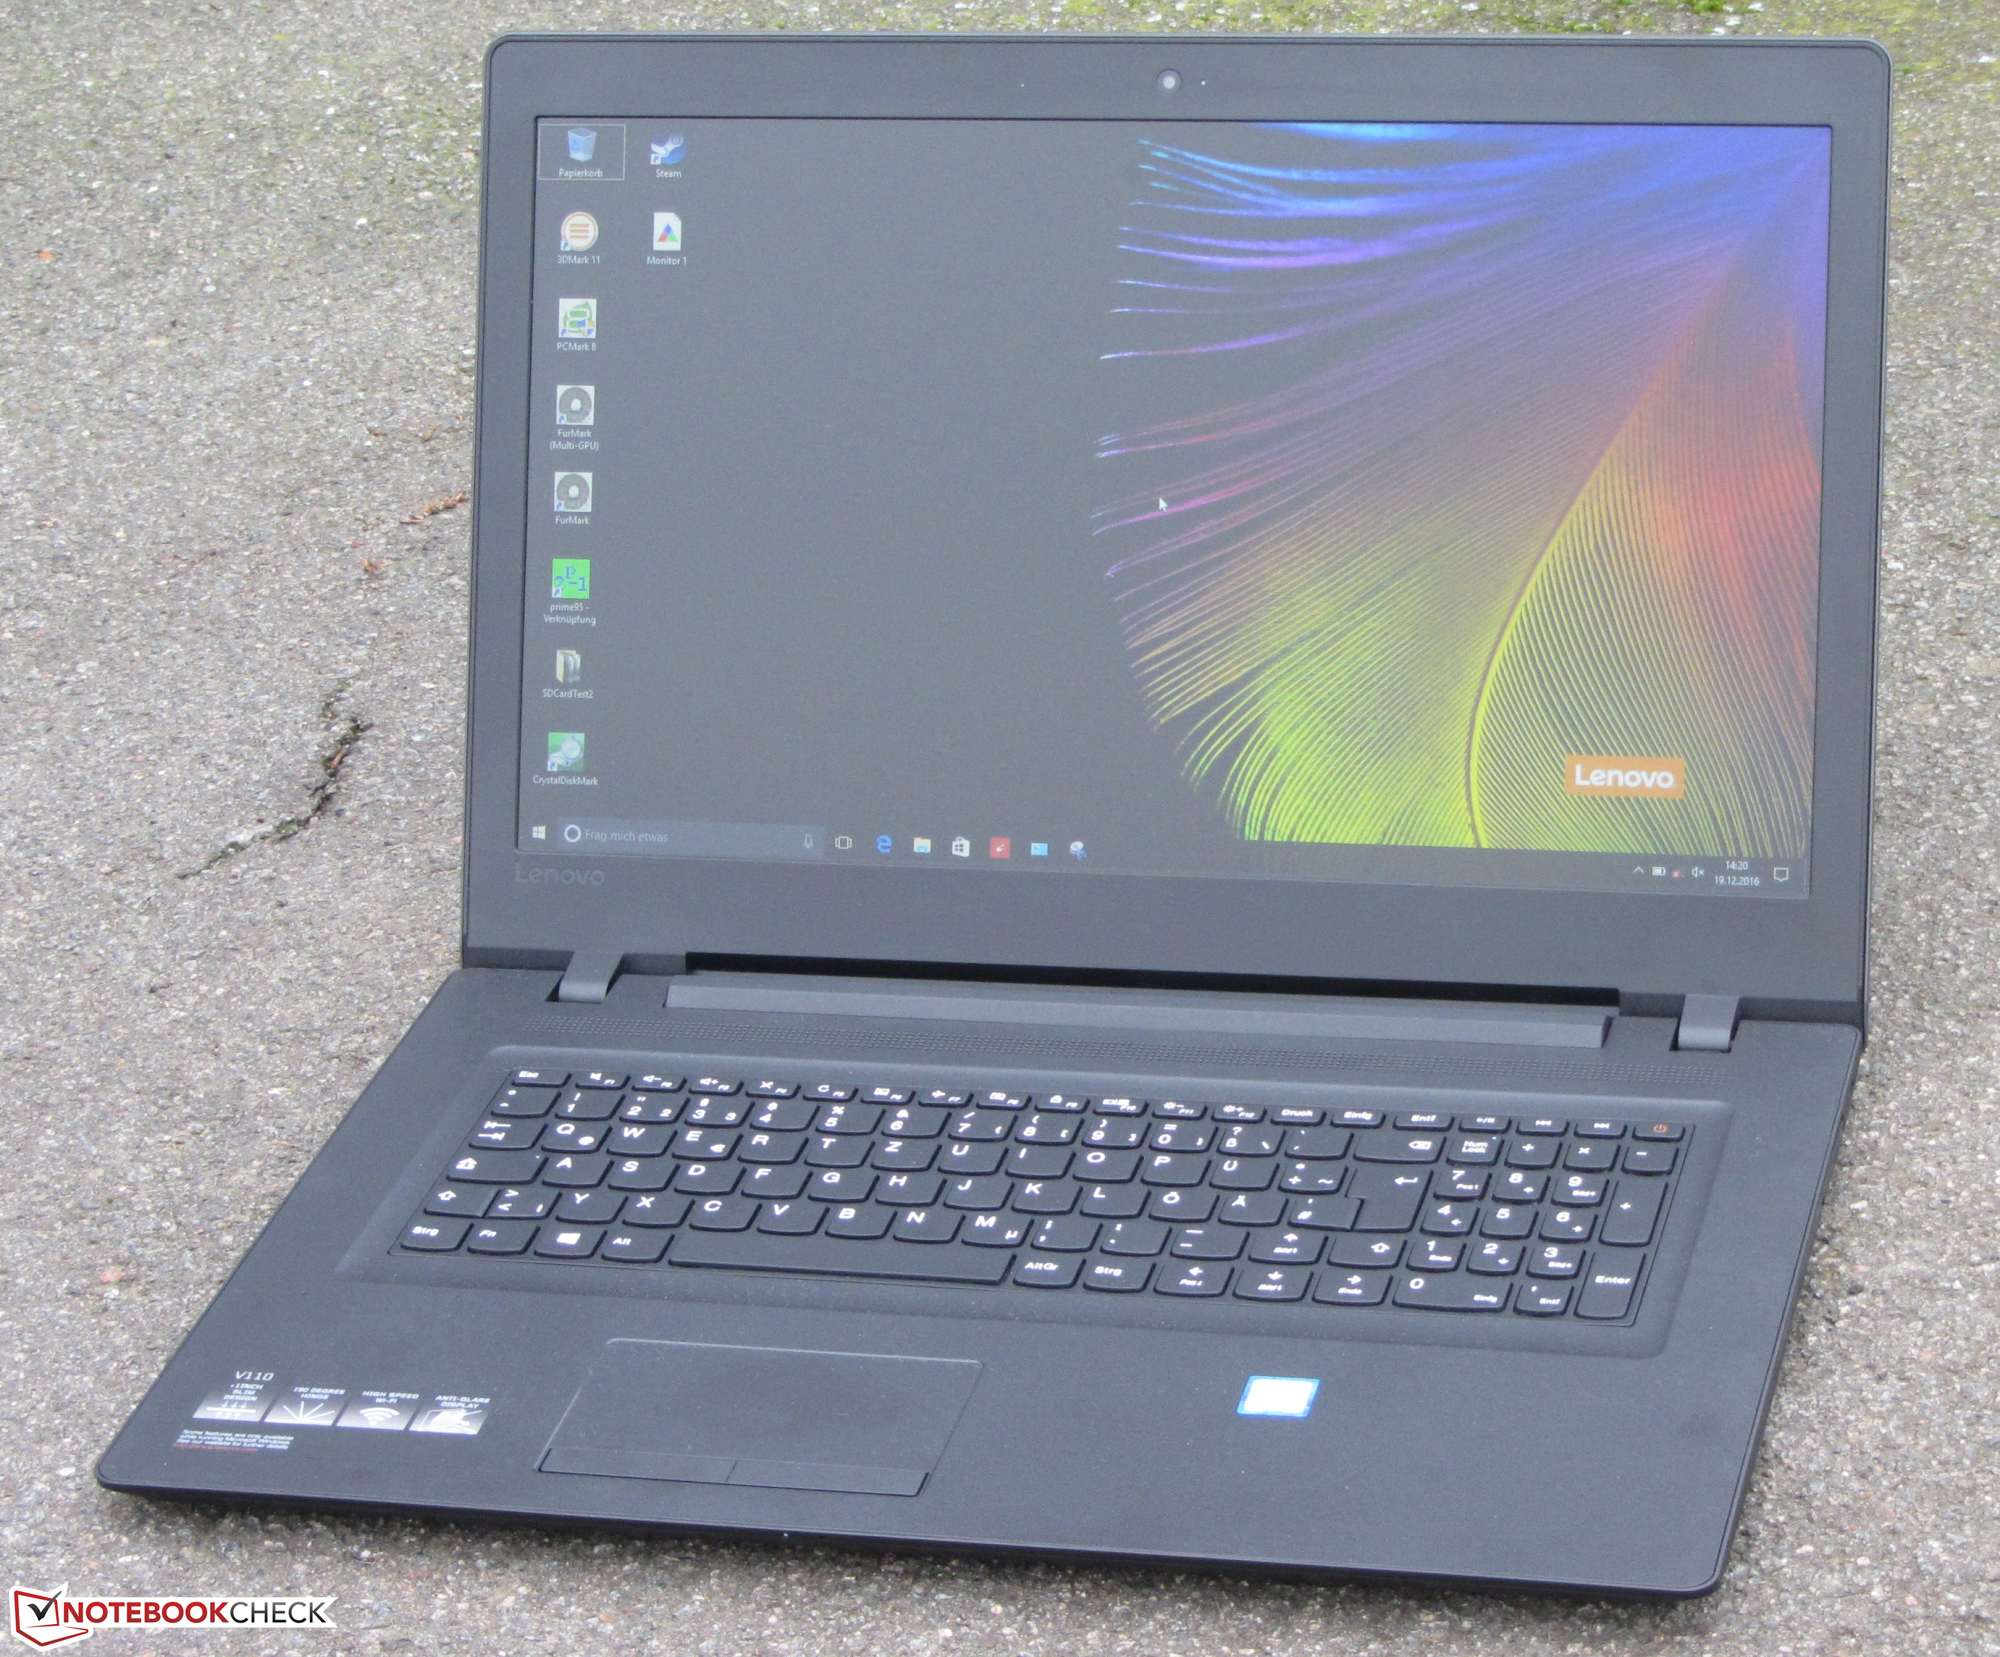
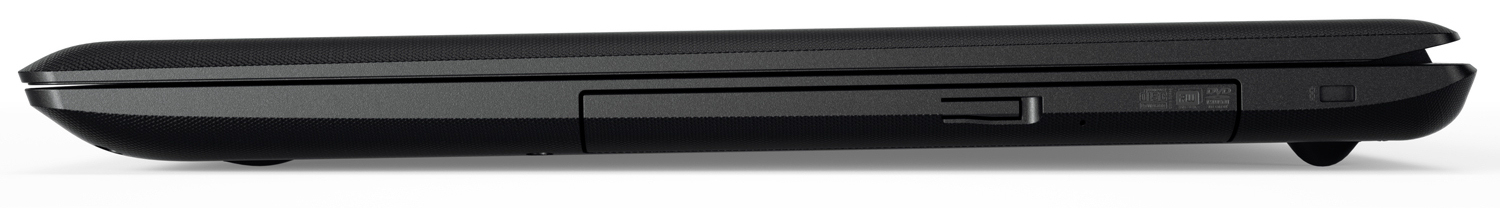
这款联想IdeaPad是一台17.3寸的办公笔记本电脑,面向个人用户和小型企业。这台笔记本电脑搭配的Kaby Lake架构处理器提供了充足的性能。它在待机时不会过热或太吵。它搭配了1TB机械硬盘,不过对此类产品来说,更快的载入速度比更大储存容量可能更为重要。如果你想要将机械硬盘更换为固态硬盘的话,则需要打开整个机身底盖,因为它没有维护底盖的设计。这台笔记本电脑的键盘不算出色,但质量可以接受。它十分适合桌面固定使用,因为电池续航、屏幕尺寸都限制了它的便携型。它的17.3寸屏幕较暗,同时对比度和可视角度范围都较小,但我们很喜欢它的磨砂表面。
联想为这台笔记本电脑定了很高的价码,不过它无法满足我们的期待。
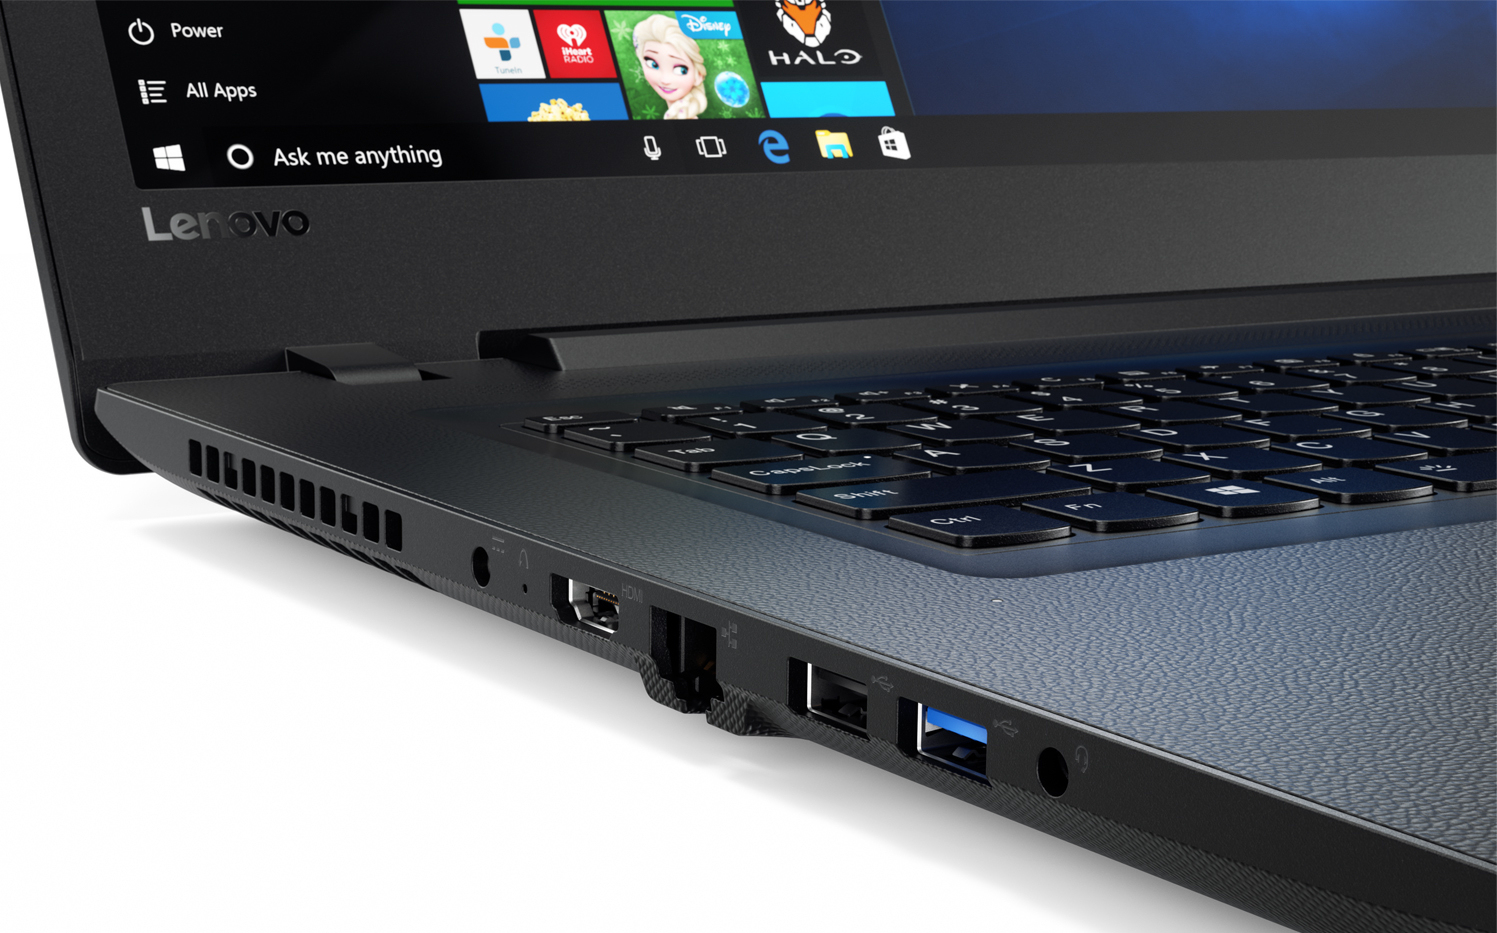
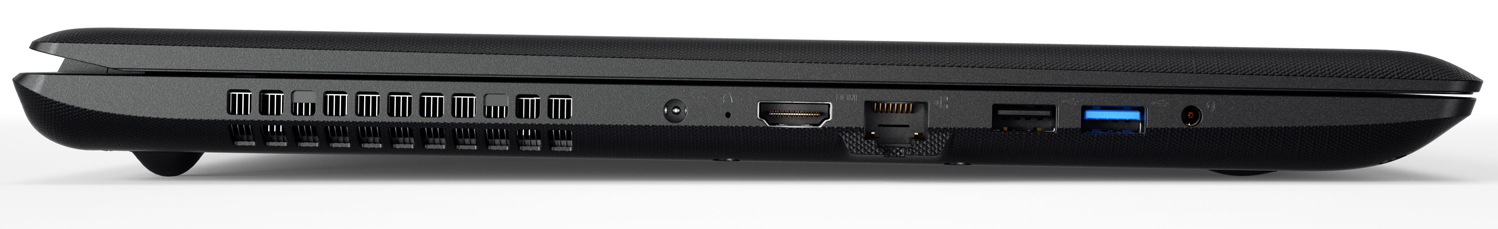
在我们测试时,这台IdeaPad售价600到700欧元(约4375人民币到5105人民币)。它的Windows 10专业版证书也进一步提高了成本,作为缺点不少的办公笔记本来说它的价位显得有些过高。在千兆以太网口已经是标配的今天,这台设备仅搭配了高速以太网口。它的质保也只有一年,而这个价位的设备基本都提供了两年质保。喜欢这台笔记本的用户可能会在使用时发现它呜呜的风扇噪音。最后它的机身一些位置也不够坚固。
在17.3寸设备中,宏碁 Aspire E5-774是个更好的选择。这台设备提供了更好的全高清屏幕,一块固态硬盘,长电池续航和两年质保。消费者需要在550欧元(约4011人民币)的价码上加上单独购买Windows证书的价格。
很快我们将会测试它的一款姐妹机型,IdeaPad 110-17IKB。这个型号搭配了独立的Radeon R5 M430显卡。
注:本文是基于完整评测的缩减版本,阅读完整的英文评测,请点击这里。
Lenovo IdeaPad V110-17IKB 80V20006GE
-
12/22/2016 v6(old)
Sascha Mölck