 Deutsch
 English
 Español
 Français
 Italiano
 Nederlands
 Polski
 Português
 Русский
 Türkçe
 Svenska
 Chinese
 Magyar
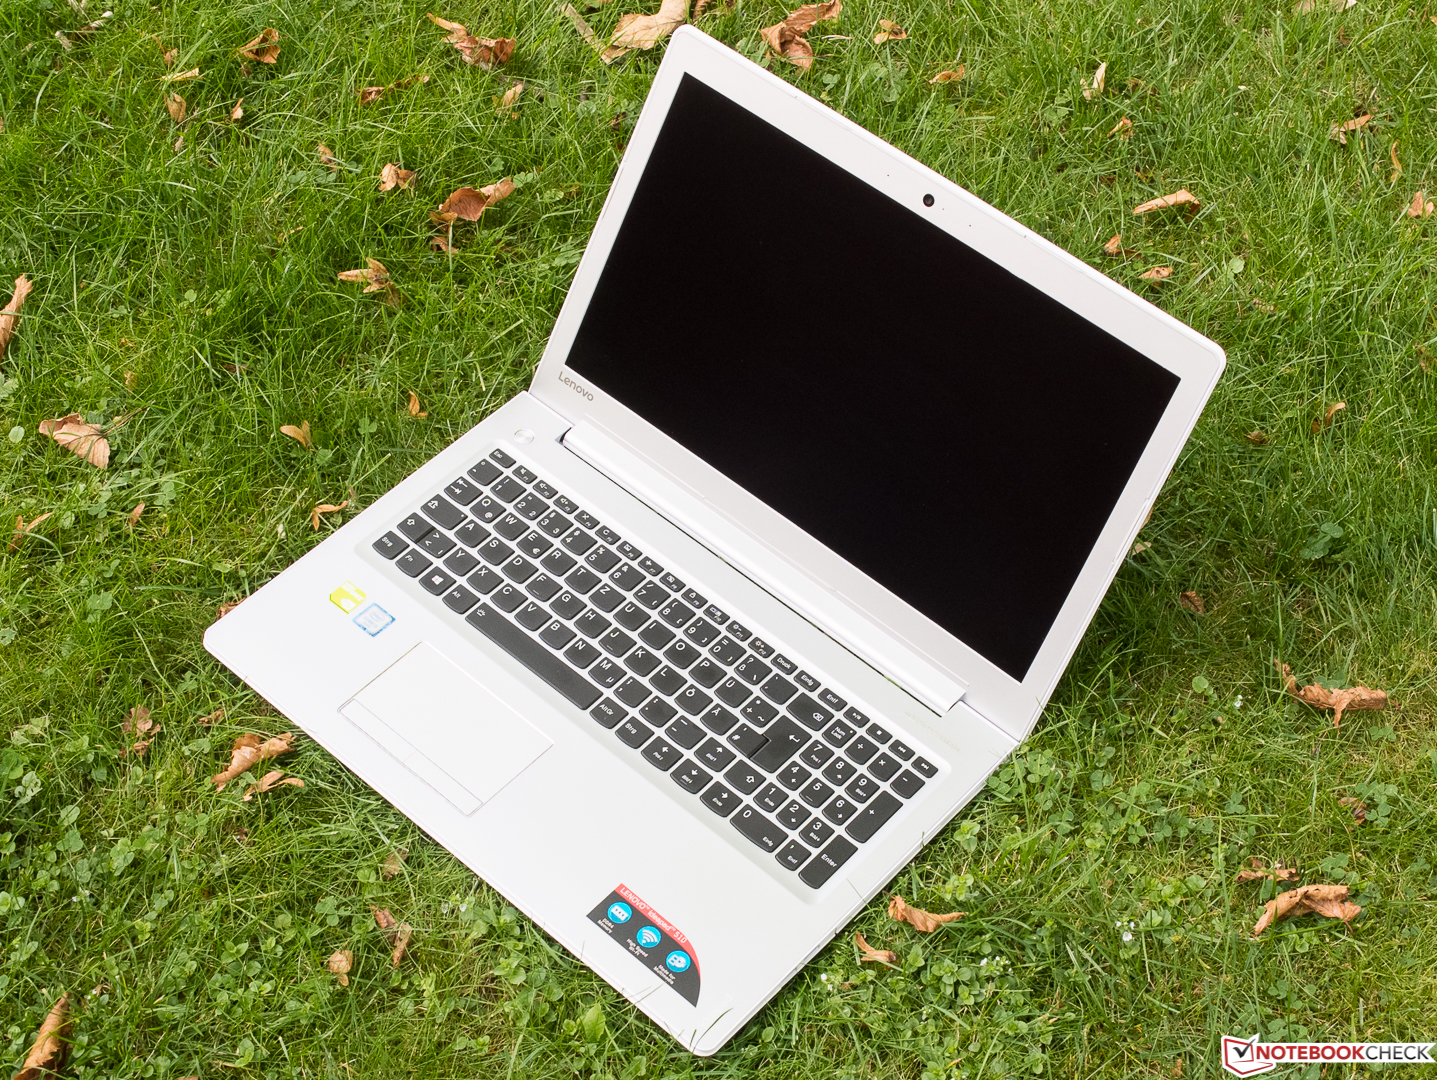
联想 IdeaPad 510-15ISK 笔记本电脑简短评测

| SD Card Reader | |
| average JPG Copy Test (av. of 3 runs) | |
| HP Pavilion 14-al003ng | |
| Acer Aspire F15 F5-573G-53V1 | |
| Asus N552VX-FY103T | |
| Lenovo Ideapad 510-15ISK | |
| maximum AS SSD Seq Read Test (1GB) | |
| Asus N552VX-FY103T | |
| HP Pavilion 14-al003ng | |
| Lenovo Ideapad 510-15ISK | |
| Networking | |
| iperf Server (receive) TCP 1 m | |
| Acer Aspire E5-774G-78NA (seb) | |
| Lenovo Ideapad 310-15ISK | |
| Lenovo Ideapad 510-15ISK (Seb) | |
| iperf Client (transmit) TCP 1 m | |
| Lenovo Ideapad 310-15ISK | |
| Acer Aspire E5-774G-78NA (seb) | |
| Lenovo Ideapad 510-15ISK (Seb) | |
| |||||||||||||||||||||||||
Brightness Distribution: 80 %
Center on Battery: 284 cd/m²
Contrast: 861:1 (Black: 0.33 cd/m²)
ΔE Color 7.21 | 0.5-29.43 Ø5
ΔE Greyscale 6.86 | 0.57-98 Ø5.3
58% sRGB (Argyll 1.6.3 3D)
37% AdobeRGB 1998 (Argyll 1.6.3 3D)
40.59% AdobeRGB 1998 (Argyll 2.2.0 3D)
58.7% sRGB (Argyll 2.2.0 3D)
39.26% Display P3 (Argyll 2.2.0 3D)
Gamma: 2.46
| Lenovo Ideapad 510-15ISK | Acer Aspire F15 F5-573G-53V1 | Asus N552VX-FY103T | HP Pavilion 14-al003ng | |
|---|---|---|---|---|
| Display | 96% | 60% | ||
| Display P3 Coverage | 39.26 | 84.2 114% | 67.9 73% | |
| sRGB Coverage | 58.7 | 99.7 70% | 87.7 49% | |
| AdobeRGB 1998 Coverage | 40.59 | 82.7 104% | 64 58% | |
| Response Times | 631% | -7% | 2% | |
| Response Time Grey 50% / Grey 80% * | 40 ? | 44 ? -10% | 42 ? -5% | 36.4 ? 9% |
| Response Time Black / White * | 24 ? | 23 ? 4% | 26 ? -8% | 25.2 ? -5% |
| PWM Frequency | 50 ? | 1000 ? 1900% | ||
| Screen | -15% | 25% | 8% | |
| Brightness middle | 284 | 234 -18% | 336 18% | 220 -23% |
| Brightness | 276 | 219 -21% | 304 10% | 209 -24% |
| Brightness Distribution | 80 | 80 0% | 85 6% | 88 10% |
| Black Level * | 0.33 | 0.48 -45% | 0.34 -3% | 0.28 15% |
| Contrast | 861 | 488 -43% | 988 15% | 786 -9% |
| Colorchecker dE 2000 * | 7.21 | 11.8 -64% | 5.26 27% | 4.58 36% |
| Colorchecker dE 2000 max. * | 15.12 | 20.69 -37% | 10.49 31% | 11.47 24% |
| Greyscale dE 2000 * | 6.86 | 13.3 -94% | 4.26 38% | 2.34 66% |
| Gamma | 2.46 89% | 2.47 89% | 2.35 94% | 2.26 97% |
| CCT | 6726 97% | 17098 38% | 6758 96% | 6661 98% |
| Color Space (Percent of AdobeRGB 1998) | 37 | 74 100% | 57 54% | 34.6 -6% |
| Color Space (Percent of sRGB) | 58 | 100 72% | 88 52% | 54.2 -7% |
| Total Average (Program / Settings) | 237% /
127% | 26% /
28% | 5% /
7% |
* ... smaller is better
Display Response Times
| ↔ Response Time Black to White | ||
|---|---|---|
| 24 ms ... rise ↗ and fall ↘ combined | ↗ 9 ms rise | 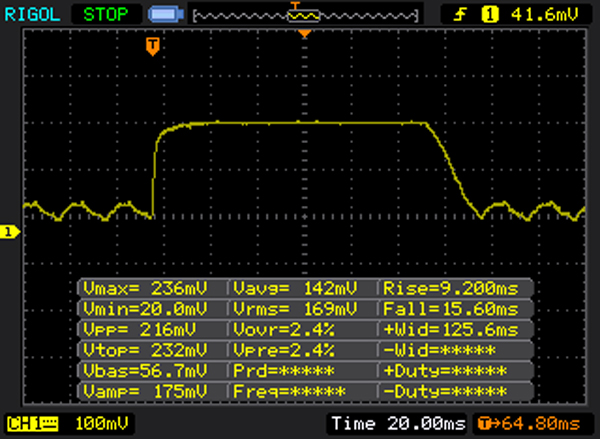 |
| ↘ 15 ms fall | ||
| The screen shows good response rates in our tests, but may be too slow for competitive gamers. In comparison, all tested devices range from 0.1 (minimum) to 240 (maximum) ms. » 48 % of all devices are better. This means that the measured response time is worse than the average of all tested devices (21.5 ms). | ||
| ↔ Response Time 50% Grey to 80% Grey | ||
| 40 ms ... rise ↗ and fall ↘ combined | ↗ 19 ms rise | 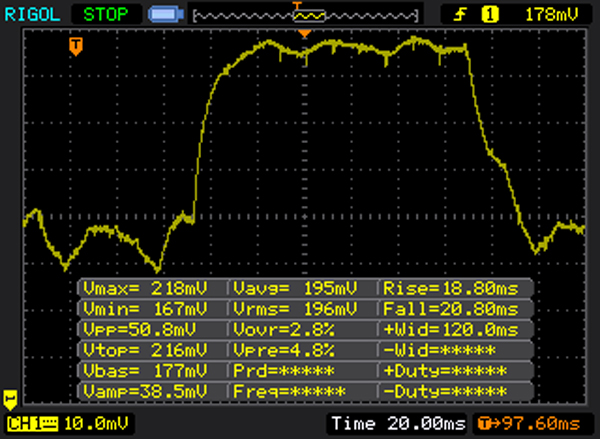 |
| ↘ 21 ms fall | ||
| The screen shows slow response rates in our tests and will be unsatisfactory for gamers. In comparison, all tested devices range from 0.2 (minimum) to 636 (maximum) ms. » 56 % of all devices are better. This means that the measured response time is worse than the average of all tested devices (33.7 ms). | ||
Screen Flickering / PWM (Pulse-Width Modulation)
| Screen flickering / PWM detected | 50 Hz | ≤ 90 % brightness setting | 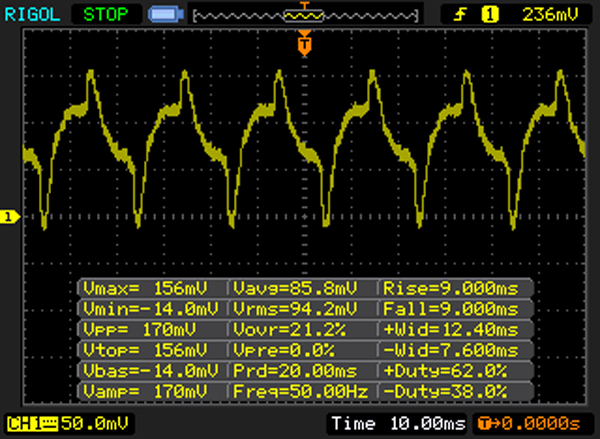 |
The display backlight flickers at 50 Hz (worst case, e.g., utilizing PWM) Flickering detected at a brightness setting of 90 % and below. There should be no flickering or PWM above this brightness setting. The frequency of 50 Hz is very low, so the flickering may cause eyestrain and headaches after extended use. In comparison: 53 % of all tested devices do not use PWM to dim the display. If PWM was detected, an average of 17915 (minimum: 5 - maximum: 3846000) Hz was measured. | |||

| Cinebench R15 | |
| CPU Single 64Bit | |
| Asus N552VX-FY103T | |
| Acer Aspire F15 F5-573G-53V1 | |
| HP Pavilion 14-al003ng | |
| Lenovo Ideapad 510-15ISK | |
| CPU Multi 64Bit | |
| Asus N552VX-FY103T | |
| Acer Aspire F15 F5-573G-53V1 | |
| Lenovo Ideapad 510-15ISK | |
| HP Pavilion 14-al003ng | |
| PCMark 8 | |
| Home Score Accelerated v2 | |
| Asus N552VX-FY103T | |
| Acer Aspire F15 F5-573G-53V1 | |
| Lenovo Ideapad 510-15ISK | |
| HP Pavilion 14-al003ng | |
| Work Score Accelerated v2 | |
| Asus N552VX-FY103T | |
| Acer Aspire F15 F5-573G-53V1 | |
| Lenovo Ideapad 510-15ISK | |
| PCMark 8 Home Score Accelerated v2 | 3294 points | |
| PCMark 8 Work Score Accelerated v2 | 3907 points | |
Help | ||
| Lenovo Ideapad 510-15ISK Seagate Momentus SpinPoint M8 ST1000LM024 HN-M101MBB | Acer Aspire F15 F5-573G-53V1 WDC Scorpio Blue WD10JPVX-22JC3T0 | Asus N552VX-FY103T Toshiba MQ02ABD100H | HP Pavilion 14-al003ng SanDisk Z400s 256 GB M.2 2280 | |
|---|---|---|---|---|
| CrystalDiskMark 3.0 | 42% | 12563% | ||
| Read Seq | 84.5 | 108.1 28% | 469.3 455% | |
| Write Seq | 69.9 | 105.6 51% | 309.1 342% | |
| Read 512 | 28.87 | 35.32 22% | ||
| Write 512 | 28.08 | 46.13 64% | ||
| Read 4k | 0.326 | 0.413 27% | 14 4194% | |
| Write 4k | 0.595 | 0.9 51% | 73.9 12320% | |
| Read 4k QD32 | 0.602 | 0.895 49% | 149.5 24734% | |
| Write 4k QD32 | 0.612 | 0.884 44% | 204.6 33331% |

| 3DMark 11 - 1280x720 Performance GPU | |
| Asus N552VX-FY103T | |
| Acer Aspire F15 F5-573G-53V1 | |
| HP Pavilion 14-al003ng | |
| Lenovo Ideapad 510-15ISK | |
| 3DMark | |
| 1280x720 Cloud Gate Standard Graphics | |
| Asus N552VX-FY103T | |
| Acer Aspire F15 F5-573G-53V1 | |
| Lenovo Ideapad 510-15ISK | |
| 1920x1080 Fire Strike Graphics | |
| Acer Aspire F15 F5-573G-53V1 | |
| Asus N552VX-FY103T | |
| Lenovo Ideapad 510-15ISK | |
| 3DMark 11 Performance | 2424 points | |
| 3DMark Cloud Gate Standard Score | 5765 points | |
| 3DMark Fire Strike Score | 1381 points | |
Help | ||
| low | med. | high | ultra | |
| BioShock Infinite (2013) | 85.2 | 45 | 39.3 | 13.6 |
| The Witcher 3 (2015) | 30.1 | 17.6 | ||
| Rise of the Tomb Raider (2016) | 30.8 | 18.1 |
Noise Level
| Idle |
| 33.6 / 33.6 / 33.9 dB(A) |
| Load |
| 37.5 / 38.3 dB(A) |
 | ||
30 dB silent 40 dB(A) audible 50 dB(A) loud |
||
min: | ||
(+) The maximum temperature on the upper side is 37.2 °C / 99 F, compared to the average of 36.9 °C / 98 F, ranging from 21.1 to 71 °C for the class Multimedia.
(+) The bottom heats up to a maximum of 39 °C / 102 F, compared to the average of 39.1 °C / 102 F
(+) In idle usage, the average temperature for the upper side is 25.6 °C / 78 F, compared to the device average of 31.2 °C / 88 F.
(+) The palmrests and touchpad are reaching skin temperature as a maximum (34.1 °C / 93.4 F) and are therefore not hot.
(-) The average temperature of the palmrest area of similar devices was 28.8 °C / 83.8 F (-5.3 °C / -9.6 F).
Lenovo Ideapad 510-15ISK audio analysis
(-) | not very loud speakers (70 dB)
Bass 100 - 315 Hz
(-) | nearly no bass - on average 23.7% lower than median
(±) | linearity of bass is average (11.1% delta to prev. frequency)
Mids 400 - 2000 Hz
(+) | balanced mids - only 1.9% away from median
(+) | mids are linear (6.5% delta to prev. frequency)
Highs 2 - 16 kHz
(+) | balanced highs - only 4.6% away from median
(+) | highs are linear (4.1% delta to prev. frequency)
Overall 100 - 16.000 Hz
(±) | linearity of overall sound is average (21.2% difference to median)
Compared to same class
» 69% of all tested devices in this class were better, 8% similar, 23% worse
» The best had a delta of 5%, average was 18%, worst was 45%
Compared to all devices tested
» 54% of all tested devices were better, 7% similar, 39% worse
» The best had a delta of 4%, average was 25%, worst was 134%
Acer Aspire F15 F5-573G-53V1 audio analysis
(±) | speaker loudness is average but good (74 dB)
Analysis not possible as minimum curve is missing or too high
Asus N552VX-FY103T audio analysis
(-) | not very loud speakers (64 dB)
Analysis not possible as minimum curve is missing or too high
HP Pavilion 14-al003ng audio analysis
(+) | speakers can play relatively loud (84.6 dB)
Bass 100 - 315 Hz
(-) | nearly no bass - on average 24.4% lower than median
(±) | linearity of bass is average (12.4% delta to prev. frequency)
Mids 400 - 2000 Hz
(+) | balanced mids - only 2.9% away from median
(+) | mids are linear (4.9% delta to prev. frequency)
Highs 2 - 16 kHz
(+) | balanced highs - only 4% away from median
(±) | linearity of highs is average (7.7% delta to prev. frequency)
Overall 100 - 16.000 Hz
(±) | linearity of overall sound is average (22.5% difference to median)
Compared to same class
» 77% of all tested devices in this class were better, 5% similar, 18% worse
» The best had a delta of 5%, average was 18%, worst was 45%
Compared to all devices tested
» 61% of all tested devices were better, 6% similar, 33% worse
» The best had a delta of 4%, average was 25%, worst was 134%
| Off / Standby | |
| Idle | |
| Load |
|
| Lenovo Ideapad 510-15ISK 6200U, GeForce 940MX, Seagate Momentus SpinPoint M8 ST1000LM024 HN-M101MBB, IPS, 1920x1080, 15.60 | Acer Aspire F15 F5-573G-53V1 6200U, GeForce GTX 950M, WDC Scorpio Blue WD10JPVX-22JC3T0, TN WLED, 1920x1080, 15.60 | Asus N552VX-FY103T 6700HQ, GeForce GTX 950M, Toshiba MQ02ABD100H, AH-IPS, 1920x1080, 15.60 | HP Pavilion 14-al003ng 6200U, GeForce 940MX, SanDisk Z400s 256 GB M.2 2280, LED IPS, 1920x1080, 14.00 | |
|---|---|---|---|---|
| Power Consumption | -22% | -39% | 19% | |
| Idle Minimum * | 7.7 | 8.3 -8% | 7 9% | 4 48% |
| Idle Average * | 11.7 | 12.1 -3% | 10.9 7% | 6.4 45% |
| Idle Maximum * | 13.6 | 15.4 -13% | 12.9 5% | 7 49% |
| Load Average * | 48.3 | 56 -16% | 72 -49% | 45.5 6% |
| Load Maximum * | 41 | 70 -71% | 109 -166% | 62.2 -52% |
* ... smaller is better
| Lenovo Ideapad 510-15ISK 6200U, GeForce 940MX, 30 Wh | Acer Aspire F15 F5-573G-53V1 6200U, GeForce GTX 950M, 62 Wh | Asus N552VX-FY103T 6700HQ, GeForce GTX 950M, 44 Wh | HP Pavilion 14-al003ng 6200U, GeForce 940MX, 41 Wh | |
|---|---|---|---|---|
| Battery Runtime | 77% | -2% | 46% | |
| Reader / Idle | 443 | 667 51% | 357 -19% | |
| WiFi v1.3 | 225 | 386 72% | 268 19% | 329 46% |
| Load | 73 | 152 108% | 68 -7% | |
| H.264 | 335 |
Pros
Cons
联想IdeaPad 510-15ISK是一款引人注目的设备。
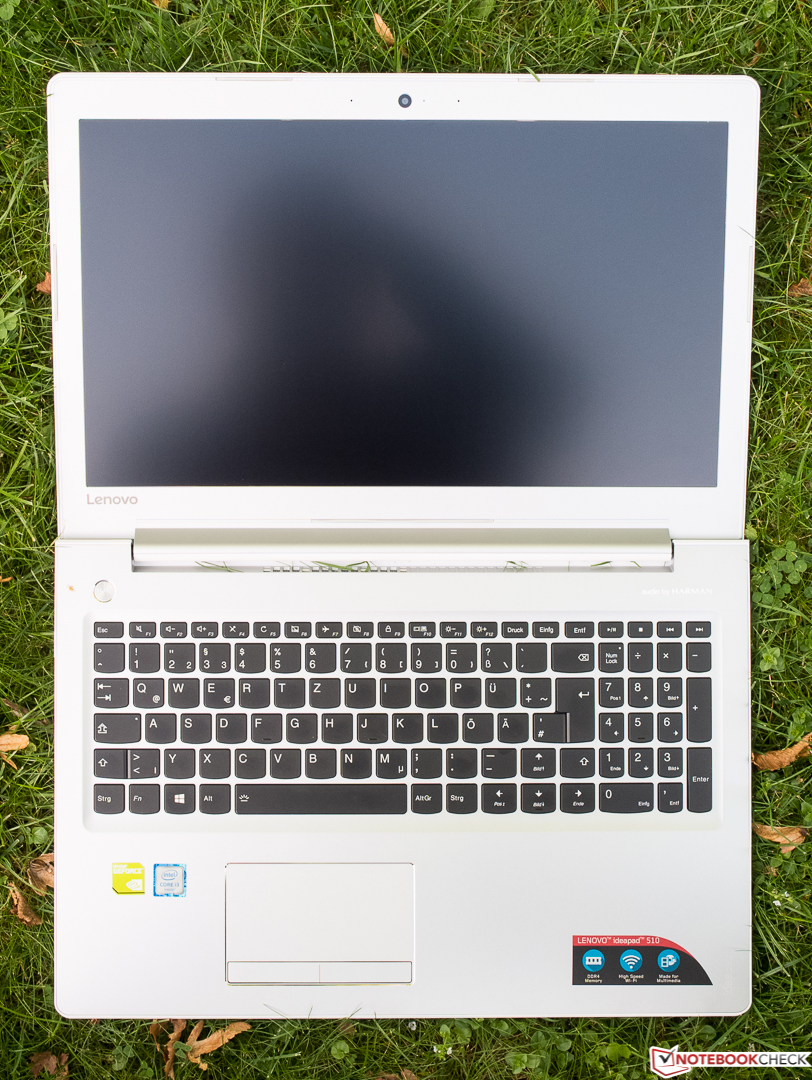
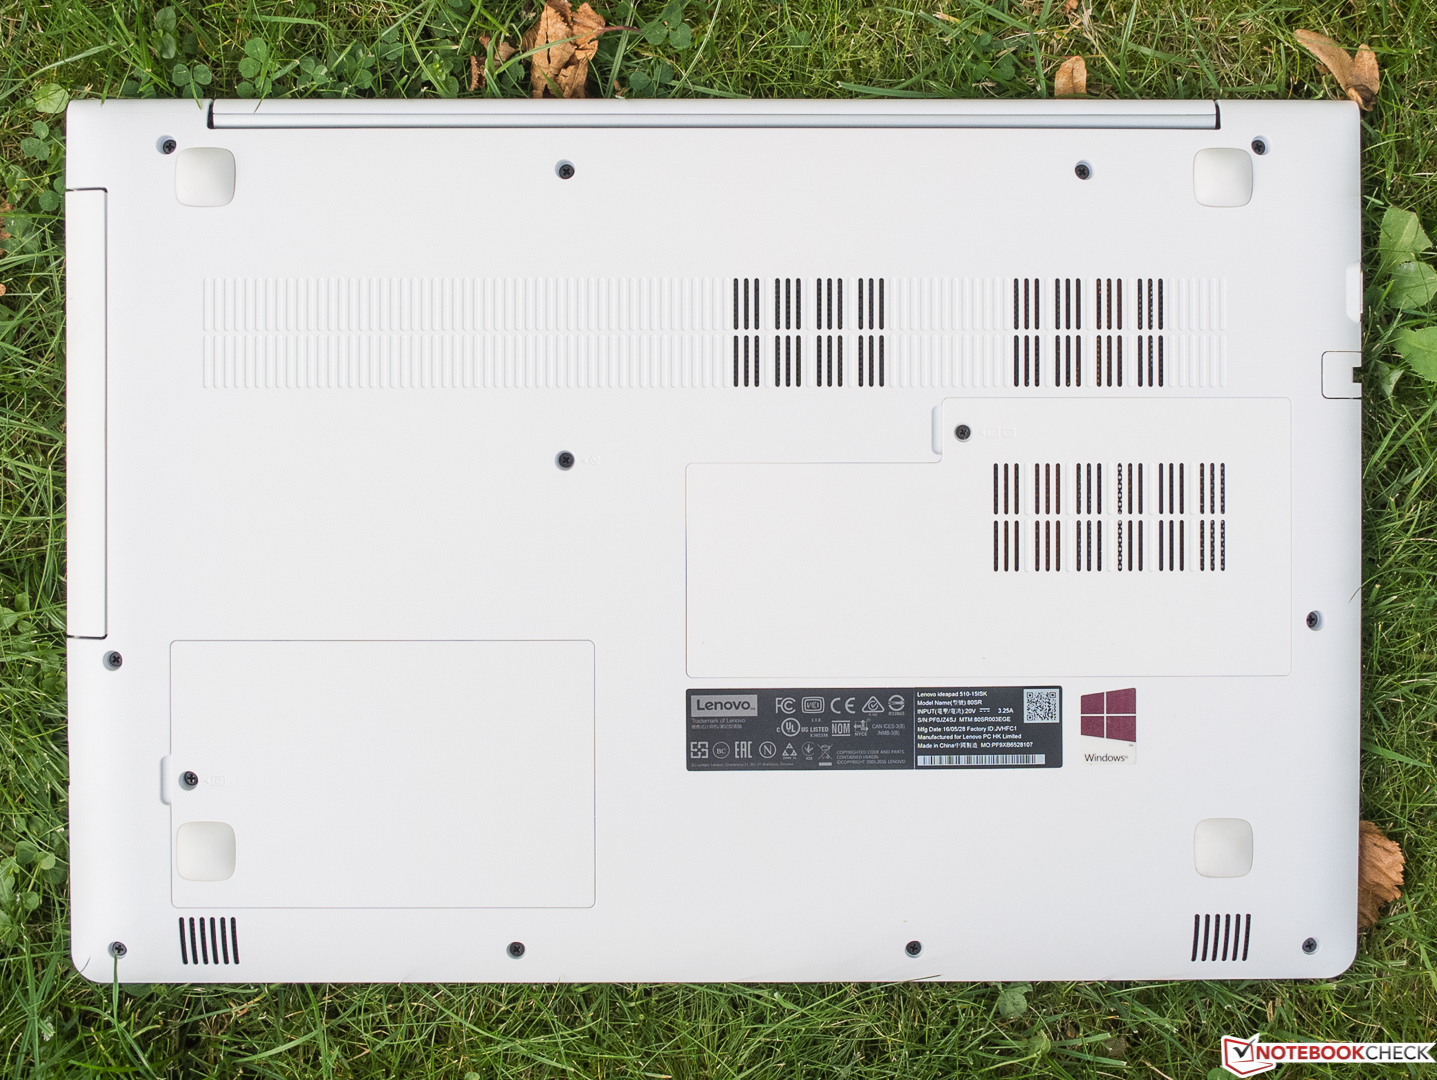
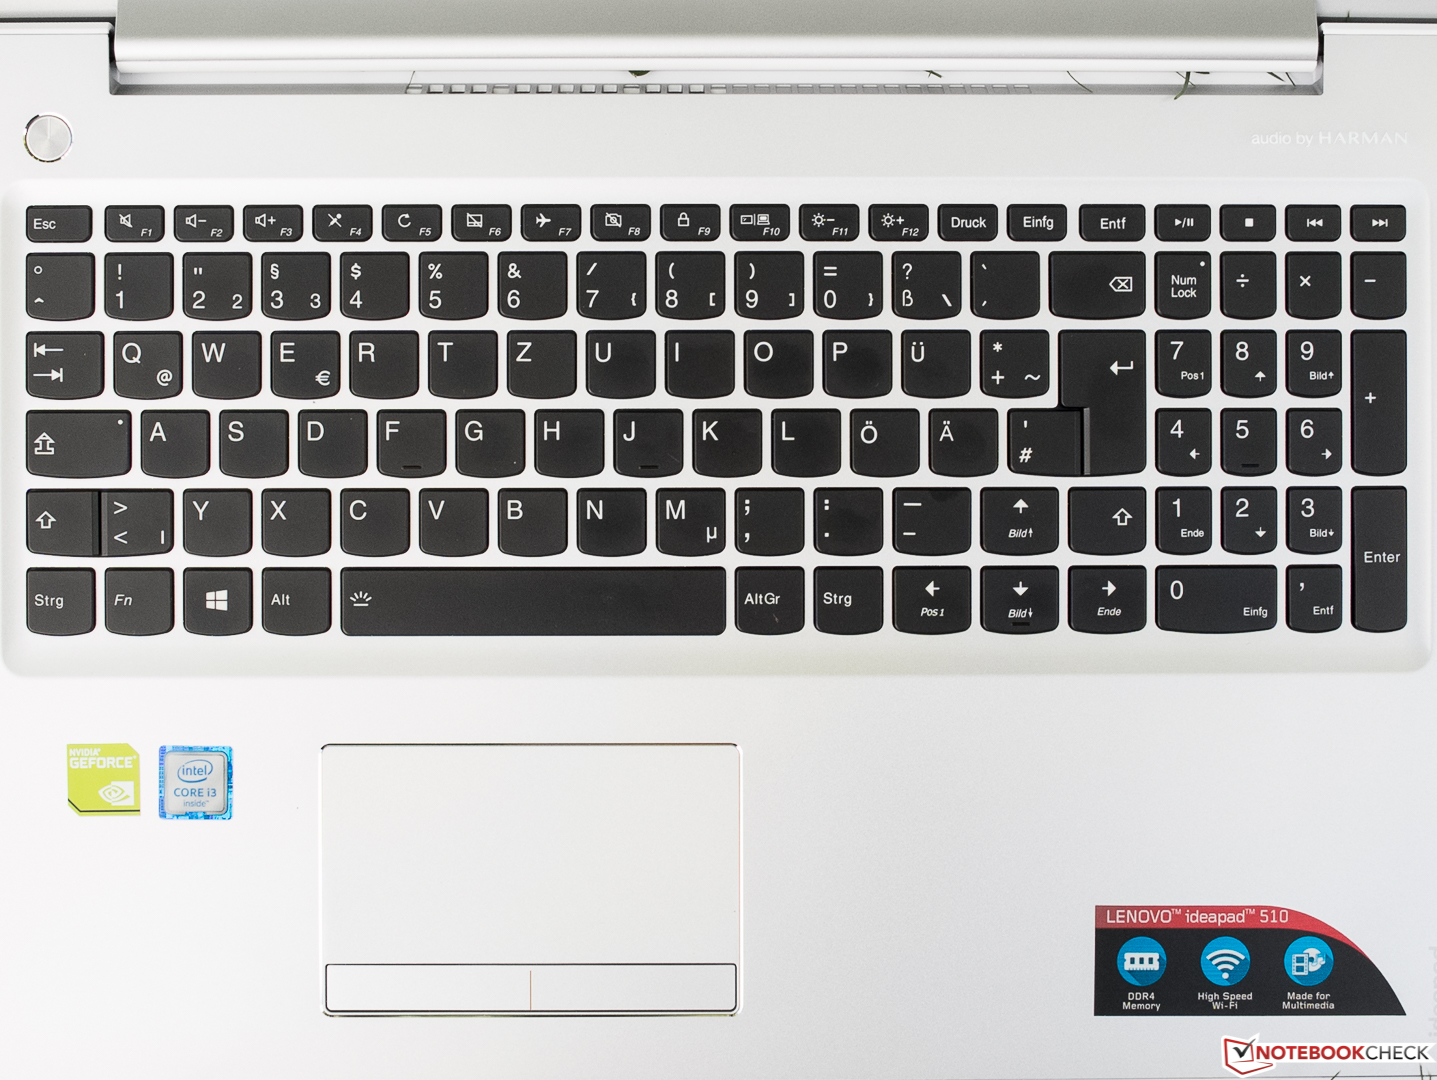
选择它的用户可以得到一台做工精良,轻盈纤薄的多媒体笔记本电脑,它结合了不错的输入设备,一块IPS屏幕和GeForce 940MX独立显卡,售价不足800欧元(约5926人民币)。尽管这个机型没有搭配固态硬盘,但它没有任何技术上的弱点。
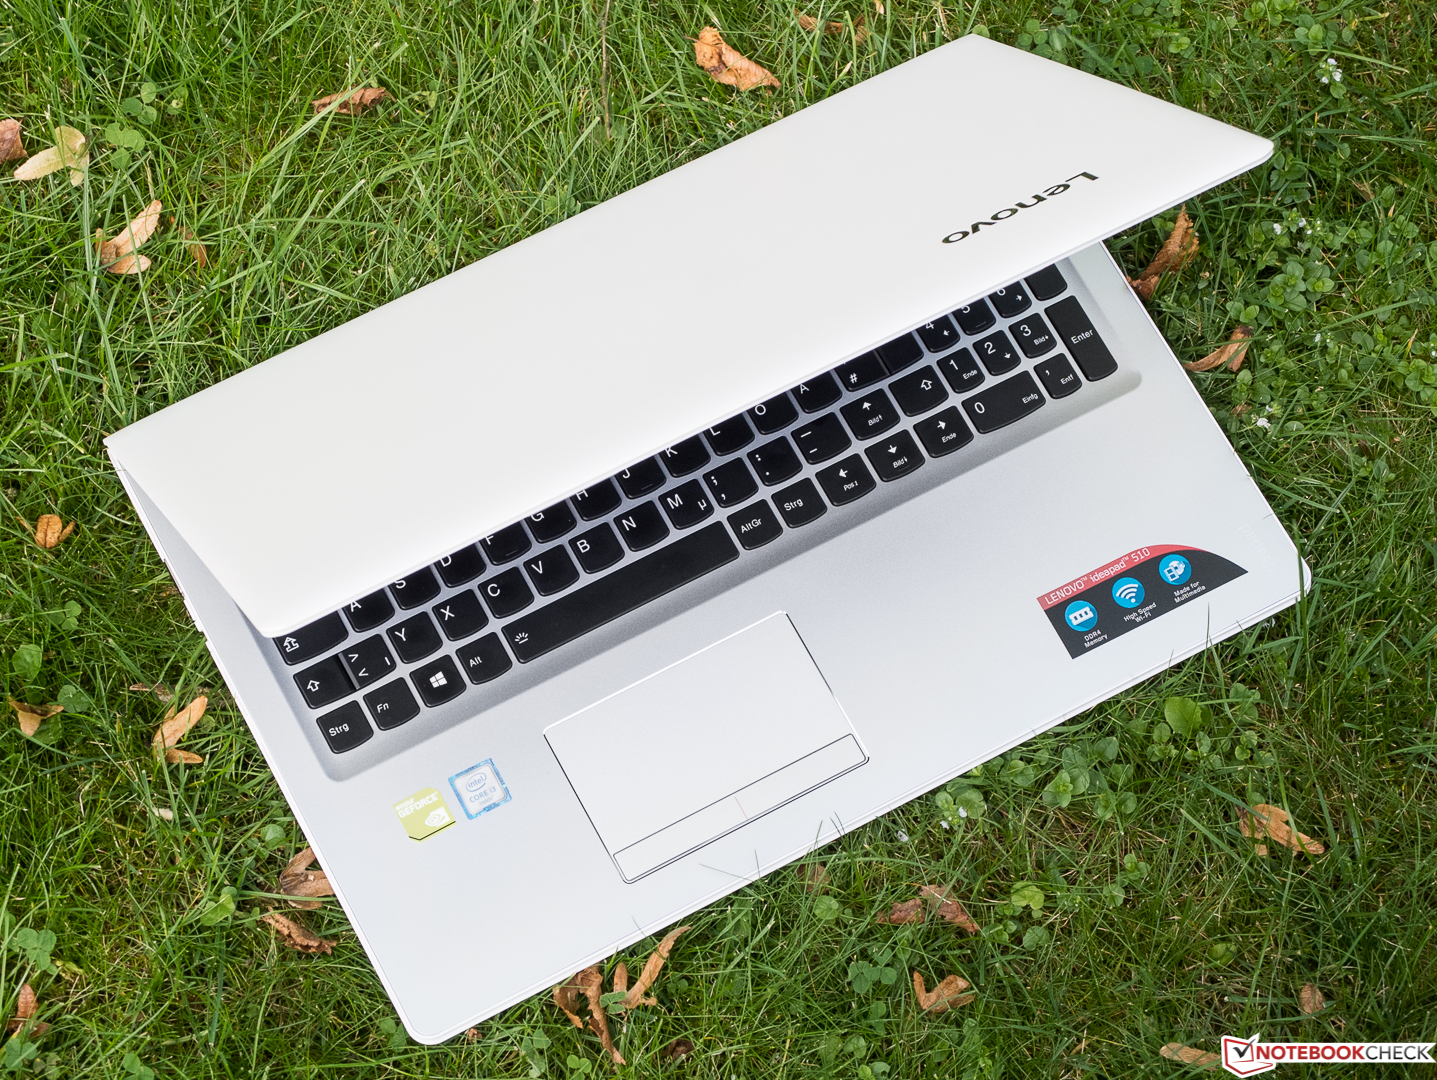
不过,它在很多方面表现平平。至少它高对比度IPS屏幕的色彩准确度还有改进的空间,同时一般的性能和不算出色的输入设备也是如此。再加上缺少固态硬盘让它的系统运行更加迟缓。它的电池续航让不错的便携型打了折扣,而音响系统也很难达到多媒体设备的一般水平。
不过,它提供了维护底盖和TPM模组,系统运行安静而清凉让它对处理器加速的效率很高,这都为它赢得了加分。我们认为如果考虑到性价比的话,如果它的售价可以降低100欧元(约740人民币)的话将会十分值得考虑选购。从我们的经验来看它在不久之后就会开始降价。
注:本文是基于完整评测的缩减版本,阅读完整的英文评测,请点击这里。
Lenovo Ideapad 510-15ISK
-
09/29/2016 v5.1(old)
Sven Kloevekorn