 Deutsch
 English
 Español
 Français
 Italiano
 Nederlands
 Polski
 Português
 Русский
 Türkçe
 Svenska
 Chinese
 Magyar
微星 GT72VR 6RD Dominator Pro 笔记本电脑简短评测


| SD Card Reader | |
| average JPG Copy Test (av. of 3 runs) | |
| MSI GT72VR 6RD-063US | |
| Acer Predator 17 G9-793-77LG | |
| MSI GS73VR 6RF | |
| maximum AS SSD Seq Read Test (1GB) | |
| MSI GT72VR 6RD-063US | |
| Acer Predator 17 G9-793-77LG | |
| MSI GS73VR 6RF | |
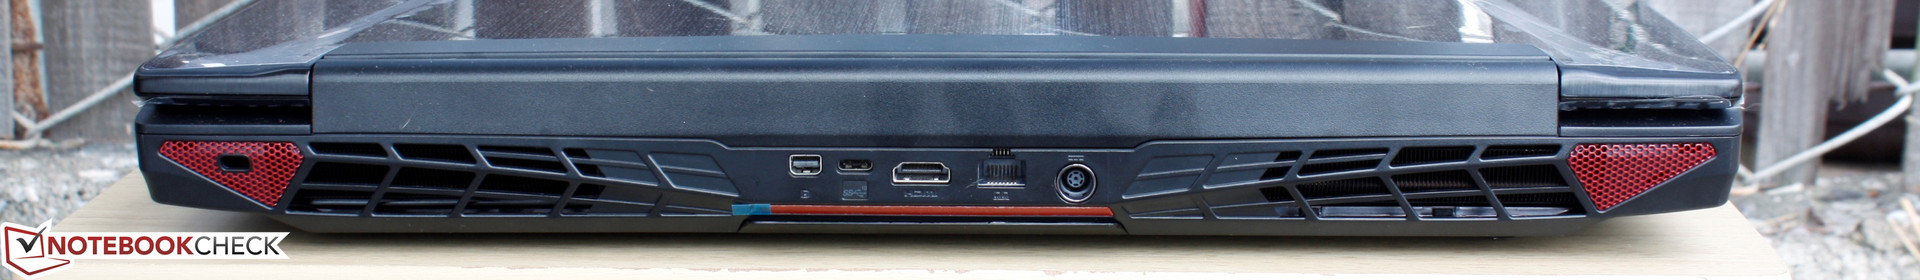
| Networking | |
| iperf Server (receive) TCP 1 m 512KB | |
| MSI GS43VR 6RE-006US | |
| MSI GT72VR 6RD-063US | |
| iperf Client (transmit) TCP 1 m 512KB | |
| MSI GT72VR 6RD-063US | |
| MSI GS43VR 6RE-006US | |
| |||||||||||||||||||||||||
Brightness Distribution: 91 %
Center on Battery: 351.7 cd/m²
Contrast: 951:1 (Black: 0.37 cd/m²)
ΔE Color 3.71 | 0.5-29.43 Ø5
ΔE Greyscale 2.46 | 0.57-98 Ø5.3
86.1% sRGB (Argyll 1.6.3 3D)
56.6% AdobeRGB 1998 (Argyll 1.6.3 3D)
63% AdobeRGB 1998 (Argyll 2.2.0 3D)
86.2% sRGB (Argyll 2.2.0 3D)
67.6% Display P3 (Argyll 2.2.0 3D)
Gamma: 2.29
| MSI GT72VR 6RD-063US LG Philips LGD046E, IPS, 17.30, 1920x1080 | Acer Predator 17 G9-793-77LG AU Optronics B173ZAN01.0 (AUO109B), IPS, 17.30, 3840x2160 | MSI GT73VR-6RE16SR451 N173HHE-G32 (CMN1747), TN, 17.30, 1920x1080 | Asus G752VS-XB78K LG Philips LP173WF4-SPF3 (LGD04E8), IPS, 17.30, 1920x1080 | Asus G701VO-CS74K IPS, 17.30, 1920x1080 | |
|---|---|---|---|---|---|
| Display | 34% | 29% | -1% | 2% | |
| Display P3 Coverage | 67.6 | 86.9 29% | 91.2 35% | 66.9 -1% | 68.8 2% |
| sRGB Coverage | 86.2 | 100 16% | 100 16% | 85.2 -1% | 87.7 2% |
| AdobeRGB 1998 Coverage | 63 | 99.4 58% | 84.9 35% | 62.3 -1% | 64.1 2% |
| Response Times | 1% | 49% | 4% | 8% | |
| Response Time Grey 50% / Grey 80% * | 34.4 ? | 37 ? -8% | 26 ? 24% | 38 ? -10% | 29.2 ? 15% |
| Response Time Black / White * | 26.4 ? | 24 ? 9% | 6.8 ? 74% | 22 ? 17% | 26.4 ? -0% |
| PWM Frequency | |||||
| Screen | 7% | -43% | 0% | -6% | |
| Brightness middle | 351.7 | 336 -4% | 314 -11% | 328 -7% | 368.1 5% |
| Brightness | 339 | 320 -6% | 294 -13% | 317 -6% | 349 3% |
| Brightness Distribution | 91 | 88 -3% | 89 -2% | 88 -3% | 86 -5% |
| Black Level * | 0.37 | 0.25 32% | 0.23 38% | 0.3 19% | 0.365 1% |
| Contrast | 951 | 1344 41% | 1365 44% | 1093 15% | 1008 6% |
| Colorchecker dE 2000 * | 3.71 | 3.61 3% | 9.74 -163% | 3.74 -1% | 4.16 -12% |
| Colorchecker dE 2000 max. * | 8.48 | 6.02 29% | 15.71 -85% | 8.97 -6% | 8.7 -3% |
| Greyscale dE 2000 * | 2.46 | 4.78 -94% | 9.58 -289% | 2.67 -9% | 3.86 -57% |
| Gamma | 2.29 96% | 2.32 95% | 2.5 88% | 2.41 91% | 2.19 100% |
| CCT | 6849 95% | 6185 105% | 11854 55% | 6861 95% | 6892 94% |
| Color Space (Percent of AdobeRGB 1998) | 56.6 | 88 55% | 76 34% | 56 -1% | 57.6 2% |
| Color Space (Percent of sRGB) | 86.1 | 100 16% | 100 16% | 85 -1% | 87.6 2% |
| Total Average (Program / Settings) | 14% /
12% | 12% /
-16% | 1% /
0% | 1% /
-2% |
* ... smaller is better
Display Response Times
| ↔ Response Time Black to White | ||
|---|---|---|
| 26.4 ms ... rise ↗ and fall ↘ combined | ↗ 4.4 ms rise | 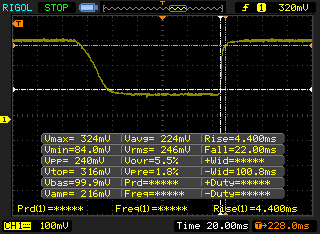 |
| ↘ 22 ms fall | ||
| The screen shows relatively slow response rates in our tests and may be too slow for gamers. In comparison, all tested devices range from 0.1 (minimum) to 240 (maximum) ms. » 61 % of all devices are better. This means that the measured response time is worse than the average of all tested devices (21.5 ms). | ||
| ↔ Response Time 50% Grey to 80% Grey | ||
| 34.4 ms ... rise ↗ and fall ↘ combined | ↗ 14.8 ms rise | 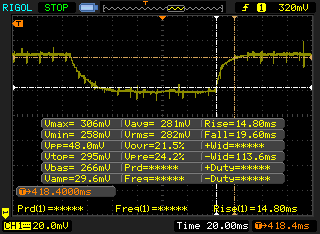 |
| ↘ 19.6 ms fall | ||
| The screen shows slow response rates in our tests and will be unsatisfactory for gamers. In comparison, all tested devices range from 0.2 (minimum) to 636 (maximum) ms. » 42 % of all devices are better. This means that the measured response time is similar to the average of all tested devices (33.7 ms). | ||
Screen Flickering / PWM (Pulse-Width Modulation)
| Screen flickering / PWM not detected | 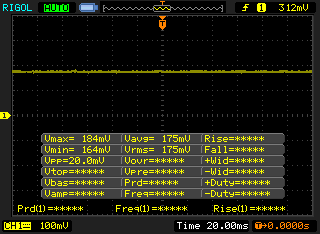 | ||
In comparison: 53 % of all tested devices do not use PWM to dim the display. If PWM was detected, an average of 17915 (minimum: 5 - maximum: 3846000) Hz was measured. | |||
| Cinebench R15 | |
| CPU Single 64Bit | |
| DogHouse Systems Mobius SS | |
| Asus G701VO-CS74K | |
| MSI GE62 2QC-468XPL | |
| MSI GT72VR 6RD-063US | |
| Lenovo IdeaPad Y50 | |
| CPU Multi 64Bit | |
| DogHouse Systems Mobius SS | |
| MSI GE62 2QC-468XPL | |
| Asus G701VO-CS74K | |
| MSI GT72VR 6RD-063US | |
| Lenovo IdeaPad Y50 | |
| Cinebench R11.5 | |
| CPU Single 64Bit | |
| DogHouse Systems Mobius SS | |
| Asus G701VO-CS74K | |
| MSI GE62 2QC-468XPL | |
| MSI GT72VR 6RD-063US | |
| Lenovo IdeaPad Y50 | |
| CPU Multi 64Bit | |
| DogHouse Systems Mobius SS | |
| MSI GE62 2QC-468XPL | |
| Asus G701VO-CS74K | |
| MSI GT72VR 6RD-063US | |
| Lenovo IdeaPad Y50 | |
| Cinebench R10 | |
| Rendering Multiple CPUs 32Bit | |
| DogHouse Systems Mobius SS | |
| MSI GE62 2QC-468XPL | |
| Asus G701VO-CS74K | |
| MSI GT72VR 6RD-063US | |
| Lenovo IdeaPad Y50 | |
| Rendering Single 32Bit | |
| DogHouse Systems Mobius SS | |
| Asus G701VO-CS74K | |
| MSI GE62 2QC-468XPL | |
| MSI GT72VR 6RD-063US | |
| Lenovo IdeaPad Y50 | |
| wPrime 2.10 - 1024m | |
| Lenovo IdeaPad Y50 | |
| MSI GT72VR 6RD-063US | |
| Asus G701VO-CS74K | |
| MSI GE62 2QC-468XPL | |
| DogHouse Systems Mobius SS | |
| Super Pi Mod 1.5 XS 32M - 32M | |
| MSI GT72VR 6RD-063US | |
| MSI GE62 2QC-468XPL | |
| Lenovo IdeaPad Y50 | |
| Asus G701VO-CS74K | |
| DogHouse Systems Mobius SS | |
* ... smaller is better
| PCMark 8 | |
| Home Score Accelerated v2 | |
| Asus G752VS-XB78K | |
| MSI GT73VR-6RE16SR451 | |
| MSI GT72VR 6RD-063US | |
| Acer Predator 17 G9-793-77LG | |
| Work Score Accelerated v2 | |
| Asus G752VS-XB78K | |
| MSI GT73VR-6RE16SR451 | |
| MSI GT72VR 6RD-063US | |
| Creative Score Accelerated v2 | |
| Asus G752VS-XB78K | |
| MSI GT72VR 6RD-063US | |
| Acer Predator 17 G9-793-77LG | |
| PCMark 8 Home Score Accelerated v2 | 4551 points | |
| PCMark 8 Creative Score Accelerated v2 | 6871 points | |
| PCMark 8 Work Score Accelerated v2 | 4906 points | |
Help | ||
| MSI GT72VR 6RD-063US SanDisk SD8SN8U1T001122 | MSI GT72VR 6RE-015US SanDisk SD8SNAT256G1122 | MSI GT73VR-6RE16SR451 2x Samsung SM951 MZVPV256HDGL (RAID 0) | Asus G752VS-XB78K Toshiba NVMe THNSN5512GPU7 | Asus G701VO-CS74K 2x Samsung SM951 MZVPV512HDGL (RAID 0) | |
|---|---|---|---|---|---|
| CrystalDiskMark 3.0 | -4% | 319% | 194% | 283% | |
| Read Seq | 469.8 | 529 13% | 3285 599% | 1718 266% | 3067 553% |
| Write Seq | 435.2 | 338.5 -22% | 2560 488% | 1305 200% | 2434 459% |
| Read 512 | 312.6 | 288.9 -8% | 1775 468% | 1250 300% | 1582 406% |
| Write 512 | 367.3 | 319.2 -13% | 2327 534% | 1438 292% | 2255 514% |
| Read 4k | 28.21 | 23.1 -18% | 52.2 85% | 44.42 57% | 47.25 67% |
| Write 4k | 59 | 99.4 68% | 153.1 159% | 154.4 162% | 110.7 88% |
| Read 4k QD32 | 339.7 | 147.5 -57% | 627 85% | 744 119% | 584 72% |
| Write 4k QD32 | 225.6 | 236.9 5% | 527 134% | 578 156% | 463.3 105% |

| 3DMark | |
| 1920x1080 Fire Strike Graphics | |
| MSI GT73VR-6RE16SR451 | |
| Aorus X7 Pro v5 | |
| MSI GT72VR 6RD-063US | |
| Asus Strix GL502VY-DS71 | |
| Asus Strix GL502VT-DS74 | |
| HP Pavilion 17 FHD V3A33AV | |
| Fire Strike Extreme Graphics | |
| MSI GT72VR 6RD-063US | |
| Asus Strix GL502VY-DS71 | |
| Asus Strix GL502VT-DS74 | |
| HP Pavilion 17 FHD V3A33AV | |
| 3840x2160 Fire Strike Ultra Graphics | |
| MSI GT73VR-6RE16SR451 | |
| MSI GT72VR 6RD-063US | |
| Asus Strix GL502VY-DS71 | |
| HP Pavilion 17 FHD V3A33AV | |
| 3DMark 11 Performance | 11371 points | |
| 3DMark Ice Storm Standard Score | 118421 points | |
| 3DMark Cloud Gate Standard Score | 24051 points | |
| 3DMark Fire Strike Score | 9878 points | |
| 3DMark Fire Strike Extreme Score | 5206 points | |
Help | ||
| low | med. | high | ultra | |
| Guild Wars 2 (2012) | 52.9 | |||
| BioShock Infinite (2013) | 105.5 | |||
| Metro: Last Light (2013) | 82.1 | |||
| Thief (2014) | 72.4 | |||
| Batman: Arkham Knight (2015) | 85 | 62 | ||
| Metal Gear Solid V (2015) | 60 | |||
| Fallout 4 (2015) | 71.6 | |||
| Rise of the Tomb Raider (2016) | 63.5 | |||
| Doom (2016) | 96.5 | |||
| Overwatch (2016) | 106.3 |
Noise Level
| Idle |
| 30.8 / 30.8 / 32 dB(A) |
| Load |
| 37.2 / 51.5 dB(A) |
 | ||
30 dB silent 40 dB(A) audible 50 dB(A) loud |
||
min: | ||
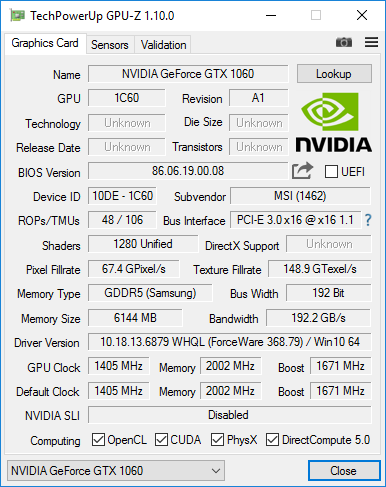
| MSI GT72VR 6RD-063US GeForce GTX 1060 Mobile, 6700HQ, SanDisk SD8SN8U1T001122 | MSI GT72VR 6RE-015US GeForce GTX 1070 Mobile, 6700HQ, SanDisk SD8SNAT256G1122 | MSI GT73VR-6RE16SR451 GeForce GTX 1070 Mobile, 6820HK, 2x Samsung SM951 MZVPV256HDGL (RAID 0) | Asus G752VS-XB78K GeForce GTX 1070 Mobile, 6820HK, Toshiba NVMe THNSN5512GPU7 | Asus G701VO-CS74K GeForce GTX 980 (Laptop), 6820HK, 2x Samsung SM951 MZVPV512HDGL (RAID 0) | |
|---|---|---|---|---|---|
| Noise | -3% | -2% | -2% | -3% | |
| off / environment * | 28.6 | 28.9 -1% | 30 -5% | 30 -5% | 29.1 -2% |
| Idle Minimum * | 30.8 | 32.4 -5% | 32 -4% | 31 -1% | 29.1 6% |
| Idle Average * | 30.8 | 32.4 -5% | 33 -7% | 32 -4% | 31.9 -4% |
| Idle Maximum * | 32 | 32.4 -1% | 35 -9% | 33 -3% | 31.9 -0% |
| Load Average * | 37.2 | 39.4 -6% | 35 6% | 40 -8% | 46 -24% |
| Load Maximum * | 51.5 | 52 -1% | 49 5% | 47 9% | 47.5 8% |
* ... smaller is better
(+) The maximum temperature on the upper side is 37.4 °C / 99 F, compared to the average of 40.4 °C / 105 F, ranging from 21.2 to 68.8 °C for the class Gaming.
(-) The bottom heats up to a maximum of 54 °C / 129 F, compared to the average of 43.2 °C / 110 F
(+) In idle usage, the average temperature for the upper side is 26.3 °C / 79 F, compared to the device average of 33.8 °C / 93 F.
(+) The palmrests and touchpad are cooler than skin temperature with a maximum of 25.4 °C / 77.7 F and are therefore cool to the touch.
(+) The average temperature of the palmrest area of similar devices was 28.9 °C / 84 F (+3.5 °C / 6.3 F).
MSI GT72VR 6RD-063US audio analysis
(±) | speaker loudness is average but good (72.9 dB)
Bass 100 - 315 Hz
(+) | good bass - only 3.2% away from median
(±) | linearity of bass is average (14% delta to prev. frequency)
Mids 400 - 2000 Hz
(+) | balanced mids - only 3.5% away from median
(±) | linearity of mids is average (9.2% delta to prev. frequency)
Highs 2 - 16 kHz
(+) | balanced highs - only 2.4% away from median
(+) | highs are linear (5.4% delta to prev. frequency)
Overall 100 - 16.000 Hz
(+) | overall sound is linear (14.5% difference to median)
Compared to same class
» 25% of all tested devices in this class were better, 6% similar, 69% worse
» The best had a delta of 6%, average was 18%, worst was 132%
Compared to all devices tested
» 15% of all tested devices were better, 3% similar, 82% worse
» The best had a delta of 4%, average was 25%, worst was 134%
Apple MacBook 12 (Early 2016) 1.1 GHz audio analysis
(+) | speakers can play relatively loud (83.6 dB)
Bass 100 - 315 Hz
(±) | reduced bass - on average 11.3% lower than median
(±) | linearity of bass is average (14.2% delta to prev. frequency)
Mids 400 - 2000 Hz
(+) | balanced mids - only 2.4% away from median
(+) | mids are linear (5.5% delta to prev. frequency)
Highs 2 - 16 kHz
(+) | balanced highs - only 2% away from median
(+) | highs are linear (4.5% delta to prev. frequency)
Overall 100 - 16.000 Hz
(+) | overall sound is linear (10.2% difference to median)
Compared to same class
» 5% of all tested devices in this class were better, 2% similar, 93% worse
» The best had a delta of 5%, average was 19%, worst was 53%
Compared to all devices tested
» 3% of all tested devices were better, 1% similar, 96% worse
» The best had a delta of 4%, average was 25%, worst was 134%
| Off / Standby | |
| Idle | |
| Load |
|
| MSI GT72VR 6RD-063US 6700HQ, GeForce GTX 1060 Mobile, SanDisk SD8SN8U1T001122, IPS, 1920x1080, 17.30 | MSI GT72VR 6RE-015US 6700HQ, GeForce GTX 1070 Mobile, SanDisk SD8SNAT256G1122, IPS, 1920x1080, 17.30 | MSI GT73VR-6RE16SR451 6820HK, GeForce GTX 1070 Mobile, 2x Samsung SM951 MZVPV256HDGL (RAID 0), TN, 1920x1080, 17.30 | Asus G752VS-XB78K 6820HK, GeForce GTX 1070 Mobile, Toshiba NVMe THNSN5512GPU7, IPS, 1920x1080, 17.30 | Asus G701VO-CS74K 6820HK, GeForce GTX 980 (Laptop), 2x Samsung SM951 MZVPV512HDGL (RAID 0), IPS, 1920x1080, 17.30 | |
|---|---|---|---|---|---|
| Power Consumption | -6% | -19% | -4% | -14% | |
| Idle Minimum * | 24.4 | 22.3 9% | 31 -27% | 24 2% | 28.2 -16% |
| Idle Average * | 26.6 | 27.3 -3% | 35 -32% | 31 -17% | 32 -20% |
| Idle Maximum * | 36.4 | 30 18% | 40 -10% | 36 1% | 32.6 10% |
| Load Average * | 117 | 152.2 -30% | 106 9% | 94 20% | 162.2 -39% |
| Load Maximum * | 163.6 | 204.2 -25% | 218 -33% | 204 -25% | 173.5 -6% |
* ... smaller is better
| MSI GT72VR 6RD-063US 6700HQ, GeForce GTX 1060 Mobile, 83 Wh | MSI GT72VR 6RE-015US 6700HQ, GeForce GTX 1070 Mobile, 83 Wh | MSI GT73VR-6RE16SR451 6820HK, GeForce GTX 1070 Mobile, 75.2 Wh | Asus G752VS-XB78K 6820HK, GeForce GTX 1070 Mobile, 90 Wh | Asus G701VO-CS74K 6820HK, GeForce GTX 980 (Laptop), 93 Wh | |
|---|---|---|---|---|---|
| Battery Runtime | -2% | -13% | -6% | -13% | |
| Reader / Idle | 323 | 322 0% | 290 -10% | 311 -4% | 242 -25% |
| WiFi v1.3 | 221 | 224 1% | 206 -7% | 210 -5% | 202 -9% |
| Load | 93 | 86 -8% | 72 -23% | 84 -10% | 89 -4% |
Pros
Cons

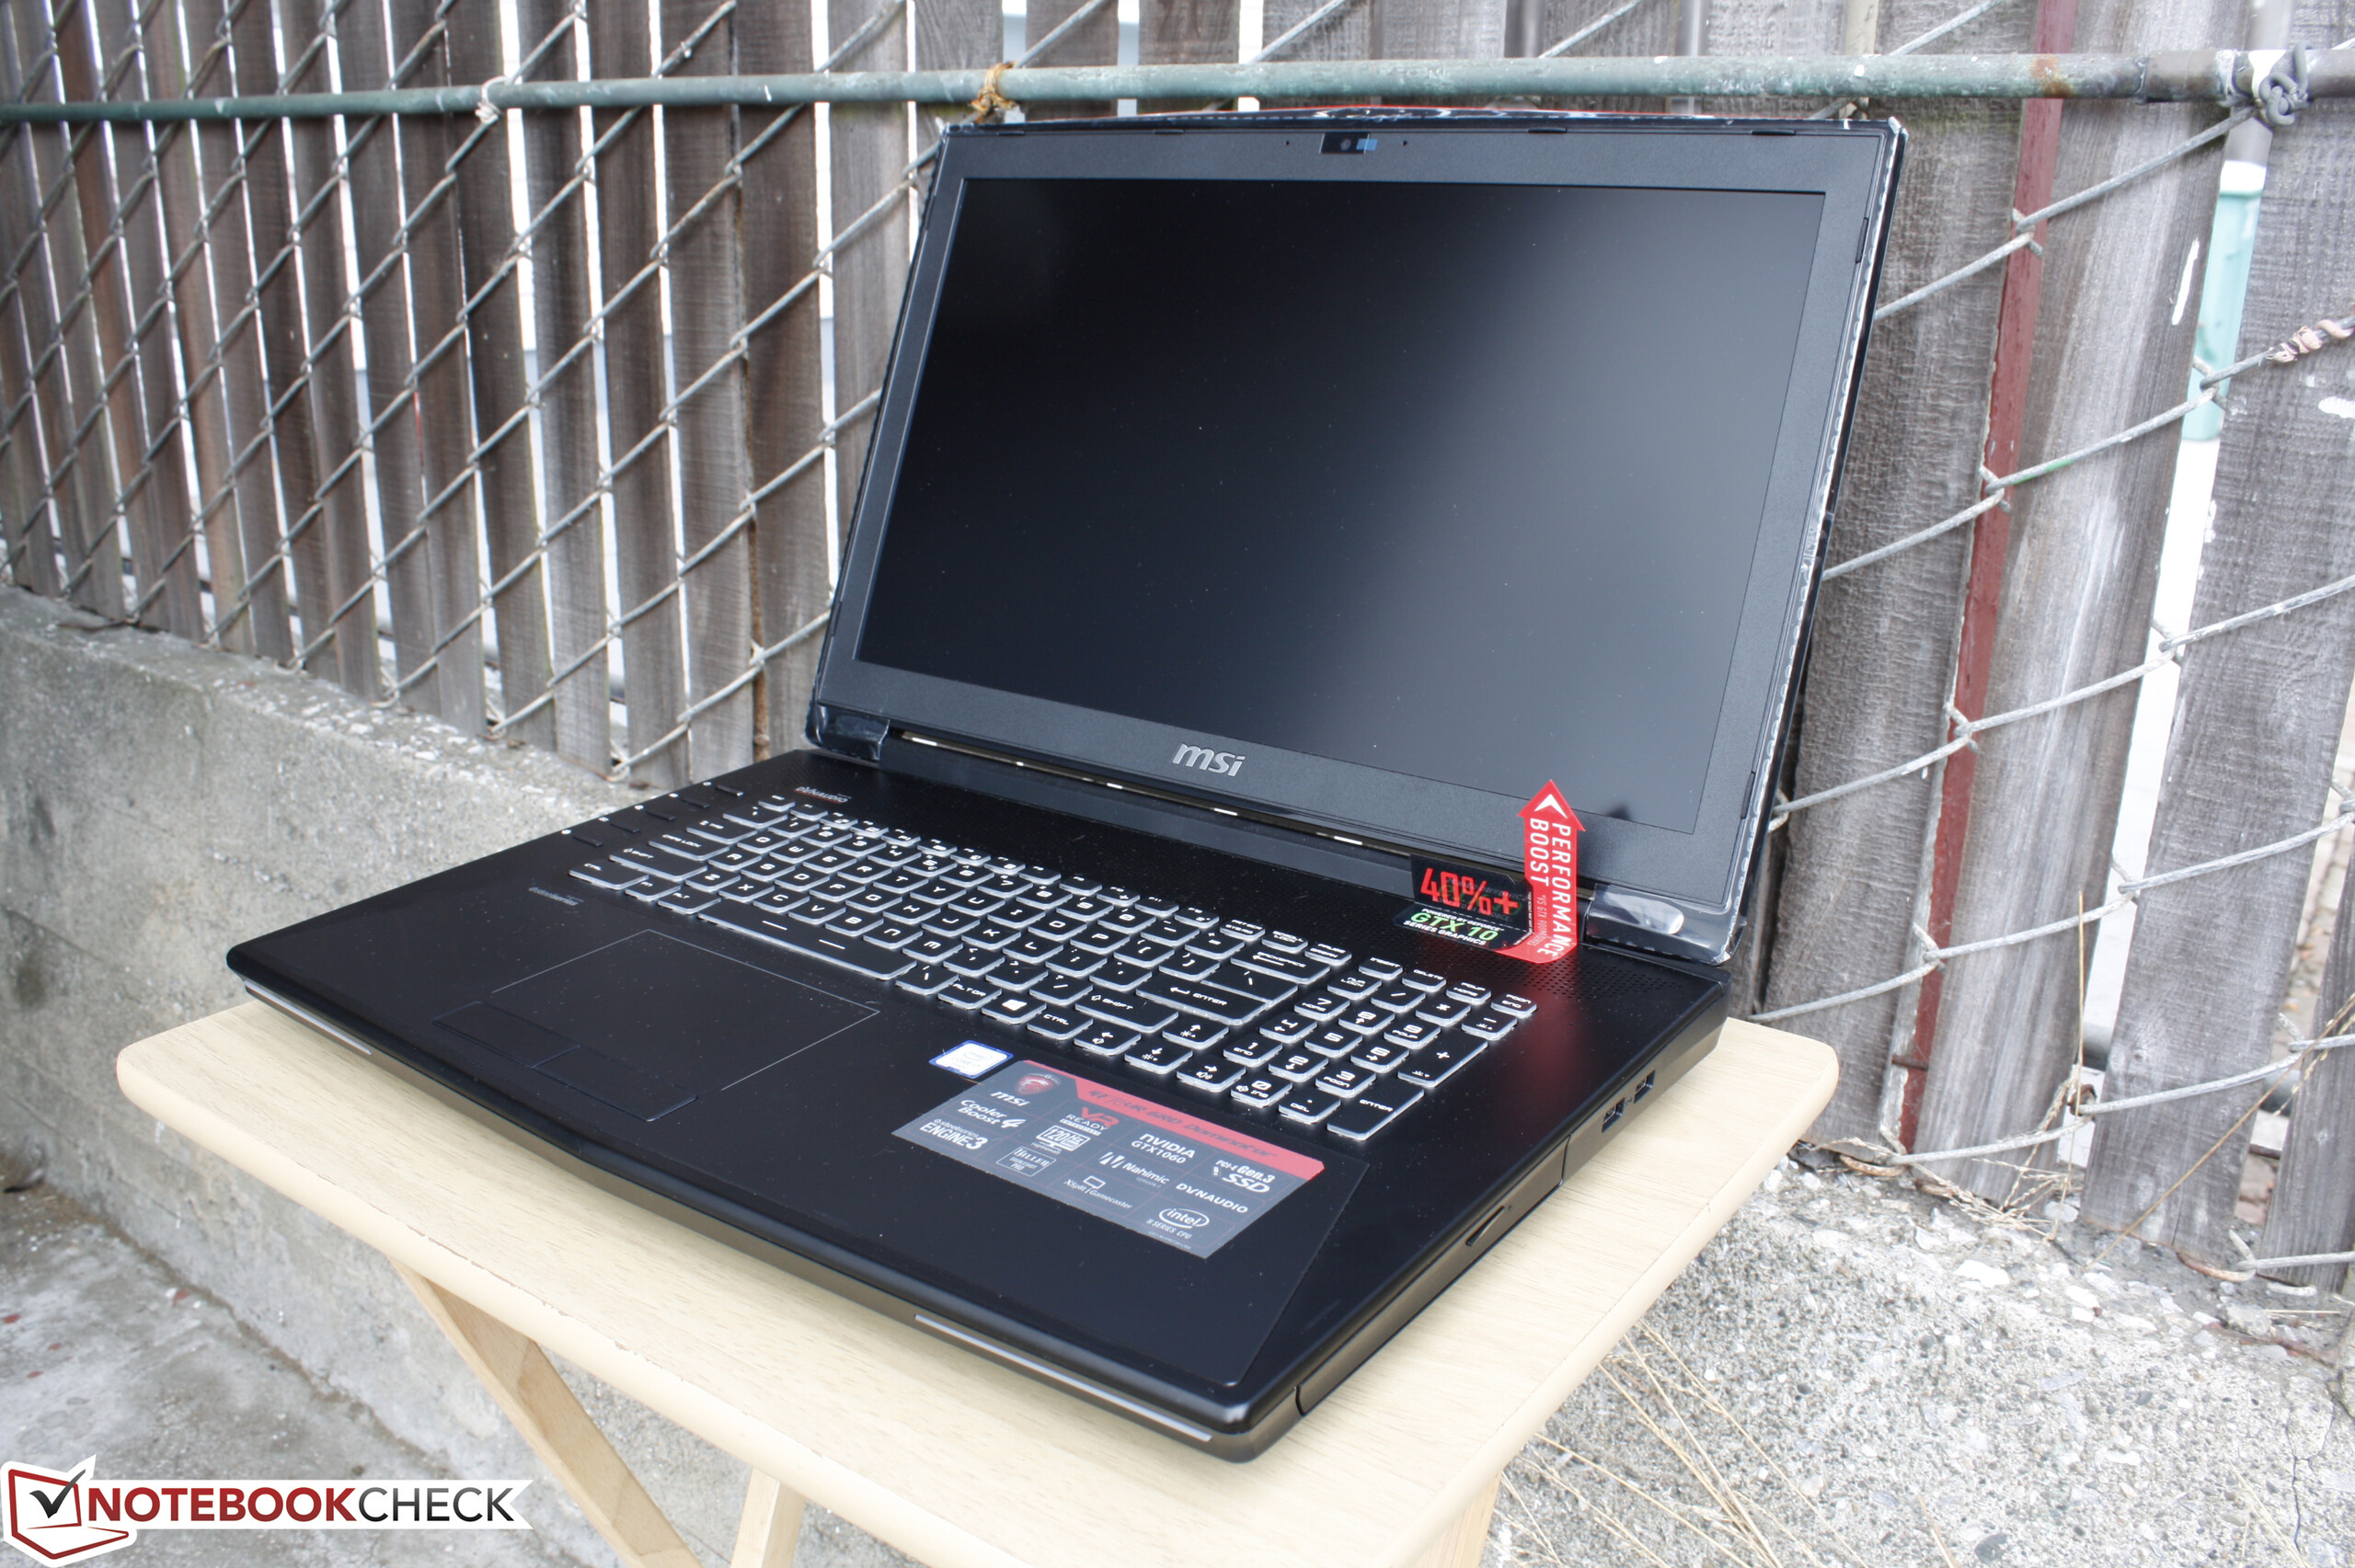
GT72的机身可能有些过时,不过它的硬件配置和实用性却不容小觑。它的冷却系统可以应对相比GTX 1060更加高功耗的显卡,因此GT72VR 6RD相比其它同样搭配这块帕斯卡显卡的机型它更加安静清凉。结合独一无二的120赫兹/5毫秒刷新率,和4K超高清选项,在对比之中它十分值得推荐选择。
这台设备的王牌是可更换的显卡。对于游戏玩家来说,升级GTX 1060到GTX 1070的可能性会让GT72VR 6RD十分有吸引力。维护也相比同类华硕设备更加方便,接近于准系统的水平,用户可以考虑选择入门级的GT72VR SKU(甚至是较老的GT72),以后当GTX 1060无法满足需要时再升级显卡。
我们也希望它能够提供更好的屏幕质量控制。我们目前接触到的两台GT72VR测试机都有不太均匀的边框或屏幕漏光问题。我们建议用户在购买后立刻检查它的屏幕质量。
尽管它的新机型GT73VR已经推出,GT72VR系列由于采用MXM 3.0b接口和易于维护将会有举足轻重的地位。
注:本文是基于完整评测的缩减版本,阅读完整的英文评测,请点击这里。
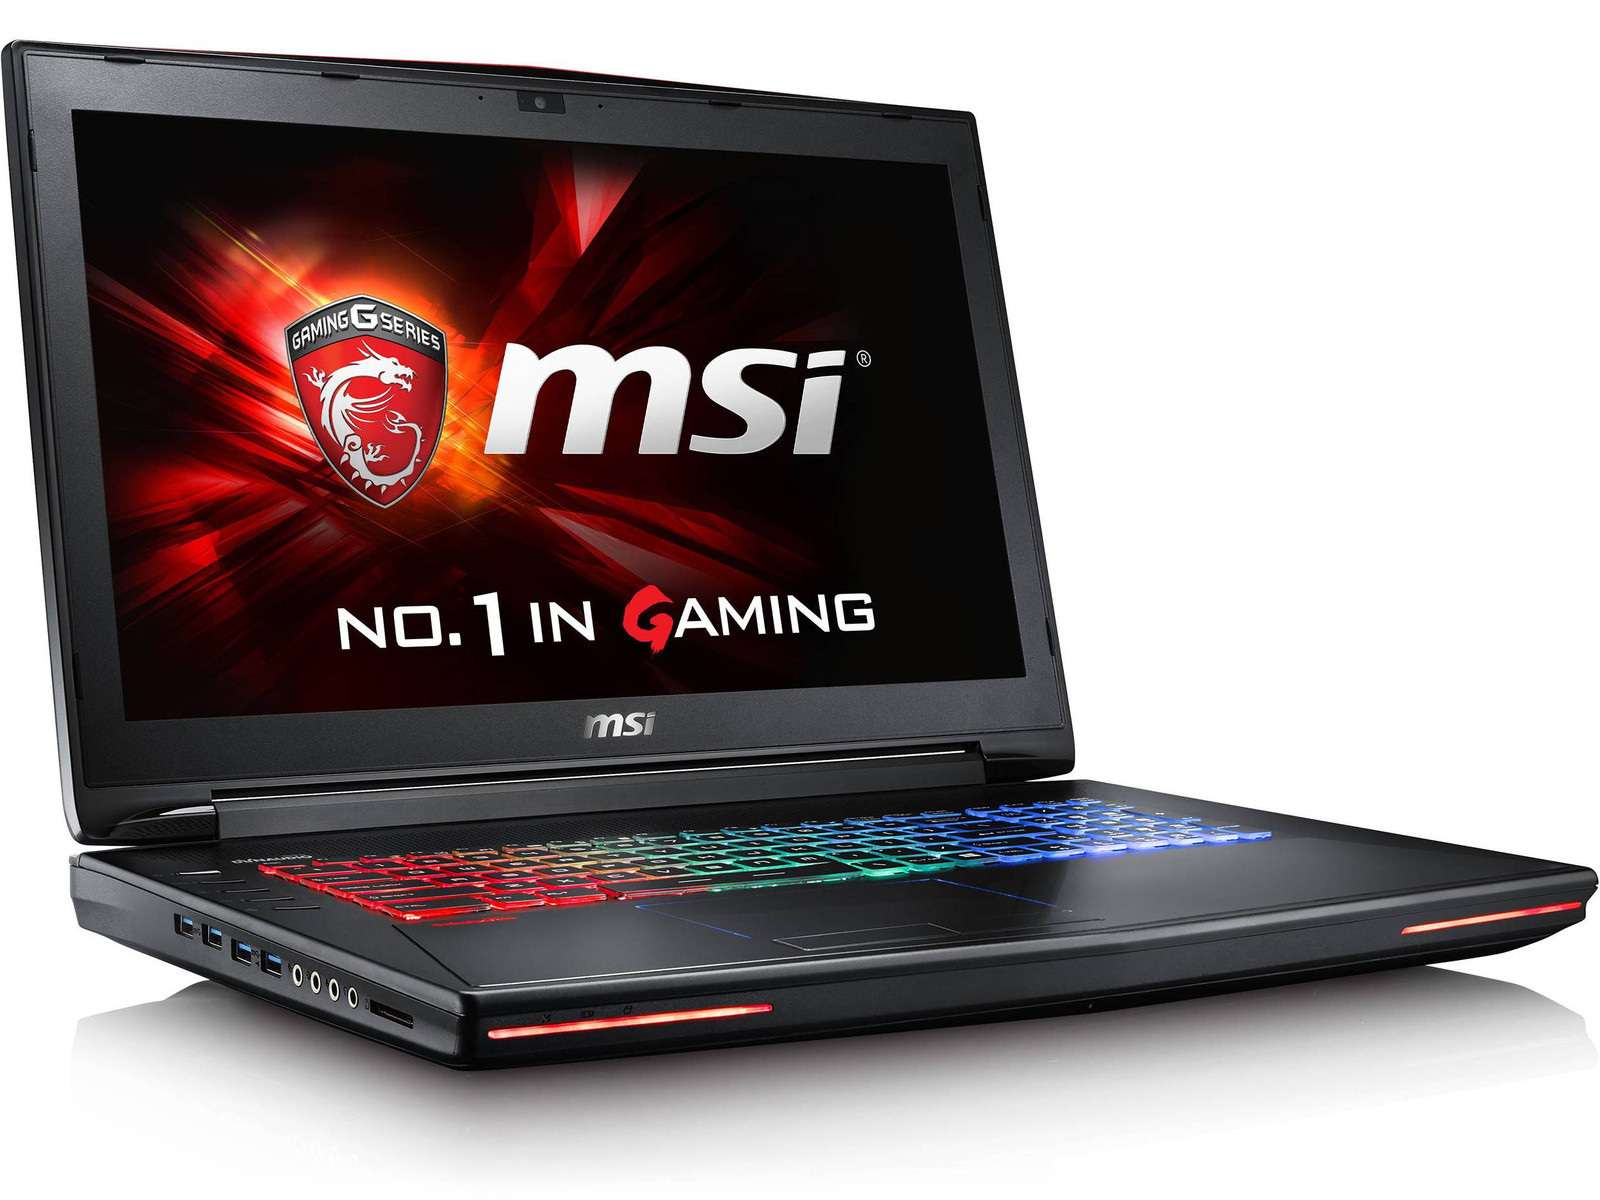
MSI GT72VR 6RD-063US
-
09/15/2016 v5.1(old)
Allen Ngo
Pricecompare
