 Deutsch
 English
 Español
 Français
 Italiano
 Nederlands
 Polski
 Português
 Русский
 Türkçe
 Svenska
 Chinese
 Magyar
微星 GE72 7RE Apache Pro 笔记本电脑简短评测


| SD Card Reader | |
| average JPG Copy Test (av. of 3 runs) | |
| Aorus X7 v6 | |
| HP Omen 17-w110ng | |
| Asus GL702VM-GC102D | |
| MSI GE72 7RE-046 | |
| MSI GS73VR 6RF | |
| maximum AS SSD Seq Read Test (1GB) | |
| HP Omen 17-w110ng | |
| Aorus X7 v6 | |
| Asus GL702VM-GC102D | |
| MSI GE72 7RE-046 | |
| MSI GS73VR 6RF | |
| Networking | |
| iperf3 transmit AX12 | |
| Aorus X7 v6 | |
| HP Omen 17-w110ng | |
| MSI GE72 7RE-046 | |
| iperf3 receive AX12 | |
| HP Omen 17-w110ng | |
| Aorus X7 v6 | |
| MSI GE72 7RE-046 | |
| |||||||||||||||||||||||||
Brightness Distribution: 86 %
Center on Battery: 253 cd/m²
Contrast: 1054:1 (Black: 0.24 cd/m²)
ΔE Color 5.01 | 0.5-29.43 Ø5
ΔE Greyscale 7.26 | 0.57-98 Ø5.3
100% sRGB (Argyll 1.6.3 3D)
76% AdobeRGB 1998 (Argyll 1.6.3 3D)
85.2% AdobeRGB 1998 (Argyll 2.2.0 3D)
99.9% sRGB (Argyll 2.2.0 3D)
90.7% Display P3 (Argyll 2.2.0 3D)
Gamma: 2.09
| MSI GE72 7RE-046 N173HHE-G32 (CMN1747), 1920x1080 | Aorus X7 v6 B173QTN01.0 (AUO1096), 2560x1440 | HP Omen 17-w110ng LG Philips LGD046E, 1920x1080 | MSI GS73VR 6RF 1920x1080 | Asus GL702VM-GC102D LG Philips LP173WF4-SPF3, 1920x1080 | |
|---|---|---|---|---|---|
| Display | -26% | -24% | -1% | -24% | |
| Display P3 Coverage | 90.7 | 60.9 -33% | 66.6 -27% | 90 -1% | 65.1 -28% |
| sRGB Coverage | 99.9 | 84.2 -16% | 84.1 -16% | 99.9 0% | 83.5 -16% |
| AdobeRGB 1998 Coverage | 85.2 | 61.2 -28% | 61.5 -28% | 83.6 -2% | 61.1 -28% |
| Response Times | -13% | -102% | -6% | -99% | |
| Response Time Grey 50% / Grey 80% * | 27 ? | 31 ? -15% | 37 ? -37% | 28 ? -4% | 38 ? -41% |
| Response Time Black / White * | 9 ? | 10 ? -11% | 24 ? -167% | 9.6 ? -7% | 23 ? -156% |
| PWM Frequency | |||||
| Screen | -18% | 10% | 20% | -16% | |
| Brightness middle | 253 | 343 36% | 362 43% | 337.2 33% | 326 29% |
| Brightness | 230 | 312 36% | 342 49% | 315 37% | 312 36% |
| Brightness Distribution | 86 | 80 -7% | 87 1% | 86 0% | 91 6% |
| Black Level * | 0.24 | 0.5 -108% | 0.31 -29% | 0.308 -28% | 0.5 -108% |
| Contrast | 1054 | 686 -35% | 1168 11% | 1095 4% | 652 -38% |
| Colorchecker dE 2000 * | 5.01 | 7.33 -46% | 4.5 10% | 2.96 41% | 6.3 -26% |
| Colorchecker dE 2000 max. * | 10.4 | 10.79 -4% | 9.31 10% | 5.45 48% | 11.69 -12% |
| Greyscale dE 2000 * | 7.26 | 7.6 -5% | 3.48 52% | 2.57 65% | 7.37 -2% |
| Gamma | 2.09 105% | 2.19 100% | 2.23 99% | 2.25 98% | 2.37 93% |
| CCT | 6329 103% | 9024 72% | 6144 106% | 7114 91% | 7116 91% |
| Color Space (Percent of AdobeRGB 1998) | 76 | 55 -28% | 55 -28% | 74.3 -2% | 55 -28% |
| Color Space (Percent of sRGB) | 100 | 84 -16% | 84 -16% | 100 0% | 83 -17% |
| Total Average (Program / Settings) | -19% /
-19% | -39% /
-11% | 4% /
12% | -46% /
-29% |
* ... smaller is better
Display Response Times
| ↔ Response Time Black to White | ||
|---|---|---|
| 9 ms ... rise ↗ and fall ↘ combined | ↗ 6 ms rise | 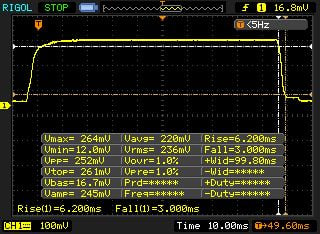 |
| ↘ 3 ms fall | ||
| The screen shows fast response rates in our tests and should be suited for gaming. In comparison, all tested devices range from 0.1 (minimum) to 240 (maximum) ms. » 20 % of all devices are better. This means that the measured response time is better than the average of all tested devices (21.5 ms). | ||
| ↔ Response Time 50% Grey to 80% Grey | ||
| 27 ms ... rise ↗ and fall ↘ combined | ↗ 13 ms rise |  |
| ↘ 14 ms fall | ||
| The screen shows relatively slow response rates in our tests and may be too slow for gamers. In comparison, all tested devices range from 0.2 (minimum) to 636 (maximum) ms. » 31 % of all devices are better. This means that the measured response time is better than the average of all tested devices (33.7 ms). | ||
Screen Flickering / PWM (Pulse-Width Modulation)
| Screen flickering / PWM not detected |  | ||
In comparison: 53 % of all tested devices do not use PWM to dim the display. If PWM was detected, an average of 17924 (minimum: 5 - maximum: 3846000) Hz was measured. | |||
| Cinebench R15 | |
| CPU Single 64Bit | |
| Aorus X7 v6 | |
| HP Omen 17-w110ng | |
| MSI GE72 7RE-046 | |
| MSI GS73VR 6RF | |
| Asus GL702VM-GC102D | |
| CPU Multi 64Bit | |
| Aorus X7 v6 | |
| MSI GE72 7RE-046 | |
| HP Omen 17-w110ng | |
| Asus GL702VM-GC102D | |
| MSI GS73VR 6RF | |
| Cinebench R11.5 | |
| CPU Single 64Bit | |
| Aorus X7 v6 | |
| HP Omen 17-w110ng | |
| MSI GE72 7RE-046 | |
| MSI GS73VR 6RF | |
| Asus GL702VM-GC102D | |
| CPU Multi 64Bit | |
| Aorus X7 v6 | |
| MSI GE72 7RE-046 | |
| HP Omen 17-w110ng | |
| Asus GL702VM-GC102D | |
| MSI GS73VR 6RF | |
| PCMark 7 Score | 5810 points | |
Help | ||
| PCMark 7 - Score | |
| Aorus X7 v6 | |
| MSI GE72 7RE-046 | |
| HP Omen 17-w110ng | |
| Asus GL702VM-GC102D | |
| MSI GE72 7RE-046 Toshiba HG6 THNSNJ256G8NY | Aorus X7 v6 Toshiba NVMe THNSN5512GPU7 | HP Omen 17-w110ng Samsung PM951 NVMe MZVLV256 | MSI GS73VR 6RF SanDisk SD8SN8U1T001122 | Asus GL702VM-GC102D HGST Travelstar 7K1000 HTS721010A9E630 | |
|---|---|---|---|---|---|
| CrystalDiskMark 3.0 | 124% | 49% | -37% | -86% | |
| Read Seq | 540 | 1499 178% | 1156 114% | 334.3 -38% | 134.6 -75% |
| Write Seq | 495.7 | 1411 185% | 294.9 -41% | 319 -36% | 130.6 -74% |
| Read 4k | 22.7 | 44.33 95% | 42.7 88% | 20.3 -11% | 0.602 -97% |
| Write 4k | 112.9 | 155.5 38% | 153.3 36% | 42.51 -62% | 1.146 -99% |

| 3DMark Vantage P Result | 30690 points | |
| 3DMark 11 Performance | 9269 points | |
| 3DMark Ice Storm Standard Score | 69304 points | |
| 3DMark Cloud Gate Standard Score | 20933 points | |
| 3DMark Fire Strike Score | 6959 points | |
Help | ||
| 3DMark | |
| 1920x1080 Fire Strike Graphics | |
| Aorus X7 v6 | |
| HP Omen 17-w110ng | |
| MSI GS73VR 6RF | |
| Asus GL702VM-GC102D | |
| MSI GE72 7RE-046 | |
| 1280x720 Sky Diver Graphics | |
| Aorus X7 v6 | |
| HP Omen 17-w110ng | |
| Asus GL702VM-GC102D | |
| MSI GE72 7RE-046 | |
| 3DMark 11 - 1280x720 Performance GPU | |
| Aorus X7 v6 | |
| HP Omen 17-w110ng | |
| MSI GS73VR 6RF | |
| Asus GL702VM-GC102D | |
| MSI GE72 7RE-046 | |
| Unigine Heaven 4.0 - Extreme Preset DX11 | |
| Aorus X7 v6 | |
| HP Omen 17-w110ng | |
| MSI GE72 7RE-046 | |
| Battlefield 1 | |
| 1920x1080 Ultra Preset AA:T | |
| Aorus X7 v6 | |
| HP Omen 17-w110ng | |
| Asus GL702VM-GC102D | |
| MSI GE72 7RE-046 | |
| 1920x1080 High Preset AA:T | |
| Aorus X7 v6 | |
| HP Omen 17-w110ng | |
| Asus GL702VM-GC102D | |
| MSI GE72 7RE-046 | |
| low | med. | high | ultra | QHD | 4K | |
| Dirt Rally (2015) | 93.4 | 65.7 | 57.8 | |||
| The Witcher 3 (2015) | 48.7 | 26.9 | 17.6 | |||
| Batman: Arkham Knight (2015) | 60 | 41 | 19 | |||
| Mad Max (2015) | 89.7 | 82.7 | 28.6 | |||
| Anno 2205 (2015) | 63.7 | 20.6 | 24 | |||
| Fallout 4 (2015) | 56 | 46.2 | 18.5 | |||
| Star Wars Battlefront (2015) | 72.4 | 62.7 | 22.4 | |||
| Assassin's Creed Syndicate (2015) | 47.8 | 23.5 | 17.1 | |||
| Rainbow Six Siege (2015) | 92.2 | 74.4 | 28.4 | |||
| Just Cause 3 (2015) | 58.9 | 52.7 | 22.1 | |||
| Rise of the Tomb Raider (2016) | 47.4 | 39.7 | 17.6 | |||
| XCOM 2 (2016) | 37.7 | 19 | 10.3 | |||
| Far Cry Primal (2016) | 53 | 40 | 17 | |||
| The Division (2016) | 45 | 34.9 | 16.6 | |||
| Hitman 2016 (2016) | 38.4 | 36.6 | 16.3 | |||
| Need for Speed 2016 (2016) | 60.4 | 46.4 | 21.3 | |||
| Doom (2016) | 68.3 | 63.8 | 21.2 | |||
| Overwatch (2016) | 118 | 71 | 38.3 | |||
| Mirror's Edge Catalyst (2016) | 50.3 | 45.1 | 16.2 | |||
| No Man's Sky (2016) | 44.6 | 22 | 18.1 | |||
| Deus Ex Mankind Divided (2016) | 38.3 | 19.7 | 12.3 | |||
| FIFA 17 (2016) | 130 | 128 | 66.1 | |||
| Mafia 3 (2016) | 28.7 | 9.8 | ||||
| Battlefield 1 (2016) | 56.7 | 50.8 | 19.8 | |||
| Farming Simulator 17 (2016) | 130 | 117 | 59.7 | |||
| Titanfall 2 (2016) | 62 | 56.2 | 18.7 | |||
| Call of Duty Infinite Warfare (2016) | 67.4 | 58.8 | 27.4 | |||
| Dishonored 2 (2016) | 48.7 | 39.6 | 18.2 | |||
| Watch Dogs 2 (2016) | 42.4 | 26.6 | 14.4 | |||
| Resident Evil 7 (2017) | 64.5 | 24.3 | ||||
| For Honor (2017) | 66 () | 62 () | 45 () | |||
| Ghost Recon Wildlands (2017) | 106 | 46.1 | 40.3 | 9.8 | ||
| Mass Effect Andromeda (2017) | 105 | 50.2 | 27.9 | 23 | ||
| Warhammer 40.000: Dawn of War III (2017) | 112 | 46.6 | 29.8 | 25.8 | 0 | |
| Rocket League (2017) | 158 | 61 | ||||
| Dirt 4 (2017) | 74.2 | 39.2 | ||||
| Team Fortress 2 (2017) | 105 | 74.4 | ||||
| Playerunknown's Battlegrounds (PUBG) (2017) | 54.1 | 45.2 | ||||
| F1 2017 (2017) | 66 | 40 | 16 | |||
| Ark Survival Evolved (2017) | 89 | 31.6 | 21.8 | |||
| FIFA 18 (2017) | 149 | 62.3 | ||||
| Middle-earth: Shadow of War (2017) | 121 | 62 | 43 | 29 | 12 | |
| The Evil Within 2 (2017) | 61.8 | 36.1 | 32.9 | 31 | 2 | |
| ELEX (2017) | 102 | 52.2 | 41.9 | 31 | 19.6 | 6.6 |
| Destiny 2 (2017) | 116 | 65.5 | 62.1 | 51.1 | 26.1 | 17.8 |
| Assassin´s Creed Origins (2017) | 77 | 45 | 38 | 28 | 20 | 4 |
| Call of Duty WWII (2017) | 191 | 129 | 67.8 | 42.4 | 30.8 | 18.9 |
| Need for Speed Payback (2017) | 115 | 66 | 54.7 | 50.9 | 30.3 | 9.7 |
| Star Wars Battlefront 2 (2017) | 135 | 75 | 65 | 43 | 19.5 | 5.7 |
| Fortnite (2018) | 61 | 45.1 | 28.8 | 8.8 | ||
| Final Fantasy XV Benchmark (2018) | 74 | 37.1 | 23.4 | |||
| Kingdom Come: Deliverance (2018) | 107 | 49.5 | 40.5 | 28 | 16.9 | 6 |
| X-Plane 11.11 (2018) | 77.3 | 69.9 | 61.2 | 45.3 | ||
| Far Cry 5 (2018) | 95 | 47 | 43 | 39 | 25 | 12 |
| The Crew 2 (2018) | 51 | 44.1 | ||||
| Monster Hunter World (2018) | 93 | 41.2 | 35.5 | 27.9 | ||
| F1 2018 (2018) | 146 | 81 | 62 | 37 | 28 | 15 |
| Shadow of the Tomb Raider (2018) | 97 | 38 | 31 | 25 | 17 | 8 |
| FIFA 19 (2018) | 192 | 169 | 157 | 150 | 51.3 | |
| Forza Horizon 4 (2018) | 122 | 62 | 55 | 40 | ||
| Assassin´s Creed Odyssey (2018) | 77 | 41 | 31 | 17 | ||
| Call of Duty Black Ops 4 (2018) | 35.5 | 10.2 | ||||
| Hitman 2 (2018) | 55.6 | 39 | 29.7 | 23.6 | ||
| Fallout 76 (2018) | 48.4 | 45.3 |
Noise Level
| Idle |
| 34 / 35 / 36 dB(A) |
| DVD |
| 40 / dB(A) |
| Load |
| 41 / 49 dB(A) |
 | ||
30 dB silent 40 dB(A) audible 50 dB(A) loud |
||
min: | ||
| MSI GE72 7RE-046 GeForce GTX 1050 Ti Mobile, i7-7700HQ | Aorus X7 v6 GeForce GTX 1070 Mobile, 6820HK | HP Omen 17-w110ng GeForce GTX 1070 Mobile, 6700HQ | MSI GS73VR 6RF GeForce GTX 1060 Mobile, 6700HQ | Asus GL702VM-GC102D GeForce GTX 1060 Mobile, 6700HQ | |
|---|---|---|---|---|---|
| Noise | -4% | -1% | 2% | 6% | |
| off / environment * | 30 | 30 -0% | 30 -0% | 28.4 5% | 30.5 -2% |
| Idle Minimum * | 34 | 33 3% | 33 3% | 31.9 6% | 31.4 8% |
| Idle Average * | 35 | 35 -0% | 34 3% | 32 9% | 31.4 10% |
| Idle Maximum * | 36 | 40 -11% | 35 3% | 34 6% | 31.5 12% |
| Load Average * | 41 | 43 -5% | 45 -10% | 47 -15% | 40.9 -0% |
| Load Maximum * | 49 | 54 -10% | 52 -6% | 49.4 -1% | 46.2 6% |
* ... smaller is better
(-) The maximum temperature on the upper side is 45.8 °C / 114 F, compared to the average of 40.4 °C / 105 F, ranging from 21.2 to 68.8 °C for the class Gaming.
(-) The bottom heats up to a maximum of 45.2 °C / 113 F, compared to the average of 43.2 °C / 110 F
(+) In idle usage, the average temperature for the upper side is 26.7 °C / 80 F, compared to the device average of 33.8 °C / 93 F.
(-) The palmrests and touchpad can get very hot to the touch with a maximum of 40.3 °C / 104.5 F.
(-) The average temperature of the palmrest area of similar devices was 28.9 °C / 84 F (-11.4 °C / -20.5 F).
| MSI GE72 7RE-046 GeForce GTX 1050 Ti Mobile, i7-7700HQ | Aorus X7 v6 GeForce GTX 1070 Mobile, 6820HK | HP Omen 17-w110ng GeForce GTX 1070 Mobile, 6700HQ | MSI GS73VR 6RF GeForce GTX 1060 Mobile, 6700HQ | Asus GL702VM-GC102D GeForce GTX 1060 Mobile, 6700HQ | |
|---|---|---|---|---|---|
| Heat | -3% | -2% | -7% | -8% | |
| Maximum Upper Side * | 45.8 | 47.5 -4% | 45 2% | 50.8 -11% | 53.1 -16% |
| Maximum Bottom * | 45.2 | 54.5 -21% | 54.3 -20% | 60 -33% | 44.9 1% |
| Idle Upper Side * | 31.7 | 28.6 10% | 29.6 7% | 27.4 14% | 32.9 -4% |
| Idle Bottom * | 29.9 | 28.8 4% | 28.6 4% | 28.8 4% | 33.4 -12% |
* ... smaller is better
MSI GE72 7RE-046 audio analysis
(+) | speakers can play relatively loud (91 dB)
Bass 100 - 315 Hz
(-) | nearly no bass - on average 17.2% lower than median
(±) | linearity of bass is average (9.2% delta to prev. frequency)
Mids 400 - 2000 Hz
(+) | balanced mids - only 3.3% away from median
(+) | mids are linear (4.7% delta to prev. frequency)
Highs 2 - 16 kHz
(+) | balanced highs - only 3.3% away from median
(+) | highs are linear (4% delta to prev. frequency)
Overall 100 - 16.000 Hz
(+) | overall sound is linear (13.7% difference to median)
Compared to same class
» 19% of all tested devices in this class were better, 6% similar, 75% worse
» The best had a delta of 6%, average was 18%, worst was 132%
Compared to all devices tested
» 12% of all tested devices were better, 3% similar, 85% worse
» The best had a delta of 4%, average was 25%, worst was 134%
Asus GL702VM-GC102D audio analysis
(-) | not very loud speakers (64 dB)
Bass 100 - 315 Hz
(±) | reduced bass - on average 7.7% lower than median
(±) | linearity of bass is average (14% delta to prev. frequency)
Mids 400 - 2000 Hz
(+) | balanced mids - only 1.5% away from median
(+) | mids are linear (6.3% delta to prev. frequency)
Highs 2 - 16 kHz
(±) | reduced highs - on average 5.3% lower than median
(±) | linearity of highs is average (9.8% delta to prev. frequency)
Overall 100 - 16.000 Hz
(±) | linearity of overall sound is average (16.7% difference to median)
Compared to same class
» 40% of all tested devices in this class were better, 10% similar, 50% worse
» The best had a delta of 6%, average was 18%, worst was 132%
Compared to all devices tested
» 24% of all tested devices were better, 7% similar, 70% worse
» The best had a delta of 4%, average was 25%, worst was 134%
| Off / Standby | |
| Idle | |
| Load |
|
| MSI GE72 7RE-046 GeForce GTX 1050 Ti Mobile, i7-7700HQ | Aorus X7 v6 GeForce GTX 1070 Mobile, 6820HK | HP Omen 17-w110ng GeForce GTX 1070 Mobile, 6700HQ | MSI GS73VR 6RF GeForce GTX 1060 Mobile, 6700HQ | Asus GL702VM-GC102D GeForce GTX 1060 Mobile, 6700HQ | |
|---|---|---|---|---|---|
| Power Consumption | -67% | -28% | -44% | -3% | |
| Idle Minimum * | 14 | 29 -107% | 19 -36% | 22.6 -61% | 15.6 -11% |
| Idle Average * | 20 | 31 -55% | 25 -25% | 32.7 -64% | 20.2 -1% |
| Idle Maximum * | 25 | 38 -52% | 31 -24% | 32.8 -31% | 21.4 14% |
| Load Average * | 82 | 111 -35% | 90 -10% | 114.7 -40% | 90 -10% |
| Load Maximum * | 135 | 253 -87% | 193 -43% | 167.9 -24% | 147 -9% |
* ... smaller is better
| MSI GE72 7RE-046 51.4 Wh | Aorus X7 v6 94 Wh | HP Omen 17-w110ng 95 Wh | MSI GS73VR 6RF 65 Wh | Asus GL702VM-GC102D 76 Wh | |
|---|---|---|---|---|---|
| Battery Runtime | -1% | 27% | 16% | 35% | |
| H.264 | 195 | 233 19% | 262 34% | ||
| WiFi v1.3 | 184 | 182 -1% | 247 34% | 213 16% | 250 36% |
Pros
Cons

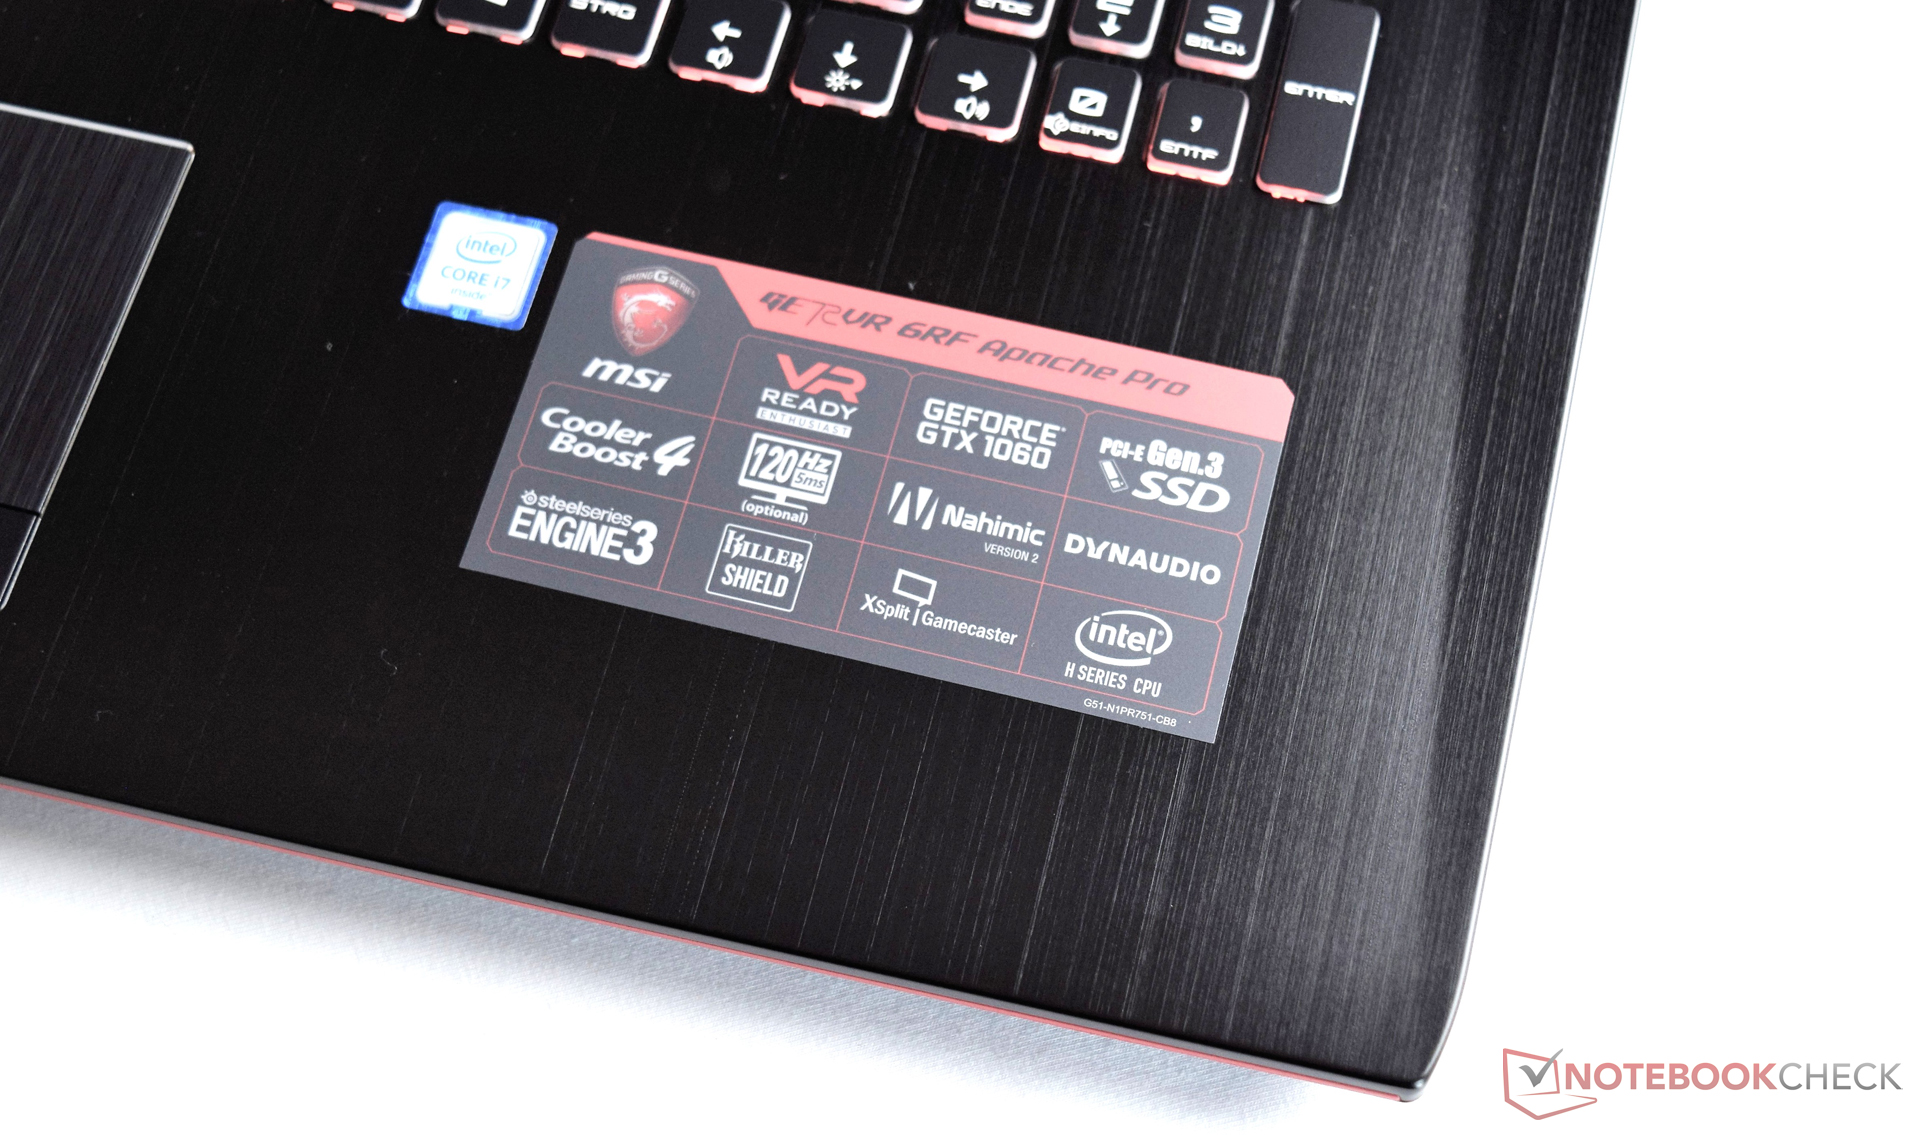
尽管GE72 7RE缺少一个虚拟实境的认证标签,它仍然可以被视作一台游戏笔记本电脑。英伟达的最新GeForce GTX 1050 Ti显卡提供了充足的性能,可以在1,920 x 1,080像素分辨率和高设置下提供不错的帧率。
当分辨率提高到3K和4K时,它的性能将会明显下降,要求较高的游戏将会无法流畅运行。用户需要考虑增加预算购置搭配GTX 1060的机型。长远来看,6GB的显存相比4GB的设备会有更长的寿命,而不需要增加太多的预算。
我们认为英特尔的Kaby Lake架构表现平平,在处理器性能上只有很小的提升。
正在实惠型多媒体笔记本电脑和高端游戏本间犹豫不定的用户可能会对GE72 7RE十分满意。
注:本文是基于完整评测的缩减版本,阅读完整的英文评测,请点击这里。
MSI GE72 7RE-046
-
12/28/2016 v6(old)
Florian Glaser