 Deutsch
 English
 Español
 Français
 Italiano
 Nederlands
 Polski
 Português
 Русский
 Türkçe
 Svenska
 Chinese
 Magyar
Fairphone 2 智能手机简短评测

| Networking | |
| iperf3 transmit AX12 | |
| Samsung Galaxy S7 | |
| Fairphone 2 | |
| Huawei P9 | |
| iperf3 receive AX12 | |
| Samsung Galaxy S7 | |
| Huawei P9 | |
| Fairphone 2 | |


| |||||||||||||||||||||||||
Brightness Distribution: 92 %
Center on Battery: 476 cd/m²
Contrast: 1253:1 (Black: 0.38 cd/m²)
ΔE Color 4.5 | 0.5-29.43 Ø5
ΔE Greyscale 4.2 | 0.57-98 Ø5.3
Gamma: 2.54
| Fairphone 2 IPS, 1920x1080, 5.00 | Sony Xperia XA IPS, 1280x720, 5.00 | Huawei P9 IPS-NEO, JDI, 1920x1080, 5.20 | Samsung Galaxy A5 2016 Super AMOLED, 1920x1080, 5.20 | Samsung Galaxy S7 SAMOLED, 2560x1440, 5.10 | |
|---|---|---|---|---|---|
| Screen | -30% | 9% | 23% | 23% | |
| Brightness middle | 476 | 518 9% | 582 22% | 378 -21% | 350 -26% |
| Brightness | 468 | 475 1% | 563 20% | 380 -19% | 351 -25% |
| Brightness Distribution | 92 | 81 -12% | 91 -1% | 91 -1% | 98 7% |
| Black Level * | 0.38 | 0.61 -61% | 0.38 -0% | ||
| Contrast | 1253 | 849 -32% | 1532 22% | ||
| Colorchecker dE 2000 * | 4.5 | 6.8 -51% | 4.4 2% | 1.95 57% | 2.04 55% |
| Colorchecker dE 2000 max. * | 9.2 | 11.4 -24% | 7.4 20% | 3.09 66% | 3.25 65% |
| Greyscale dE 2000 * | 4.2 | 7 -67% | 4.8 -14% | 1.86 56% | 1.63 61% |
| Gamma | 2.54 87% | 2.35 94% | 2.2 100% | 2.13 103% | 2.07 106% |
| CCT | 7296 89% | 8151 80% | 6175 105% | 6376 102% | 6391 102% |
| Color Space (Percent of AdobeRGB 1998) | 77.78 | 86.86 | |||
| Color Space (Percent of sRGB) | 99.44 | 99.35 |
* ... smaller is better
Screen Flickering / PWM (Pulse-Width Modulation)
| Screen flickering / PWM detected | 266 Hz | ≤ 100 % brightness setting | 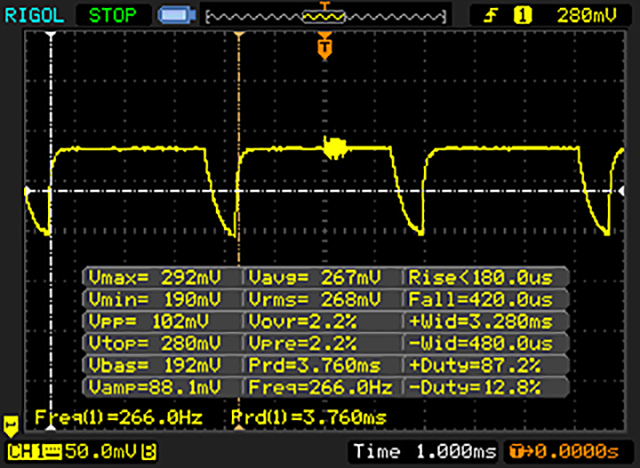 |
The display backlight flickers at 266 Hz (worst case, e.g., utilizing PWM) Flickering detected at a brightness setting of 100 % and below. There should be no flickering or PWM above this brightness setting. The frequency of 266 Hz is relatively high, so most users sensitive to PWM should not notice any flickering. However, there are reports that some users are still sensitive to PWM at 500 Hz and above, so be aware. In comparison: 53 % of all tested devices do not use PWM to dim the display. If PWM was detected, an average of 17900 (minimum: 5 - maximum: 3846000) Hz was measured. | |||
Display Response Times
| ↔ Response Time Black to White | ||
|---|---|---|
| 27 ms ... rise ↗ and fall ↘ combined | ↗ 10 ms rise | 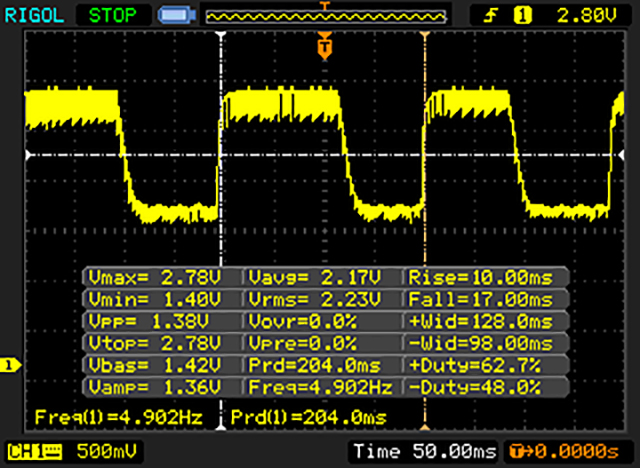 |
| ↘ 17 ms fall | ||
| The screen shows relatively slow response rates in our tests and may be too slow for gamers. In comparison, all tested devices range from 0.1 (minimum) to 240 (maximum) ms. » 63 % of all devices are better. This means that the measured response time is worse than the average of all tested devices (21.5 ms). | ||
| ↔ Response Time 50% Grey to 80% Grey | ||
| 51 ms ... rise ↗ and fall ↘ combined | ↗ 26 ms rise | 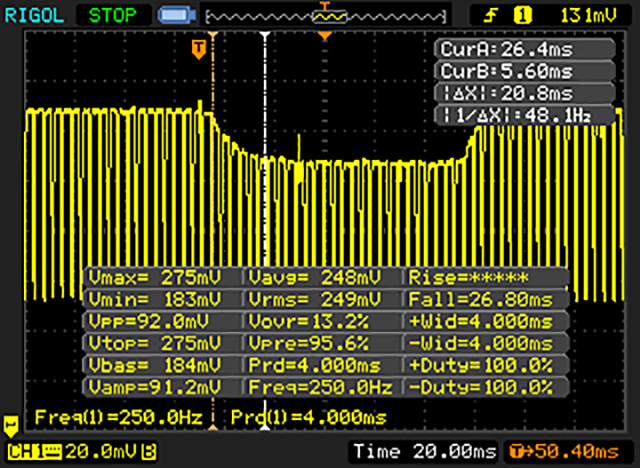 |
| ↘ 25 ms fall | ||
| The screen shows slow response rates in our tests and will be unsatisfactory for gamers. In comparison, all tested devices range from 0.2 (minimum) to 636 (maximum) ms. » 86 % of all devices are better. This means that the measured response time is worse than the average of all tested devices (33.7 ms). | ||
| AnTuTu v6 - Total Score (sort by value) | |
| Fairphone 2 | |
| Sony Xperia XA | |
| Huawei P9 | |
| Samsung Galaxy A5 2016 | |
| Samsung Galaxy S7 | |
| Geekbench 4.0 | |
| 64 Bit Single-Core Score (sort by value) | |
| Fairphone 2 | |
| Huawei P9 | |
| 64 Bit Multi-Core Score (sort by value) | |
| Fairphone 2 | |
| Huawei P9 | |
| GFXBench (DX / GLBenchmark) 2.7 | |
| T-Rex Onscreen (sort by value) | |
| Fairphone 2 | |
| Sony Xperia XA | |
| Huawei P9 | |
| Samsung Galaxy A5 2016 | |
| Samsung Galaxy S7 | |
| 1920x1080 T-Rex Offscreen (sort by value) | |
| Fairphone 2 | |
| Sony Xperia XA | |
| Huawei P9 | |
| Samsung Galaxy A5 2016 | |
| Samsung Galaxy S7 | |
| GFXBench 3.0 | |
| on screen Manhattan Onscreen OGL (sort by value) | |
| Fairphone 2 | |
| Sony Xperia XA | |
| Huawei P9 | |
| Samsung Galaxy A5 2016 | |
| Samsung Galaxy S7 | |
| 1920x1080 1080p Manhattan Offscreen (sort by value) | |
| Fairphone 2 | |
| Sony Xperia XA | |
| Huawei P9 | |
| Samsung Galaxy A5 2016 | |
| Samsung Galaxy S7 | |
| GFXBench 3.1 | |
| on screen Manhattan ES 3.1 Onscreen (sort by value) | |
| Sony Xperia XA | |
| Huawei P9 | |
| Samsung Galaxy S7 | |
| 1920x1080 Manhattan ES 3.1 Offscreen (sort by value) | |
| Sony Xperia XA | |
| Huawei P9 | |
| Samsung Galaxy S7 | |
| PCMark for Android - Work performance score (sort by value) | |
| Fairphone 2 | |
| Sony Xperia XA | |
| Huawei P9 | |
| Samsung Galaxy A5 2016 | |
| Samsung Galaxy S7 | |
| Octane V2 - Total Score (sort by value) | |
| Fairphone 2 | |
| Sony Xperia XA | |
| Huawei P9 | |
| Samsung Galaxy A5 2016 | |
| Samsung Galaxy S7 | |
| Mozilla Kraken 1.1 - Total (sort by value) | |
| Fairphone 2 | |
| Sony Xperia XA | |
| Huawei P9 | |
| Samsung Galaxy A5 2016 | |
| Samsung Galaxy S7 | |
| WebXPRT 2015 - Overall (sort by value) | |
| Fairphone 2 | |
| Sony Xperia XA | |
| Huawei P9 | |
| Samsung Galaxy A5 2016 | |
| Samsung Galaxy S7 | |
| JetStream 1.1 - Total Score (sort by value) | |
| Fairphone 2 | |
| Sony Xperia XA | |
| Huawei P9 | |
| Samsung Galaxy A5 2016 | |
| Samsung Galaxy S7 | |
* ... smaller is better
| Fairphone 2 | Sony Xperia XA | Huawei P9 | Samsung Galaxy A5 2016 | Samsung Galaxy S7 | |
|---|---|---|---|---|---|
| AndroBench 3-5 | 66% | 193% | 50% | 217% | |
| Sequential Read 256KB | 202.4 | 240.4 19% | 281.3 39% | 209.4 3% | 483.8 139% |
| Sequential Write 256KB | 104.1 | 68.6 -34% | 72.2 -31% | 60.4 -42% | 145.7 40% |
| Random Read 4KB | 10.77 | 22.05 105% | 39 262% | 22.9 113% | 85.9 698% |
| Random Write 4KB | 5.01 | 10.6 112% | 47.45 847% | 11.2 124% | 16.01 220% |
| Sequential Read 256KB SDCard | 39.33 | 72.9 85% | 55 40% | 72.3 84% | |
| Sequential Write 256KB SDCard | 24.08 | 50.7 111% | 24.83 3% | 53.6 123% |
(±) The maximum temperature on the upper side is 40.3 °C / 105 F, compared to the average of 35 °C / 95 F, ranging from 21.9 to 56 °C for the class Smartphone.
(-) The bottom heats up to a maximum of 45.9 °C / 115 F, compared to the average of 33.8 °C / 93 F
(±) In idle usage, the average temperature for the upper side is 37.6 °C / 100 F, compared to the device average of 32.7 °C / 91 F.
Fairphone 2 audio analysis
(+) | speakers can play relatively loud (88.7 dB)
Bass 100 - 315 Hz
(-) | nearly no bass - on average 35.4% lower than median
(±) | linearity of bass is average (8% delta to prev. frequency)
Mids 400 - 2000 Hz
(+) | balanced mids - only 4.9% away from median
(+) | mids are linear (5.2% delta to prev. frequency)
Highs 2 - 16 kHz
(+) | balanced highs - only 4% away from median
(+) | highs are linear (3.6% delta to prev. frequency)
Overall 100 - 16.000 Hz
(±) | linearity of overall sound is average (21.4% difference to median)
Compared to same class
» 35% of all tested devices in this class were better, 8% similar, 57% worse
» The best had a delta of 12%, average was 38%, worst was 134%
Compared to all devices tested
» 55% of all tested devices were better, 7% similar, 38% worse
» The best had a delta of 4%, average was 25%, worst was 134%
Sony Xperia XA audio analysis
(+) | speakers can play relatively loud (82 dB)
Bass 100 - 315 Hz
(-) | nearly no bass - on average 24.9% lower than median
(±) | linearity of bass is average (7.9% delta to prev. frequency)
Mids 400 - 2000 Hz
(±) | higher mids - on average 5.3% higher than median
(±) | linearity of mids is average (9.3% delta to prev. frequency)
Highs 2 - 16 kHz
(±) | higher highs - on average 10.7% higher than median
(±) | linearity of highs is average (7% delta to prev. frequency)
Overall 100 - 16.000 Hz
(±) | linearity of overall sound is average (29.3% difference to median)
Compared to same class
» 73% of all tested devices in this class were better, 4% similar, 23% worse
» The best had a delta of 12%, average was 38%, worst was 134%
Compared to all devices tested
» 85% of all tested devices were better, 3% similar, 12% worse
» The best had a delta of 4%, average was 25%, worst was 134%
Samsung Galaxy A5 2016 audio analysis
(+) | speakers can play relatively loud (87.7 dB)
Bass 100 - 315 Hz
(-) | nearly no bass - on average 33.7% lower than median
(±) | linearity of bass is average (11.1% delta to prev. frequency)
Mids 400 - 2000 Hz
(+) | balanced mids - only 4.2% away from median
(+) | mids are linear (5.4% delta to prev. frequency)
Highs 2 - 16 kHz
(+) | balanced highs - only 4.7% away from median
(±) | linearity of highs is average (8.4% delta to prev. frequency)
Overall 100 - 16.000 Hz
(±) | linearity of overall sound is average (22.1% difference to median)
Compared to same class
» 40% of all tested devices in this class were better, 7% similar, 53% worse
» The best had a delta of 12%, average was 38%, worst was 134%
Compared to all devices tested
» 59% of all tested devices were better, 7% similar, 34% worse
» The best had a delta of 4%, average was 25%, worst was 134%
| Off / Standby | |
| Idle | |
| Load |
|
| Fairphone 2 2420 mAh | Sony Xperia XA 2300 mAh | Huawei P9 3000 mAh | Samsung Galaxy A5 2016 2900 mAh | Samsung Galaxy S7 3000 mAh | |
|---|---|---|---|---|---|
| Power Consumption | 10% | -8% | 4% | 14% | |
| Idle Minimum * | 0.64 | 0.72 -13% | 0.77 -20% | 0.96 -50% | 0.68 -6% |
| Idle Average * | 1.61 | 1.5 7% | 2.36 -47% | 1.64 -2% | 1.02 37% |
| Idle Maximum * | 1.77 | 1.57 11% | 2.37 -34% | 1.71 3% | 1.14 36% |
| Load Average * | 5.02 | 3.48 31% | 3.09 38% | 2.98 41% | 4.73 6% |
| Load Maximum * | 6.98 | 6.04 13% | 5.35 23% | 5.08 27% | 7.16 -3% |
* ... smaller is better
| Fairphone 2 2420 mAh | Sony Xperia XA 2300 mAh | Huawei P9 3000 mAh | Samsung Galaxy A5 2016 2900 mAh | Samsung Galaxy S7 3000 mAh | |
|---|---|---|---|---|---|
| Battery Runtime | 20% | 81% | 169% | 114% | |
| Reader / Idle | 595 | 775 30% | 1514 154% | 2323 290% | 1810 204% |
| H.264 | 342 | 460 35% | 568 66% | 672 96% | 892 161% |
| WiFi v1.3 | 321 | 353 10% | 569 77% | 626 95% | 456 42% |
| Load | 163 | 170 4% | 206 26% | 483 196% | 242 48% |
Pros
Cons
这台手机有着很多很高的标准:原材料的供应商意识到他们的各种责任而不单单是为了利益进行军阀式的统治。良好的工资和工人发言权取代了剥削。血汗工厂被良好的工作环境而取代。将废料进行回收而不是丢弃在垃圾厂。显然,这些良好的条件决定了这台手机不可能便宜,520欧元(约合554美金)的售价几乎是其他类似配置手机的两倍。与其售价不相符的是,买家不会得到一台高端智能手机,而会很明显地发现它是一台基于Android 5.1的中端手机。它除了够用的性能及合适的相机外,没有更多亮点。
Fairphone 2不符合所有的制造业惯例,具有模块化这一简单而独特的卖点。但是,因为其高昂的售价,它将在市场销售上经历一段艰难的时光。
然而,仅仅因为它的价格和够用的性能而降低我们对Fairphone 2的评分是有点。。。嗯-不太公平。与以“传统”方式生产的移动设备不同,事实上,它是没有任何竞争对手的,严格来说,它是无与伦比的。厂商的最终目的不是提供最廉价的设备。价格相比起对于社会及环境有着最高友好度的生产方式而言是次要的。它的价格仅仅是这种生产方式一种结果而已。这也成为了Fairphone 2最大的优势之一: 他促使买家去思考,他们在智能手机上真正应该花多少钱,在工人的权益和非盈利成为供应链的焦点情况下。答案是很明显的。
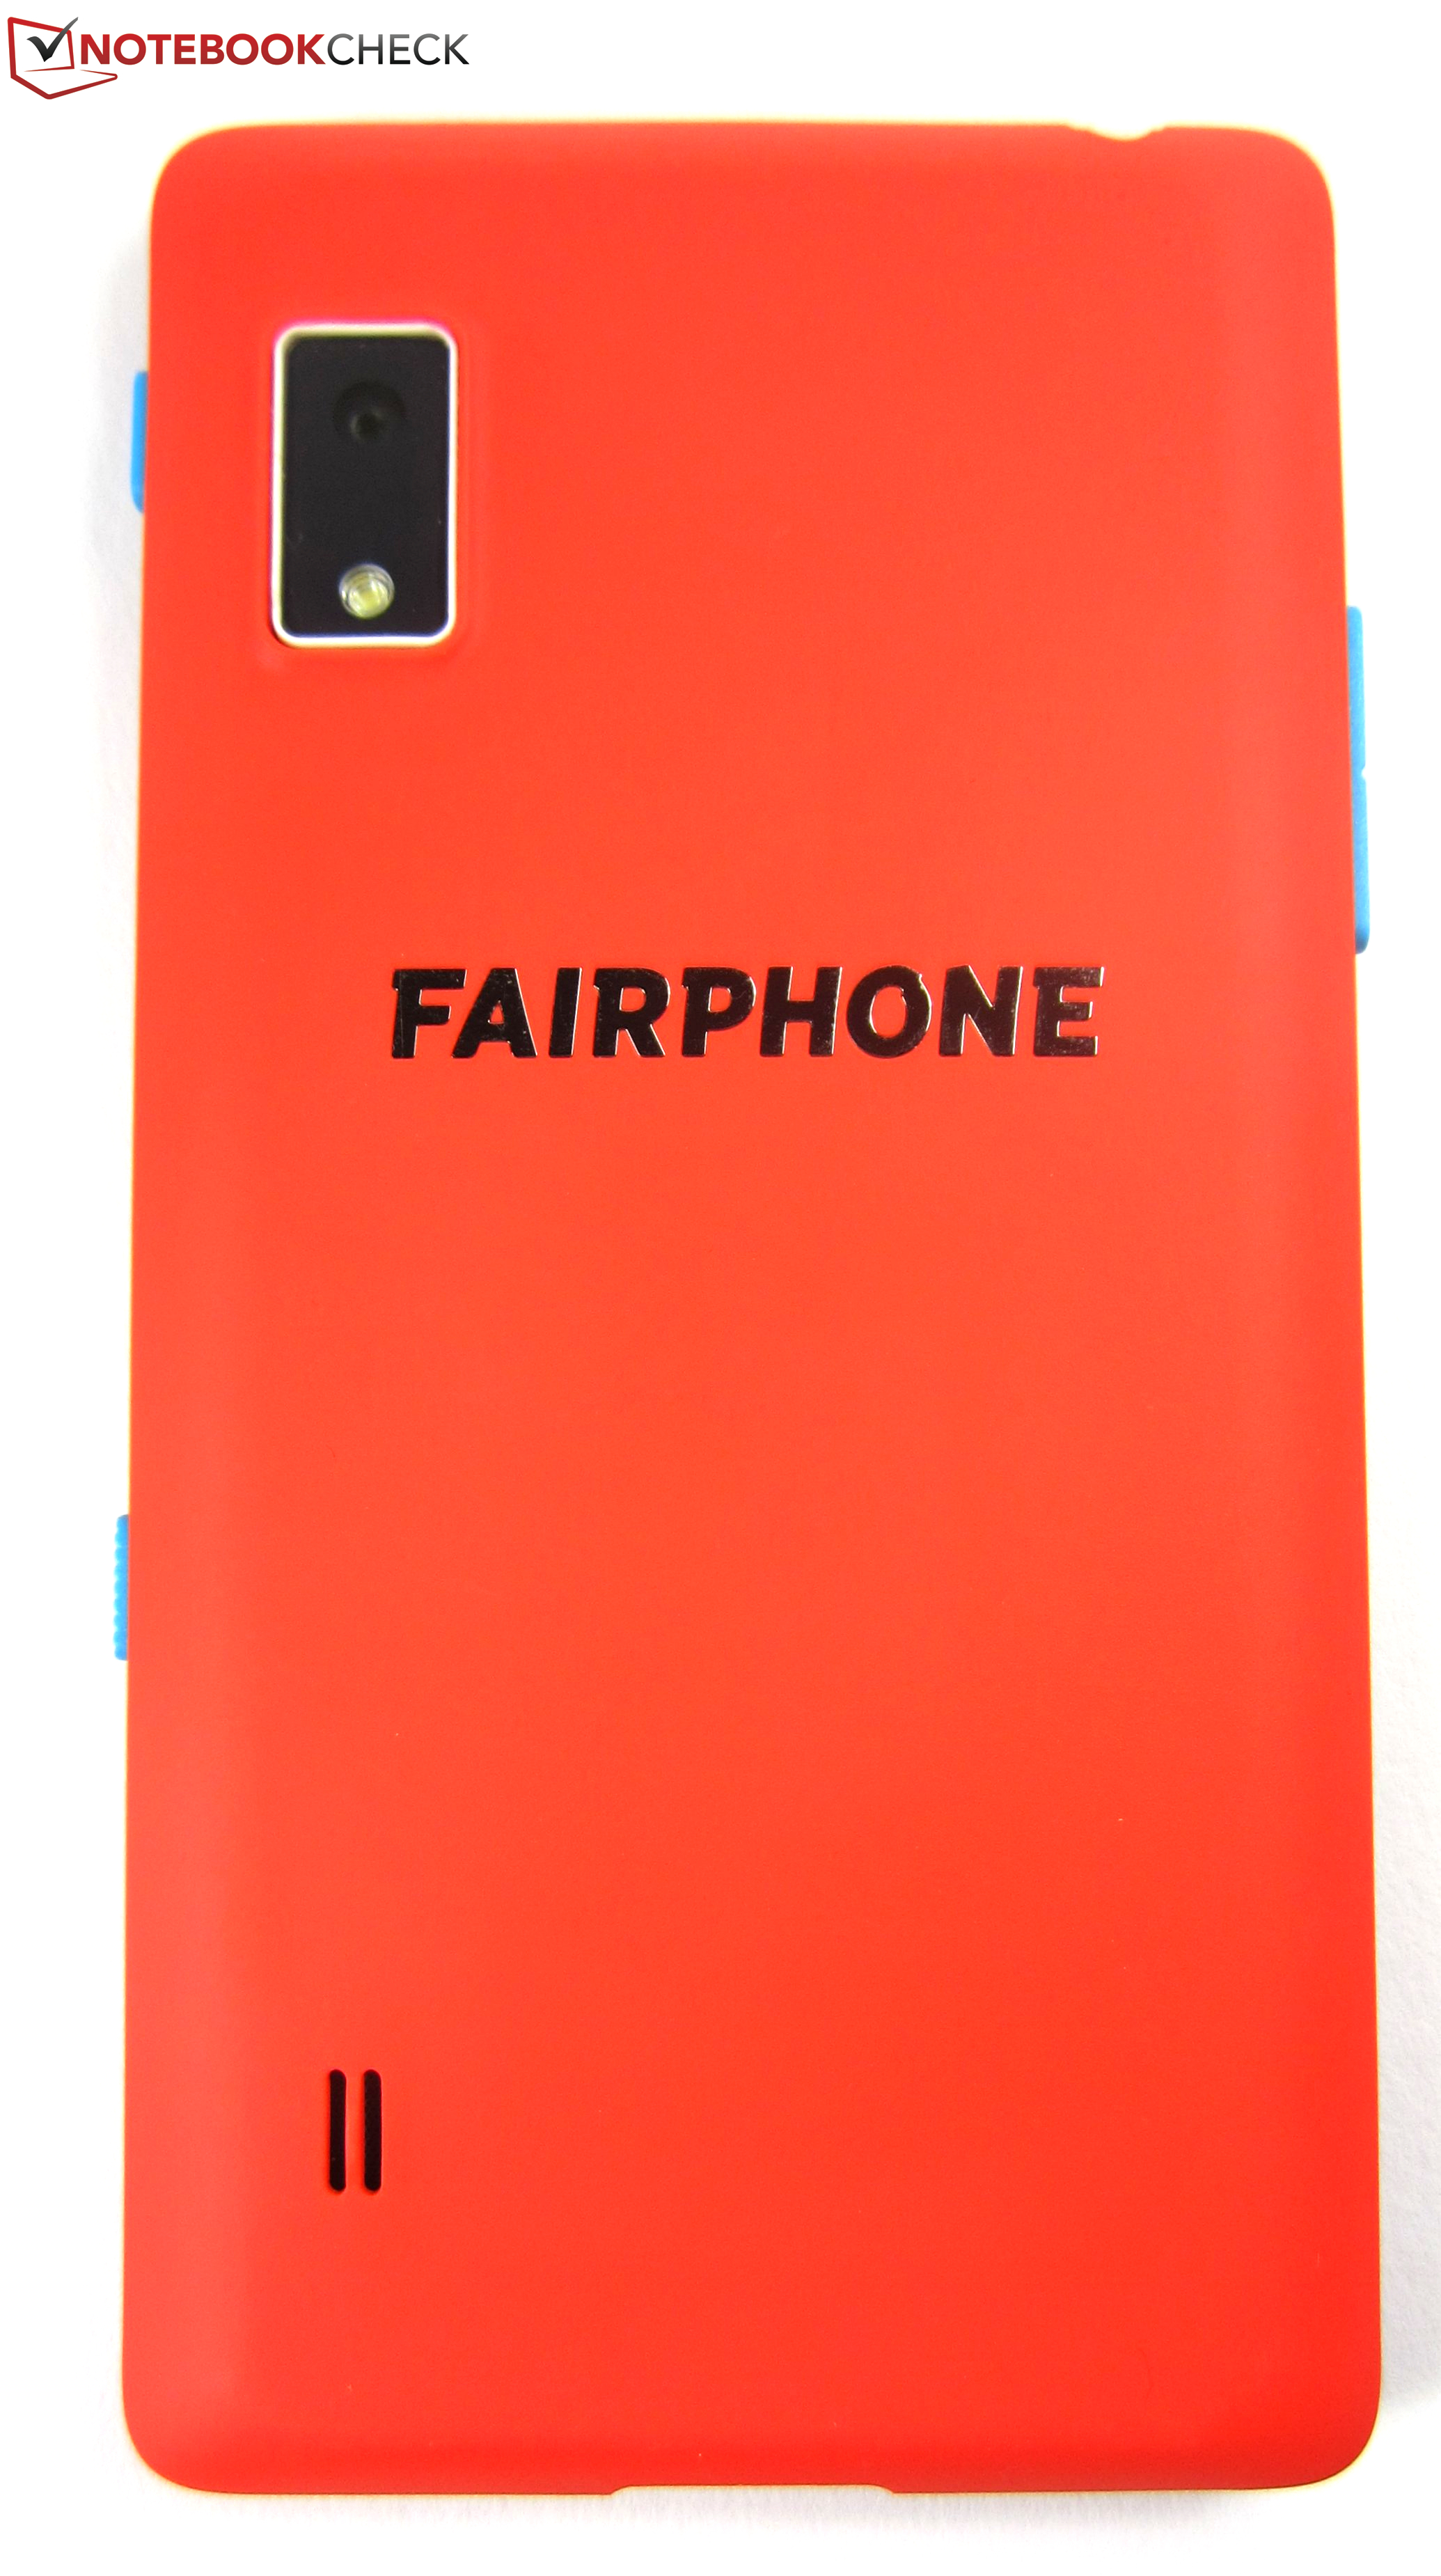
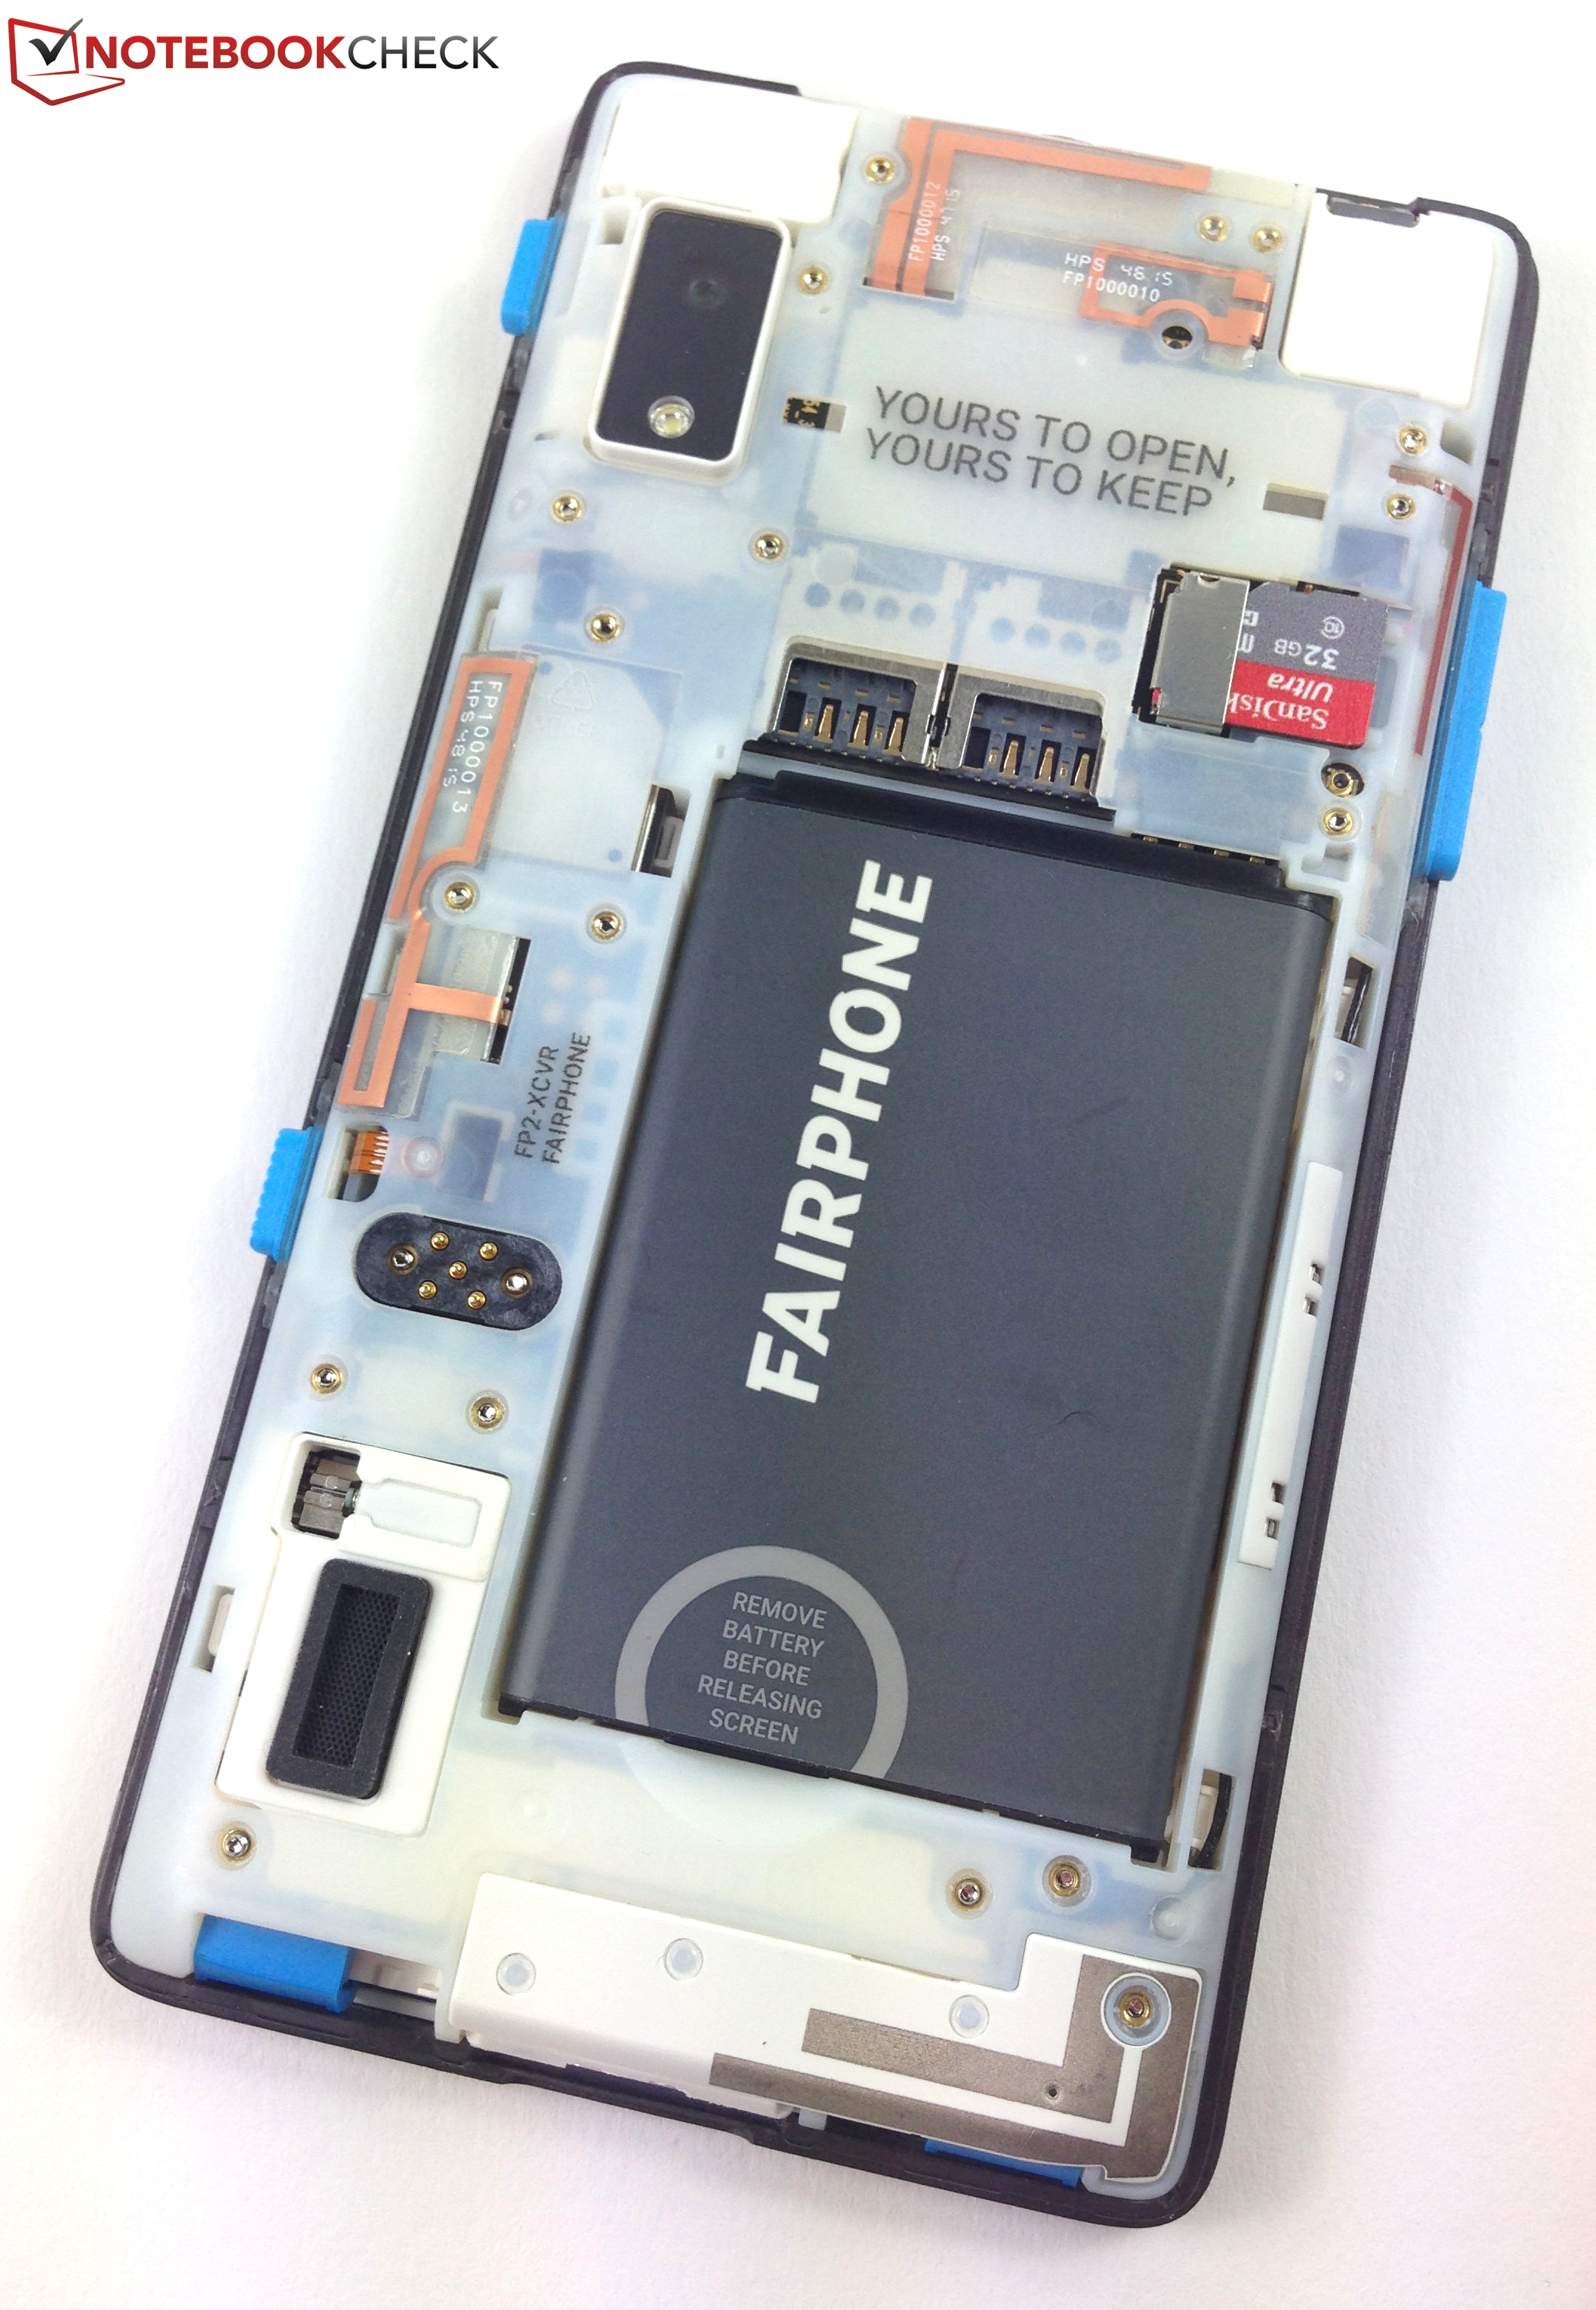
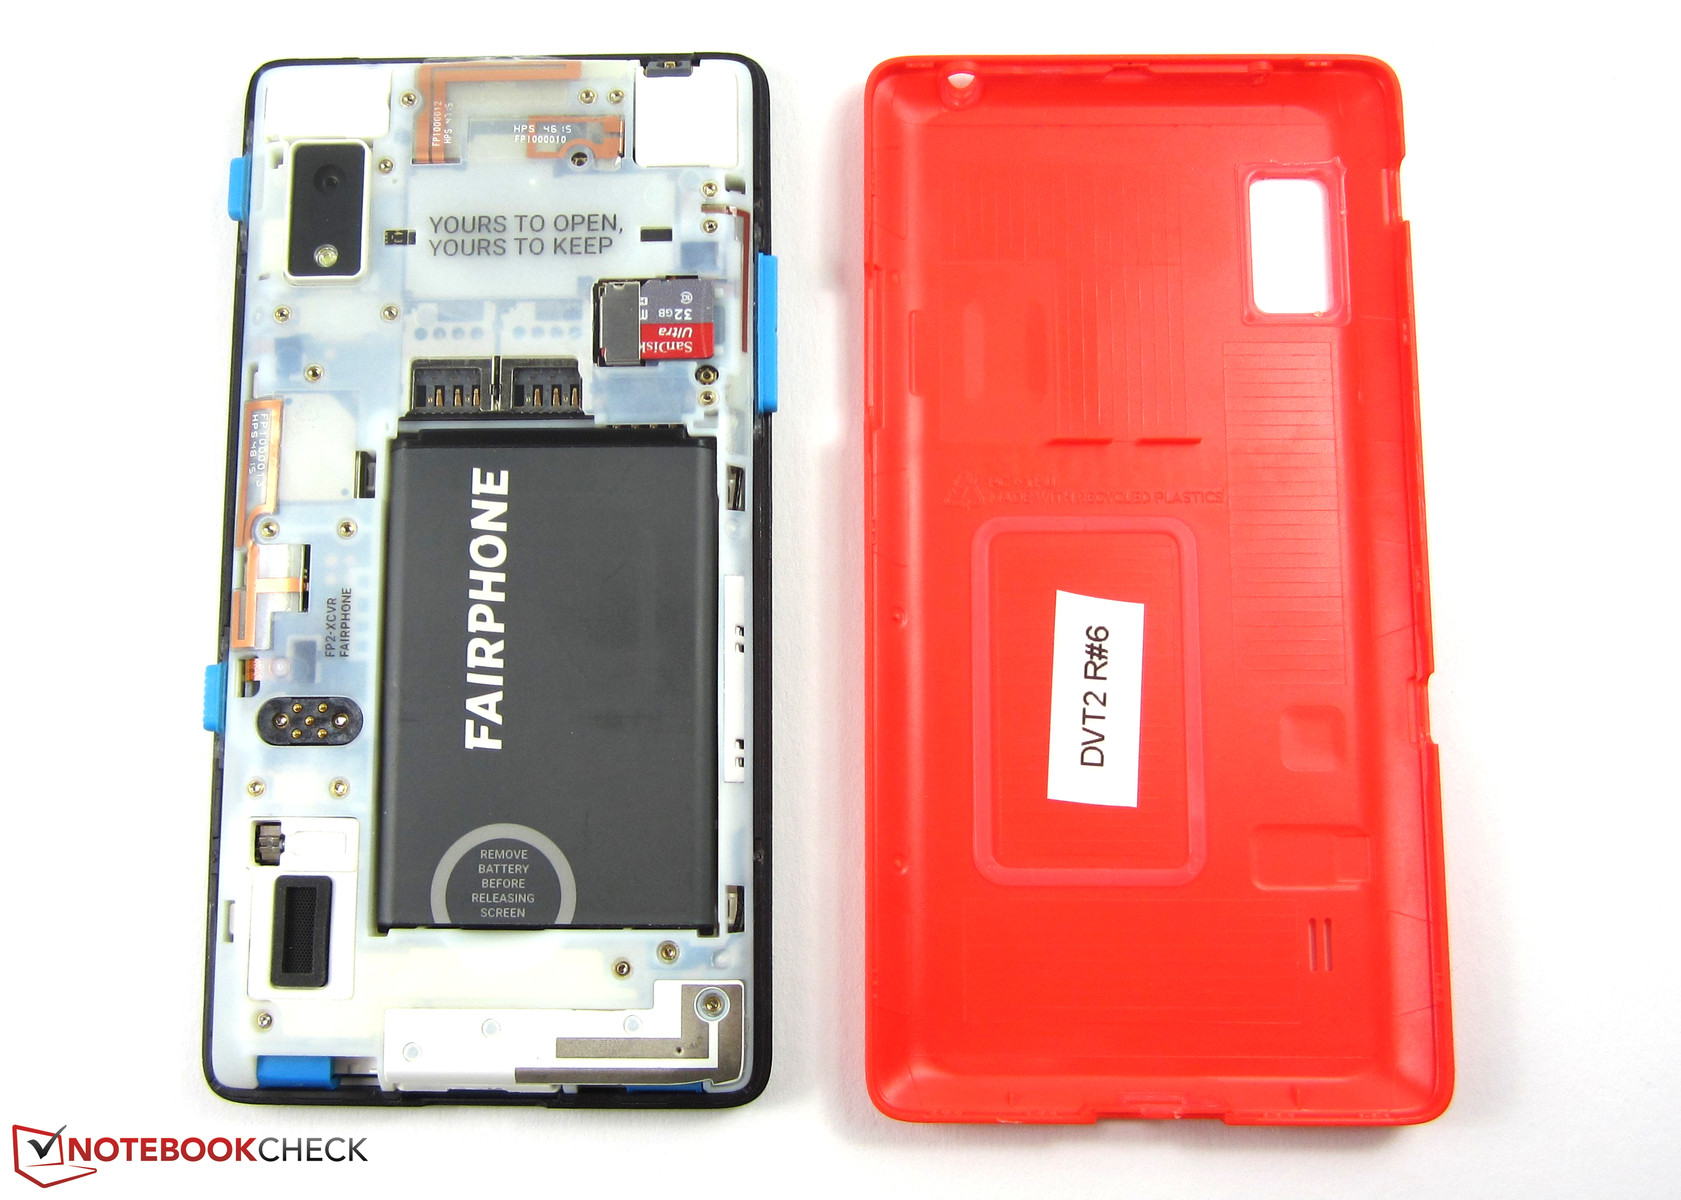
评测样机拥有一项杀手级功能,因此我们将总评提高一分。那就是模块化设计,它使得用户能够很轻松的自己修复手机,甚至可以自行更换硬件或升级。但很明显的是,业界普遍反对这一点,他们希望用户购买一台全新的昂贵的手机,而不仅仅是廉价的硬件升级。因为有着和Fairphone 2一致的理念,所以我们对它很满意。但做出购买决定可以更加简单,毕竟,在配置方面必须做出的一些妥协都是微不足道的。
注:本文是基于完整评测的缩减版本,阅读完整的英文评测,请点击这里。
Fairphone 2
-
11/24/2016 v5.1(old)
Manuel Masiero