 Deutsch
 English
 Español
 Français
 Italiano
 Nederlands
 Polski
 Português
 Русский
 Türkçe
 Svenska
 Chinese
 Magyar
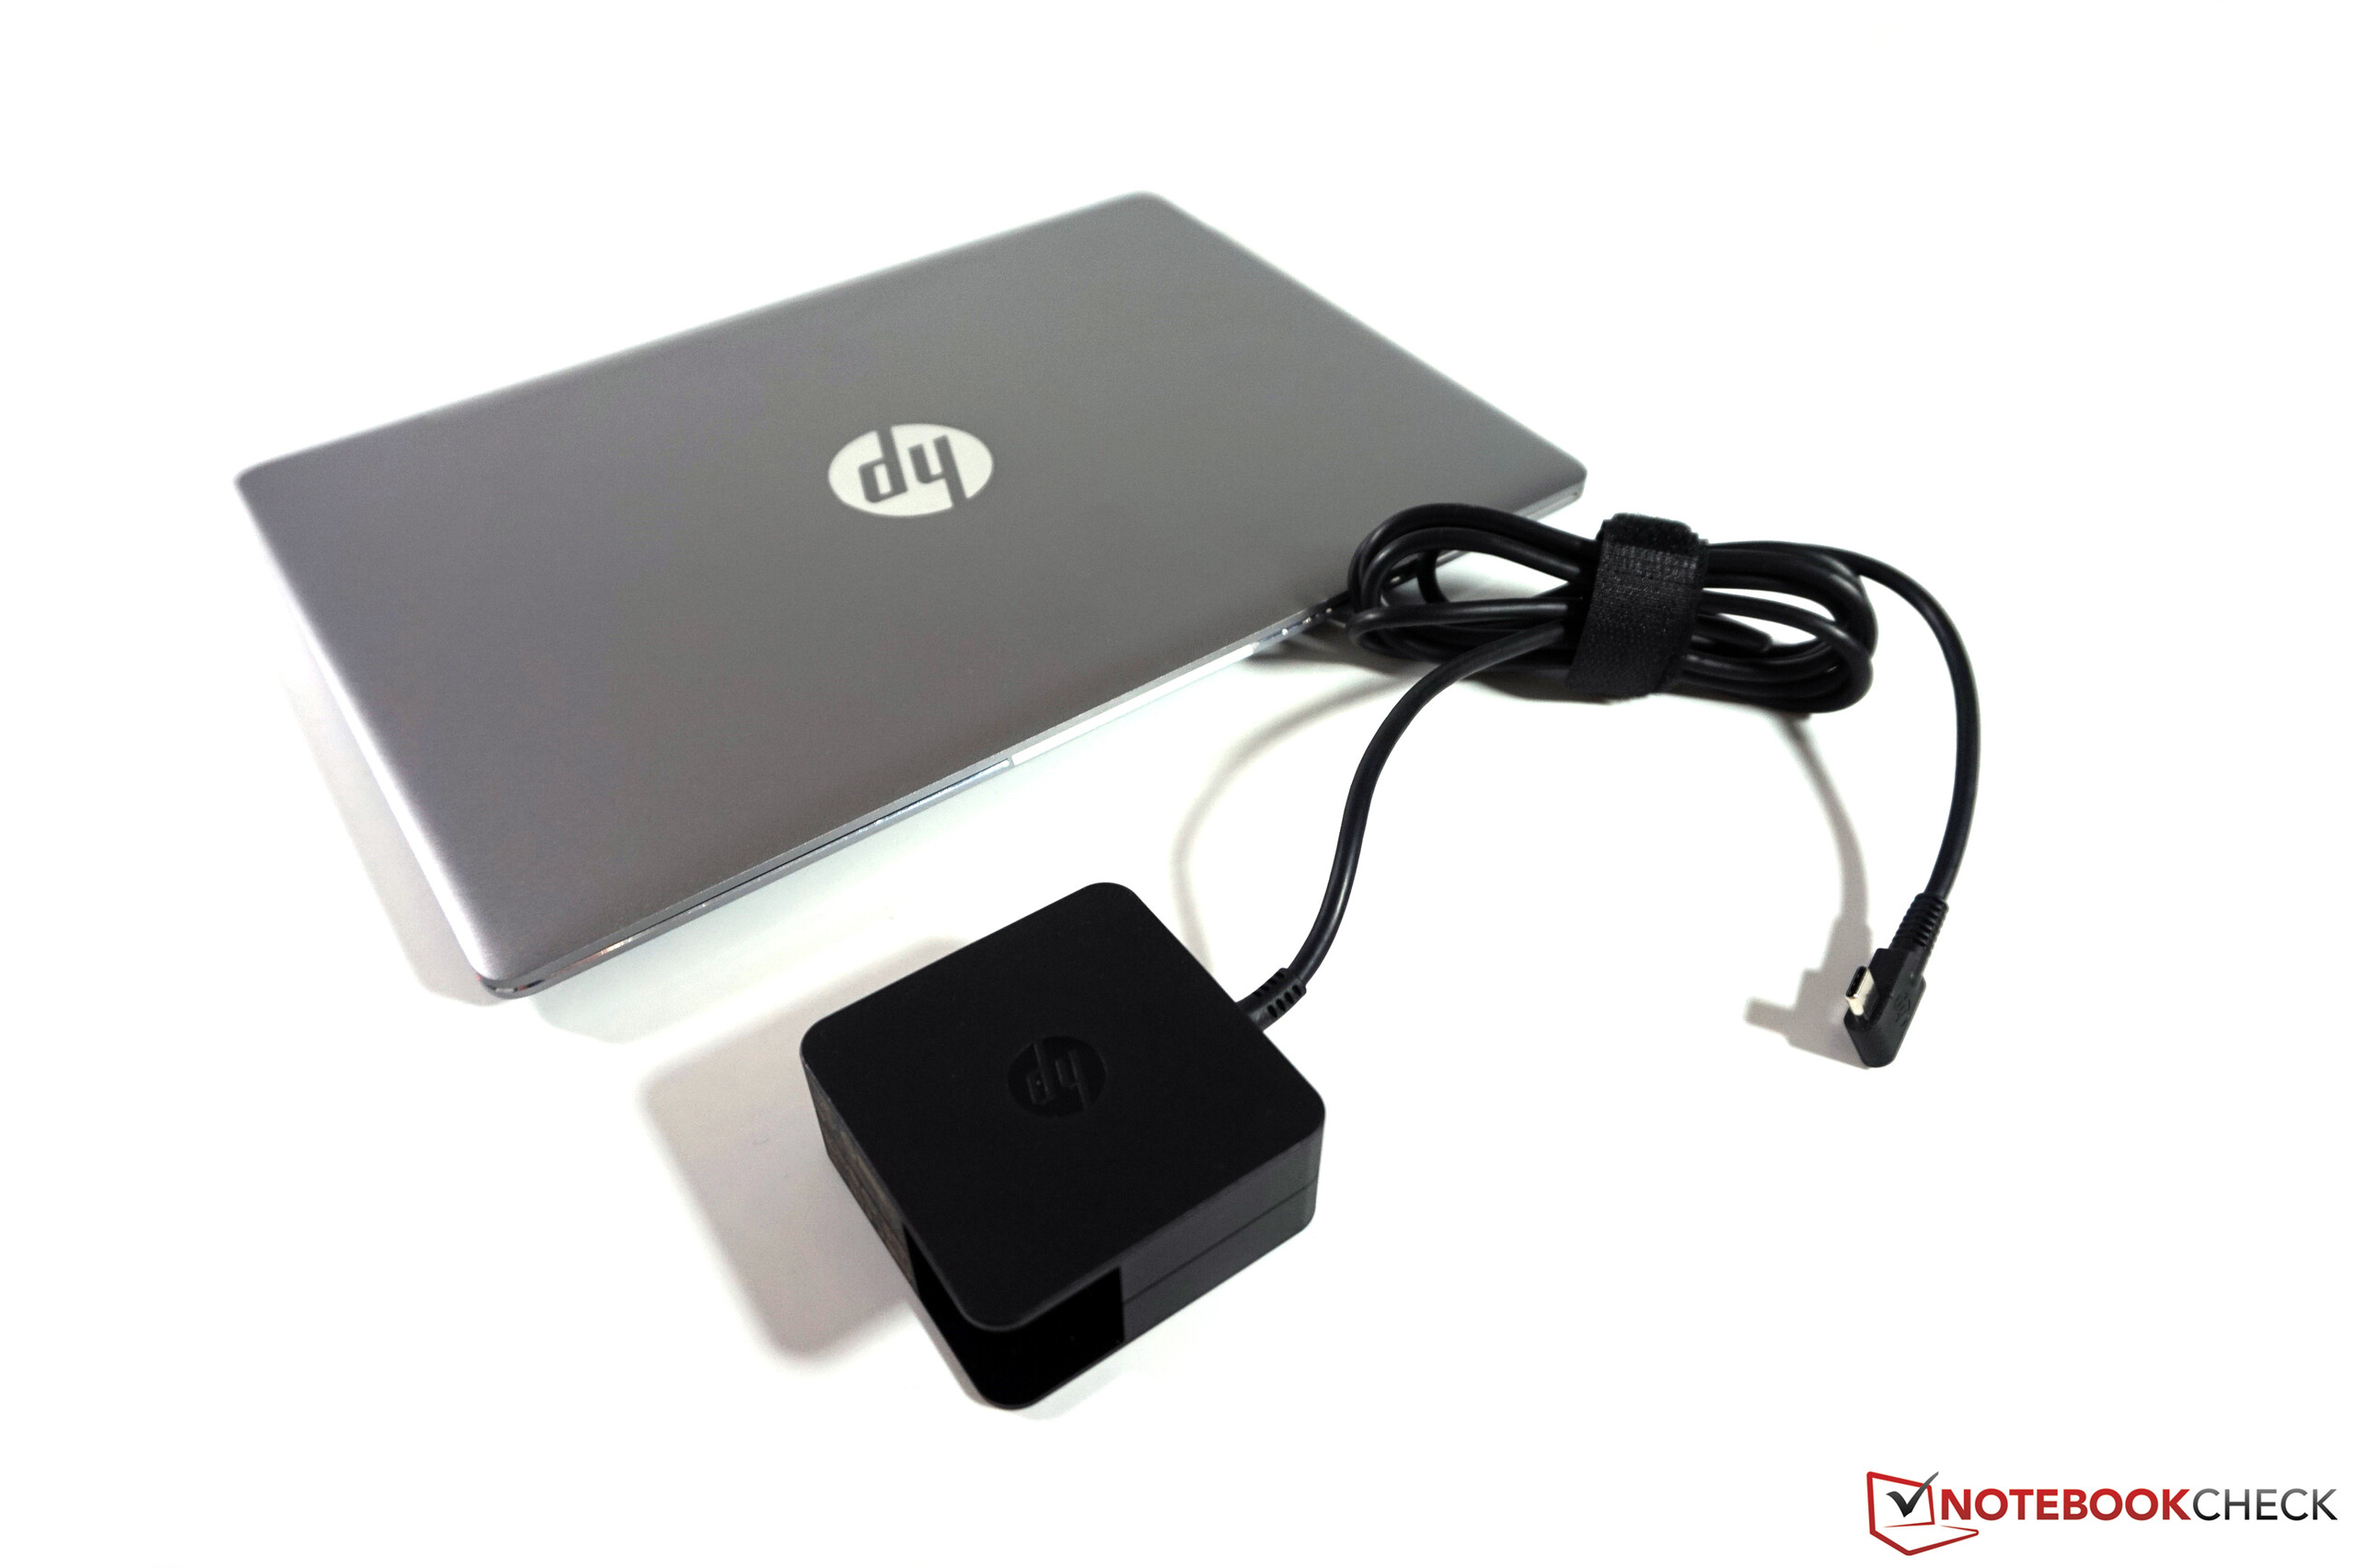
惠普 EliteBook Folio G1 亚笔记本电脑简短评测
| Networking | |
| iperf Server (receive) TCP 1 m 512KB | |
| Dell Latitude 13 7370 | |
| HP EliteBook Folio G1 V1C37EA | |
| iperf Client (transmit) TCP 1 m 512KB | |
| Dell Latitude 13 7370 | |
| HP EliteBook Folio G1 V1C37EA | |
| iperf Server (receive) TCP 1 m | |
| Apple MacBook 12 (Early 2016) 1.1 GHz | |
| iperf Client (transmit) TCP 1 m | |
| Apple MacBook 12 (Early 2016) 1.1 GHz | |
Screen Flickering / PWM (Pulse-Width Modulation)
| Screen flickering / PWM not detected | ||
In comparison: 53 % of all tested devices do not use PWM to dim the display. If PWM was detected, an average of 17900 (minimum: 5 - maximum: 3846000) Hz was measured. | ||
| |||||||||||||||||||||||||
Brightness Distribution: 87 %
Center on Battery: 291 cd/m²
Contrast: 1070:1 (Black: 0.27 cd/m²)
ΔE Color 4.82 | 0.5-29.43 Ø5
ΔE Greyscale 3.84 | 0.57-98 Ø5.3
64.8% sRGB (Argyll 1.6.3 3D)
42.03% AdobeRGB 1998 (Argyll 1.6.3 3D)
45.96% AdobeRGB 1998 (Argyll 2.2.0 3D)
65.2% sRGB (Argyll 2.2.0 3D)
44.45% Display P3 (Argyll 2.2.0 3D)
Gamma: 2.41
| HP EliteBook Folio G1 V1C37EA 12.50, 1920x1080, IPS | Apple MacBook 12 (Early 2016) 1.1 GHz 12.00, 2304x1440, IPS | Asus Zenbook UX305CA-FB055T 13.30, 3200x1800, IPS | Dell Latitude 13 7370 13.30, 1920x1080, IPS | Dell XPS 13-9350 13.30, 1920x1080, IPS | Lenovo ThinkPad X1 Carbon 20FB-005XUS 14.00, 1920x1080, IPS | HP EliteBook Folio 1040 G3 14.00, 2560x1440, IPS | |
|---|---|---|---|---|---|---|---|
| Display | 48% | 32% | 18% | 1% | 30% | 51% | |
| Display P3 Coverage | 44.45 | 66.8 50% | 59.1 33% | 52.2 17% | 44.53 0% | 58.9 33% | 67.9 53% |
| sRGB Coverage | 65.2 | 95.4 46% | 85.5 31% | 78.3 20% | 66.8 2% | 83.1 27% | 96.8 48% |
| AdobeRGB 1998 Coverage | 45.96 | 68 48% | 61 33% | 53.9 17% | 45.97 0% | 60.3 31% | 70 52% |
| Response Times | -28% | -16% | -49% | -32% | -28% | ||
| Response Time Grey 50% / Grey 80% * | 32 ? | 41.2 ? -29% | 38 ? -19% | 50.4 ? -58% | 47.2 ? -48% | 46.4 ? -45% | |
| Response Time Black / White * | 24 ? | 30.4 ? -27% | 27 ? -13% | 33.6 ? -40% | 27.6 ? -15% | 26.4 ? -10% | |
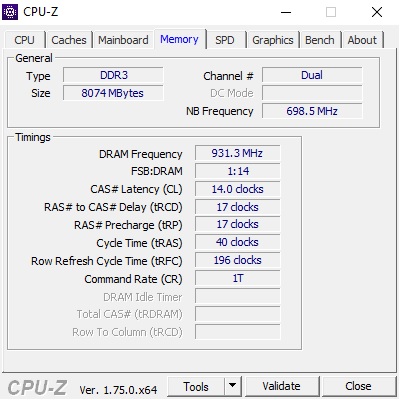
| PWM Frequency | 1429 ? | ||||||
| Screen | 24% | 0% | -2% | 5% | 14% | 9% | |
| Brightness middle | 289 | 387 34% | 390 35% | 261 -10% | 277.5 -4% | 321.7 11% | 327 13% |
| Brightness | 298 | 358 20% | 352 18% | 241 -19% | 276 -7% | 301 1% | 316 6% |
| Brightness Distribution | 87 | 88 1% | 81 -7% | 85 -2% | 88 1% | 89 2% | 87 0% |
| Black Level * | 0.27 | 0.47 -74% | 0.69 -156% | 0.26 4% | 0.191 29% | 0.294 -9% | 0.35 -30% |
| Contrast | 1070 | 823 -23% | 565 -47% | 1004 -6% | 1453 36% | 1094 2% | 934 -13% |
| Colorchecker dE 2000 * | 4.82 | 1.6 67% | 3.04 37% | 4.3 11% | 4.88 -1% | 3.96 18% | 4.39 9% |
| Colorchecker dE 2000 max. * | 10.73 | 4 63% | 7.01 35% | 8.66 19% | 6.69 38% | 7.27 32% | |
| Greyscale dE 2000 * | 3.84 | 1 74% | 2.88 25% | 5.82 -52% | 4.26 -11% | 3.15 18% | 4.69 -22% |
| Gamma | 2.41 91% | 2.26 97% | 2.43 91% | 2.44 90% | 2.59 85% | 2.34 94% | 2.15 102% |
| CCT | 6492 100% | 6680 97% | 6848 95% | 6771 96% | 6562 99% | 7082 92% | 7101 92% |
| Color Space (Percent of AdobeRGB 1998) | 42.03 | 61.6 47% | 55 31% | 49.18 17% | 41.6 -1% | 53.8 28% | 62.52 49% |
| Color Space (Percent of sRGB) | 64.8 | 82.2 27% | 85 31% | 77.84 20% | 65.79 2% | 82.7 28% | 96.71 49% |
| Total Average (Program / Settings) | 15% /
22% | 5% /
4% | -11% /
-4% | 3% /
4% | 4% /
11% | 11% /
13% |
* ... smaller is better
Display Response Times
| ↔ Response Time Black to White | ||
|---|---|---|
| 24 ms ... rise ↗ and fall ↘ combined | ↗ 12.4 ms rise | 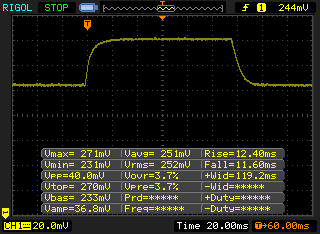 |
| ↘ 11.6 ms fall | ||
| The screen shows good response rates in our tests, but may be too slow for competitive gamers. In comparison, all tested devices range from 0.1 (minimum) to 240 (maximum) ms. » 48 % of all devices are better. This means that the measured response time is worse than the average of all tested devices (21.5 ms). | ||
| ↔ Response Time 50% Grey to 80% Grey | ||
| 32 ms ... rise ↗ and fall ↘ combined | ↗ 14.8 ms rise | 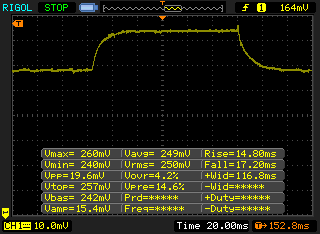 |
| ↘ 17.2 ms fall | ||
| The screen shows slow response rates in our tests and will be unsatisfactory for gamers. In comparison, all tested devices range from 0.2 (minimum) to 636 (maximum) ms. » 36 % of all devices are better. This means that the measured response time is similar to the average of all tested devices (33.7 ms). | ||
| Cinebench R15 | |
| CPU Single 64Bit | |
| HP EliteBook Folio 1040 G3 | |
| Dell XPS 13-9350 | |
| HP EliteBook Folio G1 V1C37EA | |
| Dell Latitude 13 7370 | |
| Asus Zenbook UX305CA-FB055T | |
| Apple MacBook 12 (Early 2016) 1.1 GHz | |
| Apple MacBook 12 (Early 2016) 1.1 GHz | |
| Lenovo ThinkPad X1 Carbon 20FB-005XUS | |
| CPU Multi 64Bit | |
| HP EliteBook Folio 1040 G3 | |
| Lenovo ThinkPad X1 Carbon 20FB-005XUS | |
| Dell XPS 13-9350 | |
| HP EliteBook Folio G1 V1C37EA | |
| Apple MacBook 12 (Early 2016) 1.1 GHz | |
| Asus Zenbook UX305CA-FB055T | |
| Dell Latitude 13 7370 | |
| PCMark 8 | |
| Home Score Accelerated v2 | |
| HP EliteBook Folio 1040 G3 | |
| Lenovo ThinkPad X1 Carbon 20FB-005XUS | |
| Dell Latitude 13 7370 | |
| HP EliteBook Folio G1 V1C37EA | |
| Dell XPS 13-9350 | |
| Asus Zenbook UX305CA-FB055T | |
| Apple MacBook 12 (Early 2016) 1.1 GHz | |
| Creative Score Accelerated v2 | |
| HP EliteBook Folio 1040 G3 | |
| Lenovo ThinkPad X1 Carbon 20FB-005XUS | |
| Dell XPS 13-9350 | |
| Dell Latitude 13 7370 | |
| HP EliteBook Folio G1 V1C37EA | |
| Asus Zenbook UX305CA-FB055T | |
| Work Score Accelerated v2 | |
| HP EliteBook Folio 1040 G3 | |
| Dell Latitude 13 7370 | |
| HP EliteBook Folio G1 V1C37EA | |
| Dell XPS 13-9350 | |
| Lenovo ThinkPad X1 Carbon 20FB-005XUS | |
| Apple MacBook 12 (Early 2016) 1.1 GHz | |
| Asus Zenbook UX305CA-FB055T | |
| PCMark 8 Home Score Accelerated v2 | 3037 points | |
| PCMark 8 Creative Score Accelerated v2 | 3430 points | |
| PCMark 8 Work Score Accelerated v2 | 4146 points | |
Help | ||
| HP EliteBook Folio G1 V1C37EA Samsung SM951 MZVPV256 m.2 | Apple MacBook 12 (Early 2016) 1.1 GHz Apple SSD AP0256 | Asus Zenbook UX305CA-FB055T Micron M600 MTFDDAV512MBF M.2 | Dell Latitude 13 7370 Toshiba NVMe THNSN5256GPU7 | Dell XPS 13-9350 Samsung PM951 NVMe MZ-VLV256D | Lenovo ThinkPad X1 Carbon 20FB-005XUS Samsung SM951 MZVPV256 m.2 | HP EliteBook Folio 1040 G3 Samsung SM951 MZVPV256HDGL m.2 PCI-e | |
|---|---|---|---|---|---|---|---|
| CrystalDiskMark 3.0 | -62% | -46% | -6% | -27% | 12% | 22% | |
| Read Seq | 1482 | 754 -49% | 475.2 -68% | 1354 -9% | 1097 -26% | 1720 16% | 1649 11% |
| Write Seq | 1232 | 638 -48% | 423.7 -66% | 1132 -8% | 307.7 -75% | 1263 3% | 1265 3% |
| Read 4k | 46.96 | 14.6 -69% | 28.57 -39% | 42.13 -10% | 38.52 -18% | 49.65 6% | 53.3 14% |
| Write 4k | 100.7 | 20.5 -80% | 90.7 -10% | 105.8 5% | 113 12% | 123 22% | 159.9 59% |

| 3DMark 11 | |
| 1280x720 Performance | |
| Dell XPS 13-9350 | |
| HP EliteBook Folio 1040 G3 | |
| Lenovo ThinkPad X1 Carbon 20FB-005XUS | |
| HP EliteBook Folio G1 V1C37EA | |
| Apple MacBook 12 (Early 2016) 1.1 GHz | |
| Asus Zenbook UX305CA-FB055T | |
| Dell Latitude 13 7370 | |
| 1280x720 Performance GPU | |
| Dell XPS 13-9350 | |
| HP EliteBook Folio 1040 G3 | |
| HP EliteBook Folio G1 V1C37EA | |
| Lenovo ThinkPad X1 Carbon 20FB-005XUS | |
| Apple MacBook 12 (Early 2016) 1.1 GHz | |
| Asus Zenbook UX305CA-FB055T | |
| Dell Latitude 13 7370 | |
| 3DMark | |
| 1280x720 Cloud Gate Standard Score | |
| Dell XPS 13-9350 | |
| Lenovo ThinkPad X1 Carbon 20FB-005XUS | |
| HP EliteBook Folio 1040 G3 | |
| HP EliteBook Folio G1 V1C37EA | |
| Apple MacBook 12 (Early 2016) 1.1 GHz | |
| Dell Latitude 13 7370 | |
| Asus Zenbook UX305CA-FB055T | |
| 1280x720 Cloud Gate Standard Graphics | |
| Dell XPS 13-9350 | |
| HP EliteBook Folio G1 V1C37EA | |
| Lenovo ThinkPad X1 Carbon 20FB-005XUS | |
| HP EliteBook Folio 1040 G3 | |
| Apple MacBook 12 (Early 2016) 1.1 GHz | |
| Dell Latitude 13 7370 | |
| Asus Zenbook UX305CA-FB055T | |
| 1920x1080 Fire Strike Score | |
| Dell XPS 13-9350 | |
| HP EliteBook Folio 1040 G3 | |
| HP EliteBook Folio G1 V1C37EA | |
| Lenovo ThinkPad X1 Carbon 20FB-005XUS | |
| Apple MacBook 12 (Early 2016) 1.1 GHz | |
| Dell Latitude 13 7370 | |
| Asus Zenbook UX305CA-FB055T | |
| 1920x1080 Fire Strike Graphics | |
| Dell XPS 13-9350 | |
| HP EliteBook Folio 1040 G3 | |
| HP EliteBook Folio G1 V1C37EA | |
| Lenovo ThinkPad X1 Carbon 20FB-005XUS | |
| Apple MacBook 12 (Early 2016) 1.1 GHz | |
| Dell Latitude 13 7370 | |
| Asus Zenbook UX305CA-FB055T | |
| 3DMark 11 Performance | 1360 points | |
| 3DMark Cloud Gate Standard Score | 5257 points | |
| 3DMark Fire Strike Score | 780 points | |
Help | ||
| low | med. | high | ultra | |
| Tomb Raider (2013) | 54.4 | 22.8 | 15.9 | |
| BioShock Infinite (2013) | 49.9 | 24.8 | 15.3 | |
| The Witcher 3 (2015) | 12.8 |
(±) The maximum temperature on the upper side is 42.7 °C / 109 F, compared to the average of 35.9 °C / 97 F, ranging from 21.4 to 59 °C for the class Subnotebook.
(-) The bottom heats up to a maximum of 45.8 °C / 114 F, compared to the average of 39.4 °C / 103 F
(+) In idle usage, the average temperature for the upper side is 29.4 °C / 85 F, compared to the device average of 30.7 °C / 87 F.
(+) The palmrests and touchpad are reaching skin temperature as a maximum (32.8 °C / 91 F) and are therefore not hot.
(-) The average temperature of the palmrest area of similar devices was 28.3 °C / 82.9 F (-4.5 °C / -8.1 F).
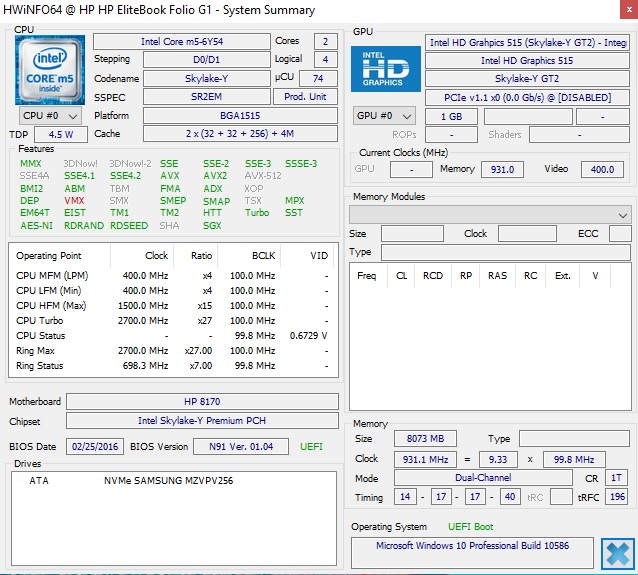
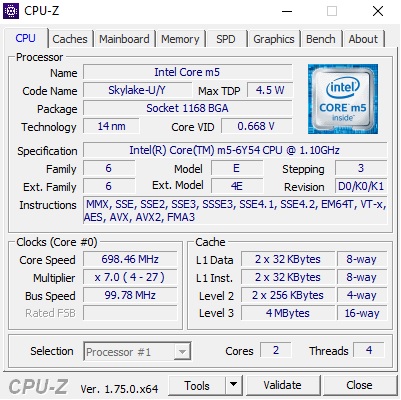
| HP EliteBook Folio G1 V1C37EA 6Y54, HD Graphics 515 | Apple MacBook 12 (Early 2016) 1.1 GHz 6Y30, HD Graphics 515 | Asus Zenbook UX305CA-FB055T 6Y75, HD Graphics 515 | Dell Latitude 13 7370 6Y57, HD Graphics 515 | Dell XPS 13-9350 6200U, HD Graphics 520 | Lenovo ThinkPad X1 Carbon 20FB-005XUS 6300U, HD Graphics 520 | HP EliteBook Folio 1040 G3 6300U, HD Graphics 520 | |
|---|---|---|---|---|---|---|---|
| Heat | 4% | 16% | -1% | 1% | 11% | 1% | |
| Maximum Upper Side * | 42.7 | 39 9% | 39.1 8% | 43.2 -1% | 45.2 -6% | 40 6% | 43.2 -1% |
| Maximum Bottom * | 45.8 | 44 4% | 38.7 16% | 50.8 -11% | 45.2 1% | 42.8 7% | 47.1 -3% |
| Idle Upper Side * | 32.1 | 32 -0% | 26 19% | 30.5 5% | 30.4 5% | 26.6 17% | 30.5 5% |
| Idle Bottom * | 32.3 | 32 1% | 25.7 20% | 31.2 3% | 31.2 3% | 27.4 15% | 31.5 2% |
* ... smaller is better
| Off / Standby | |
| Idle | |
| Load |
|
| HP EliteBook Folio G1 V1C37EA 6Y54, HD Graphics 515, 1920x1080 | Apple MacBook 12 (Early 2016) 1.1 GHz 6Y30, HD Graphics 515, 2304x1440 | Asus Zenbook UX305CA-FB055T 6Y75, HD Graphics 515, 3200x1800 | Dell Latitude 13 7370 6Y57, HD Graphics 515, 1920x1080 | Lenovo ThinkPad X1 Carbon 20FB-005XUS 6300U, HD Graphics 520, 1920x1080 | HP EliteBook Folio 1040 G3 6300U, HD Graphics 520, 2560x1440 | |
|---|---|---|---|---|---|---|
| Power Consumption | 23% | -4% | -4% | -36% | -54% | |
| Idle Minimum * | 4.3 | 2.7 37% | 4.2 2% | 5 -16% | 7.6 -77% | 6.3 -47% |
| Idle Average * | 6 | 2.7 55% | 8.4 -40% | 7.5 -25% | 9 -50% | 9.4 -57% |
| Idle Maximum * | 6.4 | 7.2 -13% | 8.9 -39% | 8 -25% | 9.6 -50% | 10.1 -58% |
| Load Average * | 22.7 | 22 3% | 15.9 30% | 15.3 33% | 24.5 -8% | 33.3 -47% |
| Load Maximum * | 31.2 | 20.5 34% | 22.5 28% | 26.8 14% | 30.3 3% | 49.5 -59% |
* ... smaller is better
| HP EliteBook Folio G1 V1C37EA 38 Wh | Apple MacBook 12 (Early 2016) 1.1 GHz 41.4 Wh | Asus Zenbook UX305CA-FB055T 45 Wh | Dell Latitude 13 7370 34 Wh | Dell XPS 13-9350 56 Wh | Lenovo ThinkPad X1 Carbon 20FB-005XUS 52 Wh | HP EliteBook Folio 1040 G3 45.6 Wh | |
|---|---|---|---|---|---|---|---|
| Battery Runtime | 39% | 32% | 7% | 25% | 15% | -11% | |
| Reader / Idle | 526 | 1013 93% | 588 12% | 782 49% | 776 48% | 530 1% | |
| H.264 | 413 | 512 24% | 418 1% | 391 -5% | 339 -18% | ||
| WiFi v1.3 | 355 | 501 41% | 402 13% | 367 3% | 451 27% | 411 16% | 309 -13% |
| Load | 152 | 231 52% | 182 20% | 176 16% | 150 -1% | 123 -19% | 131 -14% |
Pros
Cons
我们在评测开始时提出了惠普EliteBook Folio G1究竟能否适应办公需要的问题。在实际使用两周之后,我们可以肯定地回答:是。它有足够的系统性能,优秀的屏幕和可以适应长时间打字的出色键盘来证明自己。
这样一台紧凑的被动散热设备显然并能适应所有的用户。相比尺寸更大的商务设备它显然会受到不少限制,从接口数量、安全功能到持续负载下的性能。这台轻巧设备的被动散热很快就会达到极限。不过它的性能完全可以满足日常办公应用的需要。
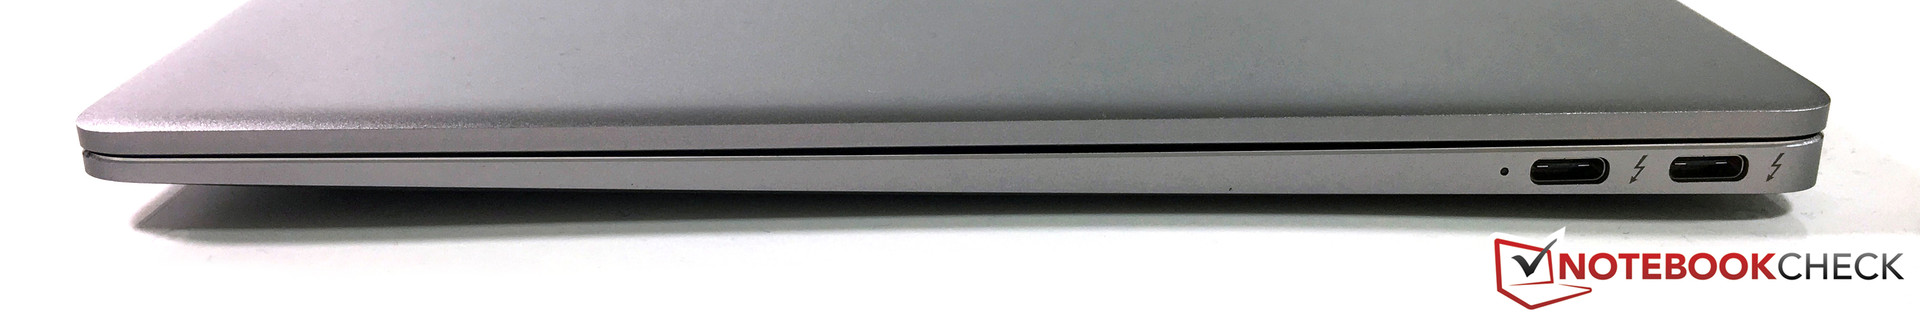
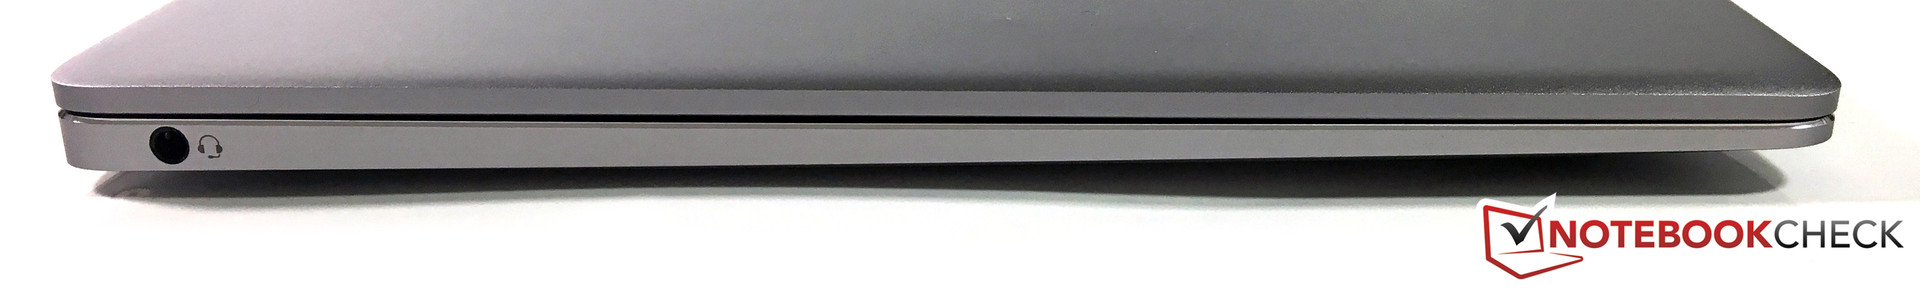
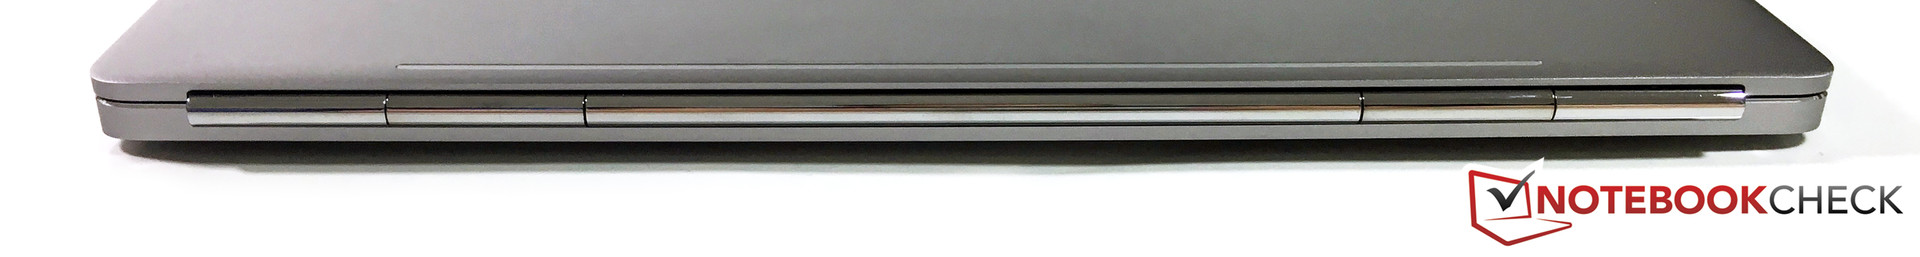
整体上,我们对这台设备的整体表现十分满意,但是EliteBook Folio G1还不完美。它出色的机身受到了较弱的转轴的影响。它只提供了三个接口,而重要的USB-A转接器也没有附带。它在功耗上也还有改进的空间。缺少安全锁对于一些用户来说也会是个致命的问题。
惠普EliteBook Folio G1是一台非常优秀的设备,不过你需要注意它的弱点。如果你正在寻找一台超便携设备,需要安静的运行和出色的键盘的话,毫无疑问它将是你最佳的选择。
和竞争对手的比较并不简单,因为它们在我们测试中都得到了不错的分数,同时价位也十分相近。因此你必须十分清楚自己需要的是什么。我们首先将会对比两台最小巧的设备,EliteBook Folio G1和MacBook 12。如果你主要需要一台个人设备,那么Apple的这台笔记本电脑提供了更好的屏幕,更好的触控板和更长的电池续航。EliteBook Folio G1搭配的磨砂屏幕、可选拓展坞以及更优秀的键盘则更加适合工作。惠普同时提供了三年质保,因此它的性价比更高一筹。
主动散热式的商务设备通常更厚重,但提供了更多的接口和更强的性能,特别是在持续负载下。如果你需要一台尽可能便携、安静的设备的话,那么Folio G1将是个不错的选择。
注:本文是基于完整评测的缩减版本,阅读完整的英文评测,请点击这里。
HP EliteBook Folio G1 V1C37EA
-
06/09/2016 v5.1(old)
Andreas Osthoff
Pricecompare
