 Deutsch
 English
 Español
 Français
 Italiano
 Nederlands
 Polski
 Português
 Русский
 Türkçe
 Svenska
 Chinese
 Magyar
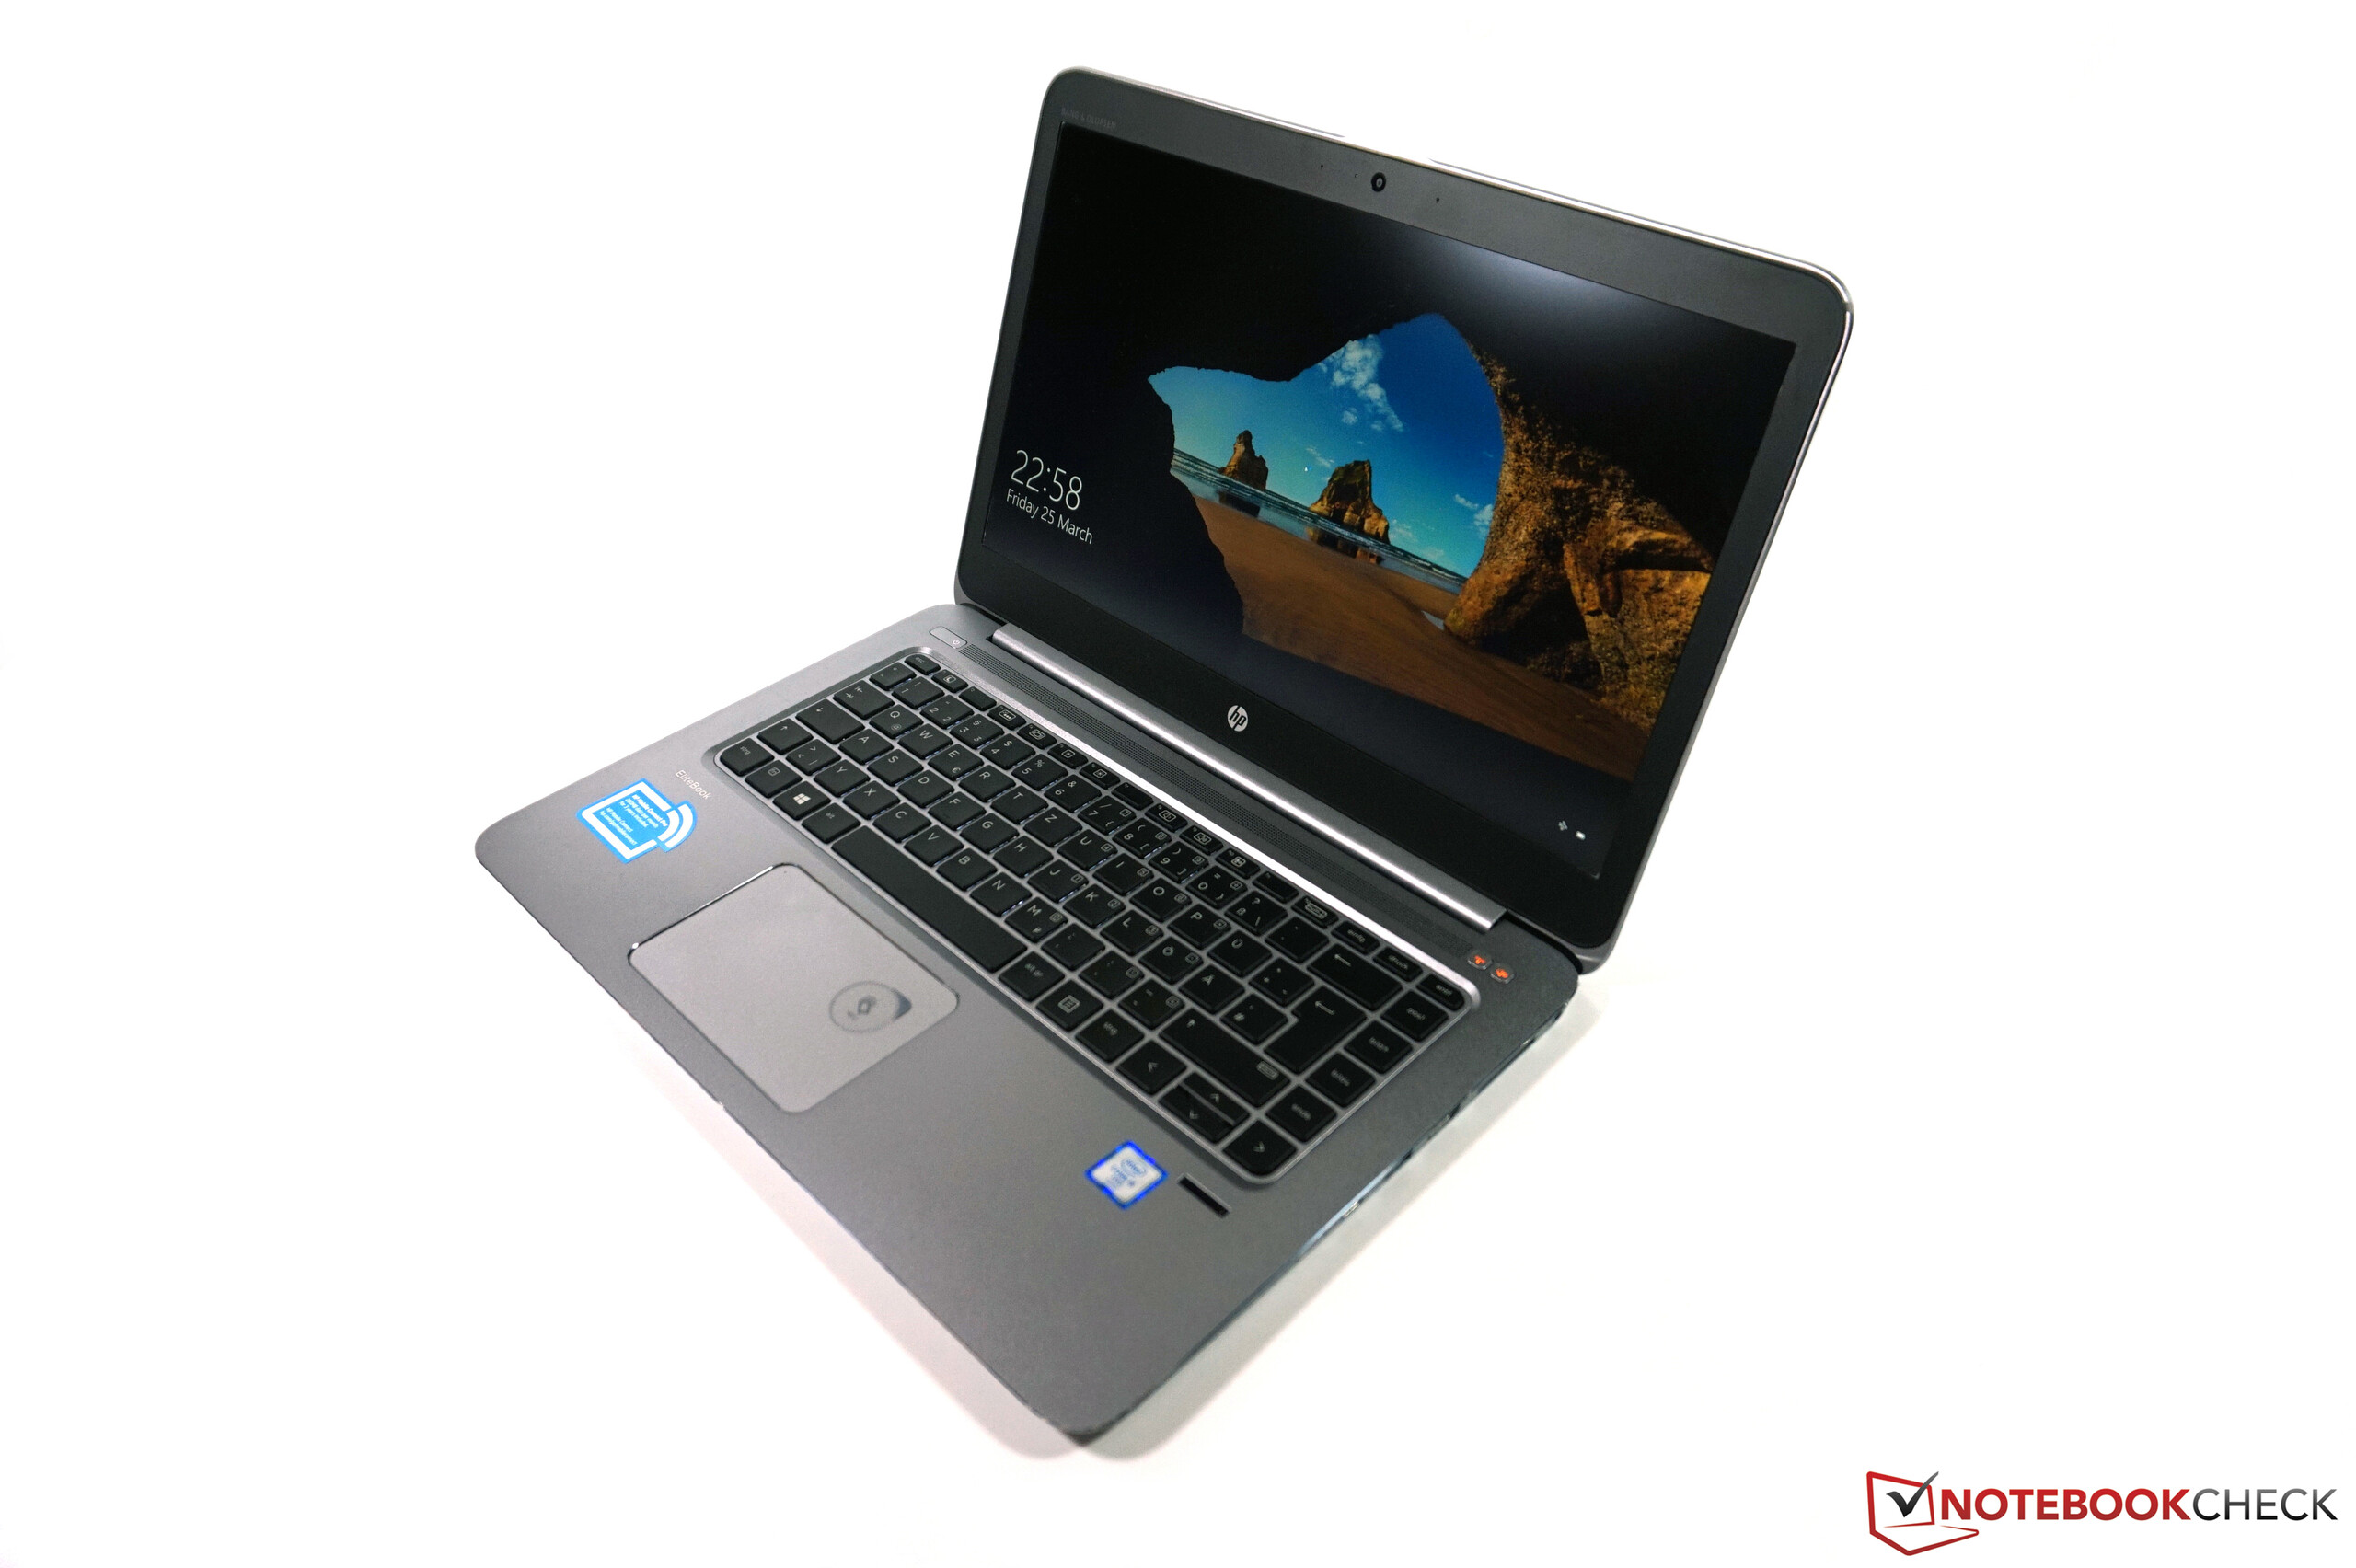
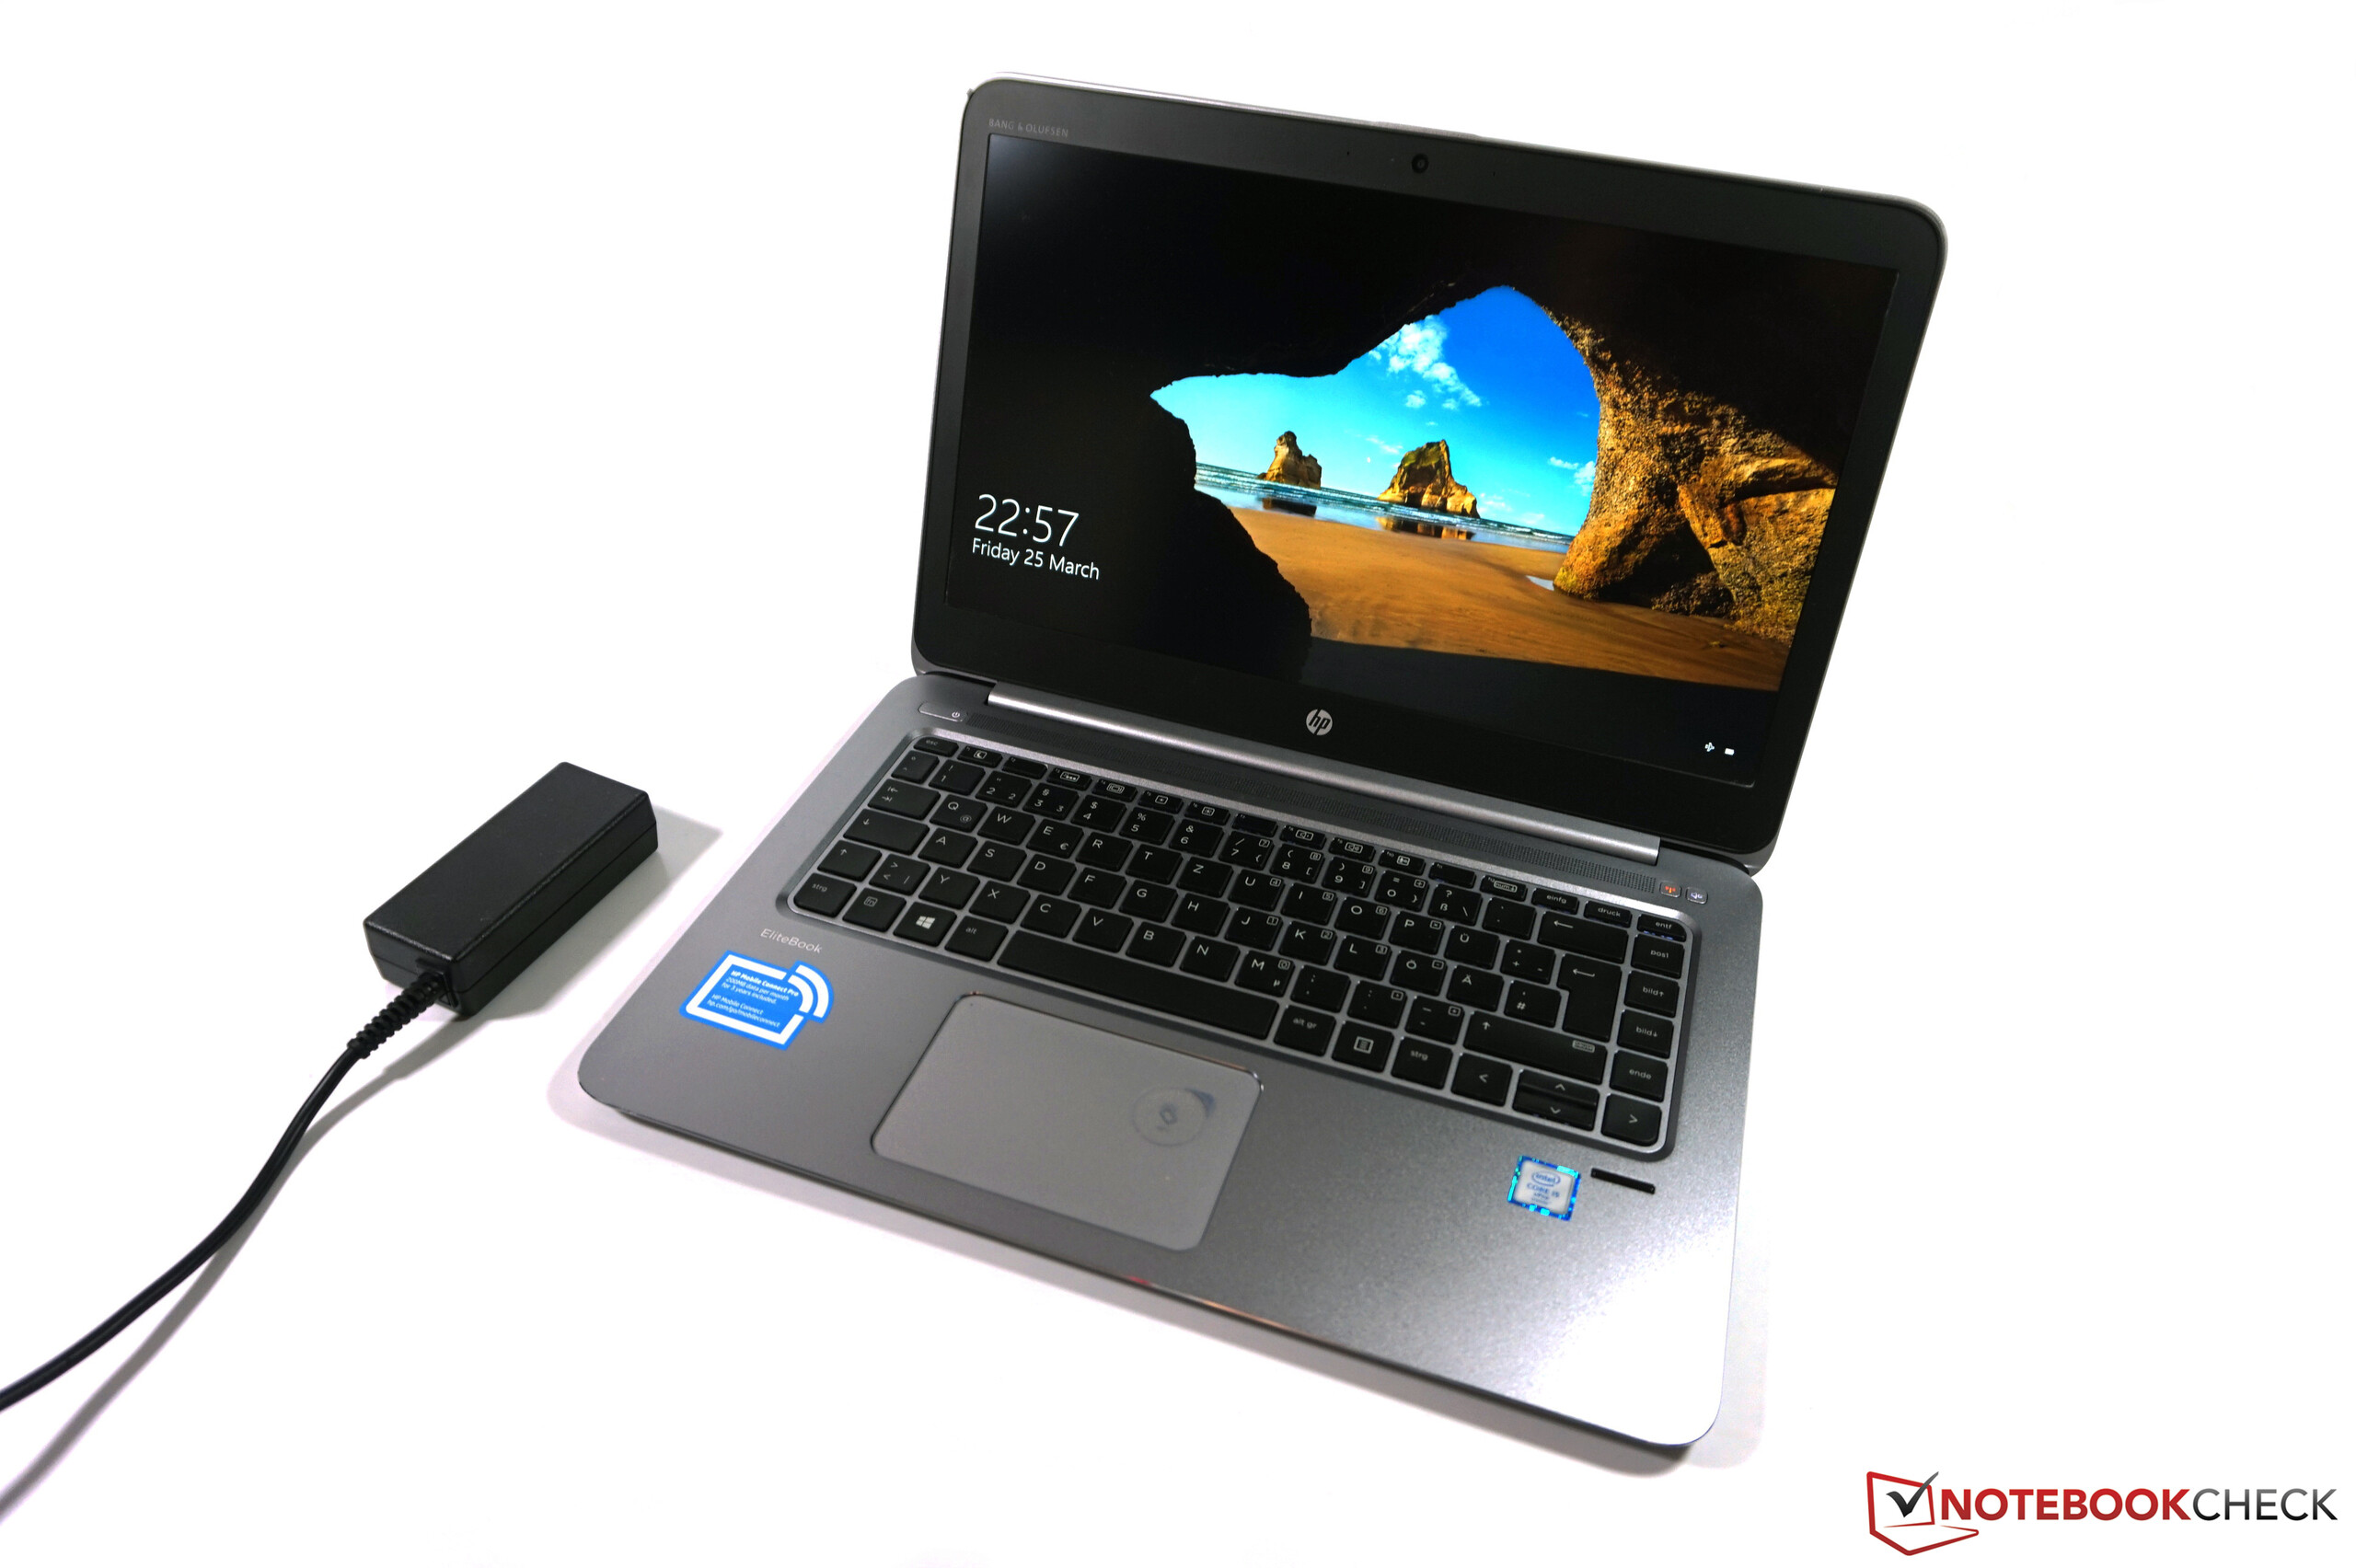
惠普 EliteBook Folio 1040 G3 笔记本电脑简短评测
| |||||||||||||||||||||||||
Brightness Distribution: 87 %
Center on Battery: 324 cd/m²
Contrast: 934:1 (Black: 0.35 cd/m²)
ΔE Color 4.39 | 0.5-29.43 Ø5
ΔE Greyscale 4.69 | 0.57-98 Ø5.3
96.71% sRGB (Argyll 1.6.3 3D)
62.52% AdobeRGB 1998 (Argyll 1.6.3 3D)
70% AdobeRGB 1998 (Argyll 2.2.0 3D)
96.8% sRGB (Argyll 2.2.0 3D)
67.9% Display P3 (Argyll 2.2.0 3D)
Gamma: 2.15
| HP EliteBook Folio 1040 G3 2560x1440, IPS | Lenovo ThinkPad X1 Carbon 20FB003RGE 2560x1440, IPS | Lenovo ThinkPad T460s-20FA003GGE 2560x1440, IPS-Panel | Dell Latitude 14 7000 Series E7470 2560x1440, IPS | HP EliteBook 840 G3 T9X23ET 2560x1440, | HP EliteBook Folio 1040 G2 1920x1080, IPS | |
|---|---|---|---|---|---|---|
| Display | -2% | 1% | -1% | 1% | -2% | |
| Display P3 Coverage | 67.9 | 66.7 -2% | 68.7 1% | 67.2 -1% | 68.2 0% | 66.1 -3% |
| sRGB Coverage | 96.8 | 94.7 -2% | 98.1 1% | 95.9 -1% | 98.3 2% | 94.8 -2% |
| AdobeRGB 1998 Coverage | 70 | 68.4 -2% | 70.4 1% | 69.3 -1% | 70.3 0% | 68.3 -2% |
| Response Times | 7% | 6% | -3% | -7% | ||
| Response Time Grey 50% / Grey 80% * | 46.4 ? | 44 ? 5% | 35.6 ? 23% | 48 ? -3% | 45 ? 3% | |
| Response Time Black / White * | 26.4 ? | 24 ? 9% | 29.2 ? -11% | 27 ? -2% | 31 ? -17% | |
| PWM Frequency | 220 ? | 220 ? | ||||
| Screen | 6% | -7% | 15% | 6% | 5% | |
| Brightness middle | 327 | 272 -17% | 257 -21% | 380 16% | 355 9% | 274 -16% |
| Brightness | 316 | 268 -15% | 248 -22% | 354 12% | 335 6% | 263 -17% |
| Brightness Distribution | 87 | 95 9% | 94 8% | 81 -7% | 82 -6% | 85 -2% |
| Black Level * | 0.35 | 0.32 9% | 0.26 26% | 0.26 26% | 0.28 20% | 0.21 40% |
| Contrast | 934 | 850 -9% | 988 6% | 1462 57% | 1268 36% | 1305 40% |
| Colorchecker dE 2000 * | 4.39 | 2.61 41% | 4.59 -5% | 3.11 29% | 3.75 15% | 3.93 10% |
| Colorchecker dE 2000 max. * | 7.27 | 6.43 12% | 9.72 -34% | 6.73 7% | 8.58 -18% | |
| Greyscale dE 2000 * | 4.69 | 3.31 29% | 6.38 -36% | 4.35 7% | 4.84 -3% | 5.28 -13% |
| Gamma | 2.15 102% | 2.35 94% | 2.51 88% | 2.37 93% | 2.33 94% | 2.49 88% |
| CCT | 7101 92% | 6360 102% | 6238 104% | 6771 96% | 7536 86% | 7108 91% |
| Color Space (Percent of AdobeRGB 1998) | 62.52 | 63 1% | 65 4% | 62 -1% | 63 1% | 61 -2% |
| Color Space (Percent of sRGB) | 96.71 | 95 -2% | 98 1% | 96 -1% | 98 1% | |
| Total Average (Program / Settings) | 4% /
4% | 0% /
-4% | 4% /
9% | 0% /
3% | 2% /
3% |
* ... smaller is better
Display Response Times
| ↔ Response Time Black to White | ||
|---|---|---|
| 26.4 ms ... rise ↗ and fall ↘ combined | ↗ 6.8 ms rise | 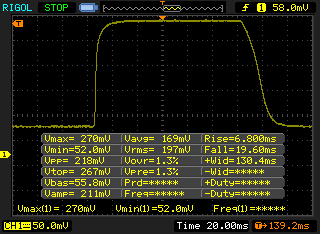 |
| ↘ 19.6 ms fall | ||
| The screen shows relatively slow response rates in our tests and may be too slow for gamers. In comparison, all tested devices range from 0.1 (minimum) to 240 (maximum) ms. » 61 % of all devices are better. This means that the measured response time is worse than the average of all tested devices (21.5 ms). | ||
| ↔ Response Time 50% Grey to 80% Grey | ||
| 46.4 ms ... rise ↗ and fall ↘ combined | ↗ 16.4 ms rise | 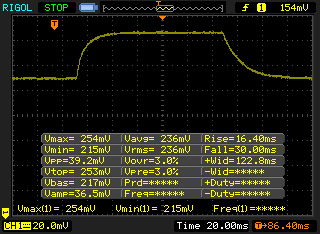 |
| ↘ 30 ms fall | ||
| The screen shows slow response rates in our tests and will be unsatisfactory for gamers. In comparison, all tested devices range from 0.2 (minimum) to 636 (maximum) ms. » 77 % of all devices are better. This means that the measured response time is worse than the average of all tested devices (33.7 ms). | ||
Screen Flickering / PWM (Pulse-Width Modulation)
| Screen flickering / PWM not detected | ||
In comparison: 53 % of all tested devices do not use PWM to dim the display. If PWM was detected, an average of 17900 (minimum: 5 - maximum: 3846000) Hz was measured. | ||

| PCMark 8 Home Score Accelerated v2 | 3305 points | |
| PCMark 8 Creative Score Accelerated v2 | 4058 points | |
| PCMark 8 Work Score Accelerated v2 | 4241 points | |
Help | ||
| HP EliteBook Folio 1040 G3 Samsung SM951 MZVPV256HDGL m.2 PCI-e | Lenovo ThinkPad X1 Carbon 20FB003RGE Samsung SSD PM871 MZNLN256HCHP | Lenovo ThinkPad T460s-20FA003GGE Samsung SSD SM951a 512GB M.2 PCIe 3.0 x4 NVMe (MZVKV512) | Dell Latitude 14 7000 Series E7470 Samsung SSD PM851 M.2 2280 256GB | HP EliteBook 840 G3 T9X59ET#ABD Samsung SSD PM851 256 GB MZNTE256HMHP | HP EliteBook Folio 1040 G2 Samsung SSD PM851 256 GB MZNTE256HMHP | |
|---|---|---|---|---|---|---|
| CrystalDiskMark 3.0 | -56% | 2% | -54% | -58% | -55% | |
| Write 4k QD32 | 376.7 | 279.2 -26% | 277 -26% | 191.7 -49% | 242.8 -36% | 265.3 -30% |
| Read 4k QD32 | 559 | 339.6 -39% | 561 0% | 400.9 -28% | 388.5 -31% | 393.3 -30% |
| Write 4k | 159.9 | 86.5 -46% | 139.3 -13% | 110.9 -31% | 82.6 -48% | 101.2 -37% |
| Read 4k | 53.3 | 34.05 -36% | 51.3 -4% | 36.32 -32% | 27.02 -49% | 28.4 -47% |
| Write 512 | 1244 | 304.2 -76% | 1506 21% | 214 -83% | 241.8 -81% | 264.6 -79% |
| Read 512 | 1252 | 299.5 -76% | 1339 7% | 470.8 -62% | 396 -68% | 418.9 -67% |
| Write Seq | 1265 | 308.1 -76% | 1530 21% | 300.7 -76% | 241.4 -81% | 264.3 -79% |
| Read Seq | 1649 | 439.3 -73% | 1778 8% | 518 -69% | 497.8 -70% | 499.9 -70% |

| 3DMark 11 Performance | 1539 points | |
| 3DMark Cloud Gate Standard Score | 5471 points | |
| 3DMark Fire Strike Score | 842 points | |
Help | ||
| low | med. | high | ultra | |
| Tomb Raider (2013) | 68 | 34.9 | 23.9 | 11.1 |
| BioShock Infinite (2013) | 47.6 | 27.6 | 22.5 | 6.9 |
| The Witcher 3 (2015) | 9.7 |
Noise Level
| Idle |
| 29.1 / 29.1 / 29.1 dB(A) |
| Load |
| 32.6 / 37.8 dB(A) |
 | ||
30 dB silent 40 dB(A) audible 50 dB(A) loud |
||
min: | ||
| HP EliteBook Folio 1040 G3 6300U, HD Graphics 520 | Lenovo ThinkPad X1 Carbon 20FB003RGE 6500U, HD Graphics 520 | Lenovo ThinkPad T460s-20FA003GGE 6600U, HD Graphics 520 | Dell Latitude 14 7000 Series E7470 6600U, HD Graphics 520 | HP EliteBook 840 G3 T9X59ET#ABD 6500U, HD Graphics 520 | HP EliteBook Folio 1040 G2 5600U, HD Graphics 5500 | |
|---|---|---|---|---|---|---|
| Noise | -2% | -1% | -2% | -8% | -5% | |
| off / environment * | 29.1 | 29.1 -0% | 29.2 -0% | 31.2 -7% | 31.2 -7% | |
| Idle Minimum * | 29.1 | 29.1 -0% | 29.2 -0% | 31.2 -7% | 31.2 -7% | 29.6 -2% |
| Idle Average * | 29.1 | 29.1 -0% | 29.2 -0% | 31.2 -7% | 32.1 -10% | 29.6 -2% |
| Idle Maximum * | 29.1 | 29.1 -0% | 29.2 -0% | 31.2 -7% | 33.1 -14% | 32.2 -11% |
| Load Average * | 32.6 | 35.6 -9% | 33.7 -3% | 31.9 2% | 36.2 -11% | 36.4 -12% |
| Load Maximum * | 37.8 | 38.1 -1% | 38.5 -2% | 31.9 16% | 37.8 -0% | 36.4 4% |
* ... smaller is better
(±) The maximum temperature on the upper side is 43.2 °C / 110 F, compared to the average of 34.2 °C / 94 F, ranging from 21.2 to 62.5 °C for the class Office.
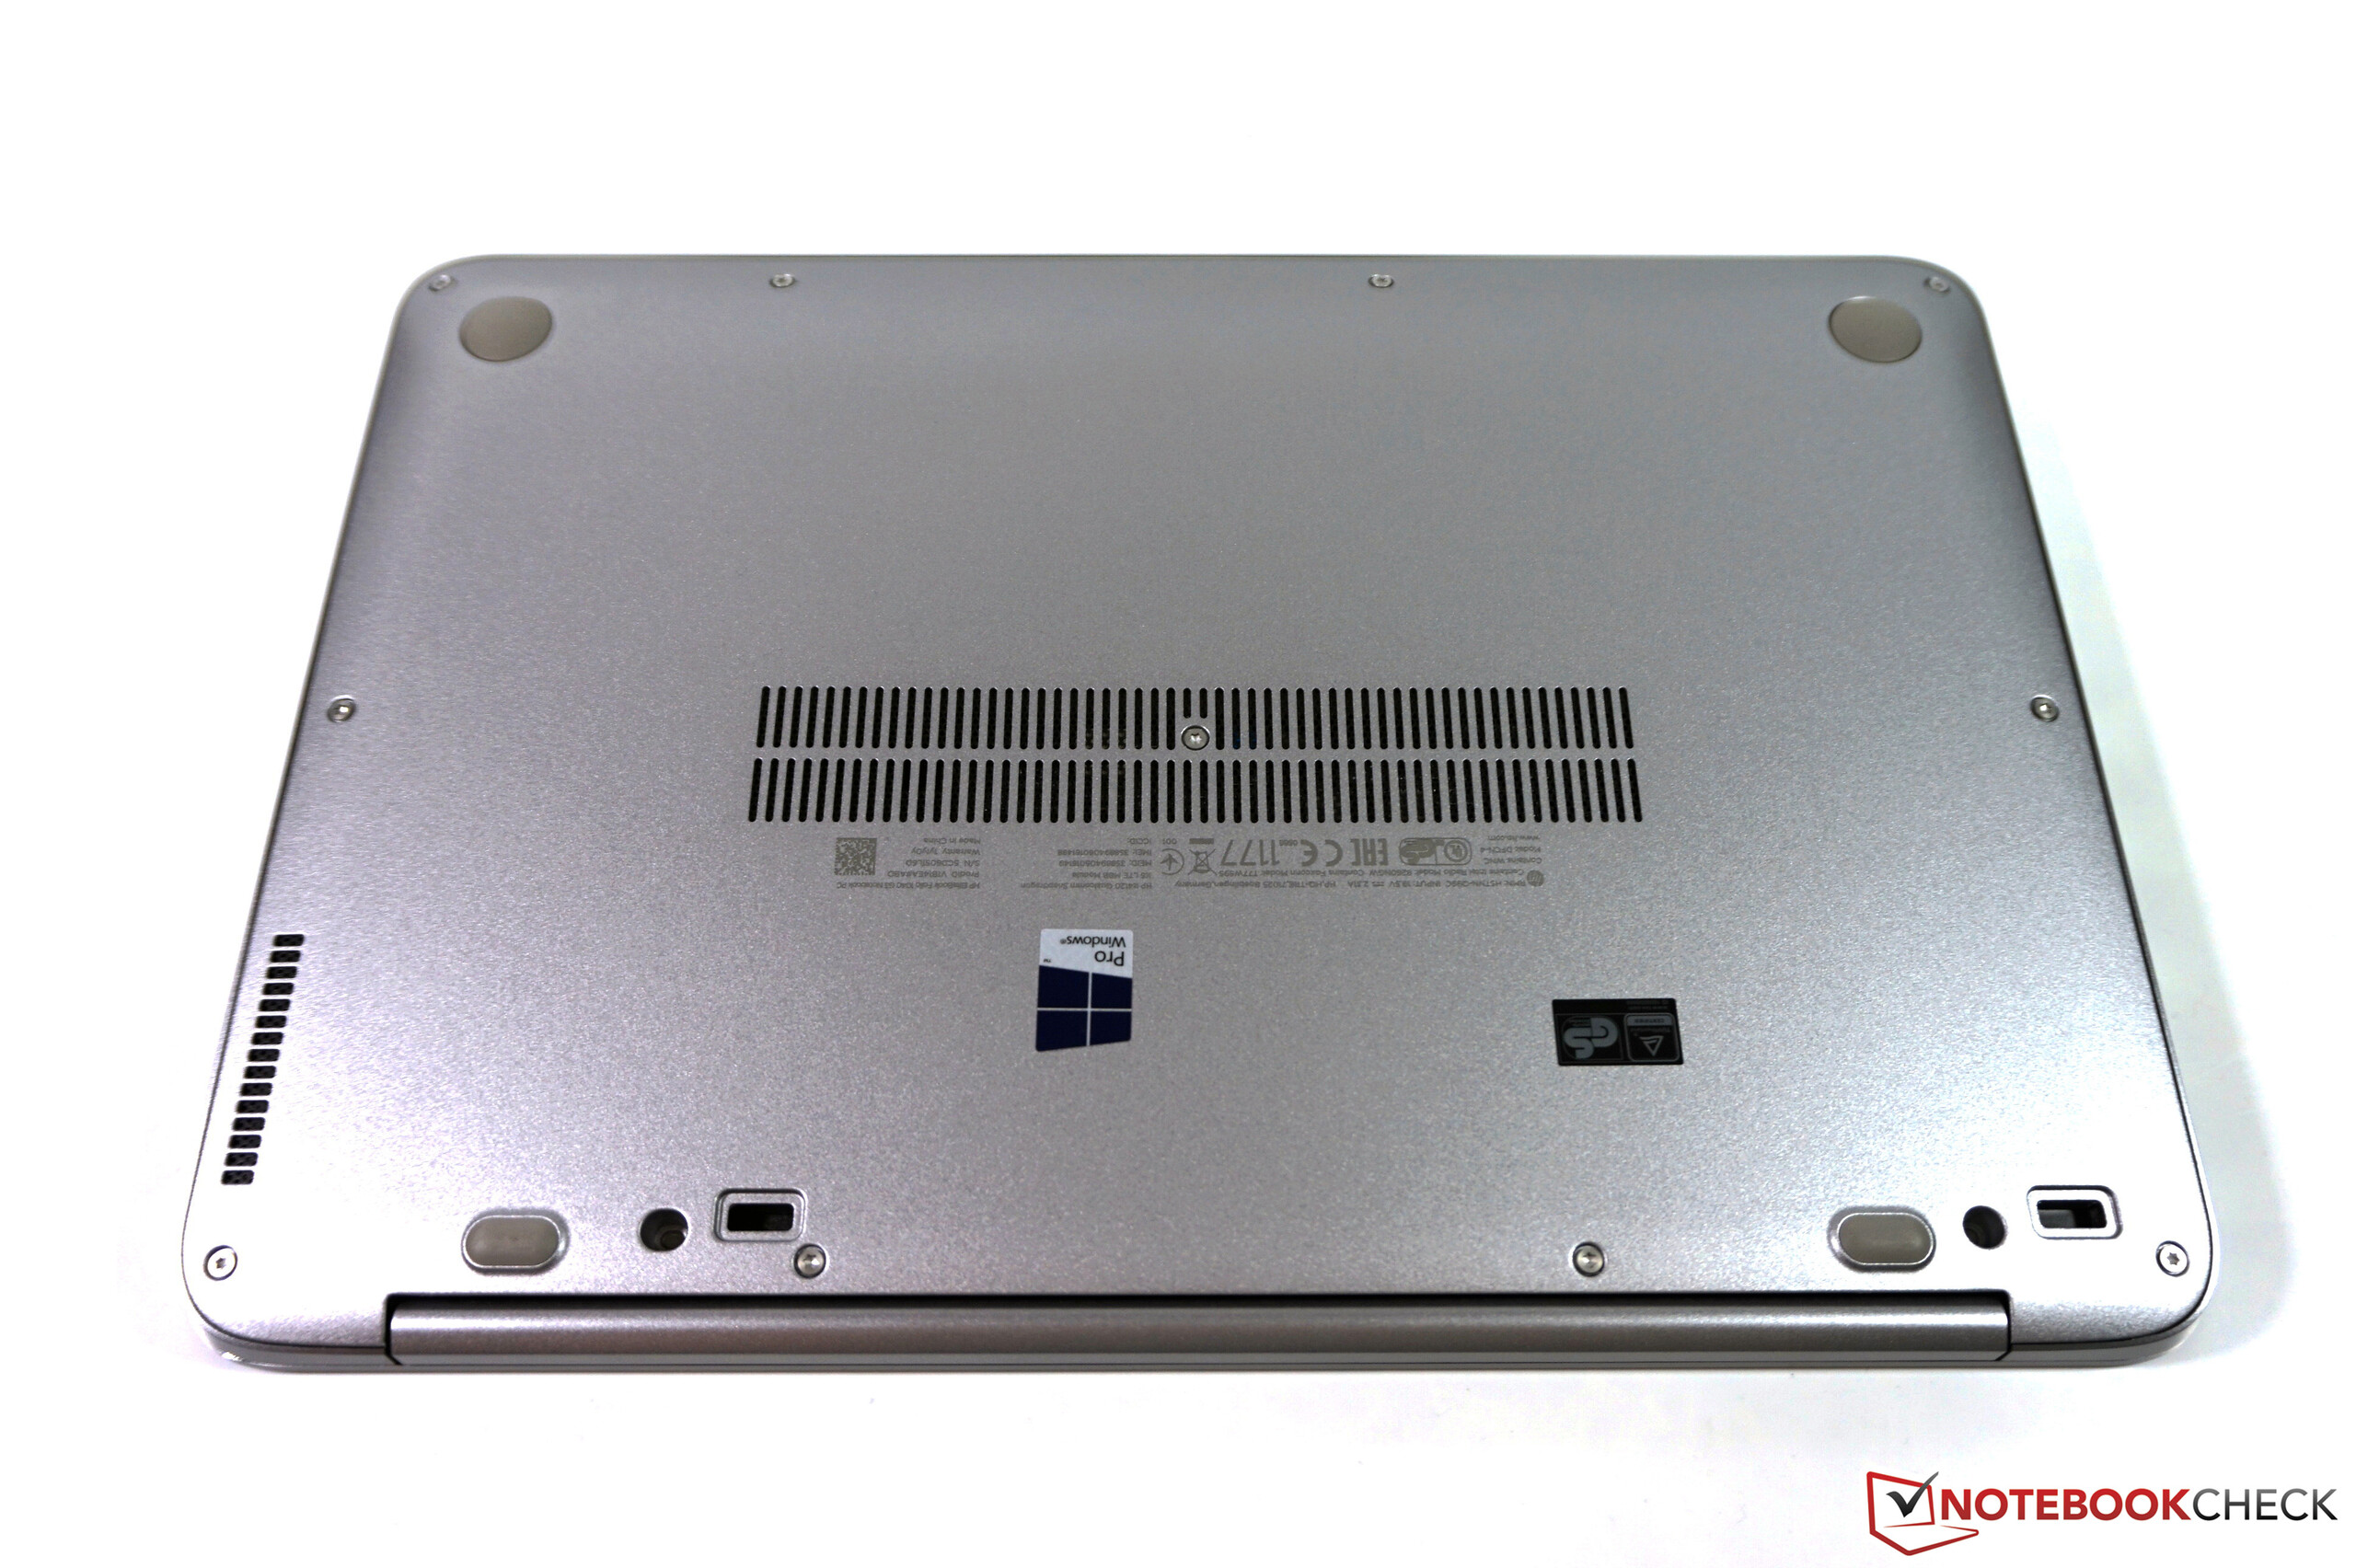
(-) The bottom heats up to a maximum of 47.1 °C / 117 F, compared to the average of 36.7 °C / 98 F
(+) In idle usage, the average temperature for the upper side is 28.7 °C / 84 F, compared to the device average of 29.5 °C / 85 F.
(+) The palmrests and touchpad are reaching skin temperature as a maximum (34.4 °C / 93.9 F) and are therefore not hot.
(-) The average temperature of the palmrest area of similar devices was 27.7 °C / 81.9 F (-6.7 °C / -12 F).
| HP EliteBook Folio 1040 G3 6300U, HD Graphics 520 | Lenovo ThinkPad X1 Carbon 20FB003RGE 6500U, HD Graphics 520 | Lenovo ThinkPad T460s-20FA003GGE 6600U, HD Graphics 520 | Dell Latitude 14 7000 Series E7470 6600U, HD Graphics 520 | HP EliteBook 840 G3 T9X59ET#ABD 6500U, HD Graphics 520 | HP EliteBook Folio 1040 G2 5600U, HD Graphics 5500 | |
|---|---|---|---|---|---|---|
| Heat | 2% | 10% | 18% | 17% | 11% | |
| Maximum Upper Side * | 43.2 | 43.2 -0% | 40.8 6% | 38.2 12% | 37 14% | 35.9 17% |
| Maximum Bottom * | 47.1 | 45 4% | 40.3 14% | 36.5 23% | 37.1 21% | 42.4 10% |
| Idle Upper Side * | 30.5 | 30.2 1% | 27.6 10% | 25.1 18% | 25.3 17% | 28.5 7% |
| Idle Bottom * | 31.5 | 30.6 3% | 28.7 9% | 25.8 18% | 26.6 16% | 29 8% |
* ... smaller is better
| Off / Standby | |
| Idle | |
| Load |
|
| HP EliteBook Folio 1040 G3 6300U, HD Graphics 520 | Lenovo ThinkPad X1 Carbon 20FB003RGE 6500U, HD Graphics 520 | Lenovo ThinkPad T460s-20FA003GGE 6600U, HD Graphics 520 | Dell Latitude 14 7000 Series E7470 6600U, HD Graphics 520 | HP EliteBook 840 G3 T9X59ET#ABD 6500U, HD Graphics 520 | HP EliteBook Folio 1040 G2 5600U, HD Graphics 5500 | |
|---|---|---|---|---|---|---|
| Power Consumption | 21% | 17% | 12% | 29% | 35% | |
| Idle Minimum * | 6.3 | 3.8 40% | 3.8 40% | 5.1 19% | 3.8 40% | 3.2 49% |
| Idle Average * | 9.4 | 7.1 24% | 7.1 24% | 8.5 10% | 6.3 33% | 6.5 31% |
| Idle Maximum * | 10.1 | 7.7 24% | 7.8 23% | 10.1 -0% | 6.8 33% | 7.4 27% |
| Load Average * | 33.3 | 30.2 9% | 36.3 -9% | 35.2 -6% | 34.4 -3% | 25.6 23% |
| Load Maximum * | 49.5 | 44.7 10% | 46 7% | 31 37% | 28.3 43% | 26.1 47% |
* ... smaller is better
| HP EliteBook Folio 1040 G3 45.6 Wh | Lenovo ThinkPad X1 Carbon 20FB003RGE 52 Wh | Lenovo ThinkPad T460s-20FA003GGE 49 Wh | Dell Latitude 14 7000 Series E7470 55 Wh | HP EliteBook 840 G3 T9X59ET#ABD 46 Wh | HP EliteBook Folio 1040 G2 42 Wh | |
|---|---|---|---|---|---|---|
| Battery Runtime | 39% | 8% | -2% | 50% | 34% | |
| Reader / Idle | 530 | 942 78% | 833 57% | 1020 92% | 901 70% | |
| H.264 | 339 | 510 50% | 397 17% | |||
| WiFi v1.3 | 309 | 429 39% | 340 10% | 346 12% | 453 47% | 452 46% |
| Load | 131 | 115 -12% | 62 -53% | 112 -15% | 146 11% | 112 -15% |
Pros
Cons
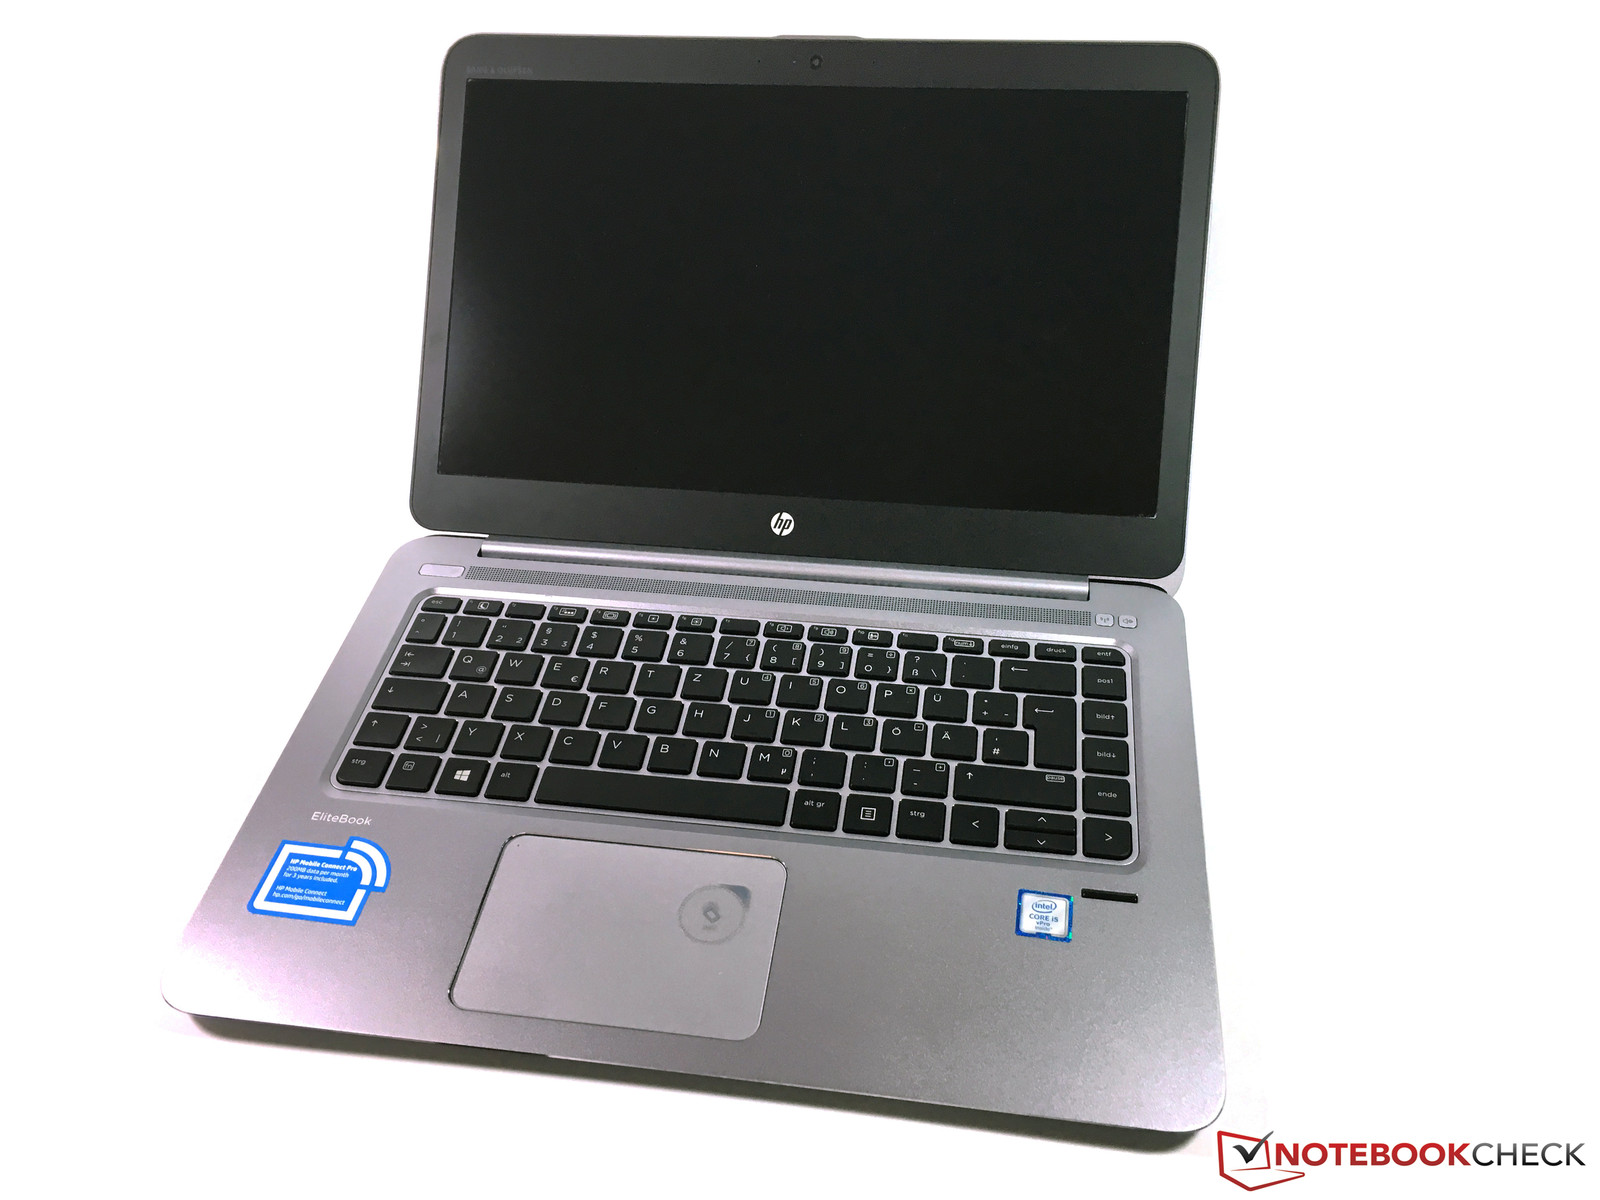
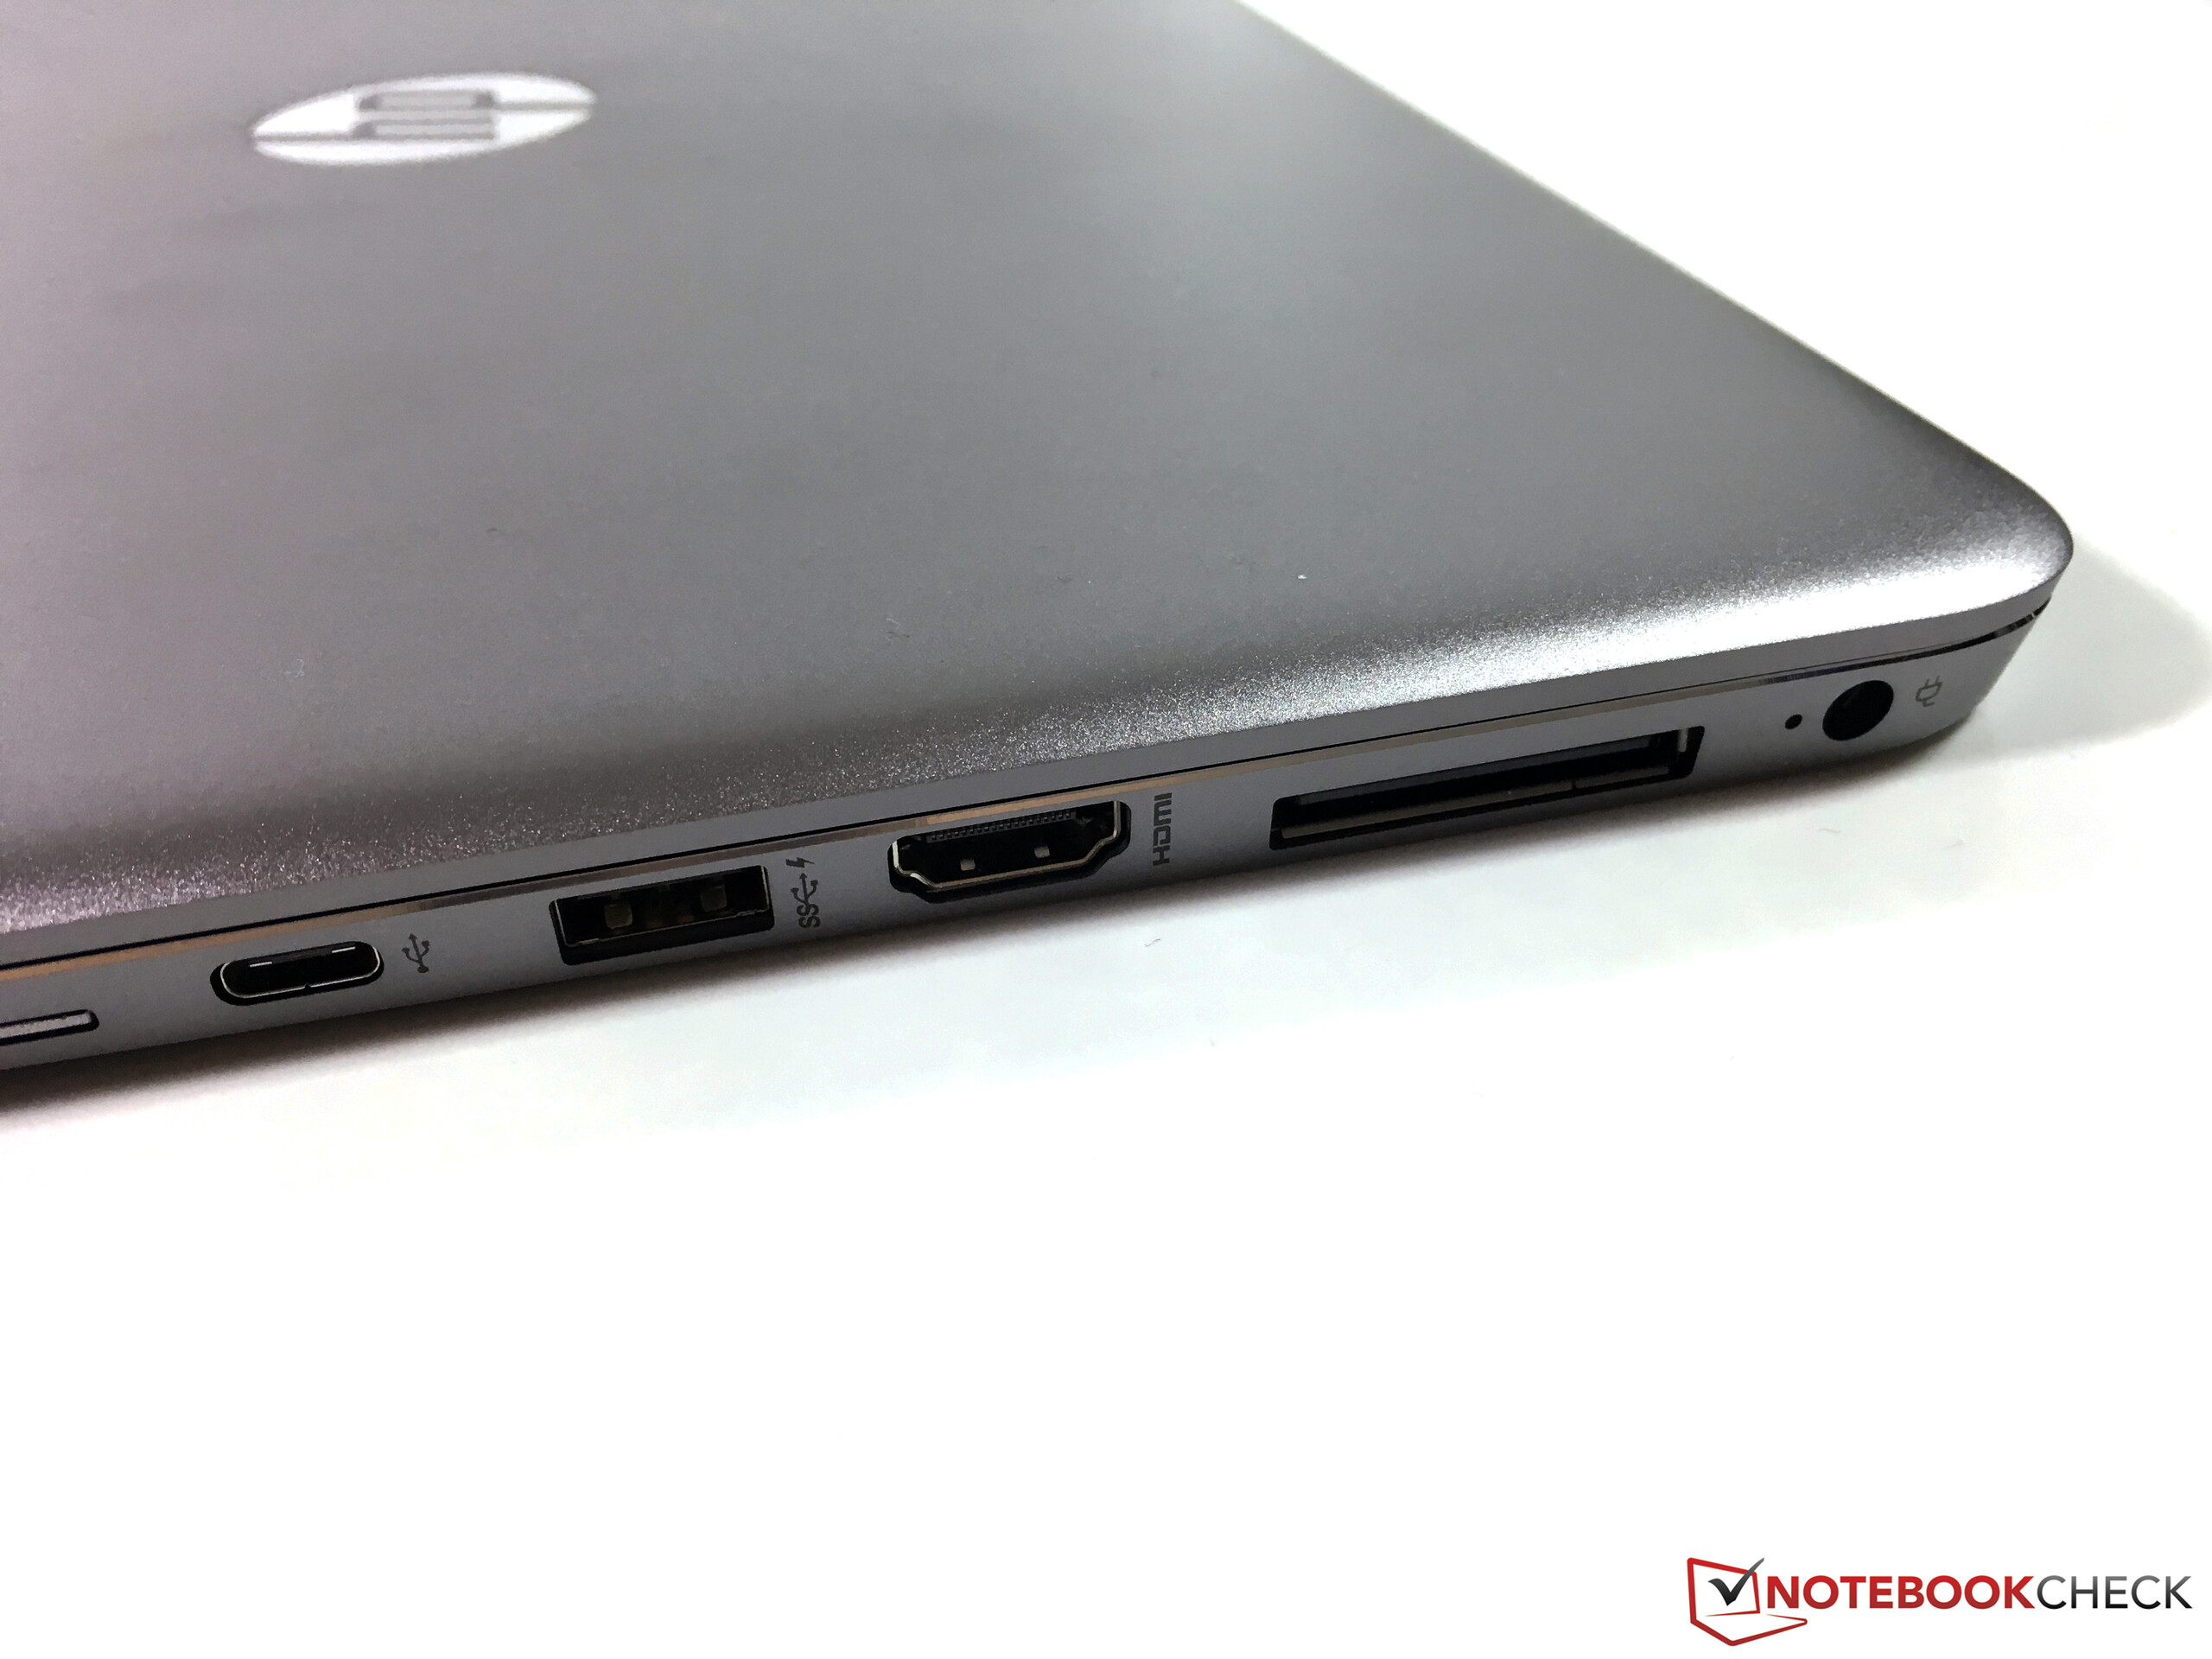
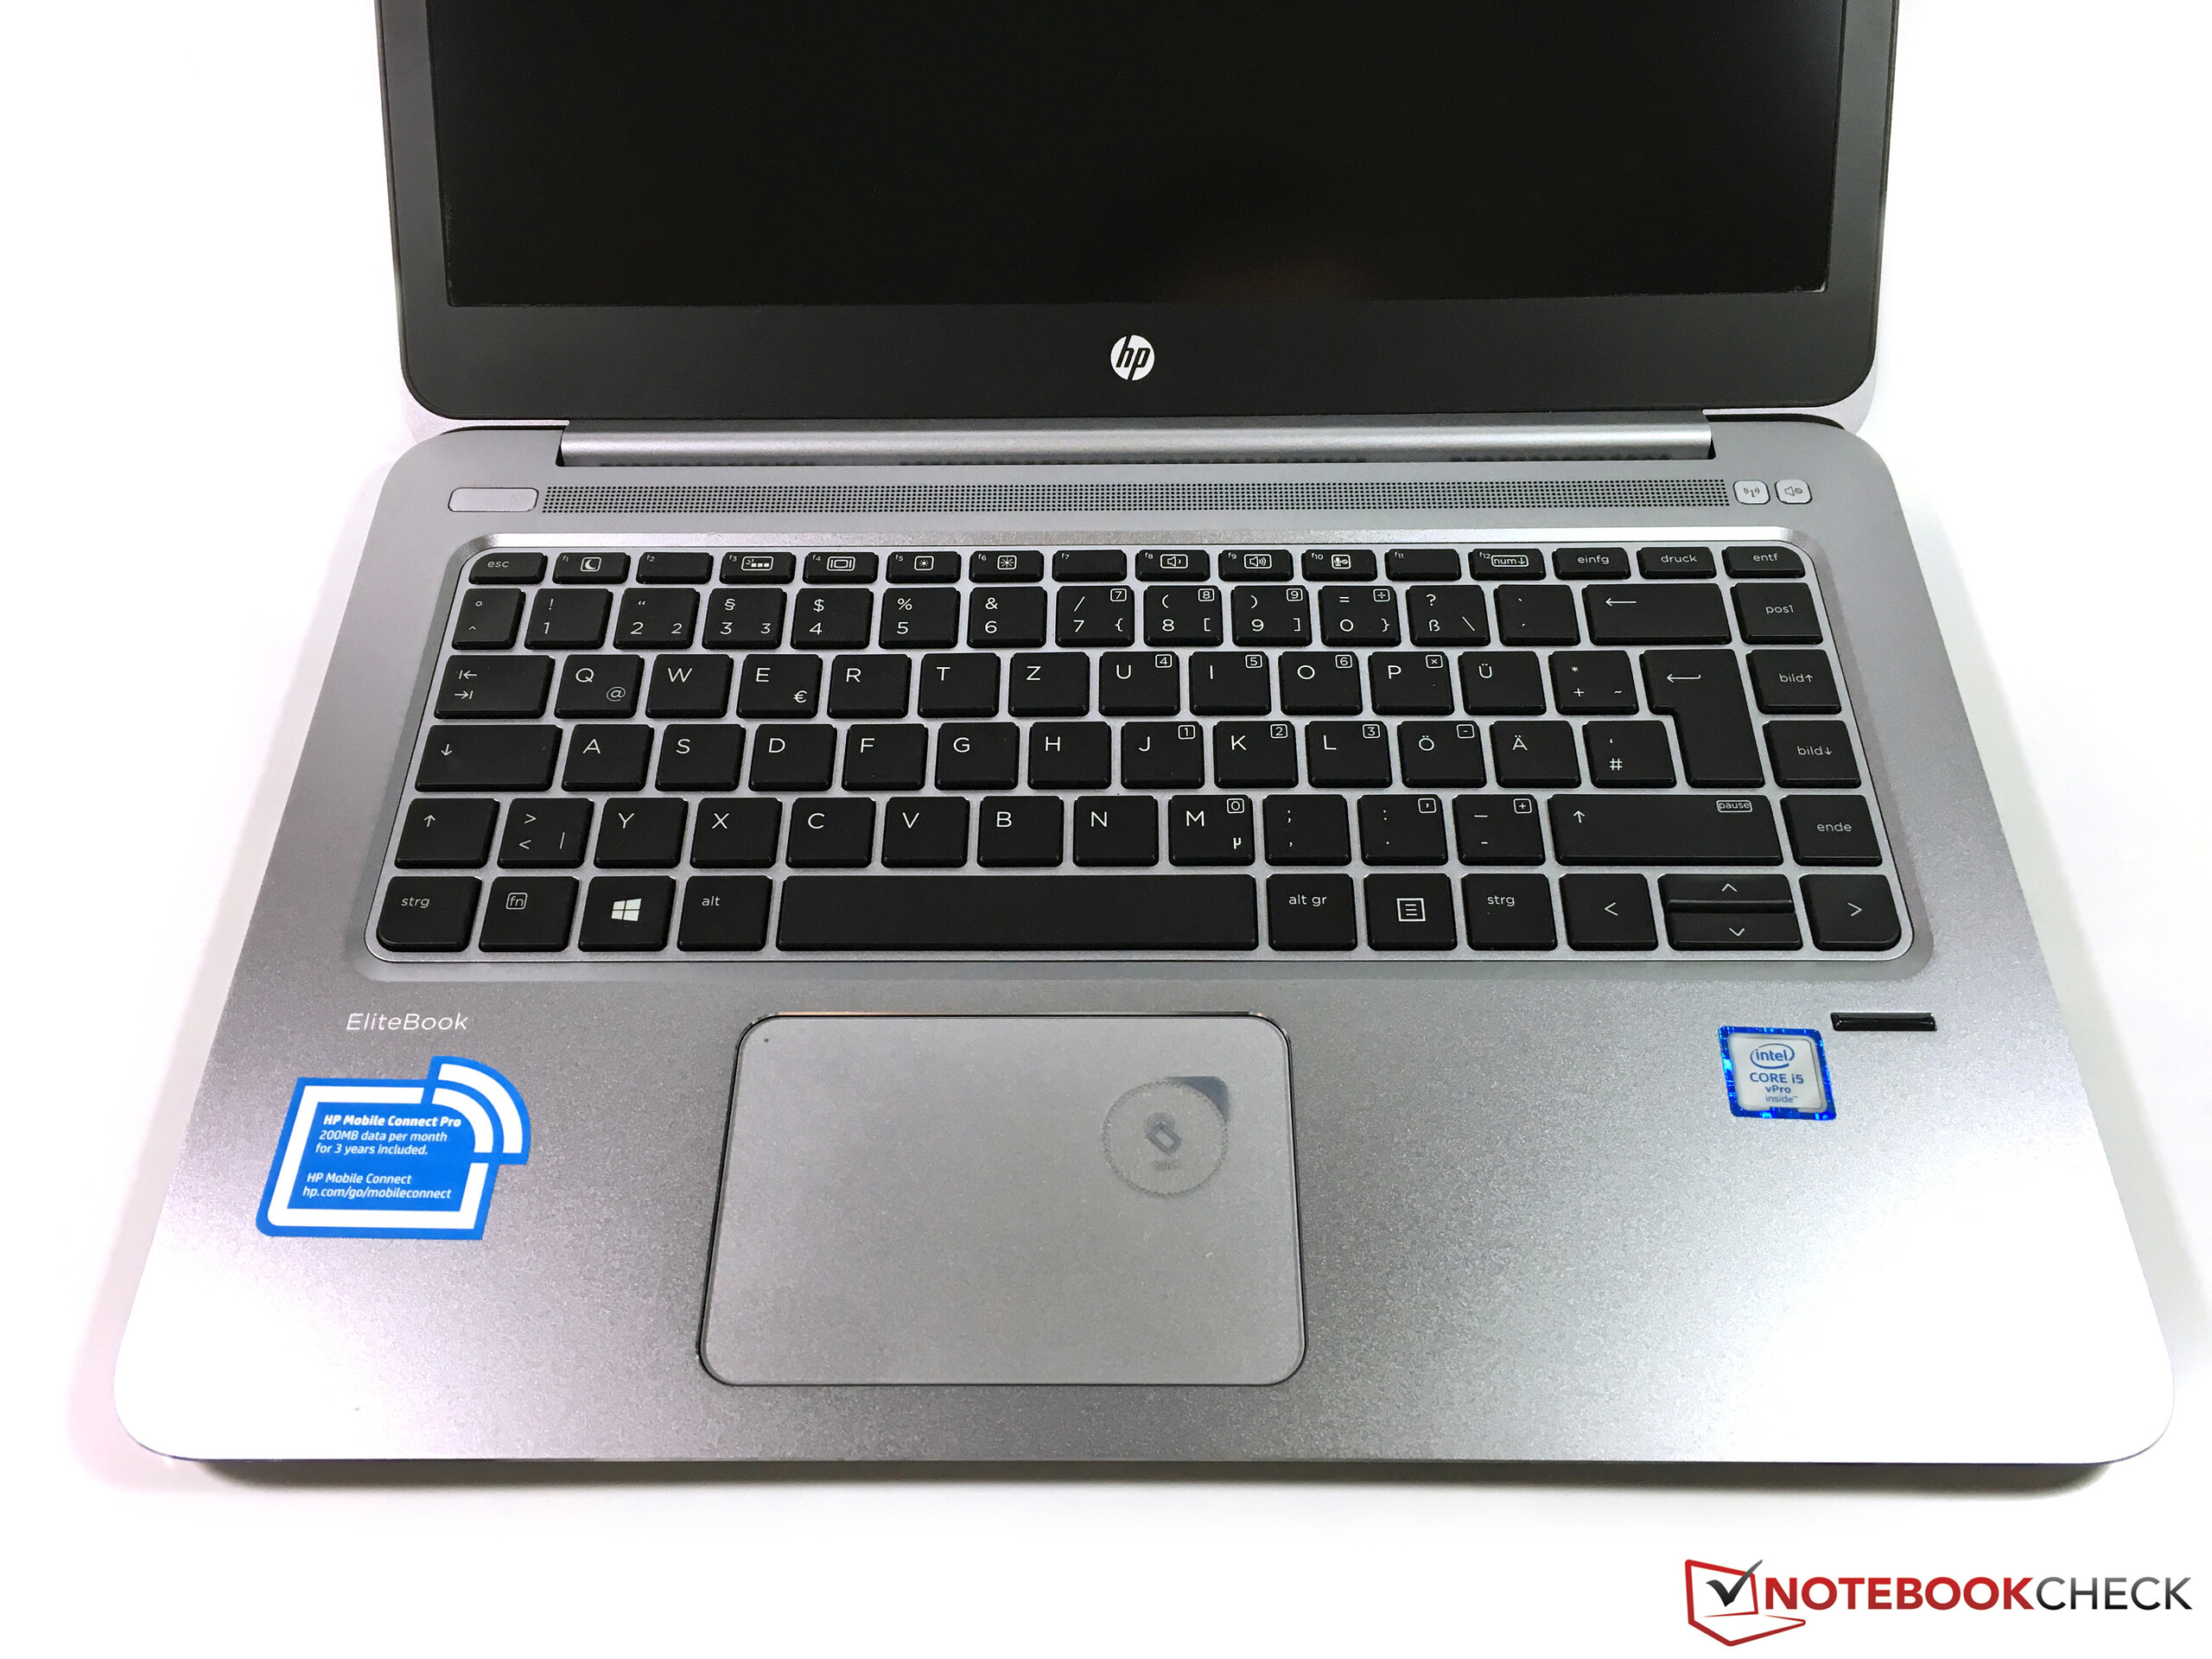
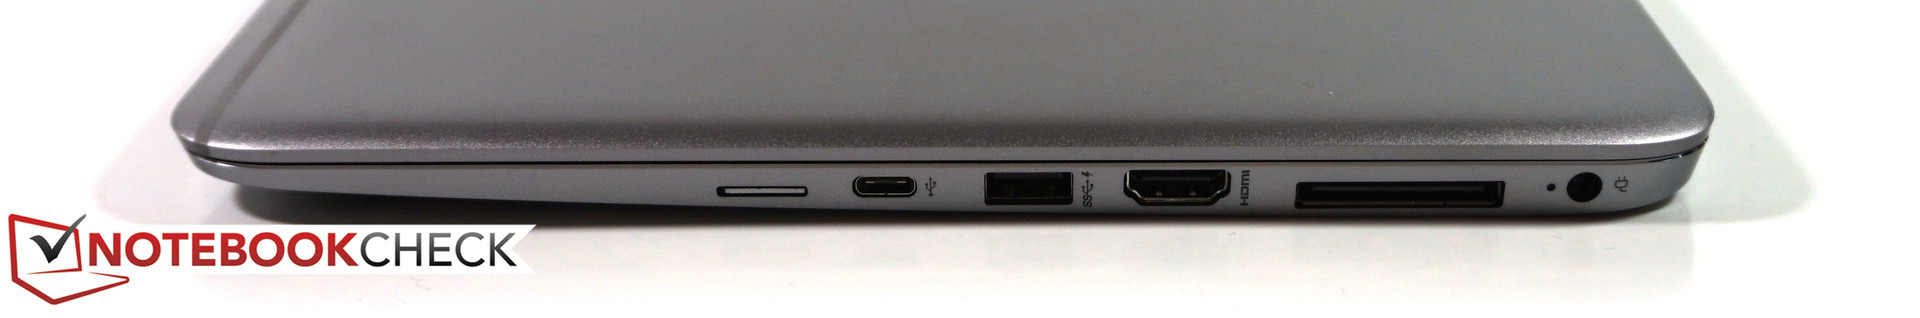
惠普EliteBook Folio 1040 G3不是一个革新,但考虑到已经十分优秀的前作的话它并没有大幅改变的必要。我们十分喜欢它的机身,但键盘右侧表面的坚固度还需要改进。它的接口得到了更新,不过惠普没能完全发挥USB-C接口的潜能(不支持Thunderbolt 3)。它的另外一个改进的更长键程的键盘,这应该对办公用户帮助较大。我们也很喜欢它明亮的磨砂WQHD屏幕,它没有采用闪烁亮度控制,同时它的SIM卡附带免费的流量。
惠普EliteBook Folio 1040 G3毫无疑问是一台出色的笔记本电脑,不过相比竞争对手它高昂的价格有些让人难以接受。
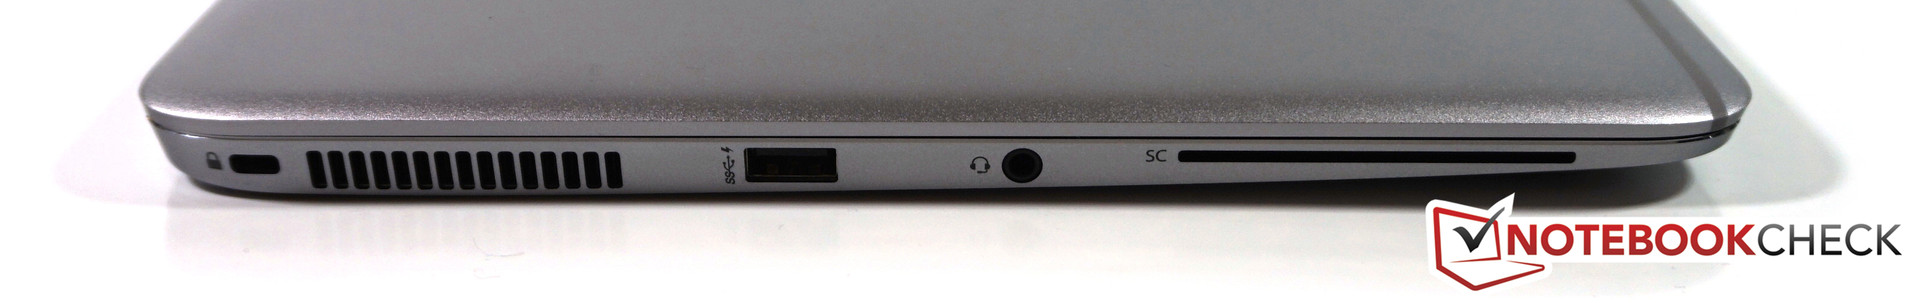
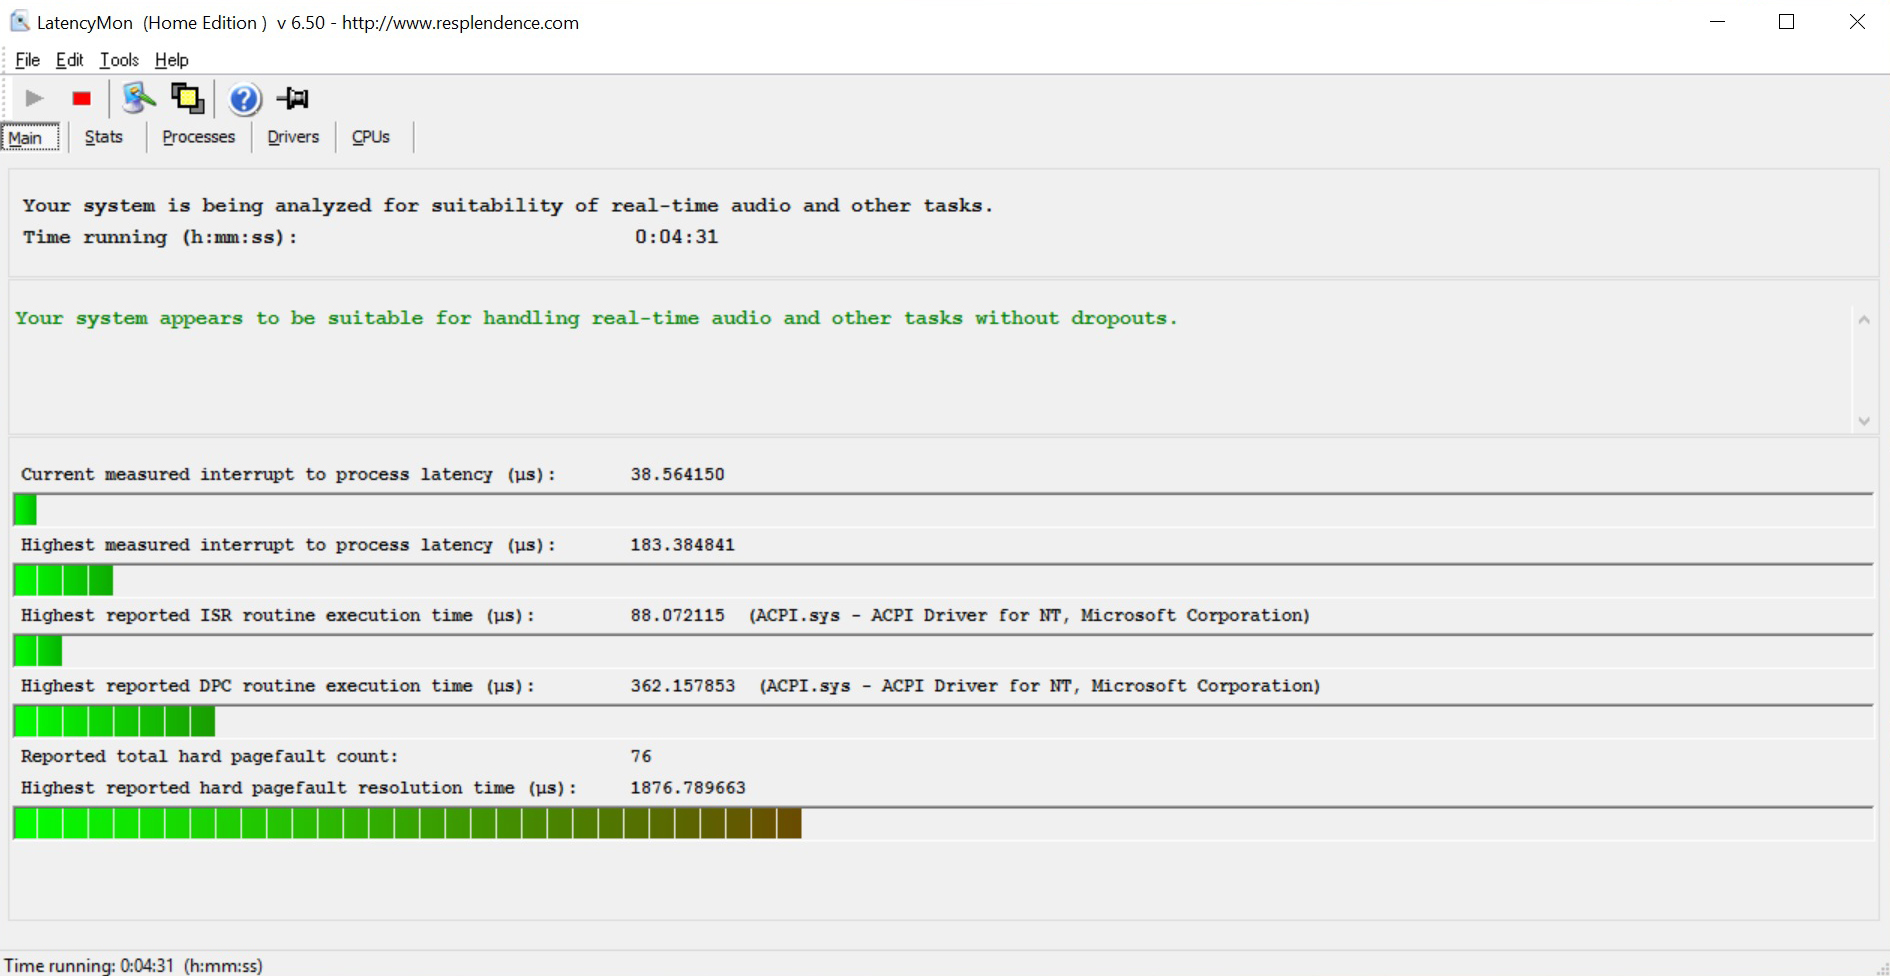
它较高的功耗影响了电池续航时间。在我们的实际使用无线上网测试中它相比前代产品短了两个半小时。我们并不推荐全高清屏幕机型,因为它采用的是TN屏幕面板。同时它还有一些如电流声,缺少SD读卡器等小问题。它的质保期只有一年,你需要多付140欧元才可以得到常见的三年质保。
这就是它最大的弊端:售价。约2600欧元(约19268人民币)的价位,Folio 1040 G3远超其他同类产品,而它们并不差。如果预算不是问题的话,Folio时分值得考虑,但不得不承认一些竞争对手提供了更高的性价比。
注:本文是基于完整评测的缩减版本,阅读完整的英文评测,请点击这里。
HP EliteBook Folio 1040 G3
-
04/21/2016 v5.1(old)
Andreas Osthoff
Pricecompare
