 Deutsch
 English
 Español
 Français
 Italiano
 Nederlands
 Polski
 Português
 Русский
 Türkçe
 Svenska
 Chinese
 Magyar
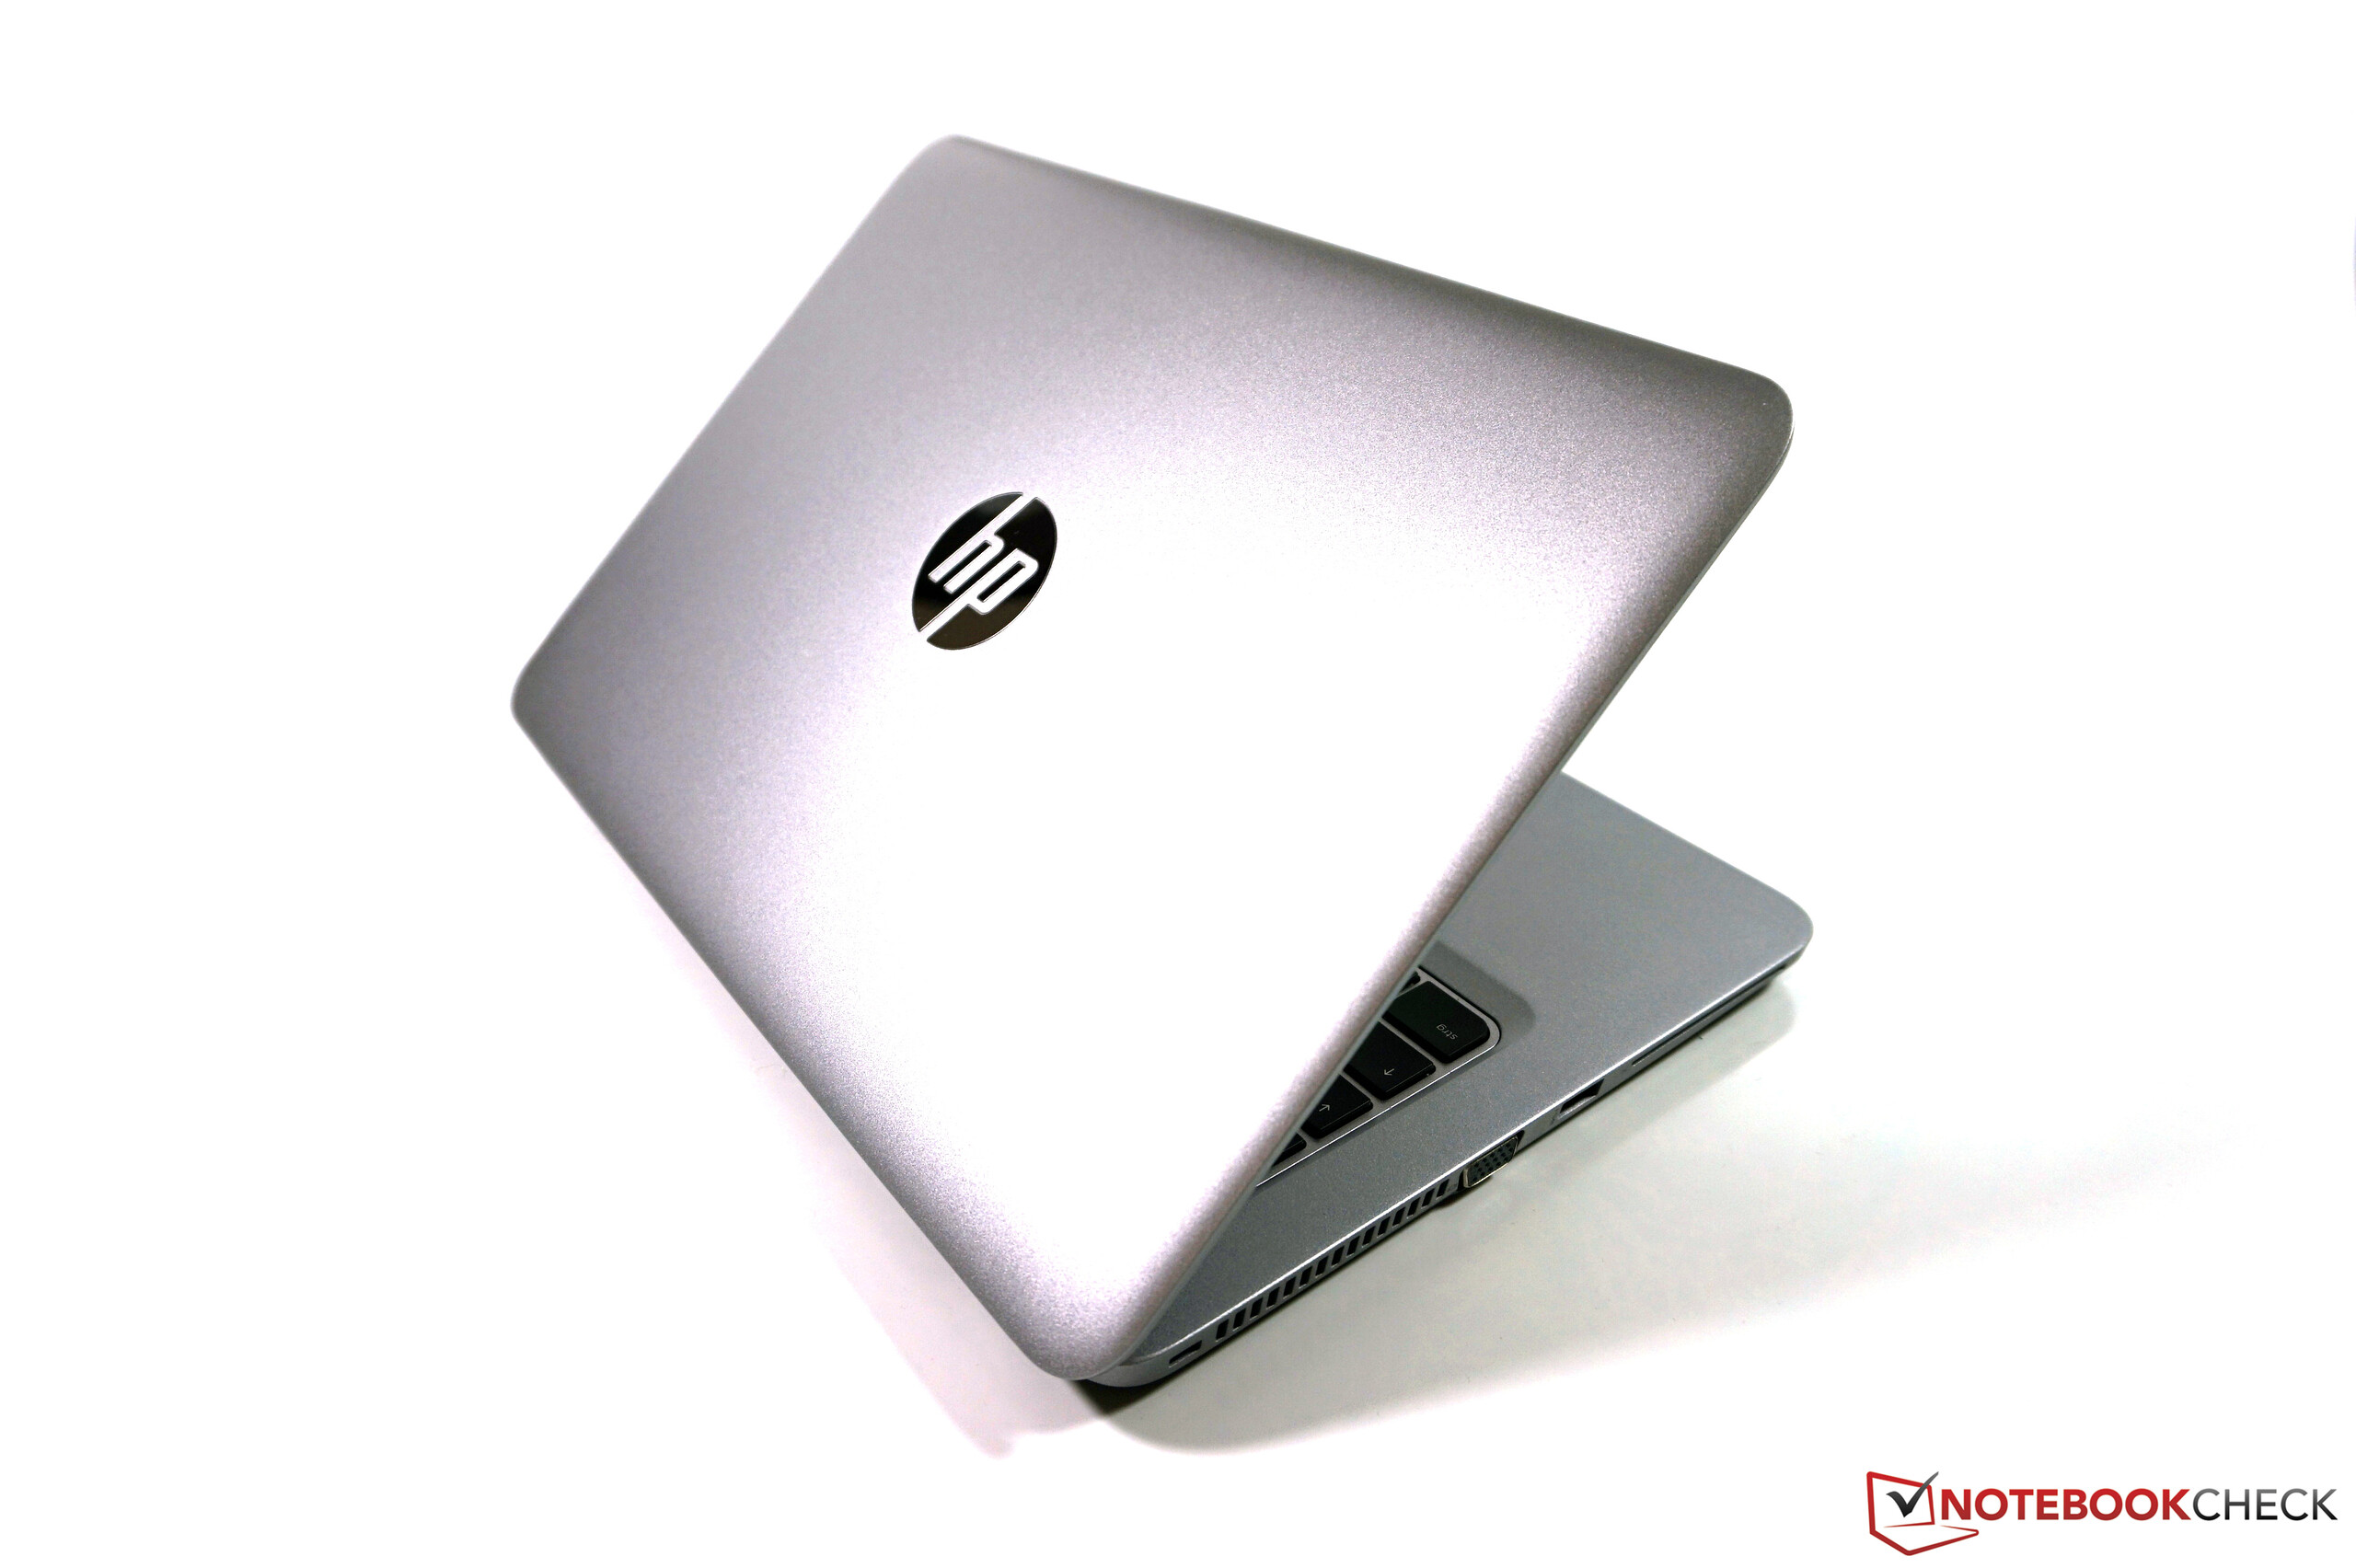
惠普 EliteBook 820 G3 亚笔记本电脑简短评测
| |||||||||||||||||||||||||
Brightness Distribution: 84 %
Center on Battery: 243 cd/m²
Contrast: 407:1 (Black: 0.6 cd/m²)
ΔE Color 9 | 0.5-29.43 Ø5
ΔE Greyscale 9.48 | 0.57-98 Ø5.3
58.63% sRGB (Argyll 1.6.3 3D)
37.18% AdobeRGB 1998 (Argyll 1.6.3 3D)
40.2% AdobeRGB 1998 (Argyll 2.2.0 3D)
58.5% sRGB (Argyll 2.2.0 3D)
38.9% Display P3 (Argyll 2.2.0 3D)
Gamma: 2.44
| HP EliteBook 820 G3 1366x768, TN LED | Lenovo ThinkPad X260-20F60041GE 1366x768, IPS | Toshiba Portege Z30-C-138 1920x1080, IPS | Dell Latitude 12 E7250 1920x1080, TN-LED | HP Elitebook 820 G2-J8R58EA 1920x1080, IPS | |
|---|---|---|---|---|---|
| Display | 24% | 72% | 14% | 12% | |
| Display P3 Coverage | 38.9 | 48.19 24% | 67.9 75% | 44.48 14% | 43.72 12% |
| sRGB Coverage | 58.5 | 72.6 24% | 98 68% | 66.2 13% | 65.3 12% |
| AdobeRGB 1998 Coverage | 40.2 | 49.79 24% | 69.8 74% | 45.96 14% | 45.24 13% |
| Response Times | 17% | 16% | |||
| Response Time Grey 50% / Grey 80% * | 58 ? | 42.8 ? 26% | 42 ? 28% | ||
| Response Time Black / White * | 29.2 ? | 27.2 ? 7% | 28 ? 4% | ||
| PWM Frequency | 220 ? | 217 ? | |||
| Screen | 48% | 48% | 34% | 41% | |
| Brightness middle | 244 | 262 7% | 300 23% | 360 48% | 300 23% |
| Brightness | 240 | 251 5% | 280 17% | 330 38% | 298 24% |
| Brightness Distribution | 84 | 88 5% | 87 4% | 81 -4% | 83 -1% |
| Black Level * | 0.6 | 0.26 57% | 0.31 48% | 0.53 12% | 0.33 45% |
| Contrast | 407 | 1008 148% | 968 138% | 679 67% | 909 123% |
| Colorchecker dE 2000 * | 9 | 3.55 61% | 4.9 46% | 5.58 38% | 3.68 59% |
| Colorchecker dE 2000 max. * | 15.73 | 5.85 63% | 8.91 43% | ||
| Greyscale dE 2000 * | 9.48 | 3.36 65% | 6.69 29% | 3.98 58% | 2.47 74% |
| Gamma | 2.44 90% | 2.39 92% | 2.33 94% | 2.21 100% | 2.4 92% |
| CCT | 11116 58% | 5985 109% | 6487 100% | 6192 105% | 6310 103% |
| Color Space (Percent of AdobeRGB 1998) | 37.18 | 45.9 23% | 63 69% | 42.2 14% | 41.6 12% |
| Color Space (Percent of sRGB) | 58.63 | 98 67% | 64.9 11% | ||
| Total Average (Program / Settings) | 30% /
39% | 45% /
49% | 24% /
28% | 27% /
34% |
* ... smaller is better
Display Response Times
| ↔ Response Time Black to White | ||
|---|---|---|
| 29.2 ms ... rise ↗ and fall ↘ combined | ↗ 12 ms rise | 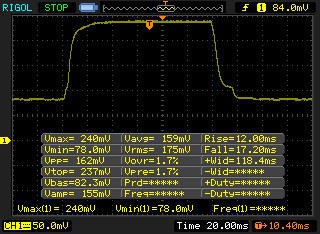 |
| ↘ 17.2 ms fall | ||
| The screen shows relatively slow response rates in our tests and may be too slow for gamers. In comparison, all tested devices range from 0.1 (minimum) to 240 (maximum) ms. » 75 % of all devices are better. This means that the measured response time is worse than the average of all tested devices (21.5 ms). | ||
| ↔ Response Time 50% Grey to 80% Grey | ||
| 58 ms ... rise ↗ and fall ↘ combined | ↗ 24.8 ms rise | 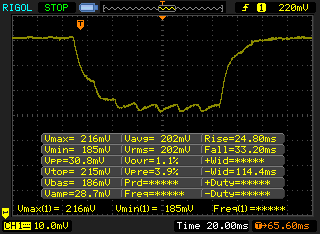 |
| ↘ 33.2 ms fall | ||
| The screen shows slow response rates in our tests and will be unsatisfactory for gamers. In comparison, all tested devices range from 0.2 (minimum) to 636 (maximum) ms. » 93 % of all devices are better. This means that the measured response time is worse than the average of all tested devices (33.7 ms). | ||
Screen Flickering / PWM (Pulse-Width Modulation)
| Screen flickering / PWM not detected | ||
In comparison: 53 % of all tested devices do not use PWM to dim the display. If PWM was detected, an average of 17924 (minimum: 5 - maximum: 3846000) Hz was measured. | ||
| PCMark 8 Home Score Accelerated v2 | 3400 points | |
| PCMark 8 Creative Score Accelerated v2 | 3845 points | |
| PCMark 8 Work Score Accelerated v2 | 4581 points | |
Help | ||
| PCMark 8 | |
| Home Score Accelerated v2 (sort by value) | |
| HP EliteBook 820 G3 | |
| Lenovo ThinkPad X260-20F60041GE | |
| Toshiba Portege Z30-C-138 | |
| Dell Latitude 12 E7250 | |
| HP Elitebook 820 G2-J8R58EA | |
| Creative Score Accelerated v2 (sort by value) | |
| HP EliteBook 820 G3 | |
| Lenovo ThinkPad X260-20F60041GE | |
| Dell Latitude 12 E7250 | |
| HP Elitebook 820 G2-J8R58EA | |
| Work Score Accelerated v2 (sort by value) | |
| HP EliteBook 820 G3 | |
| Lenovo ThinkPad X260-20F60041GE | |
| HP Elitebook 820 G2-J8R58EA | |
| HP EliteBook 820 G3 Samsung SM951 MZVPV256HDGL m.2 PCI-e | Lenovo ThinkPad X260-20F60041GE Seagate ST500LM000 Solid State Hybrid Drive | Toshiba Portege Z30-C-138 Toshiba HG6 THNSNJ512G8NY | Dell Latitude 12 E7250 Samsung PM851 Series MZMTE256HMHP | HP Elitebook 820 G2-J8R58EA Samsung SSD PM851 256 GB MZ7TE256HMHP | |
|---|---|---|---|---|---|
| CrystalDiskMark 3.0 | -96% | -55% | -60% | -45% | |
| Write 4k QD32 | 343.9 | 0.766 -100% | 174.7 -49% | 180 -48% | 266.5 -23% |
| Read 4k QD32 | 549 | 1.155 -100% | 227.3 -59% | 214 -61% | 384.3 -30% |
| Write 4k | 134.1 | 3.136 -98% | 86.3 -36% | 61 -55% | 136.4 2% |
| Read 4k | 51 | 0.497 -99% | 21.17 -58% | 29 -43% | 29.14 -43% |
| Write 512 | 811 | 77.1 -90% | 379.9 -53% | 244 -70% | 268.1 -67% |
| Read 512 | 1131 | 36.26 -97% | 414.8 -63% | 428 -62% | 445.6 -61% |
| Write Seq | 1240 | 110.2 -91% | 423.3 -66% | 244 -80% | 268.3 -78% |
| Read Seq | 1255 | 107.9 -91% | 518 -59% | 509 -59% | 523 -58% |

| 3DMark 11 Performance | 1408 points | |
| 3DMark Cloud Gate Standard Score | 5164 points | |
| 3DMark Fire Strike Score | 711 points | |
Help | ||
| 3DMark | |
| 1280x720 Cloud Gate Standard Score (sort by value) | |
| HP EliteBook 820 G3 | |
| Lenovo ThinkPad X260-20F60041GE | |
| Dell Latitude 12 E7250 | |
| HP Elitebook 820 G2-J8R58EA | |
| 1280x720 Cloud Gate Standard Graphics (sort by value) | |
| HP EliteBook 820 G3 | |
| Lenovo ThinkPad X260-20F60041GE | |
| Dell Latitude 12 E7250 | |
| HP Elitebook 820 G2-J8R58EA | |
| 1920x1080 Fire Strike Score (sort by value) | |
| HP EliteBook 820 G3 | |
| Lenovo ThinkPad X260-20F60041GE | |
| Dell Latitude 12 E7250 | |
| HP Elitebook 820 G2-J8R58EA | |
| 1920x1080 Fire Strike Graphics (sort by value) | |
| HP EliteBook 820 G3 | |
| Lenovo ThinkPad X260-20F60041GE | |
| Dell Latitude 12 E7250 | |
| HP Elitebook 820 G2-J8R58EA | |
| low | med. | high | ultra | |
| Tomb Raider (2013) | 56.9 | 29.8 | 19.1 | |
| BioShock Infinite (2013) | 37.5 | 21.5 | 17.9 | |
| The Witcher 3 (2015) | 12.8 |
Noise Level
| Idle |
| 29.2 / 29.2 / 29.2 dB(A) |
| Load |
| 35.6 / 37 dB(A) |
 | ||
30 dB silent 40 dB(A) audible 50 dB(A) loud |
||
min: | ||
| HP EliteBook 820 G3 6300U, HD Graphics 520 | Lenovo ThinkPad X260-20F60041GE 6200U, HD Graphics 520 | Toshiba Portege Z30-C-138 6500U, HD Graphics 520 | Dell Latitude 12 E7250 5300U, HD Graphics 5500 | HP Elitebook 820 G2-J8R58EA 5500U, HD Graphics 5500 | |
|---|---|---|---|---|---|
| Noise | 3% | -11% | -4% | 2% | |
| off / environment * | 29.2 | 29 1% | 31.2 -7% | ||
| Idle Minimum * | 29.2 | 29.4 -1% | 31.2 -7% | 29.3 -0% | 29.2 -0% |
| Idle Average * | 29.2 | 29.4 -1% | 31.2 -7% | 29.3 -0% | 29.2 -0% |
| Idle Maximum * | 29.2 | 29.4 -1% | 31.2 -7% | 29.3 -0% | 29.2 -0% |
| Load Average * | 35.6 | 33.2 7% | 43.3 -22% | 37.9 -6% | 34.7 3% |
| Load Maximum * | 37 | 33.2 10% | 43.3 -17% | 42.8 -16% | 35.1 5% |
* ... smaller is better
(+) The maximum temperature on the upper side is 39.6 °C / 103 F, compared to the average of 35.9 °C / 97 F, ranging from 21.4 to 59 °C for the class Subnotebook.
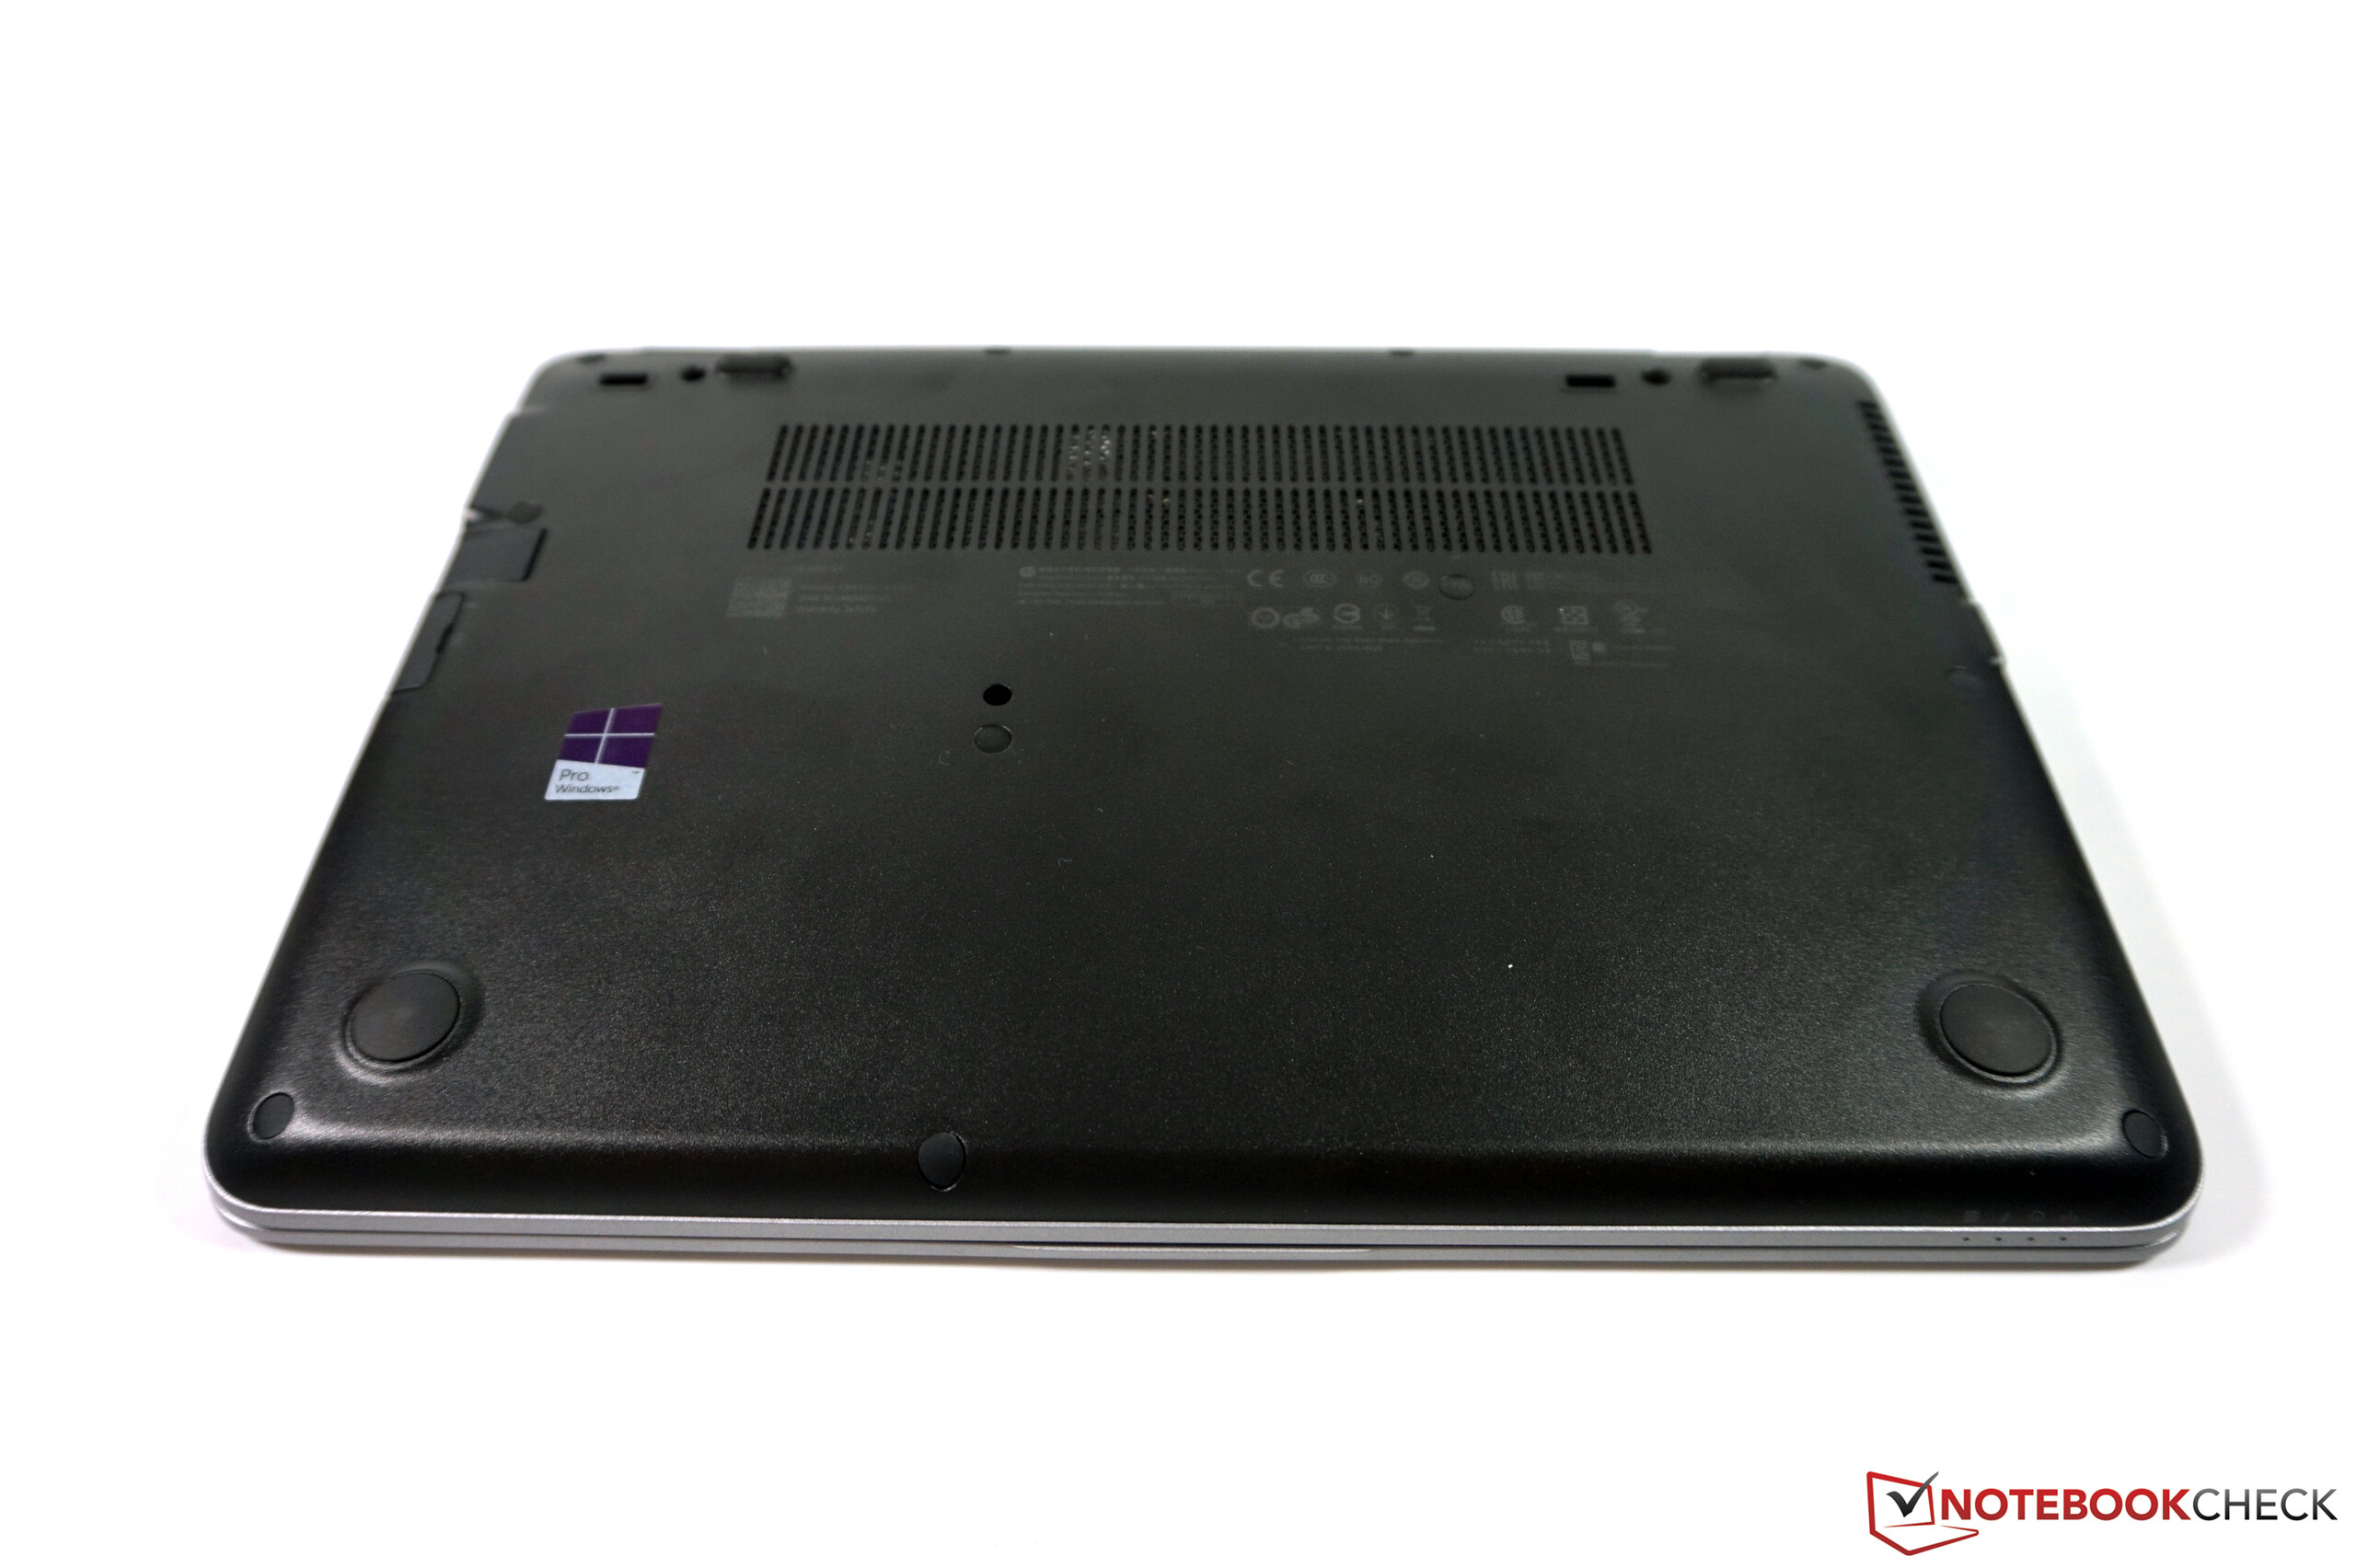
(±) The bottom heats up to a maximum of 40.1 °C / 104 F, compared to the average of 39.4 °C / 103 F
(+) In idle usage, the average temperature for the upper side is 27.7 °C / 82 F, compared to the device average of 30.7 °C / 87 F.
(+) The palmrests and touchpad are cooler than skin temperature with a maximum of 29.9 °C / 85.8 F and are therefore cool to the touch.
(±) The average temperature of the palmrest area of similar devices was 28.3 °C / 82.9 F (-1.6 °C / -2.9 F).
| HP EliteBook 820 G3 6300U, HD Graphics 520 | Lenovo ThinkPad X260-20F60041GE 6200U, HD Graphics 520 | Toshiba Portege Z30-C-138 6500U, HD Graphics 520 | Dell Latitude 12 E7250 5300U, HD Graphics 5500 | HP Elitebook 820 G2-J8R58EA 5500U, HD Graphics 5500 | |
|---|---|---|---|---|---|
| Heat | -11% | 10% | -17% | -8% | |
| Maximum Upper Side * | 39.6 | 45.3 -14% | 40.6 -3% | 46.7 -18% | 43.2 -9% |
| Maximum Bottom * | 40.1 | 48.8 -22% | 37 8% | 56 -40% | 45.1 -12% |
| Idle Upper Side * | 29.4 | 29.3 -0% | 24.5 17% | 30.1 -2% | 31.2 -6% |
| Idle Bottom * | 30.6 | 32.4 -6% | 24.9 19% | 33.2 -8% | 32.5 -6% |
* ... smaller is better
| Off / Standby | |
| Idle | |
| Load |
|
| HP EliteBook 820 G3 44 Wh | Lenovo ThinkPad X260-20F60041GE 46 Wh | Toshiba Portege Z30-C-138 52 Wh | Dell Latitude 12 E7250 52 Wh | HP Elitebook 820 G2-J8R58EA 46 Wh | |
|---|---|---|---|---|---|
| Power Consumption | -3% | -24% | -28% | -6% | |
| Idle Minimum * | 3.5 | 3.6 -3% | 3.2 9% | 4.1 -17% | 3.1 11% |
| Idle Average * | 5.4 | 5.9 -9% | 7.8 -44% | 8.3 -54% | 5.8 -7% |
| Idle Maximum * | 6.2 | 6.6 -6% | 8.7 -40% | 9.4 -52% | 6.5 -5% |
| Load Average * | 27.3 | 28.5 -4% | 42.2 -55% | 31.6 -16% | 30.5 -12% |
| Load Maximum * | 39.5 | 36.8 7% | 35.7 10% | 40.4 -2% | 46.3 -17% |
* ... smaller is better
| HP EliteBook 820 G3 44 Wh | Lenovo ThinkPad X260-20F60041GE 46 Wh | Toshiba Portege Z30-C-138 52 Wh | Dell Latitude 12 E7250 52 Wh | HP Elitebook 820 G2-J8R58EA 46 Wh | |
|---|---|---|---|---|---|
| Battery Runtime | -2% | -8% | -15% | -18% | |
| Reader / Idle | 826 | 795 -4% | 845 2% | 921 12% | |
| H.264 | 495 | 386 -22% | 402 -19% | 293 -41% | |
| WiFi v1.3 | 373 | 396 6% | 345 -8% | 338 -9% | |
| Load | 144 | 160 11% | 103 -28% | 97 -33% | |
| WiFi | 446 |
Pros
Cons
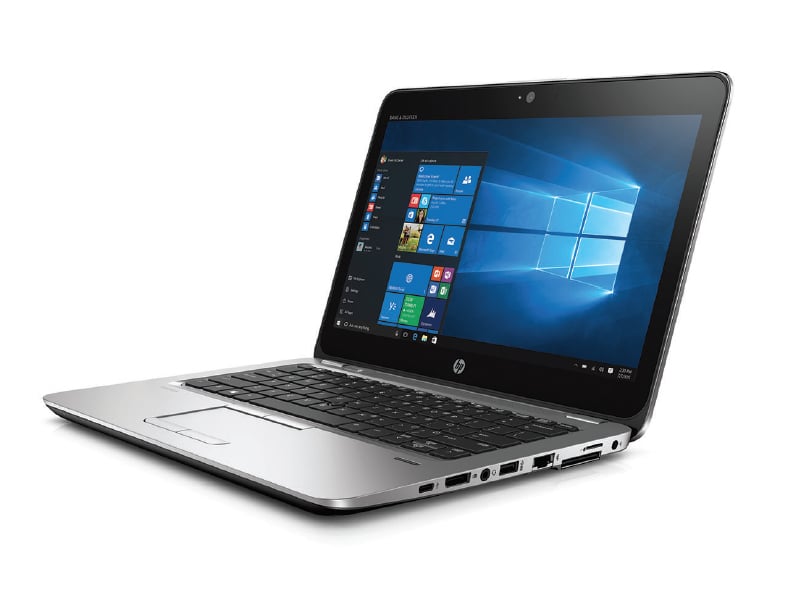
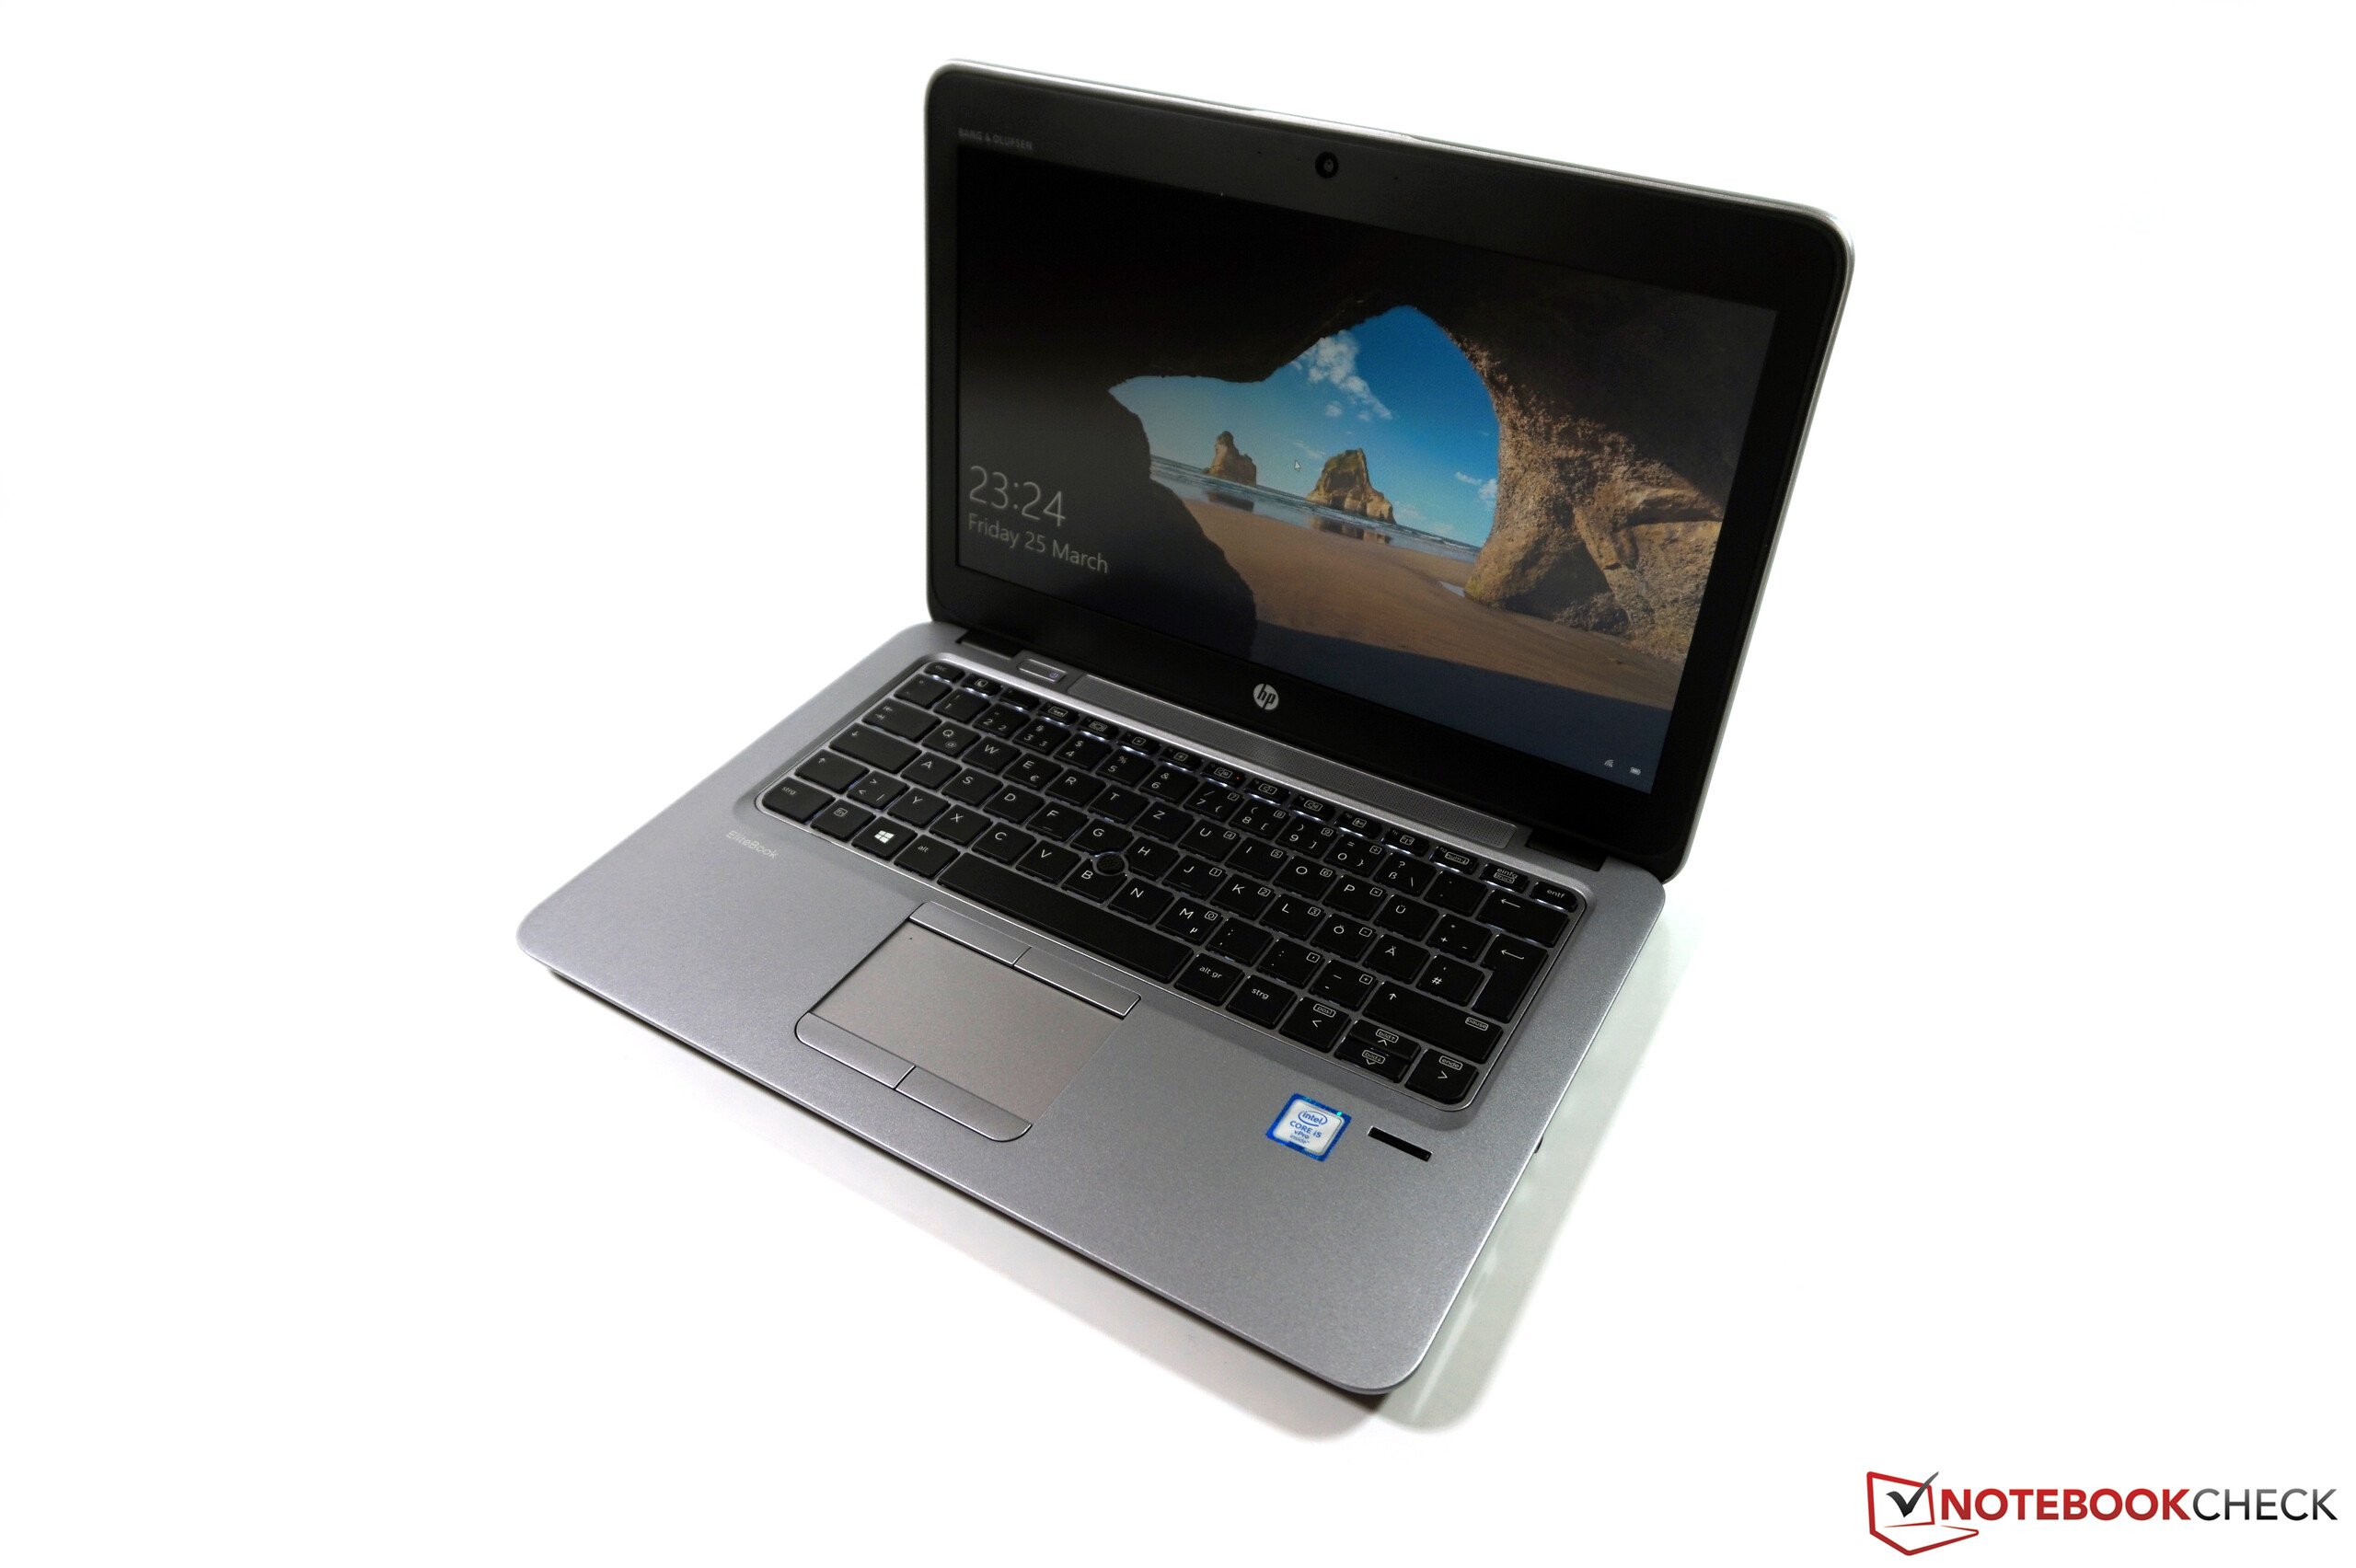
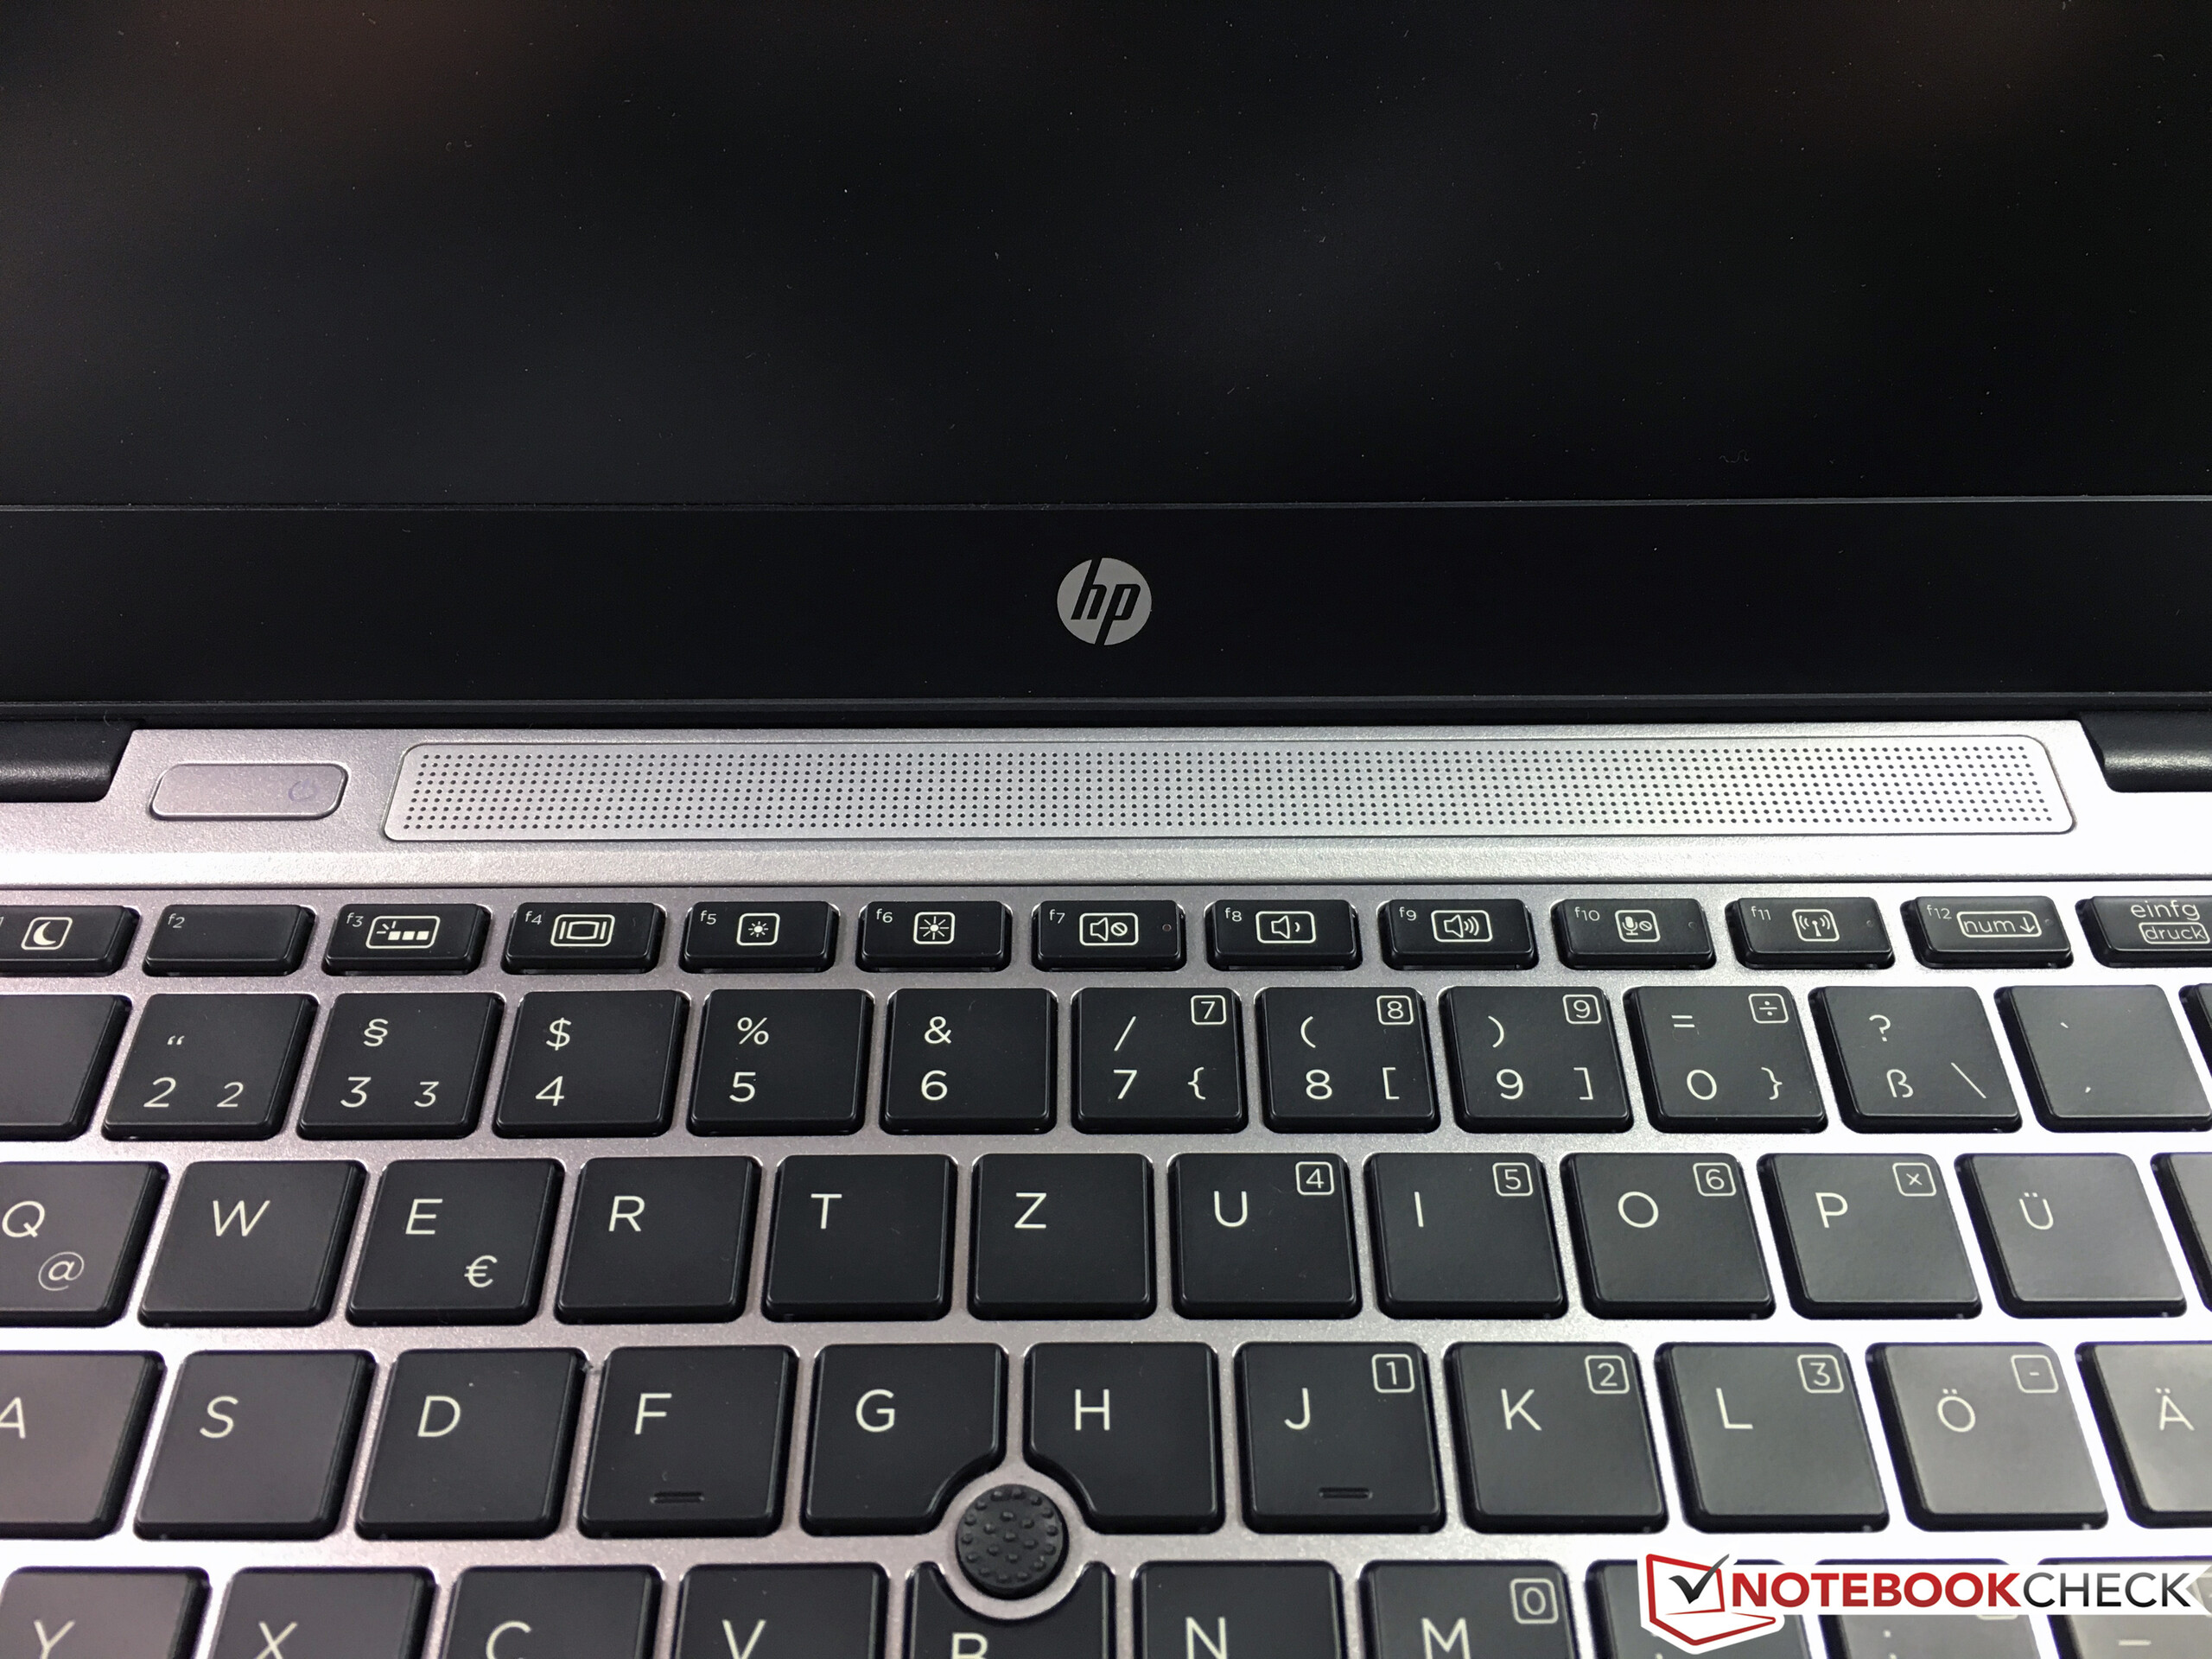
太可惜了,惠普。这家生产商给我们带来的EliteBook 820 G3在一些方面表现非常优秀,但测试中给我们印象更深的是它的缺点。它最大的问题明显是屏幕。让人遗憾的是它目前只有高端机型搭配了全高清IPS屏幕。不过它的一些小问题也很烦人,除了在前代产品中已经存在的风扇噪音之外,这台测试机还会发出电流声,同时指点杆的按键有些太硬。
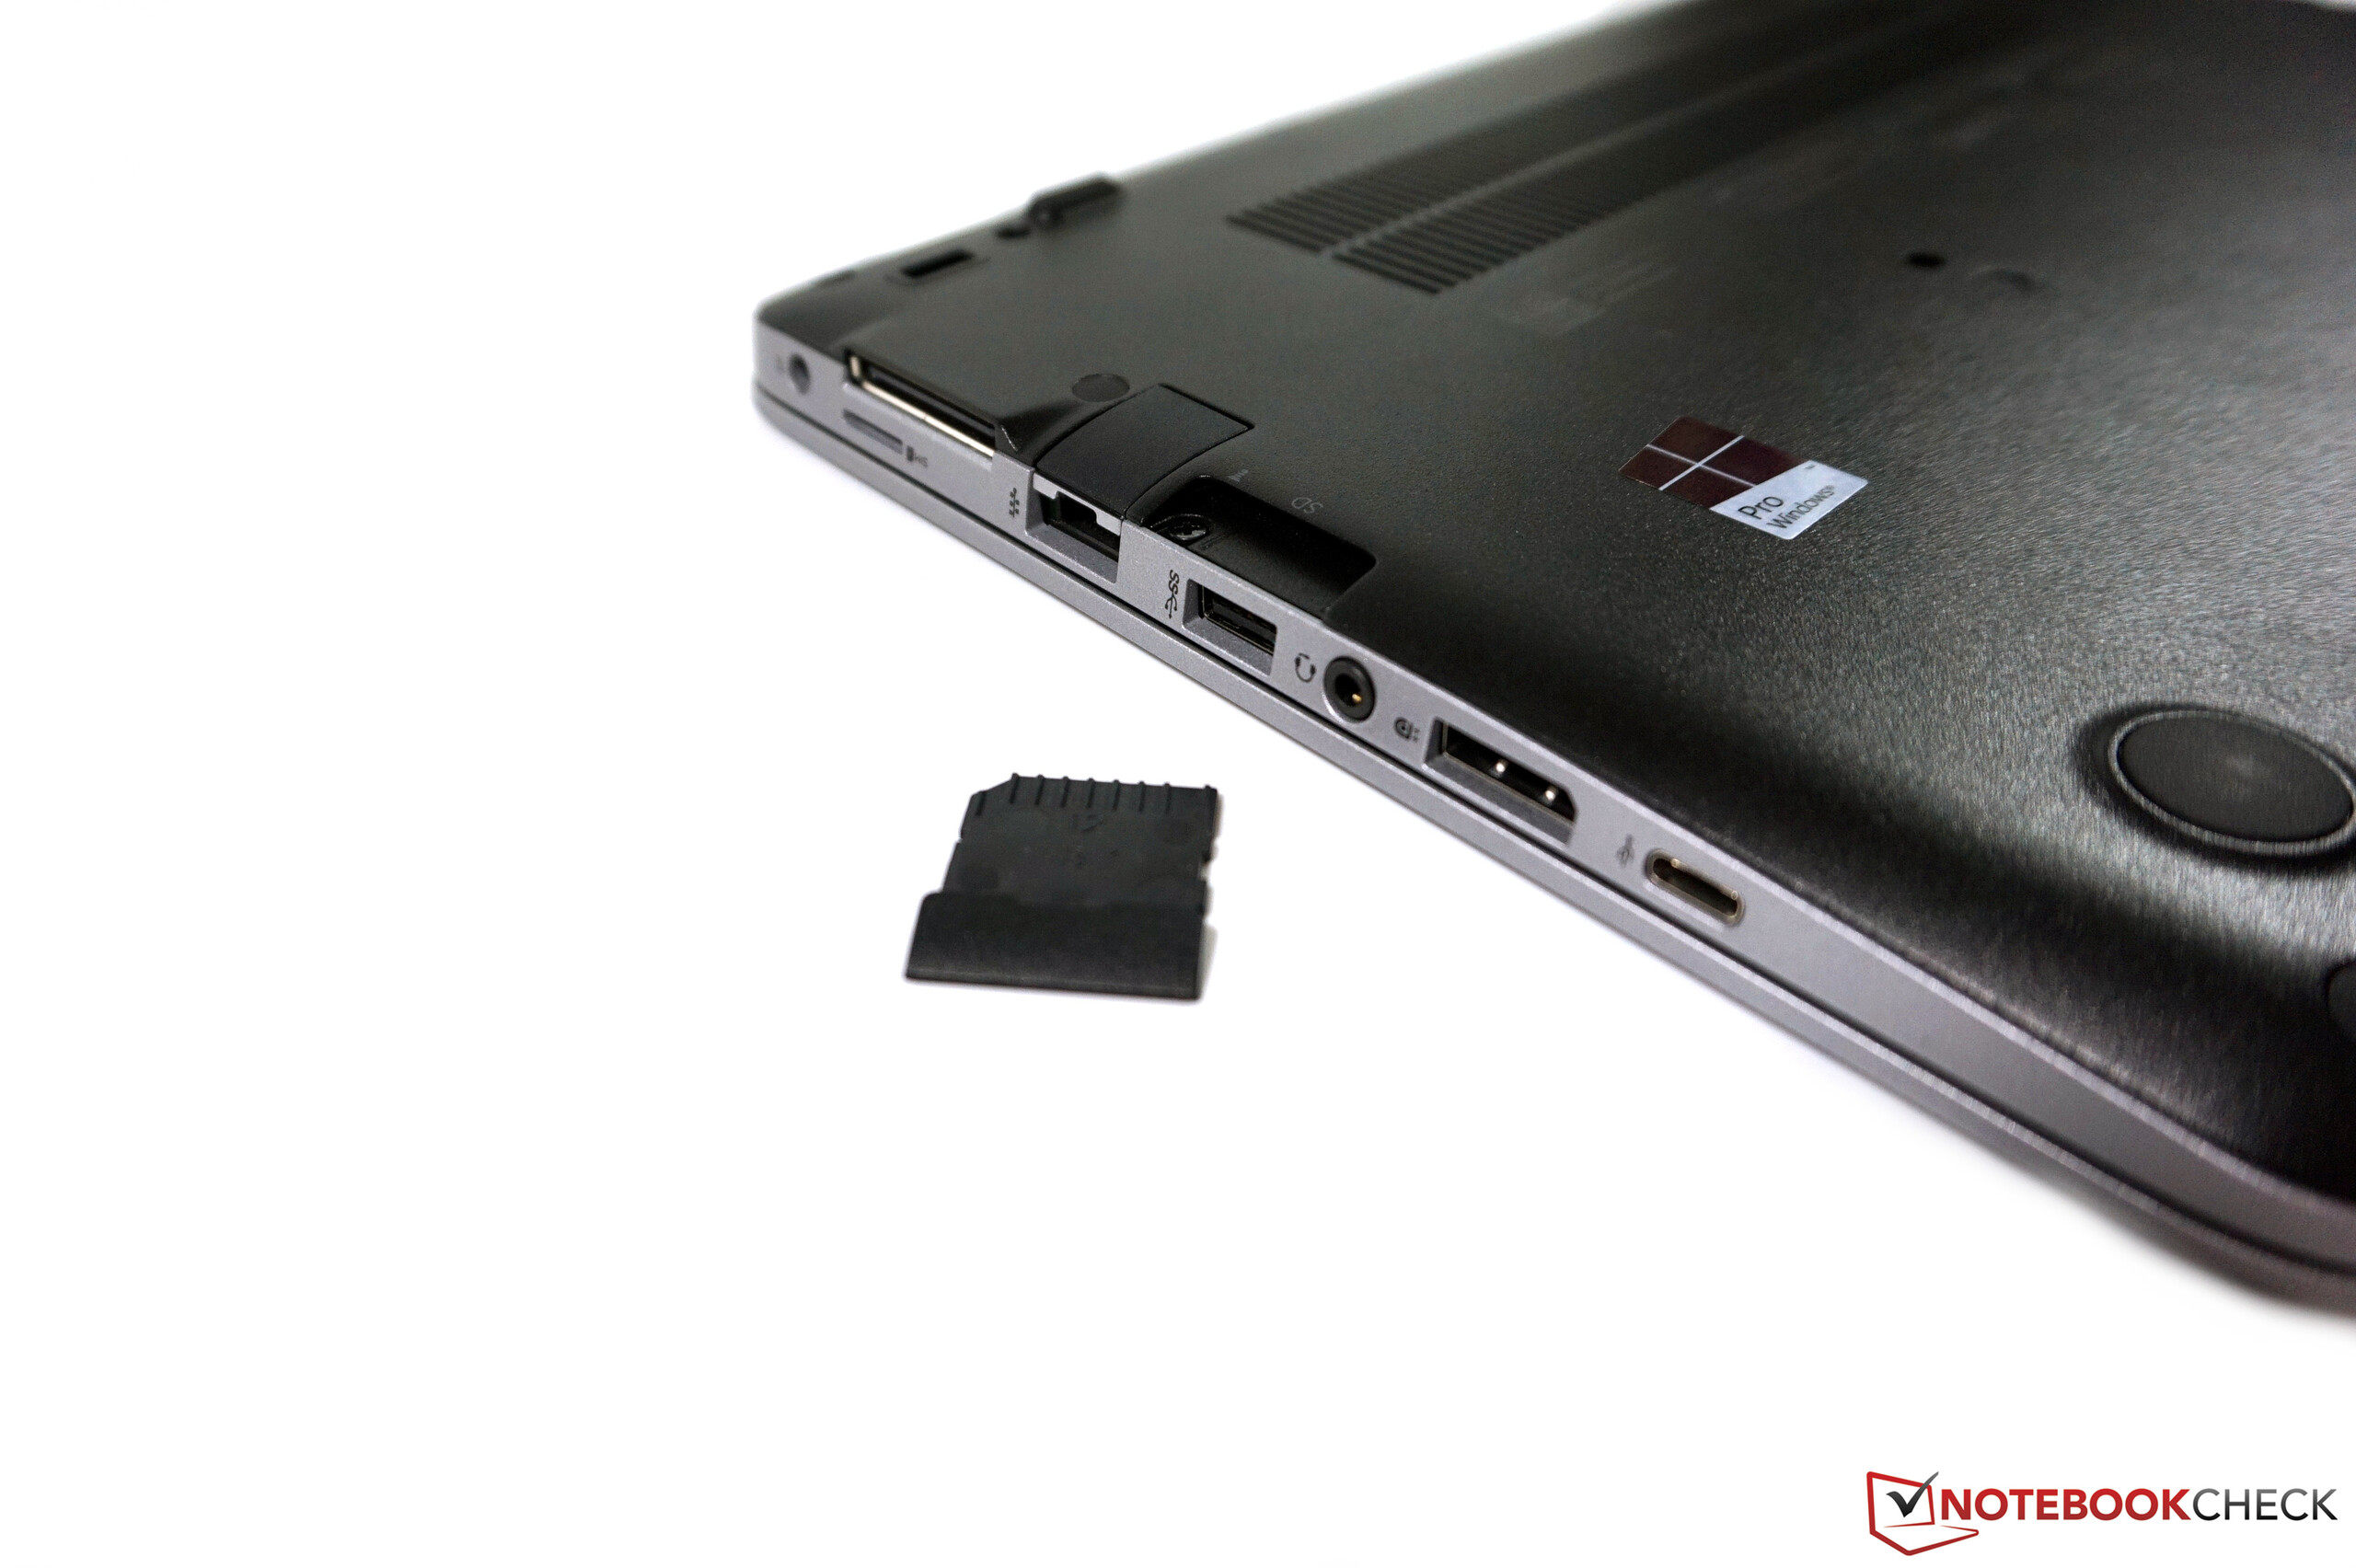
这些相对次要的问题让我们几乎忘记了它的优势,惠普赋予了它非常优秀的机身和连接性,可维护性以及出色的性能。这台设备在运行中可以保持清凉,电池续航也十分不错。除了我们所提到的问题外(至少TN屏幕应该得到改进),EliteBook 820 G3应该可以成为一台优异的亚笔记本电脑。不过,我们认为在这个价位上很难向用户推荐我们测试的这个型号。
新一代的EliteBook 820 G3受到了一些本可以避免的小问题的影响。如果可能的话,请尽量选择全高清IPS屏幕的型号。
注:本文是基于完整评测的缩减版本,阅读完整的英文评测,请点击这里。
HP EliteBook 820 G3
-
04/18/2016 v5.1(old)
Andreas Osthoff
Pricecompare
