 Deutsch
 English
 Español
 Français
 Italiano
 Nederlands
 Polski
 Português
 Русский
 Türkçe
 Svenska
 Chinese
 Magyar
惠普 EliteBook 725 G3 亚笔记本电脑简短评测
| SD Card Reader | |
| average JPG Copy Test (av. of 3 runs) | |
| HP EliteBook 820 G3 | |
| Lenovo ThinkPad X260-20F60041GE | |
| HP EliteBook 725 G3-P4T48EA | |
| maximum AS SSD Seq Read Test (1GB) | |
| Dell Latitude 12 E5270 | |
| HP EliteBook 820 G3 | |
| Lenovo ThinkPad X260-20F60041GE | |
| HP EliteBook 725 G3-P4T48EA | |
| Networking | |
| iperf Server (receive) TCP 1 m | |
| Apple MacBook 12 (Early 2016) 1.1 GHz | |
| iperf Client (transmit) TCP 1 m | |
| Apple MacBook 12 (Early 2016) 1.1 GHz | |
| |||||||||||||||||||||||||
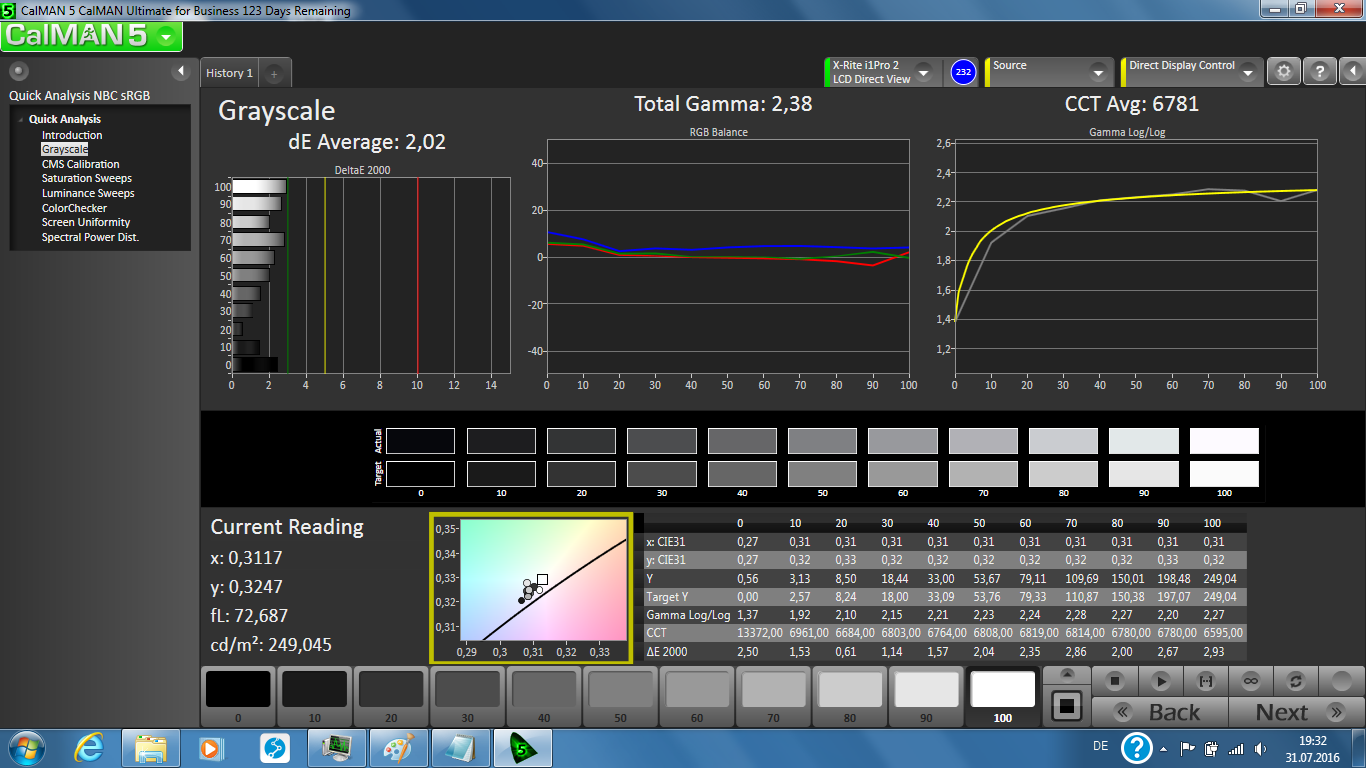
Brightness Distribution: 83 %
Center on Battery: 239 cd/m²
Contrast: 446:1 (Black: 0.54 cd/m²)
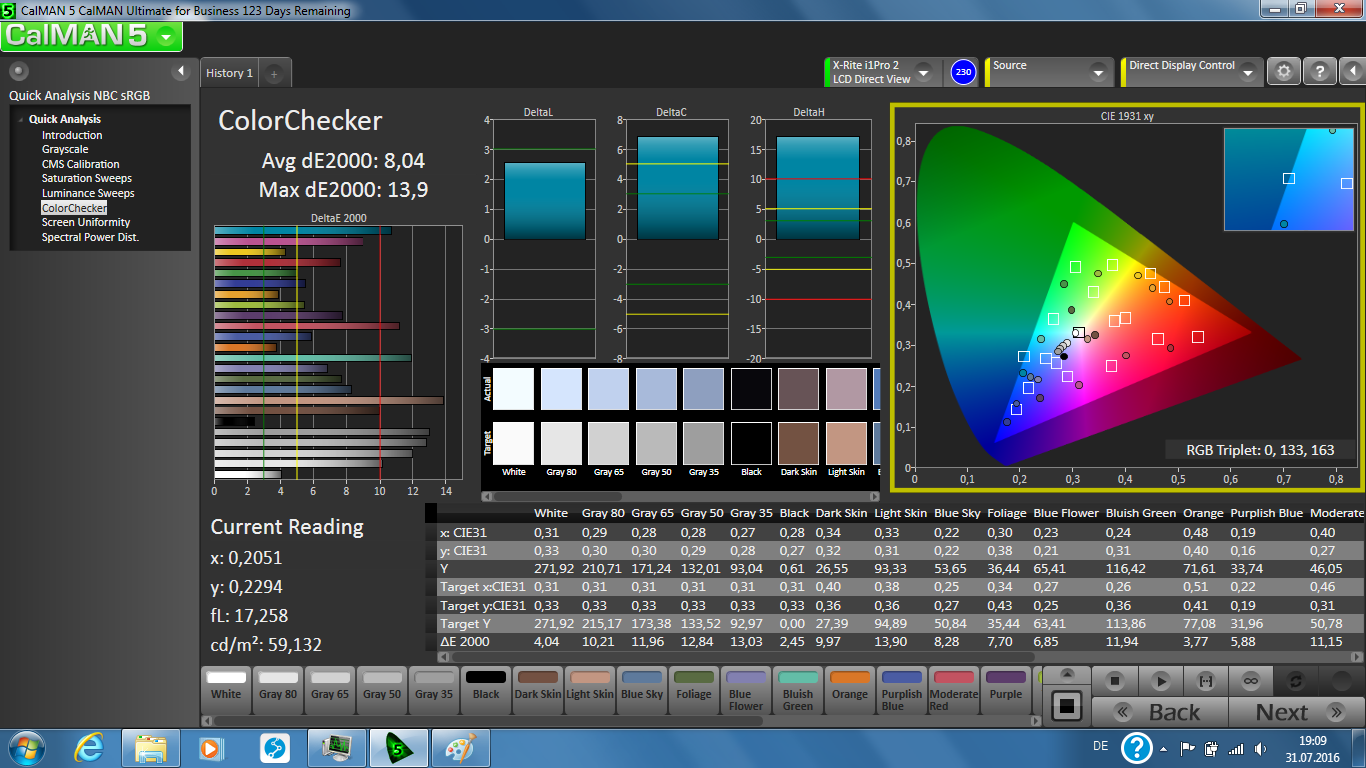
ΔE Color 8.04 | 0.5-29.43 Ø5
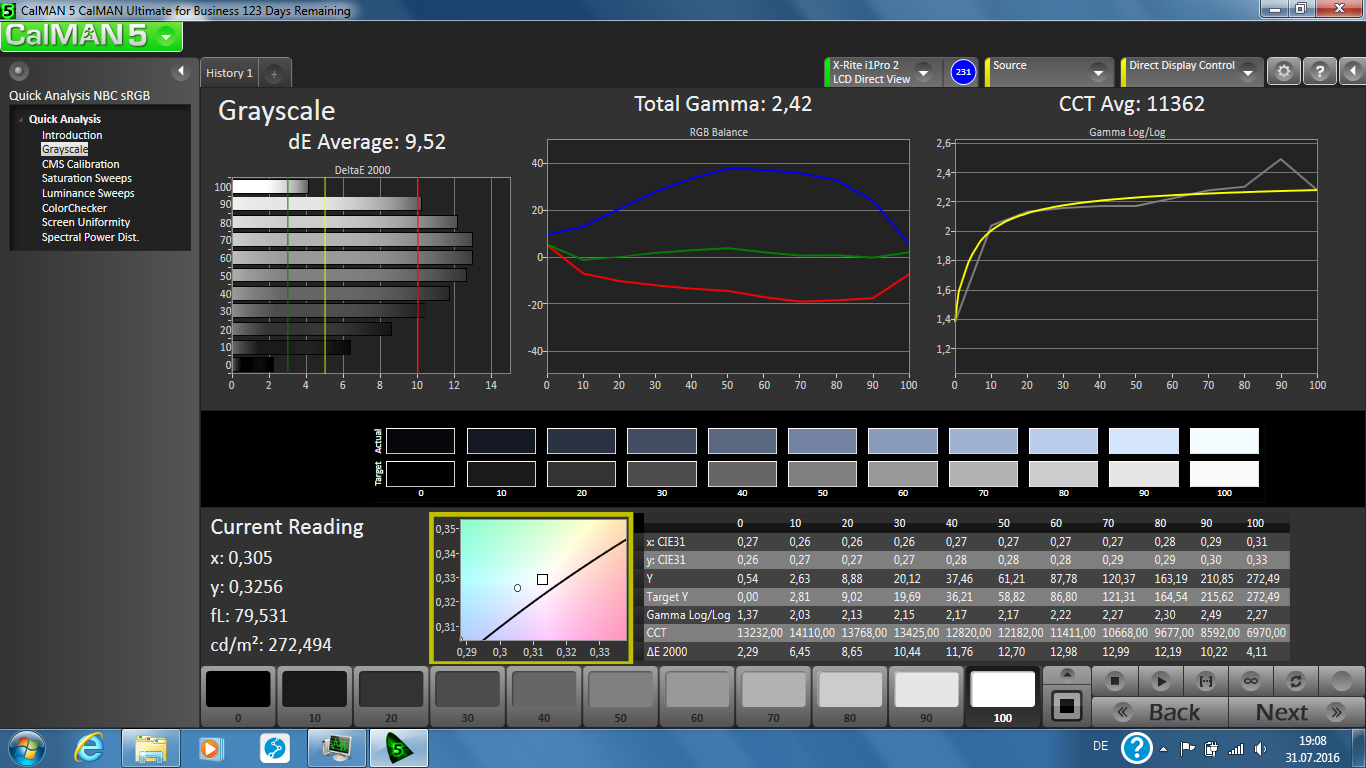
ΔE Greyscale 9.52 | 0.57-98 Ø5.3
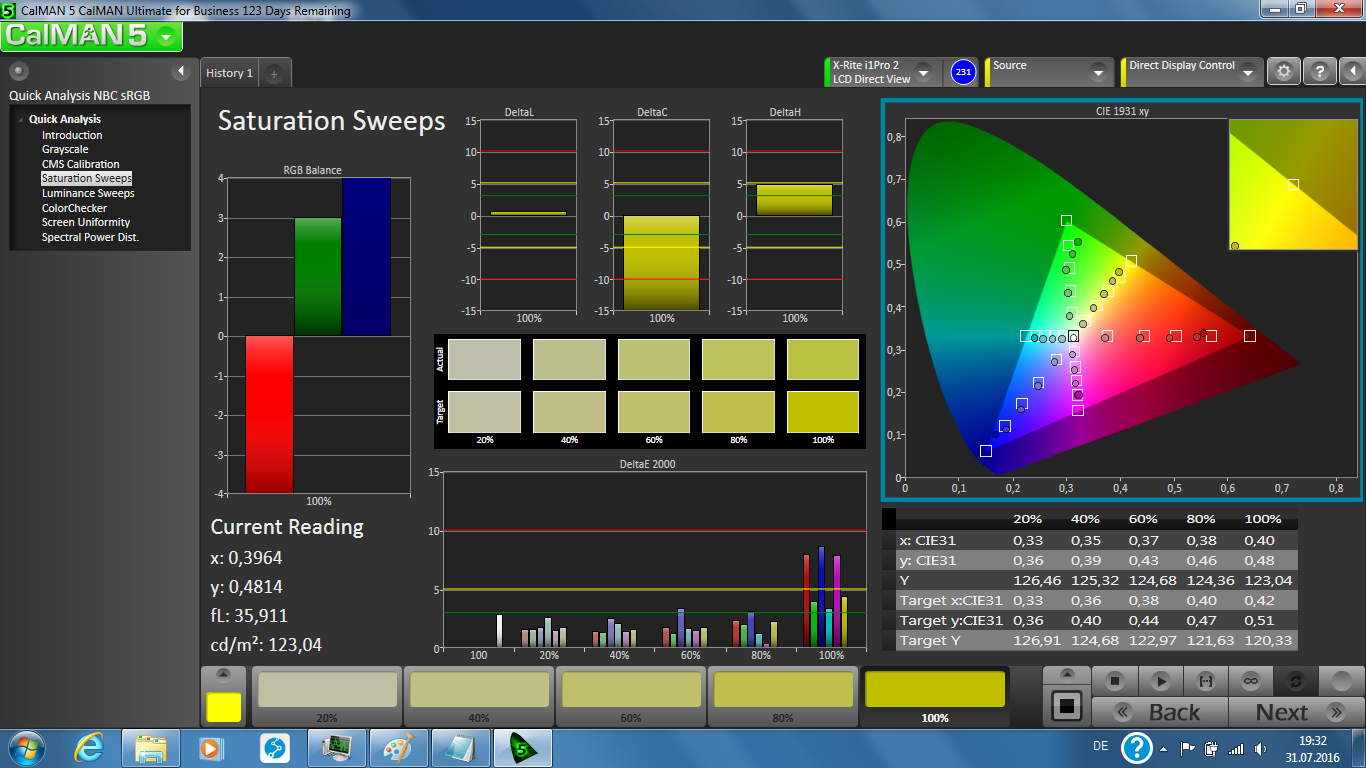
71.12% sRGB (Argyll 1.6.3 3D)
45.03% AdobeRGB 1998 (Argyll 1.6.3 3D)
48.71% AdobeRGB 1998 (Argyll 2.2.0 3D)
71% sRGB (Argyll 2.2.0 3D)
47.15% Display P3 (Argyll 2.2.0 3D)
Gamma: 2.42
| HP EliteBook 725 G3-P4T48EA TN LED, 1366x768 | HP EliteBook 725 G2 TN-Panel, 1366x768 | Dell Latitude 12 E5270 TN, 1366x768 | Lenovo ThinkPad X260-20F60041GE IPS, 1366x768 | Toshiba Portege Z30-C-125 IPS, 1920x1080 | HP EliteBook 820 G3 TN LED, 1366x768 | Apple MacBook 12 (Early 2016) 1.1 GHz IPS, 2304x1440 | |
|---|---|---|---|---|---|---|---|
| Display | -14% | -17% | 2% | 46% | -17% | 39% | |
| Display P3 Coverage | 47.15 | 40.56 -14% | 39.06 -17% | 48.19 2% | 72.3 53% | 38.9 -17% | 66.8 42% |
| sRGB Coverage | 71 | 61 -14% | 58.7 -17% | 72.6 2% | 93.8 32% | 58.5 -18% | 95.4 34% |
| AdobeRGB 1998 Coverage | 48.71 | 41.92 -14% | 40.36 -17% | 49.79 2% | 73.8 52% | 40.2 -17% | 68 40% |
| Response Times | 5% | 1% | -19% | -5% | |||
| Response Time Grey 50% / Grey 80% * | 50 ? | 45.2 ? 10% | 42.8 ? 14% | 58 ? -16% | 41.2 ? 18% | ||
| Response Time Black / White * | 24 ? | 24 ? -0% | 27.2 ? -13% | 29.2 ? -22% | 30.4 ? -27% | ||
| PWM Frequency | 1000 ? | 220 ? | |||||
| Screen | -30% | -11% | 42% | 63% | -8% | 51% | |
| Brightness middle | 241 | 188 -22% | 161 -33% | 262 9% | 367.1 52% | 244 1% | 387 61% |
| Brightness | 240 | 186 -22% | 152 -37% | 251 5% | 341 42% | 240 0% | 358 49% |
| Brightness Distribution | 83 | 91 10% | 90 8% | 88 6% | 85 2% | 84 1% | 88 6% |
| Black Level * | 0.54 | 0.86 -59% | 0.29 46% | 0.26 52% | 0.3 44% | 0.6 -11% | 0.47 13% |
| Contrast | 446 | 219 -51% | 555 24% | 1008 126% | 1224 174% | 407 -9% | 823 85% |
| Colorchecker dE 2000 * | 8.04 | 12.31 -53% | 10.31 -28% | 3.55 56% | 9 -12% | 1.6 80% | |
| Colorchecker dE 2000 max. * | 13.9 | 18.58 -34% | 5.85 58% | 15.73 -13% | 4 71% | ||
| Greyscale dE 2000 * | 9.52 | 12.56 -32% | 11.3 -19% | 3.36 65% | 9.48 -0% | 1 89% | |
| Gamma | 2.42 91% | 1.86 118% | 2.57 86% | 2.39 92% | 2.44 90% | 2.26 97% | |
| CCT | 11362 57% | 12047 54% | 13574 48% | 5985 109% | 11116 58% | 6680 97% | |
| Color Space (Percent of AdobeRGB 1998) | 45.03 | 38.6 -14% | 37.32 -17% | 45.9 2% | 37.18 -17% | 61.6 37% | |
| Color Space (Percent of sRGB) | 71.12 | 58.82 -17% | 58.63 -18% | 82.2 16% | |||
| Total Average (Program / Settings) | -22% /
-26% | -8% /
-10% | 15% /
28% | 55% /
56% | -15% /
-11% | 28% /
41% |
* ... smaller is better
Screen Flickering / PWM (Pulse-Width Modulation)
| Screen flickering / PWM not detected | ||
In comparison: 53 % of all tested devices do not use PWM to dim the display. If PWM was detected, an average of 17900 (minimum: 5 - maximum: 3846000) Hz was measured. | ||
Display Response Times
| ↔ Response Time Black to White | ||
|---|---|---|
| 24 ms ... rise ↗ and fall ↘ combined | ↗ 20 ms rise | 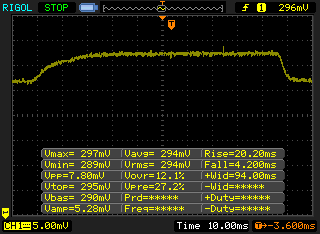 |
| ↘ 4 ms fall | ||
| The screen shows good response rates in our tests, but may be too slow for competitive gamers. In comparison, all tested devices range from 0.1 (minimum) to 240 (maximum) ms. » 48 % of all devices are better. This means that the measured response time is worse than the average of all tested devices (21.5 ms). | ||
| ↔ Response Time 50% Grey to 80% Grey | ||
| 50 ms ... rise ↗ and fall ↘ combined | ↗ 27 ms rise | 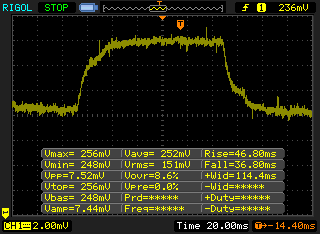 |
| ↘ 23 ms fall | ||
| The screen shows slow response rates in our tests and will be unsatisfactory for gamers. In comparison, all tested devices range from 0.2 (minimum) to 636 (maximum) ms. » 84 % of all devices are better. This means that the measured response time is worse than the average of all tested devices (33.7 ms). | ||
| Cinebench R15 | |
| CPU Single 64Bit | |
| Toshiba Portege Z30-C-125 | |
| HP EliteBook 820 G3 | |
| Dell Latitude 12 E5270 | |
| Lenovo ThinkPad X260-20F60041GE | |
| Apple MacBook 12 (Early 2016) 1.1 GHz | |
| Apple MacBook 12 (Early 2016) 1.1 GHz | |
| Lenovo B50-70 MCC2GGE | |
| Acer Extensa 2510-34Z4 | |
| HP EliteBook 725 G3-P4T48EA | |
| HP EliteBook 725 G2 | |
| CPU Multi 64Bit | |
| Toshiba Portege Z30-C-125 | |
| HP EliteBook 820 G3 | |
| Dell Latitude 12 E5270 | |
| Lenovo ThinkPad X260-20F60041GE | |
| Apple MacBook 12 (Early 2016) 1.1 GHz | |
| HP EliteBook 725 G3-P4T48EA | |
| Acer Extensa 2510-34Z4 | |
| Lenovo B50-70 MCC2GGE | |
| HP EliteBook 725 G2 | |
| Cinebench R10 | |
| Rendering Multiple CPUs 32Bit | |
| Dell Latitude 12 E5270 | |
| Lenovo ThinkPad X260-20F60041GE | |
| Apple MacBook 12 (Early 2016) 1.1 GHz | |
| Lenovo B50-70 MCC2GGE | |
| HP EliteBook 725 G3-P4T48EA | |
| HP EliteBook 725 G2 | |
| Rendering Single 32Bit | |
| Dell Latitude 12 E5270 | |
| Lenovo ThinkPad X260-20F60041GE | |
| Apple MacBook 12 (Early 2016) 1.1 GHz | |
| Lenovo B50-70 MCC2GGE | |
| HP EliteBook 725 G3-P4T48EA | |
| HP EliteBook 725 G2 | |
| JetStream 1.1 - Total Score | |
| Dell Latitude 12 E5270 | |
| HP EliteBook 820 G3 | |
| Apple MacBook 12 (Early 2016) 1.1 GHz | |
| Apple MacBook 12 (Early 2016) 1.1 GHz | |
| Lenovo B50-70 MCC2GGE | |
| HP EliteBook 725 G3-P4T48EA | |
| HP EliteBook 725 G3-P4T48EA | |
* ... smaller is better
| PCMark 7 Score | 2331 points | |
| PCMark 8 Home Score Accelerated v2 | 2706 points | |
| PCMark 8 Creative Score Accelerated v2 | 2710 points | |
| PCMark 8 Work Score Accelerated v2 | 3691 points | |
Help | ||
| PCMark 7 - Score | |
| Lenovo ThinkPad X260-20F60041GE | |
| Dell Latitude 12 E5270 | |
| HP EliteBook 725 G3-P4T48EA | |
| HP EliteBook 725 G2 | |
| HP EliteBook 725 G3-P4T48EA Hitachi Travelstar Z7K500 HTS725050A7E630 | HP EliteBook 725 G2 Hitachi Travelstar Z7K500 HTS725050A7E630 | Dell Latitude 12 E5270 Seagate ST500LM021-1KJ15 | Lenovo ThinkPad X260-20F60041GE Seagate ST500LM000 Solid State Hybrid Drive | HP EliteBook 820 G3 Samsung SM951 MZVPV256HDGL m.2 PCI-e | Apple MacBook 12 (Early 2016) 1.1 GHz Apple SSD AP0256 | |
|---|---|---|---|---|---|---|
| CrystalDiskMark 3.0 | -11% | -26% | 18% | 13315% | 9582% | |
| Read Seq | 125.3 | 116.8 -7% | 113.8 -9% | 107.9 -14% | 1255 902% | 754 502% |
| Write Seq | 124.3 | 115.6 -7% | 108.5 -13% | 110.2 -11% | 1240 898% | 638 413% |
| Read 512 | 40.95 | 39.14 -4% | 24.9 -39% | 36.26 -11% | 1131 2662% | 616 1404% |
| Write 512 | 57.6 | 49.61 -14% | 51.9 -10% | 77.1 34% | 811 1308% | 678 1077% |
| Read 4k | 0.495 | 0.453 -8% | 0.398 -20% | 0.497 0% | 51 10203% | 14.6 2849% |
| Write 4k | 1.13 | 0.947 -16% | 0.654 -42% | 3.136 178% | 134.1 11767% | 20.5 1714% |
| Read 4k QD32 | 1.129 | 1.019 -10% | 0.798 -29% | 1.155 2% | 549 48527% | 464 40998% |
| Write 4k QD32 | 1.133 | 0.931 -18% | 0.636 -44% | 0.766 -32% | 343.9 30253% | 315 27702% |

| 3DMark 06 Standard Score | 5207 points | |
| 3DMark 11 Performance | 1424 points | |
| 3DMark Ice Storm Standard Score | 34816 points | |
| 3DMark Cloud Gate Standard Score | 3524 points | |
| 3DMark Fire Strike Score | 690 points | |
| 3DMark Time Spy Score | 300 points | |
Help | ||
| 3DMark 11 - 1280x720 Performance GPU | |
| HP EliteBook 725 G3-P4T48EA | |
| HP EliteBook 725 G3-P4T48EA | |
| Dell Latitude 12 E5270 | |
| HP EliteBook 820 G3 | |
| Toshiba Portege Z30-C-125 | |
| Lenovo ThinkPad X260-20F60041GE | |
| Apple MacBook 12 (Early 2016) 1.1 GHz | |
| HP EliteBook 725 G2 | |
| 3DMark | |
| 1280x720 Cloud Gate Standard Graphics | |
| Dell Latitude 12 E5270 | |
| Toshiba Portege Z30-C-125 | |
| HP EliteBook 820 G3 | |
| Apple MacBook 12 (Early 2016) 1.1 GHz | |
| Lenovo ThinkPad X260-20F60041GE | |
| HP EliteBook 725 G3-P4T48EA | |
| HP EliteBook 725 G2 | |
| 1920x1080 Fire Strike Graphics | |
| HP EliteBook 725 G3-P4T48EA | |
| HP EliteBook 725 G3-P4T48EA | |
| Dell Latitude 12 E5270 | |
| HP EliteBook 820 G3 | |
| Apple MacBook 12 (Early 2016) 1.1 GHz | |
| Lenovo ThinkPad X260-20F60041GE | |
| Toshiba Portege Z30-C-125 | |
| HP EliteBook 725 G2 | |
| low | med. | high | ultra | |
| Tomb Raider (2013) | 49.5 | 25.2 | 18.5 | |
| BioShock Infinite (2013) | 42.7 | 24.1 | 19.4 | |
| Battlefield 4 (2013) | 21.7 | 14.4 | 8.4 | |
| Far Cry Primal (2016) | 10 | 7 | ||
| The Division (2016) | 12.3 | 7.5 | ||
| Hitman 2016 (2016) | 6.1 | 3.9 | ||
| Need for Speed 2016 (2016) | 11.1 | 10.4 | ||
| Mirror's Edge Catalyst (2016) | 6 | 2.3 |
Noise Level
| Idle |
| 30.5 / 30.5 / 30.5 dB(A) |
| HDD |
| 30.9 dB(A) |
| Load |
| 38.2 / 38.4 dB(A) |
 | ||
30 dB silent 40 dB(A) audible 50 dB(A) loud |
||
min: | ||
(±) The maximum temperature on the upper side is 42.8 °C / 109 F, compared to the average of 35.9 °C / 97 F, ranging from 21.4 to 59 °C for the class Subnotebook.
(-) The bottom heats up to a maximum of 54.3 °C / 130 F, compared to the average of 39.4 °C / 103 F
(+) In idle usage, the average temperature for the upper side is 31.7 °C / 89 F, compared to the device average of 30.7 °C / 87 F.
(±) The palmrests and touchpad can get very hot to the touch with a maximum of 37.4 °C / 99.3 F.
(-) The average temperature of the palmrest area of similar devices was 28.3 °C / 82.9 F (-9.1 °C / -16.4 F).
HP EliteBook 725 G3-P4T48EA audio analysis
(+) | speakers can play relatively loud (82 dB)
Bass 100 - 315 Hz
(-) | nearly no bass - on average 22.4% lower than median
(±) | linearity of bass is average (13.8% delta to prev. frequency)
Mids 400 - 2000 Hz
(±) | higher mids - on average 5.3% higher than median
(+) | mids are linear (4.9% delta to prev. frequency)
Highs 2 - 16 kHz
(+) | balanced highs - only 3.3% away from median
(+) | highs are linear (4.4% delta to prev. frequency)
Overall 100 - 16.000 Hz
(±) | linearity of overall sound is average (22.3% difference to median)
Compared to same class
» 72% of all tested devices in this class were better, 5% similar, 23% worse
» The best had a delta of 5%, average was 19%, worst was 53%
Compared to all devices tested
» 60% of all tested devices were better, 7% similar, 34% worse
» The best had a delta of 4%, average was 25%, worst was 134%
Apple MacBook 12 (Early 2016) 1.1 GHz audio analysis
(+) | speakers can play relatively loud (83.6 dB)
Bass 100 - 315 Hz
(±) | reduced bass - on average 11.3% lower than median
(±) | linearity of bass is average (14.2% delta to prev. frequency)
Mids 400 - 2000 Hz
(+) | balanced mids - only 2.4% away from median
(+) | mids are linear (5.5% delta to prev. frequency)
Highs 2 - 16 kHz
(+) | balanced highs - only 2% away from median
(+) | highs are linear (4.5% delta to prev. frequency)
Overall 100 - 16.000 Hz
(+) | overall sound is linear (10.2% difference to median)
Compared to same class
» 5% of all tested devices in this class were better, 2% similar, 93% worse
» The best had a delta of 5%, average was 19%, worst was 53%
Compared to all devices tested
» 3% of all tested devices were better, 1% similar, 96% worse
» The best had a delta of 4%, average was 25%, worst was 134%
| Off / Standby | |
| Idle | |
| Load |
|
| HP EliteBook 725 G3-P4T48EA Pro A10-8700B, Radeon R6 (Carrizo) | HP EliteBook 725 G2 A10 Pro-7350B, Radeon R6 (Kaveri) | Dell Latitude 12 E5270 6300U, HD Graphics 520 | Lenovo ThinkPad X260-20F60041GE 6200U, HD Graphics 520 | Toshiba Portege Z30-C-125 6500U, HD Graphics 520 | HP EliteBook 820 G3 6300U, HD Graphics 520 | Apple MacBook 12 (Early 2016) 1.1 GHz 6Y30, HD Graphics 515 | |
|---|---|---|---|---|---|---|---|
| Power Consumption | 9% | 27% | 30% | 19% | 32% | 52% | |
| Idle Minimum * | 5.4 | 7 -30% | 3.9 28% | 3.6 33% | 2.7 50% | 3.5 35% | 2.7 50% |
| Idle Average * | 7.5 | 8.6 -15% | 6 20% | 5.9 21% | 7.7 -3% | 5.4 28% | 2.7 64% |
| Idle Maximum * | 13 | 9.9 24% | 6.6 49% | 6.6 49% | 11 15% | 6.2 52% | 7.2 45% |
| Load Average * | 41.2 | 24.4 41% | 28.9 30% | 28.5 31% | 34.8 16% | 27.3 34% | 22 47% |
| Load Maximum * | 44.7 | 32.5 27% | 41.7 7% | 36.8 18% | 36.6 18% | 39.5 12% | 20.5 54% |
* ... smaller is better
| HP EliteBook 725 G3-P4T48EA 44 Wh | HP EliteBook 725 G2 46 Wh | Dell Latitude 12 E5270 47 Wh | Lenovo ThinkPad X260-20F60041GE 46 Wh | Toshiba Portege Z30-C-125 52 Wh | HP EliteBook 820 G3 44 Wh | Apple MacBook 12 (Early 2016) 1.1 GHz 41.4 Wh | |
|---|---|---|---|---|---|---|---|
| Battery Runtime | -2% | 43% | 57% | 105% | 62% | 118% | |
| Reader / Idle | 553 | 456 -18% | 772 40% | 795 44% | 1134 105% | 826 49% | |
| H.264 | 258 | 205 -21% | 353 37% | 386 50% | 495 92% | 512 98% | |
| WiFi v1.3 | 281 | 398 42% | 396 41% | 373 33% | 501 78% | ||
| Load | 83 | 110 33% | 128 54% | 160 93% | 144 73% | 231 178% | |
| WiFi | 258 | 402 |
Pros
Cons
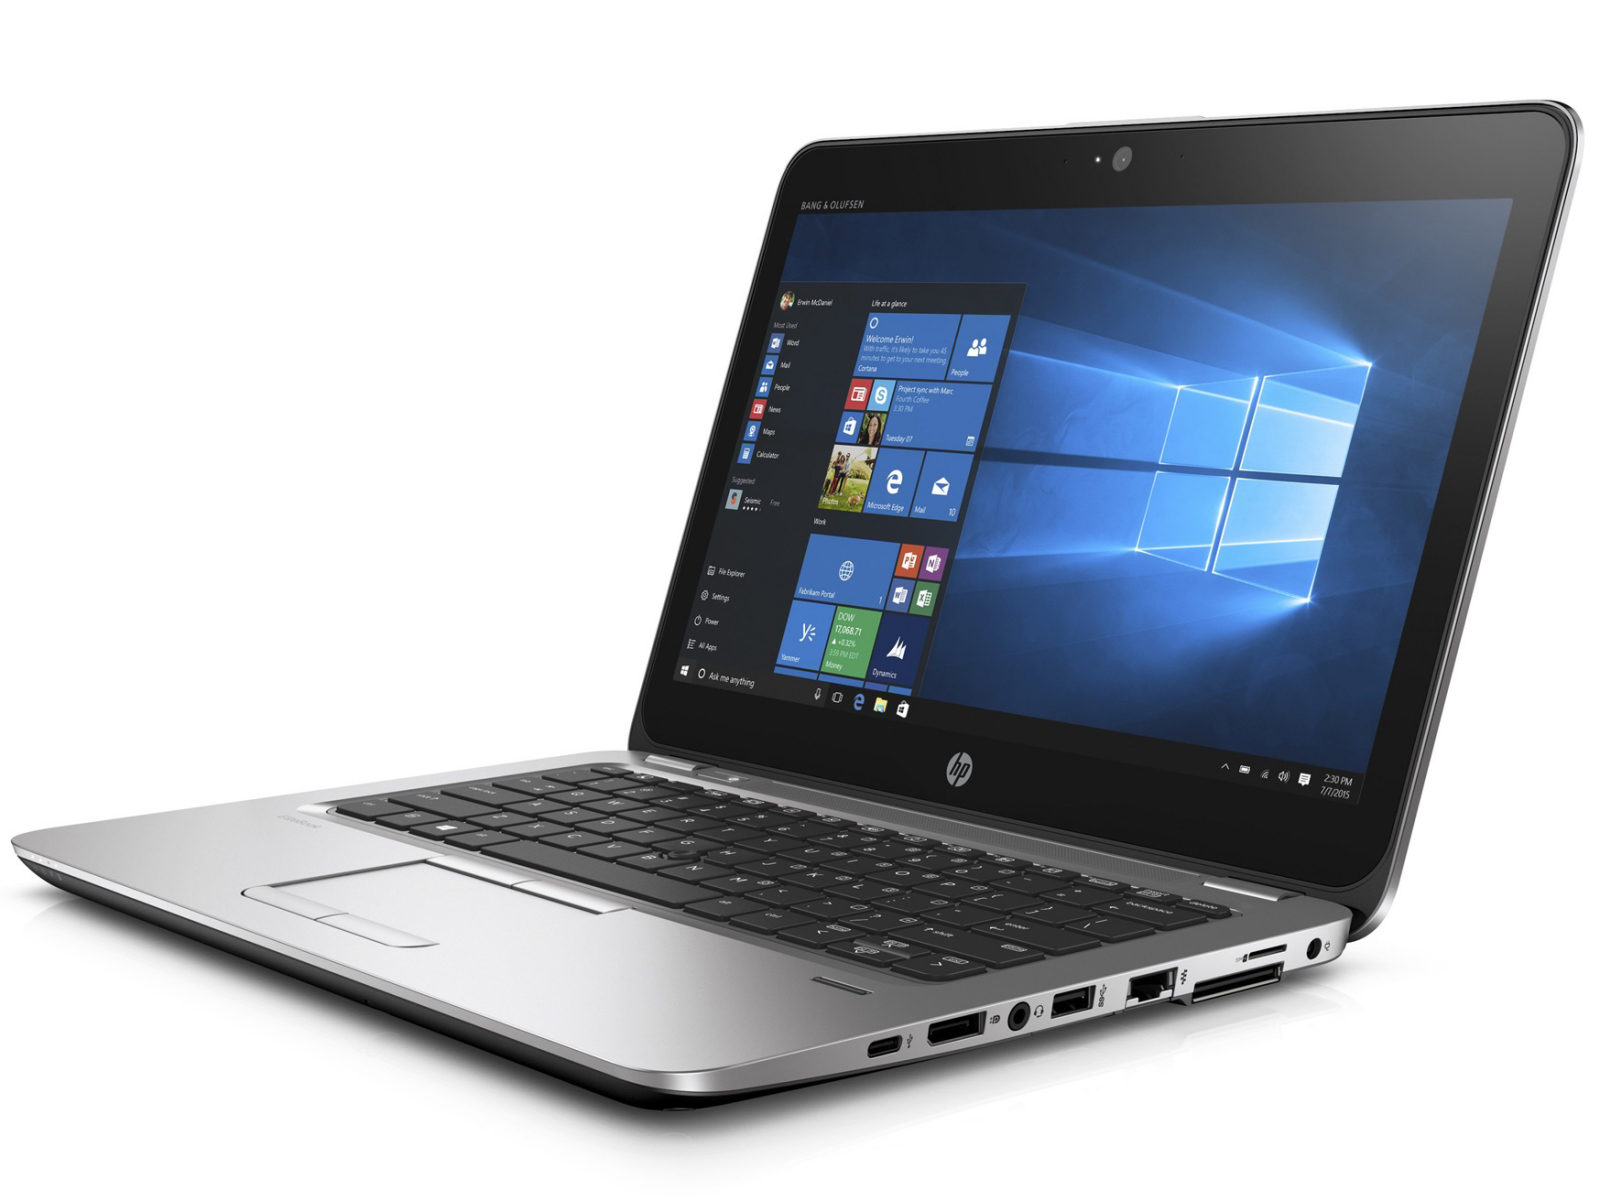
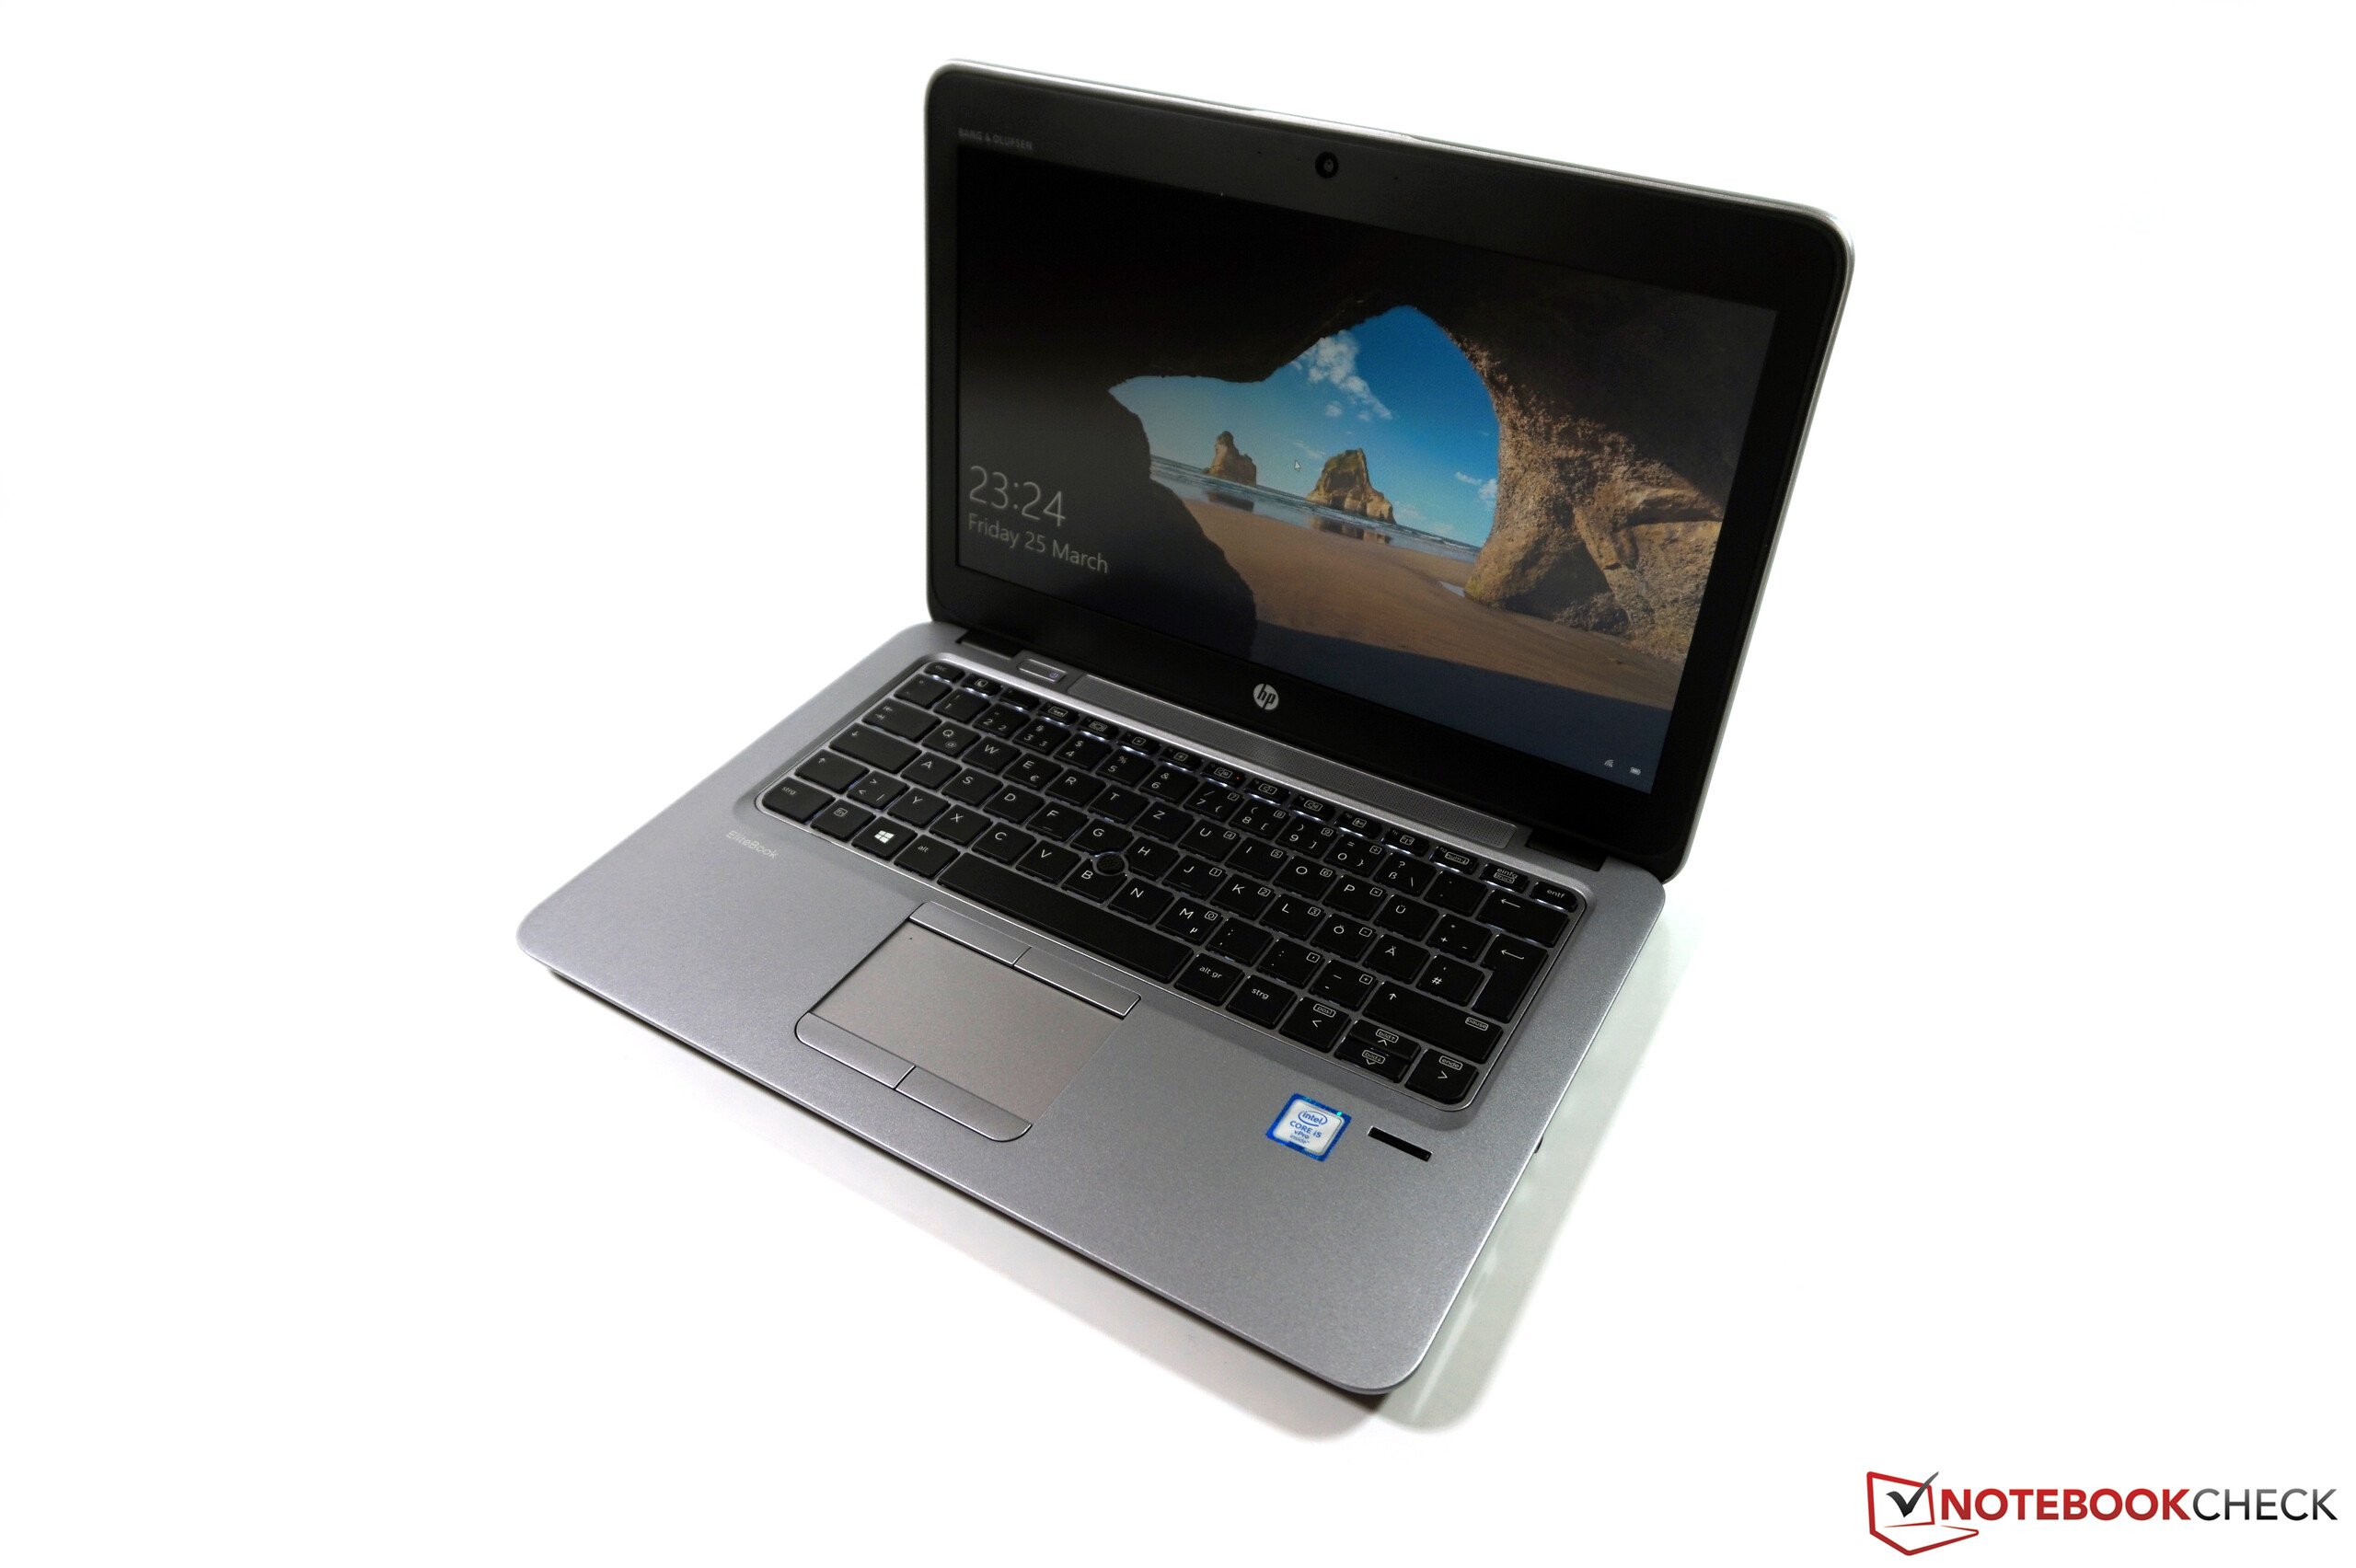
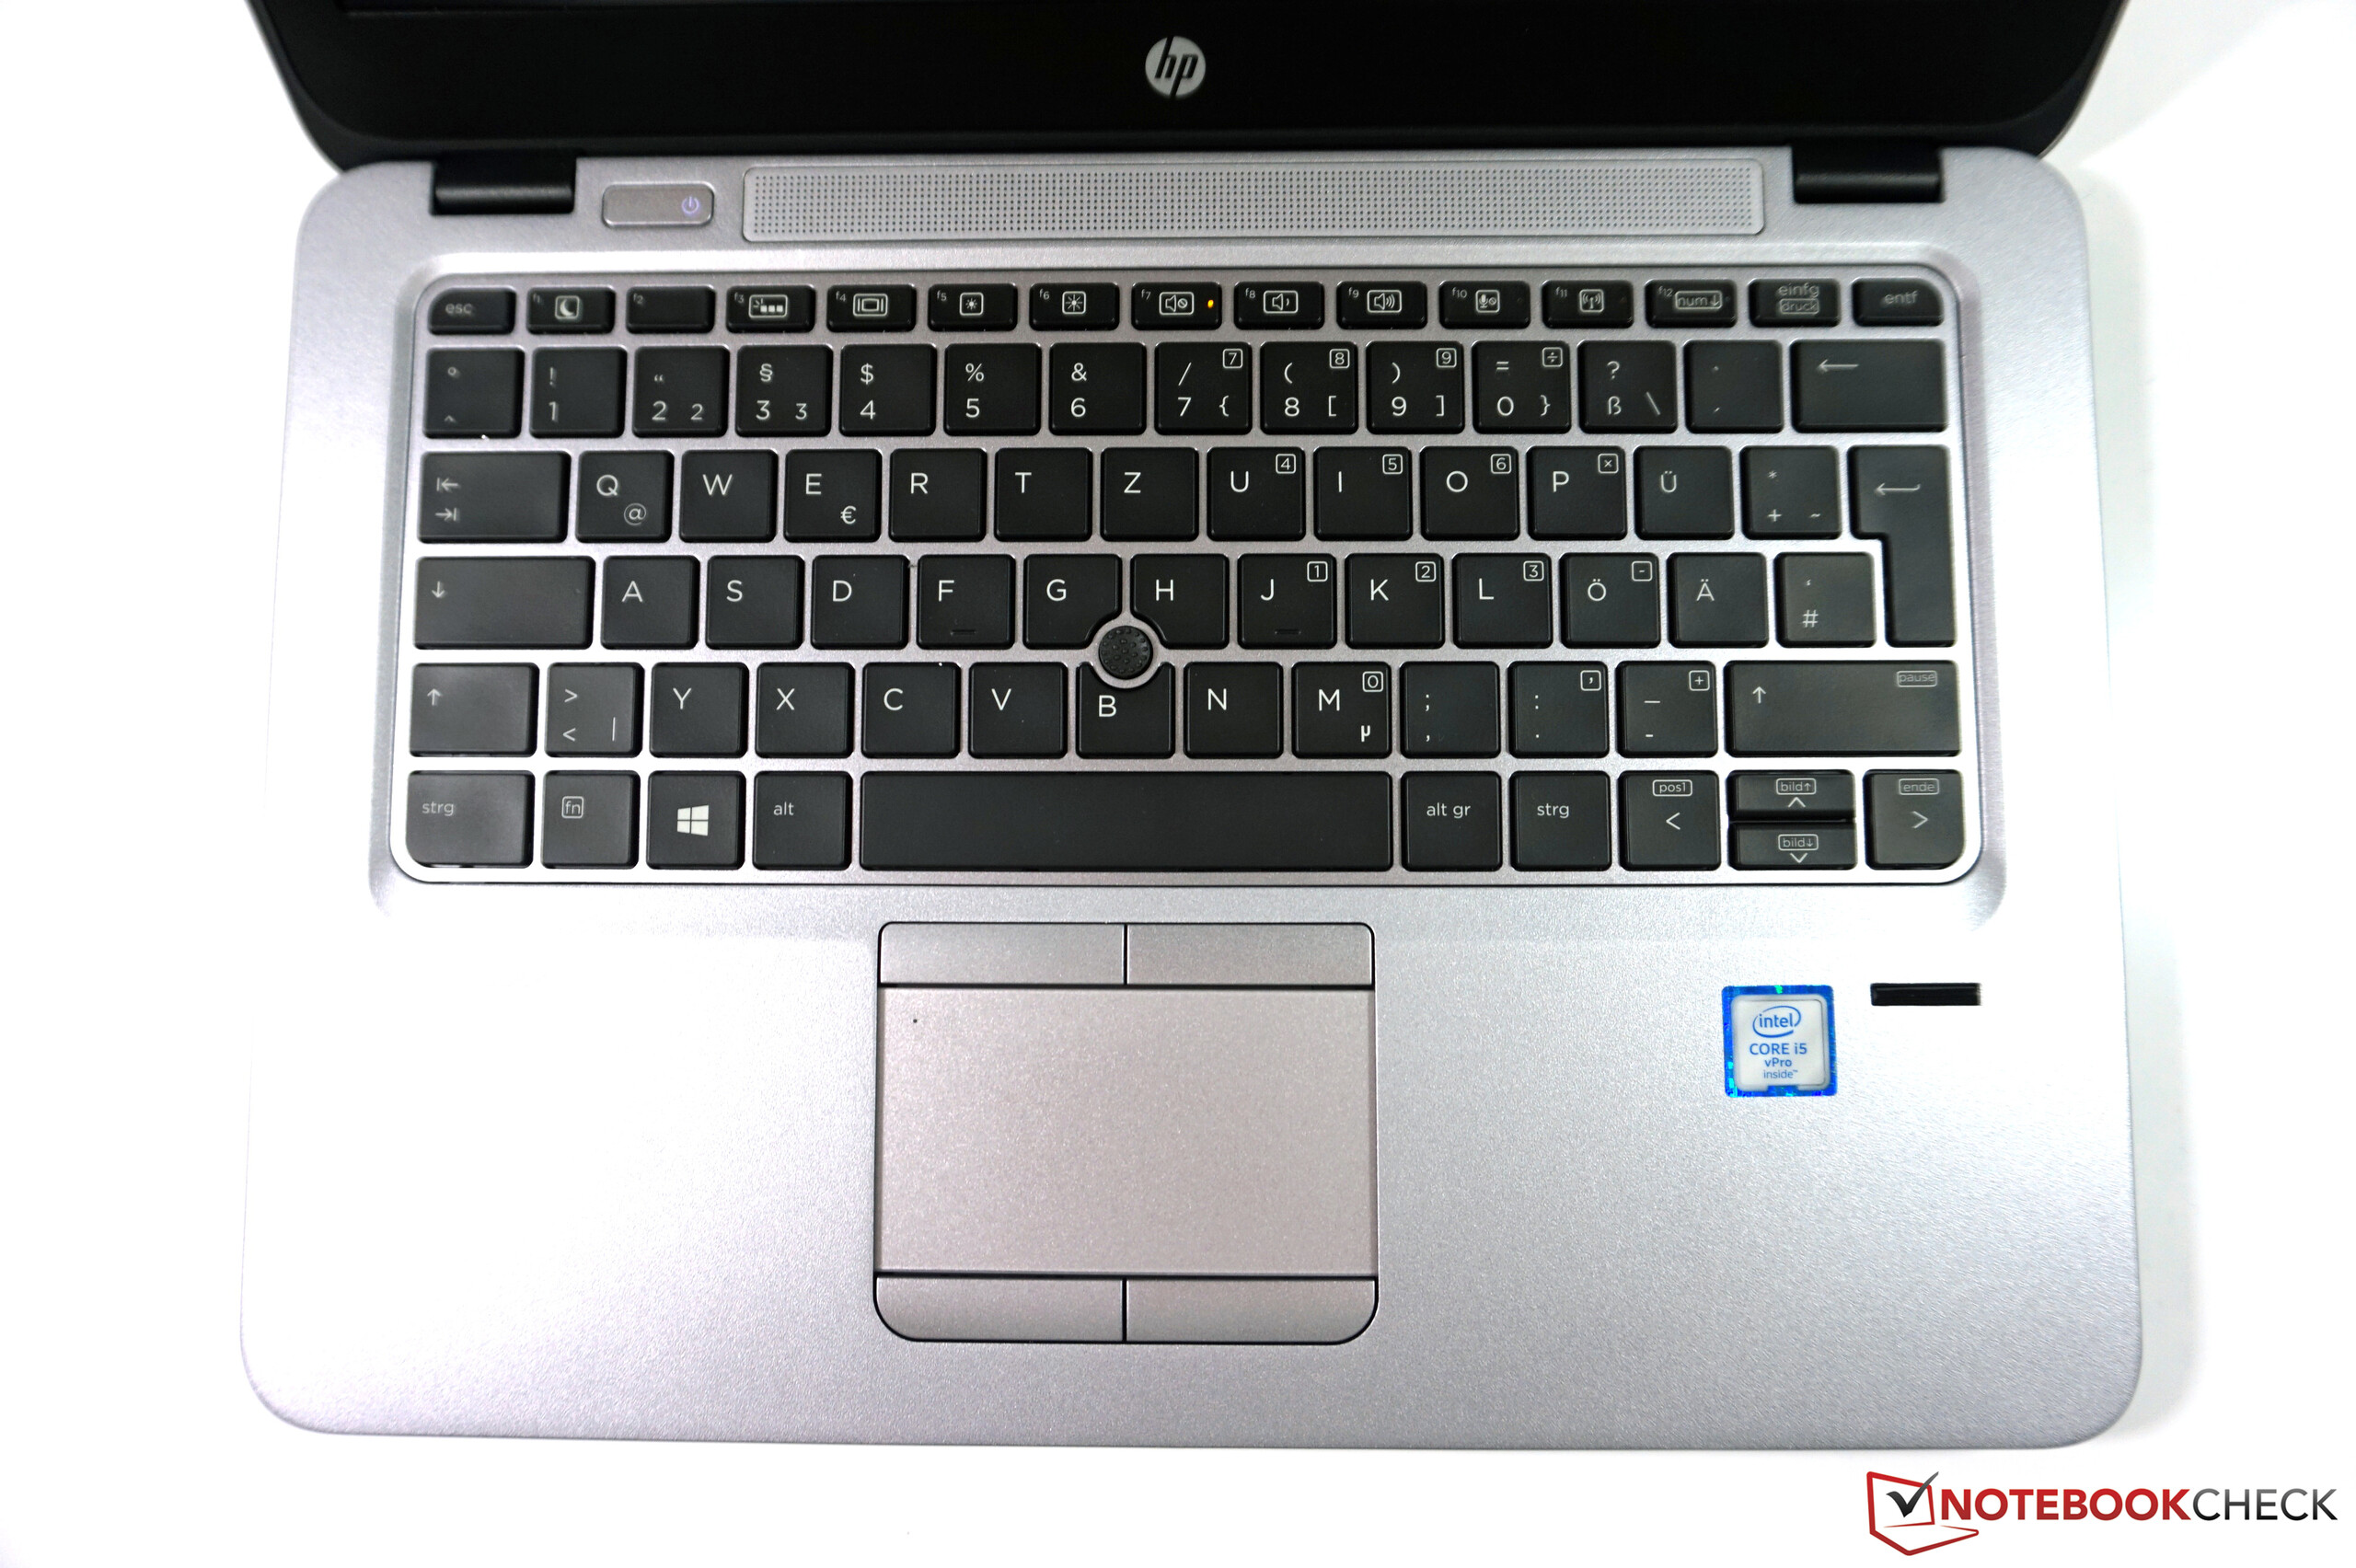
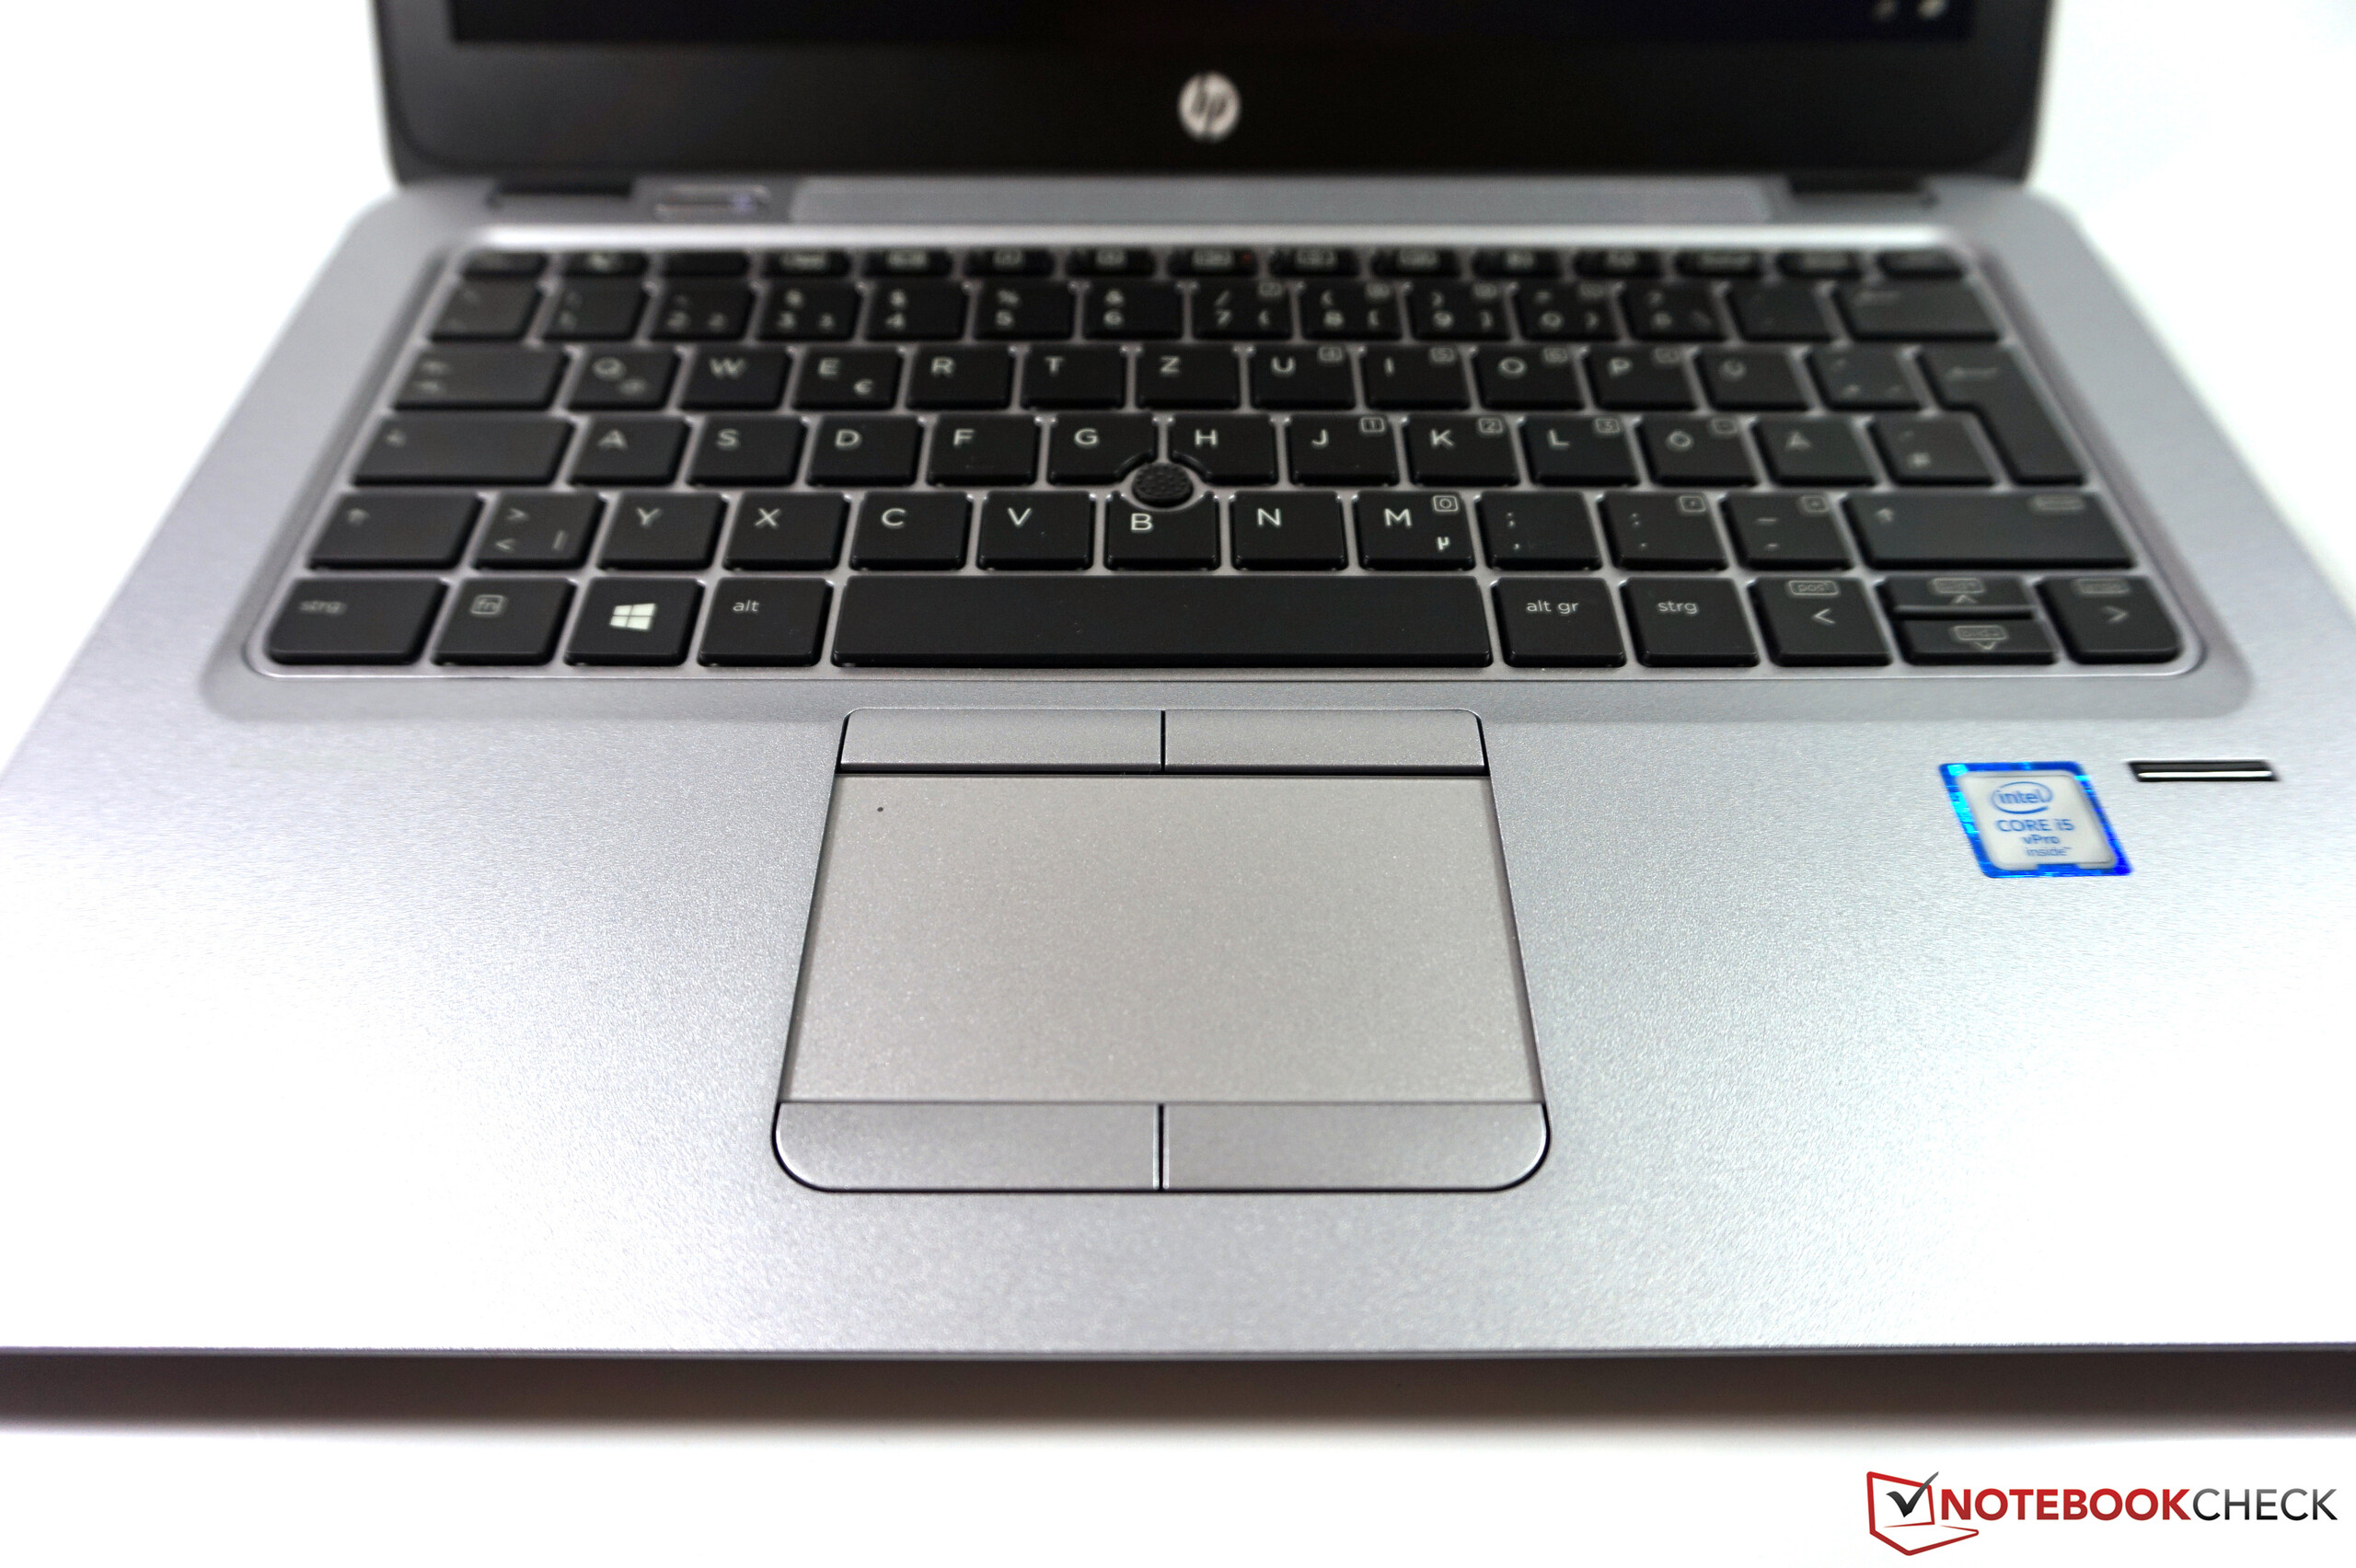
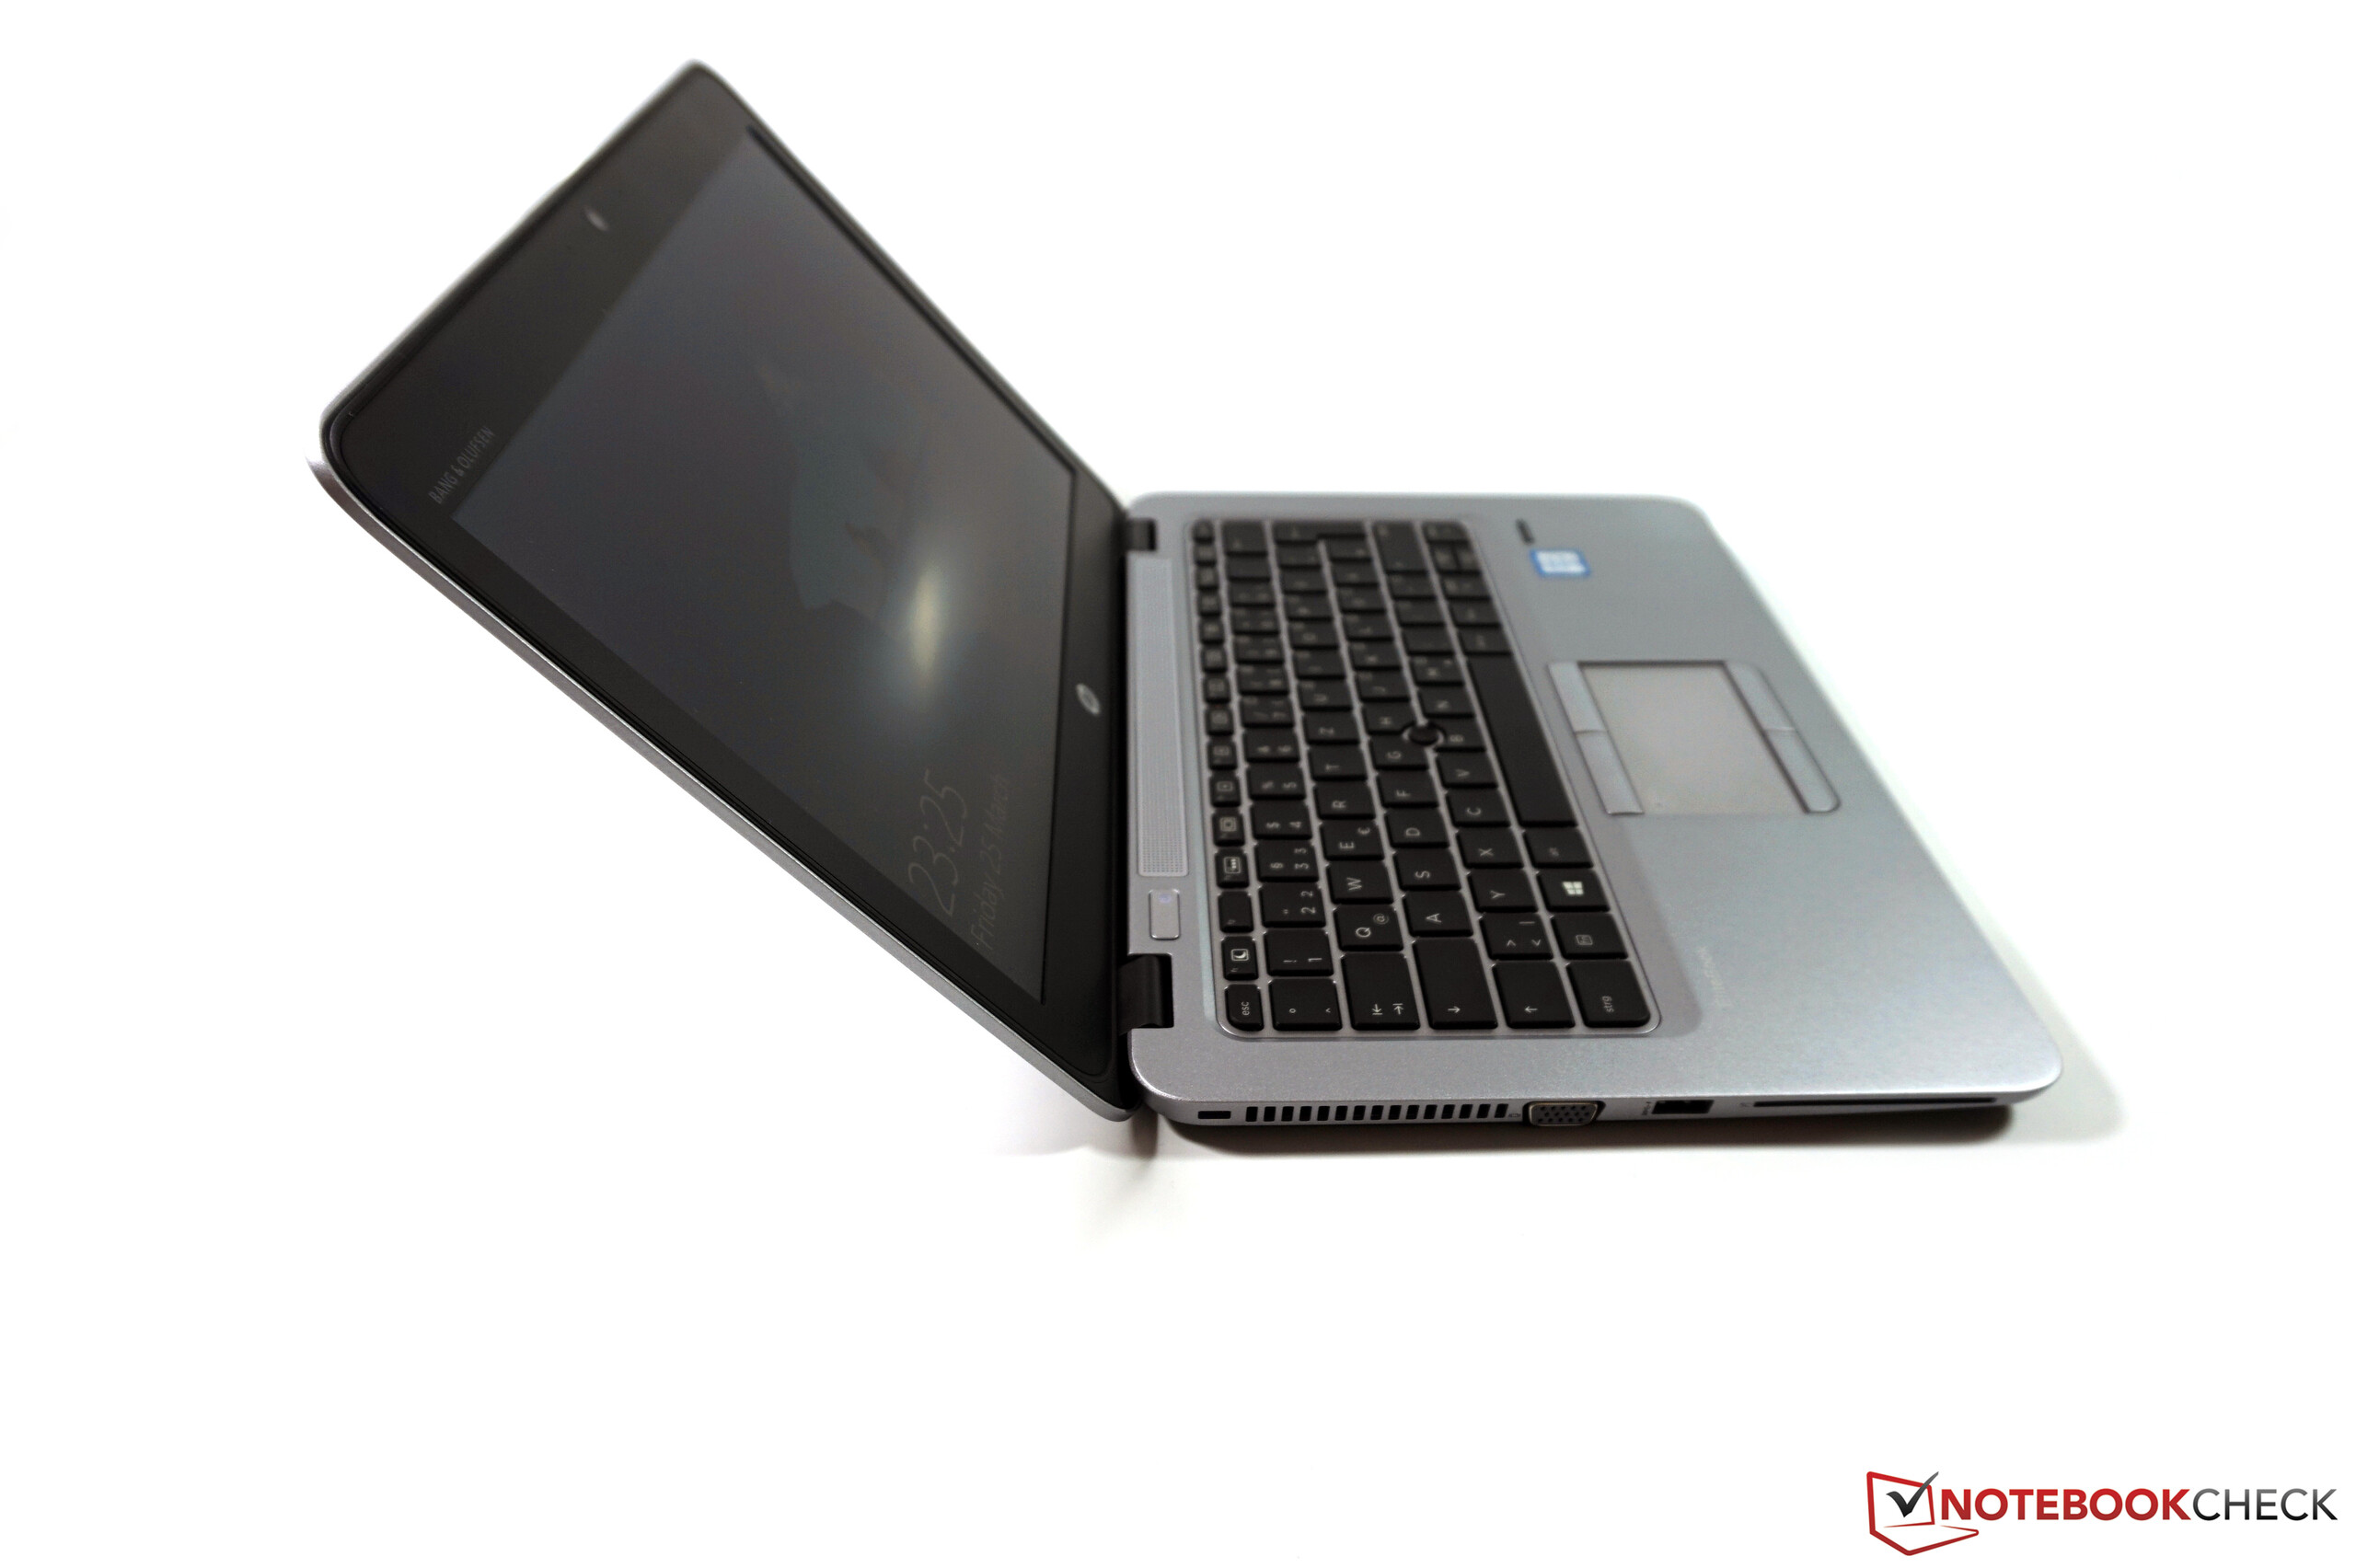
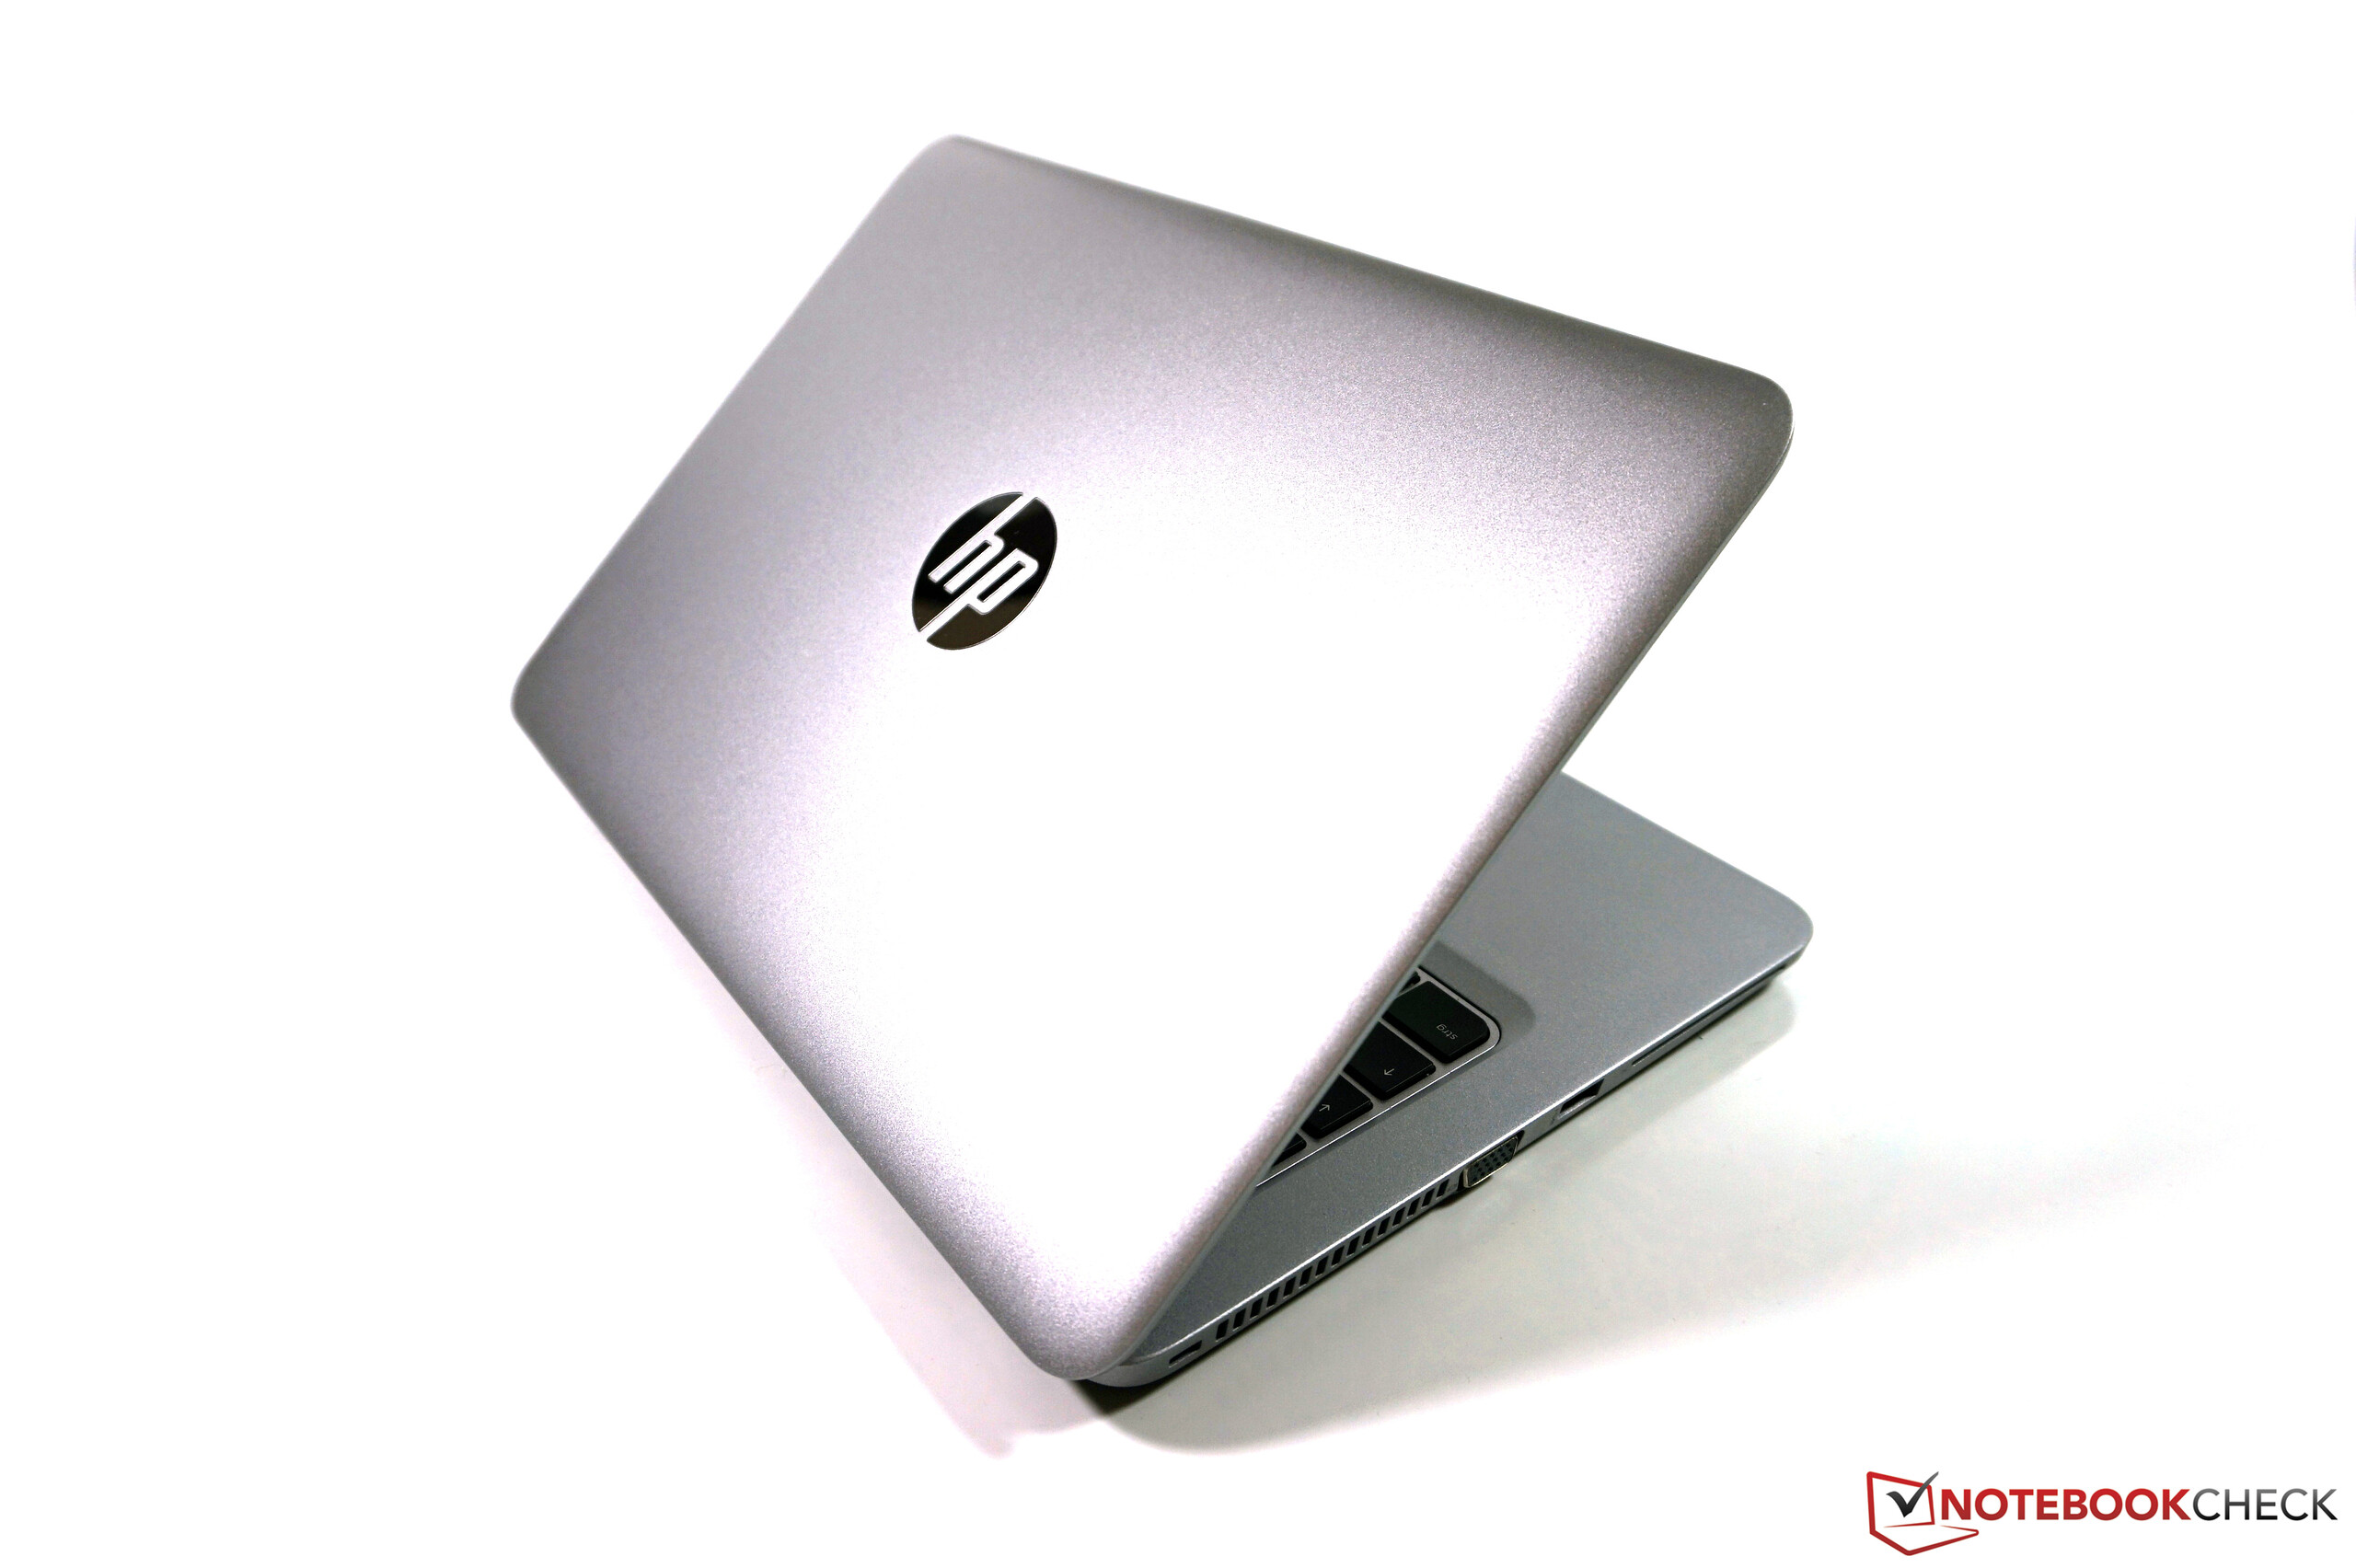
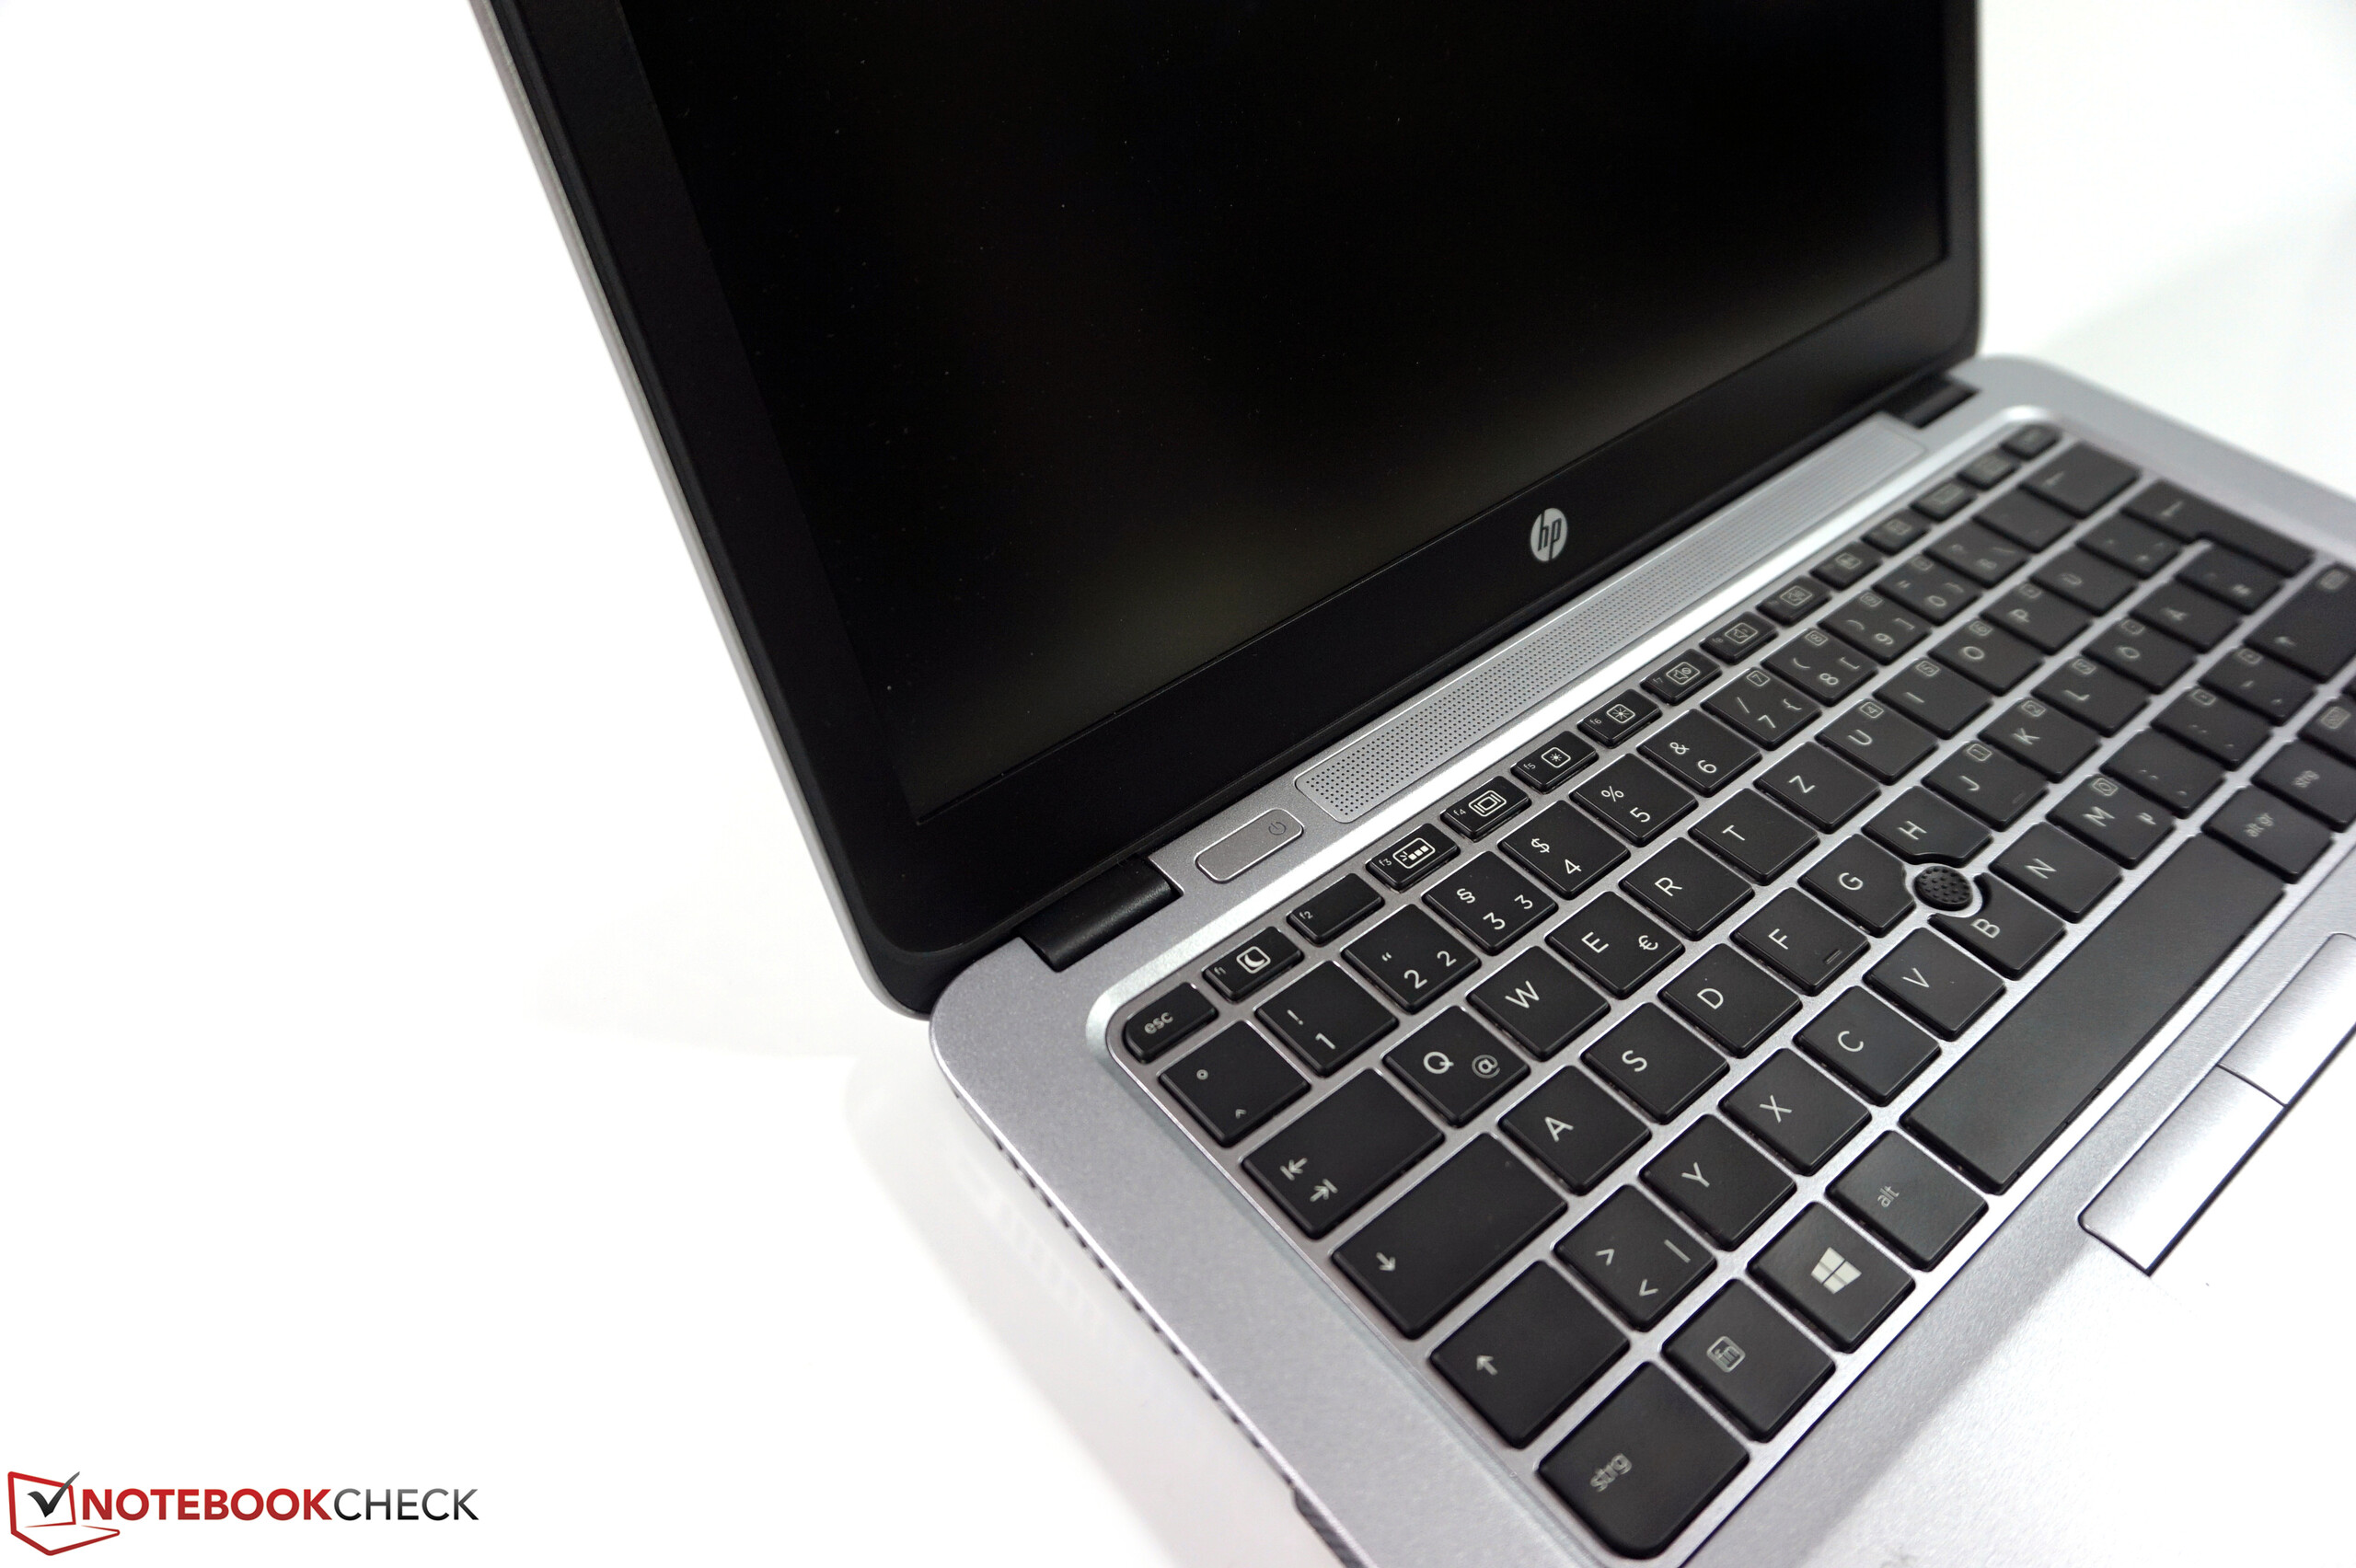
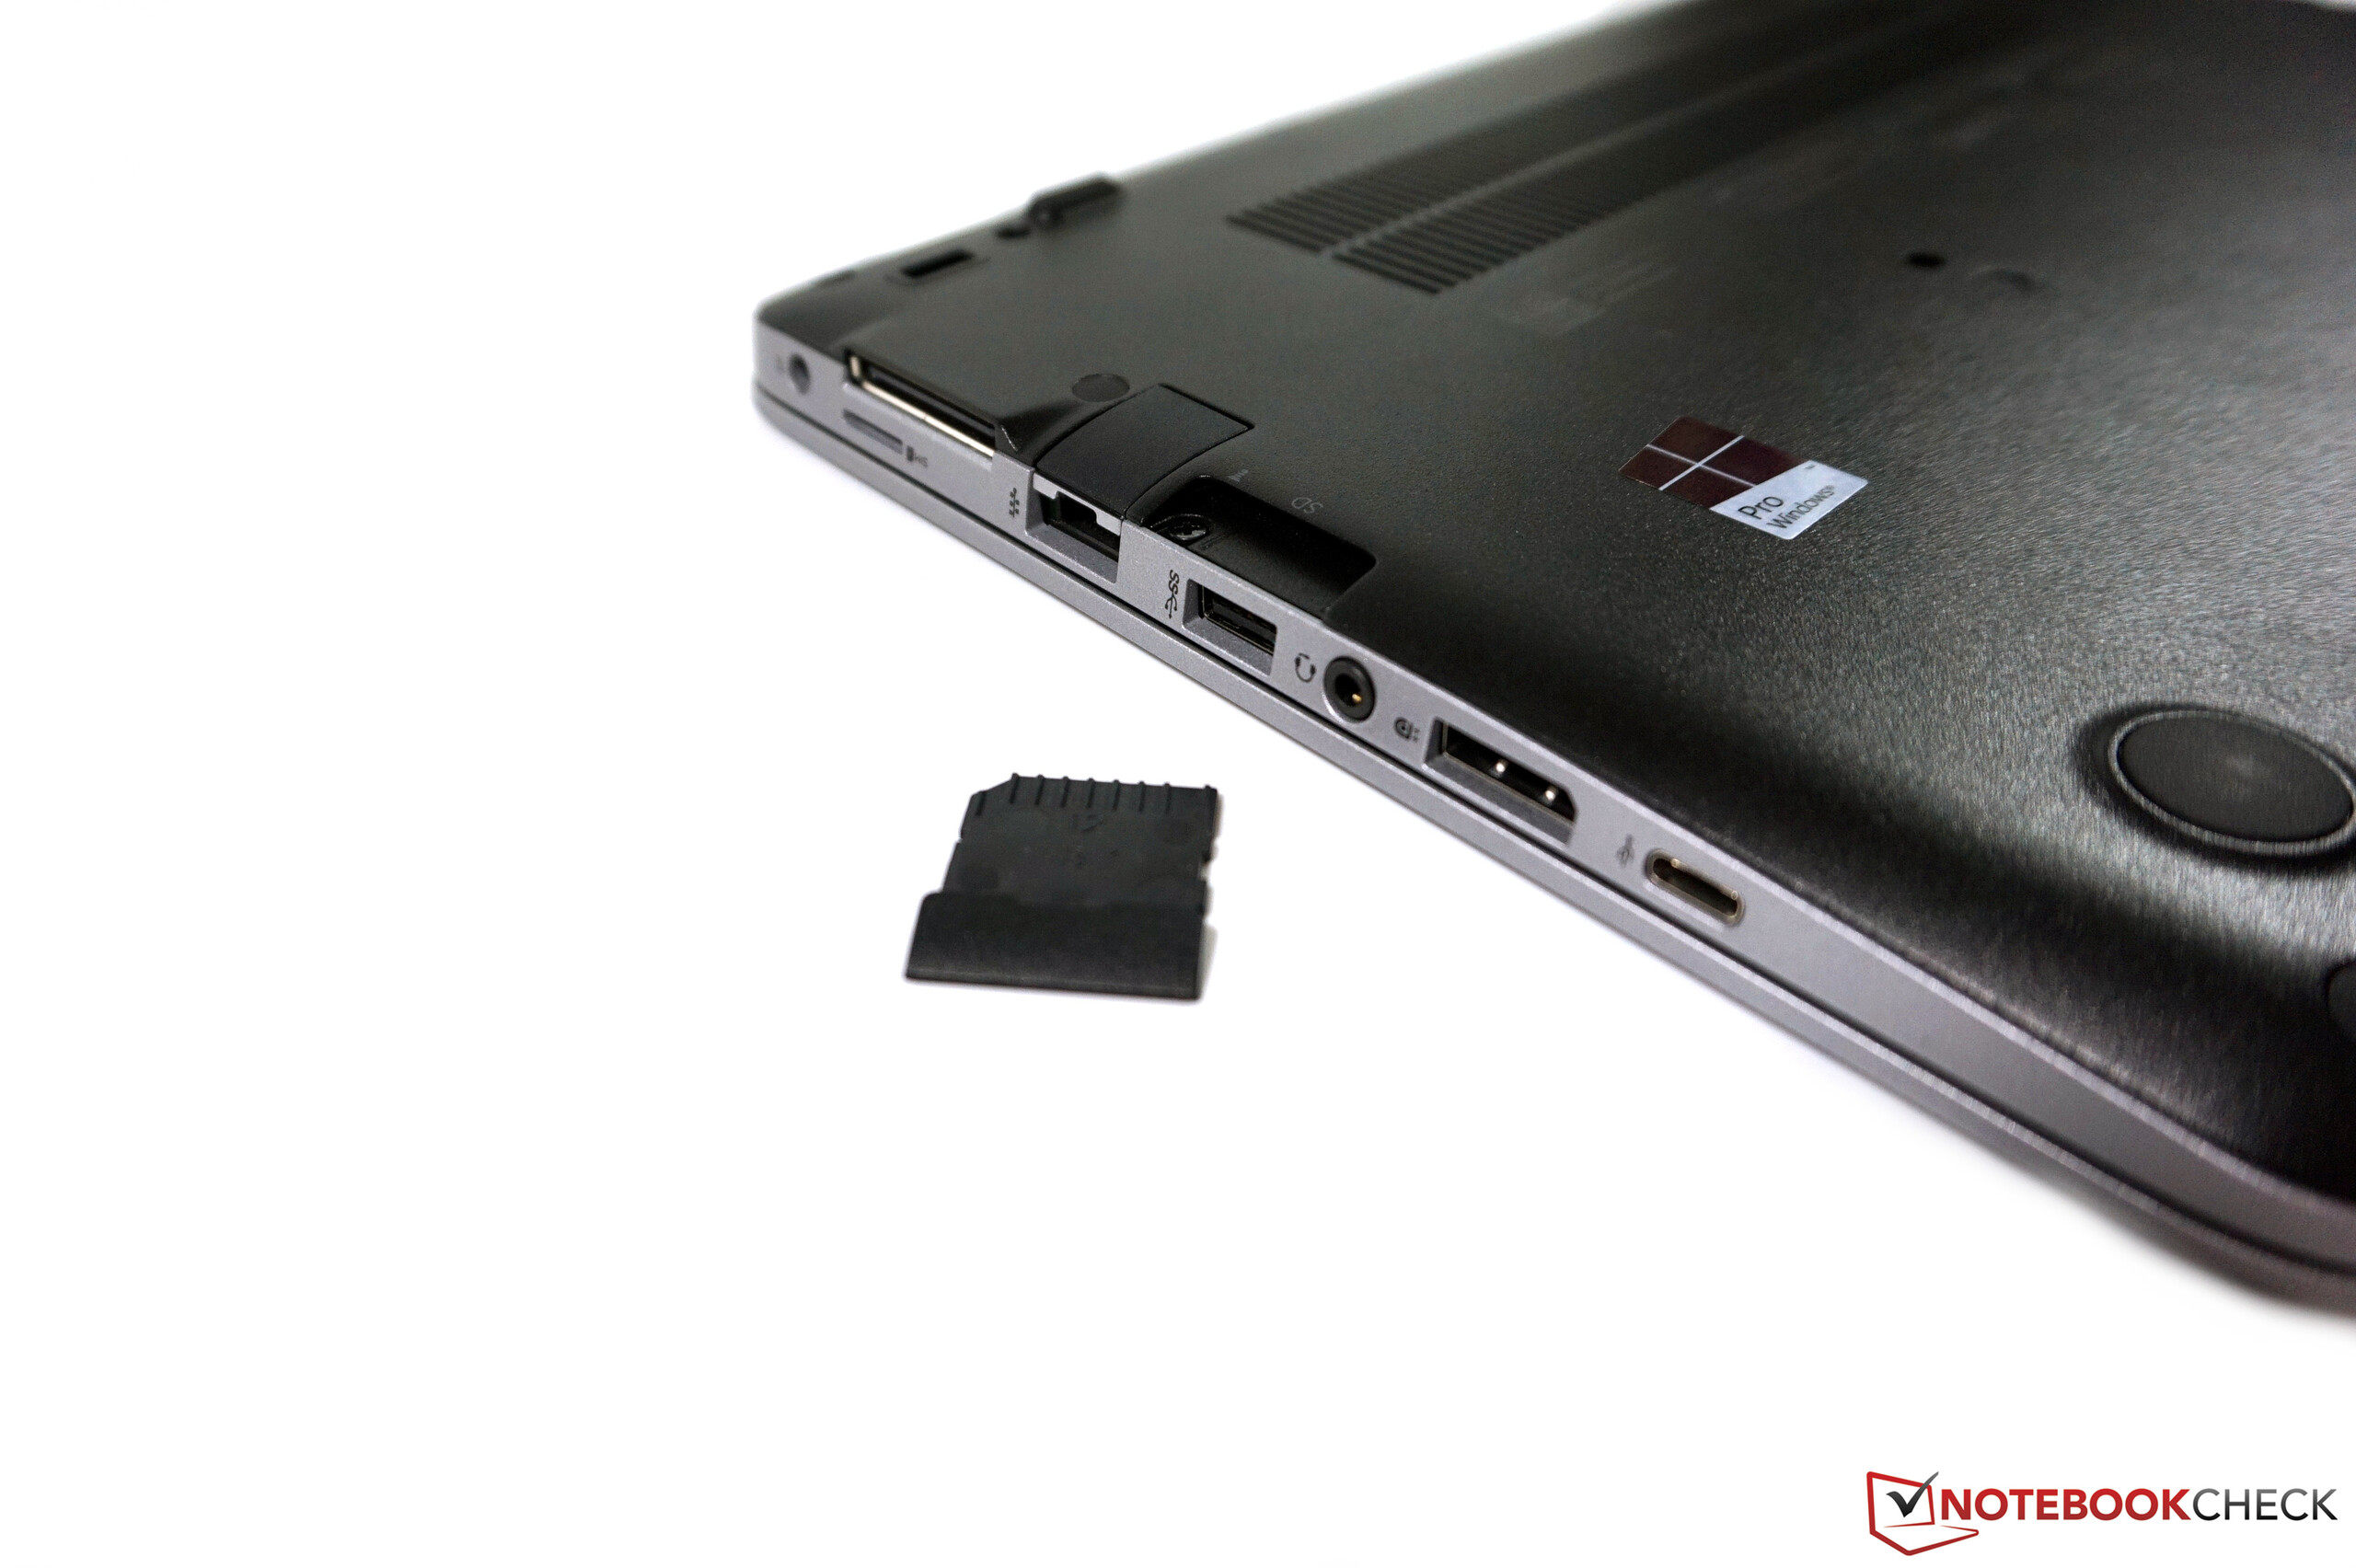
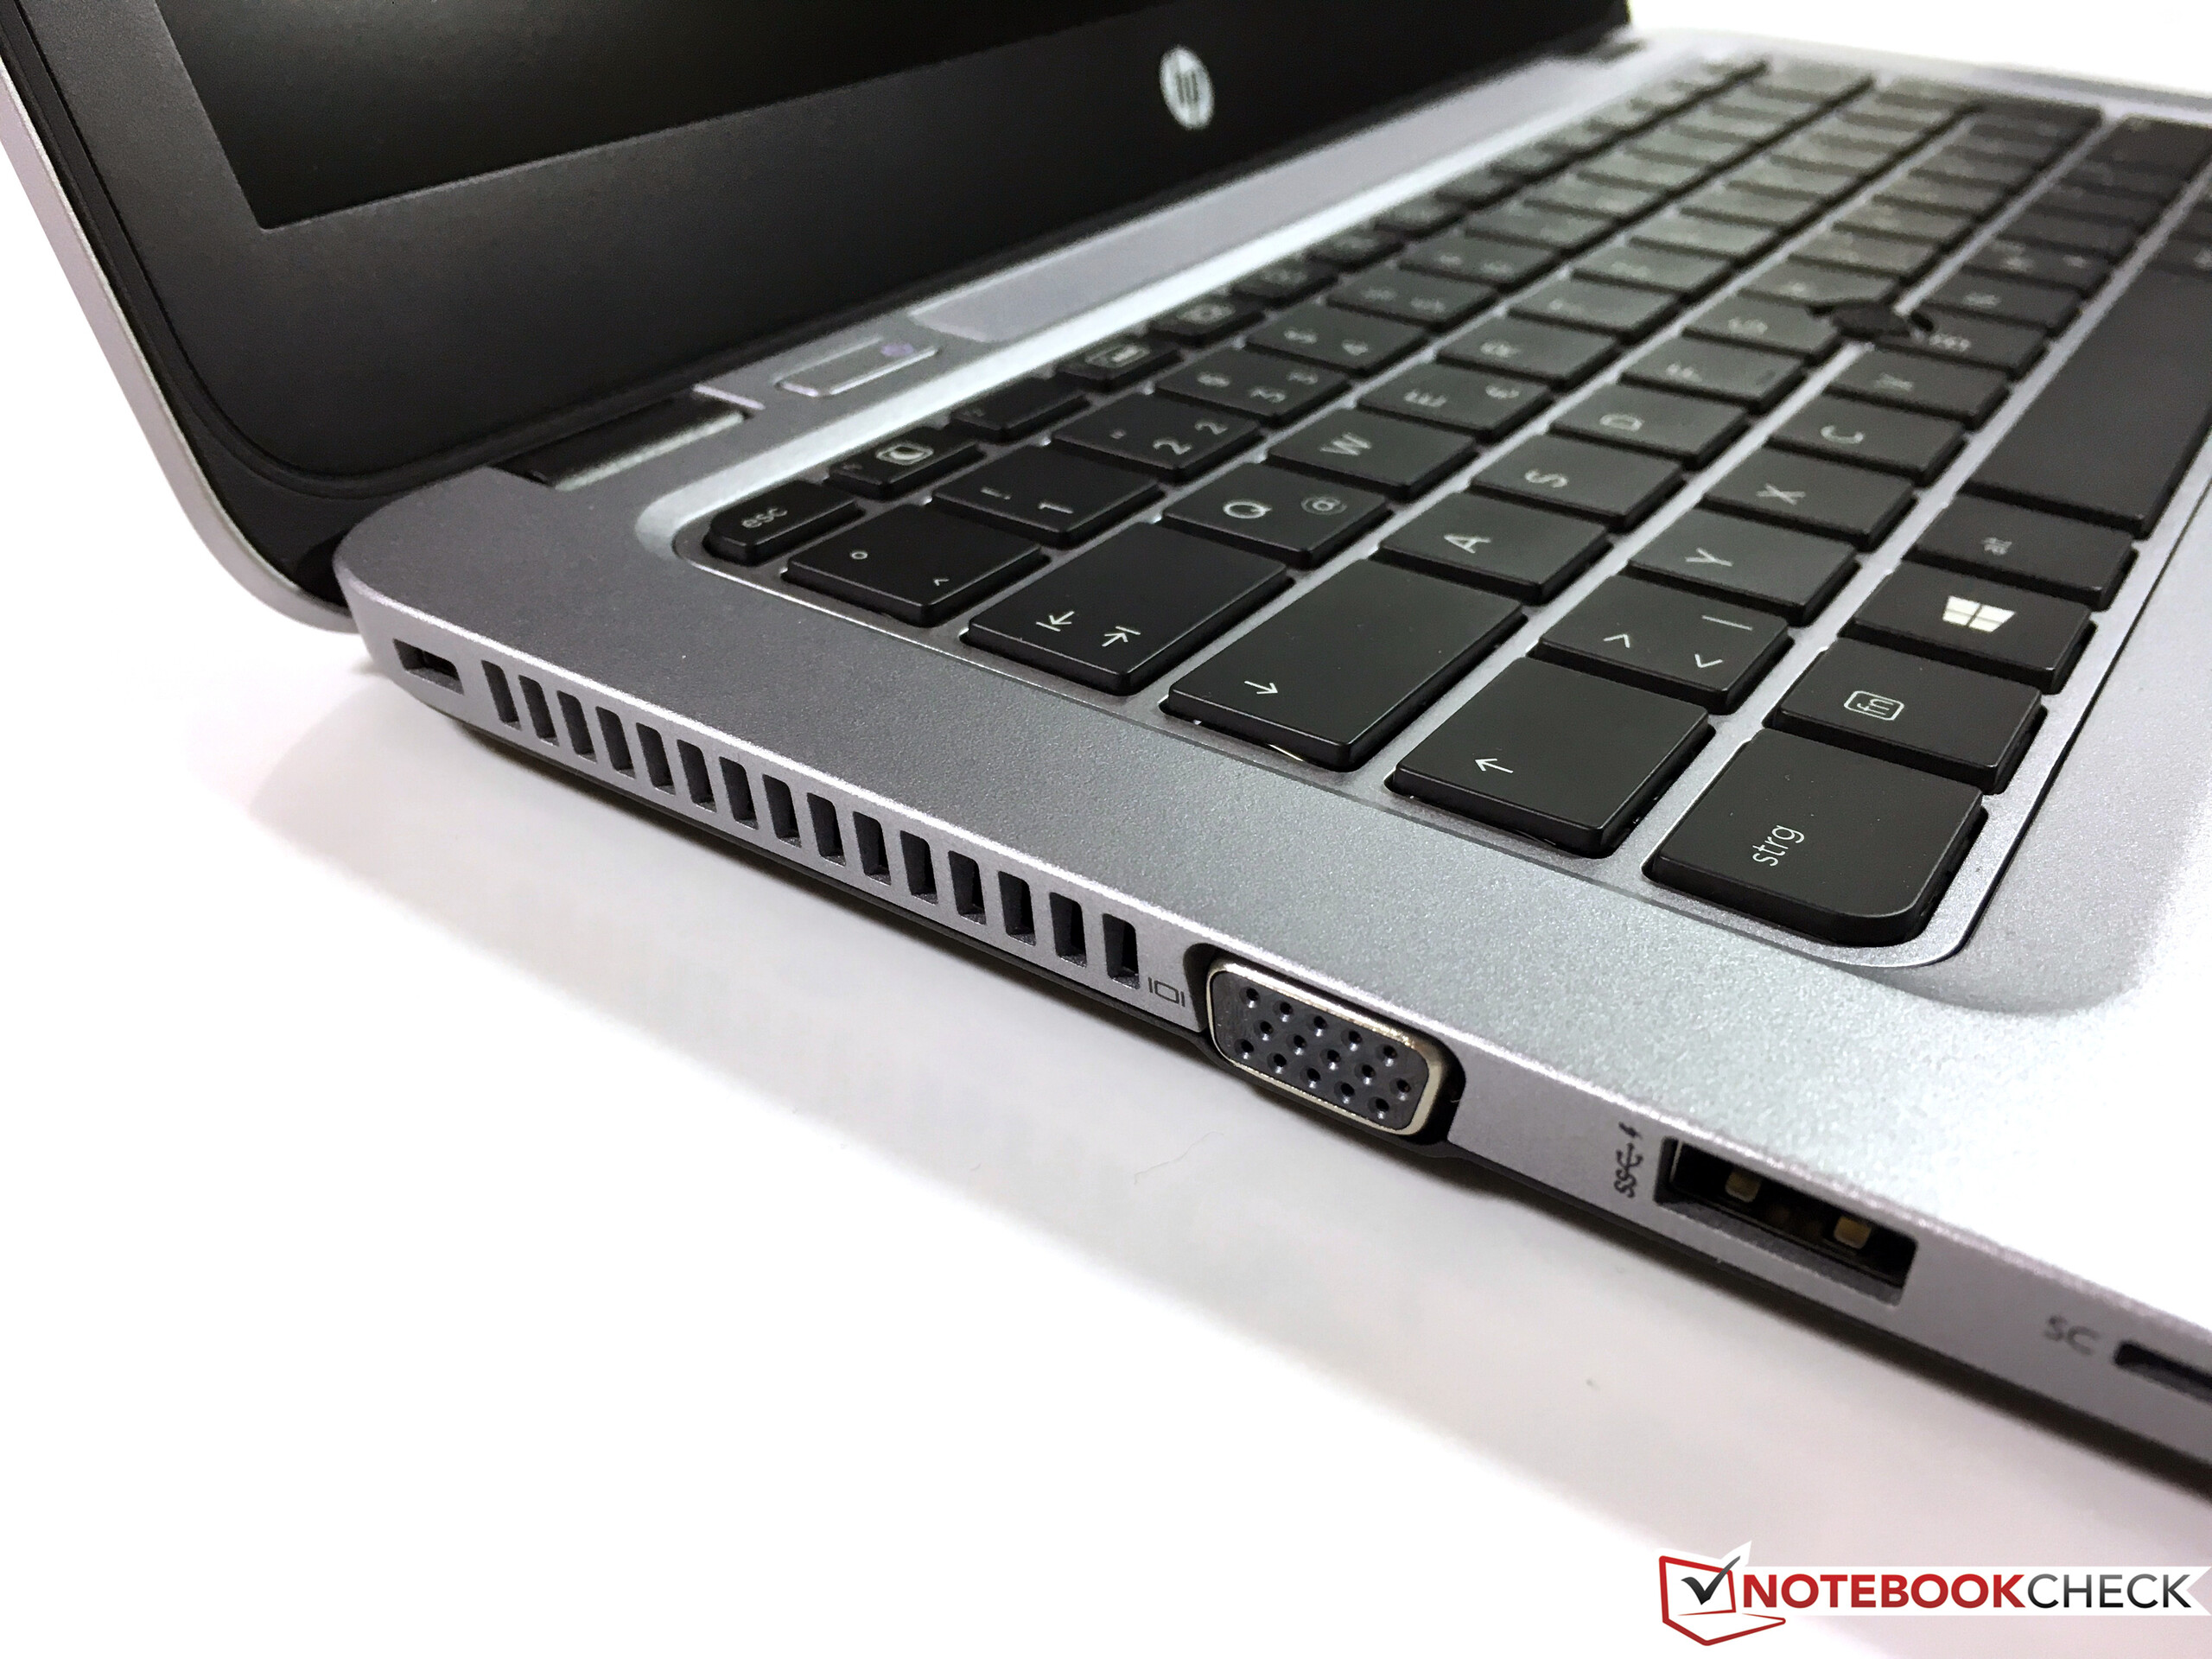
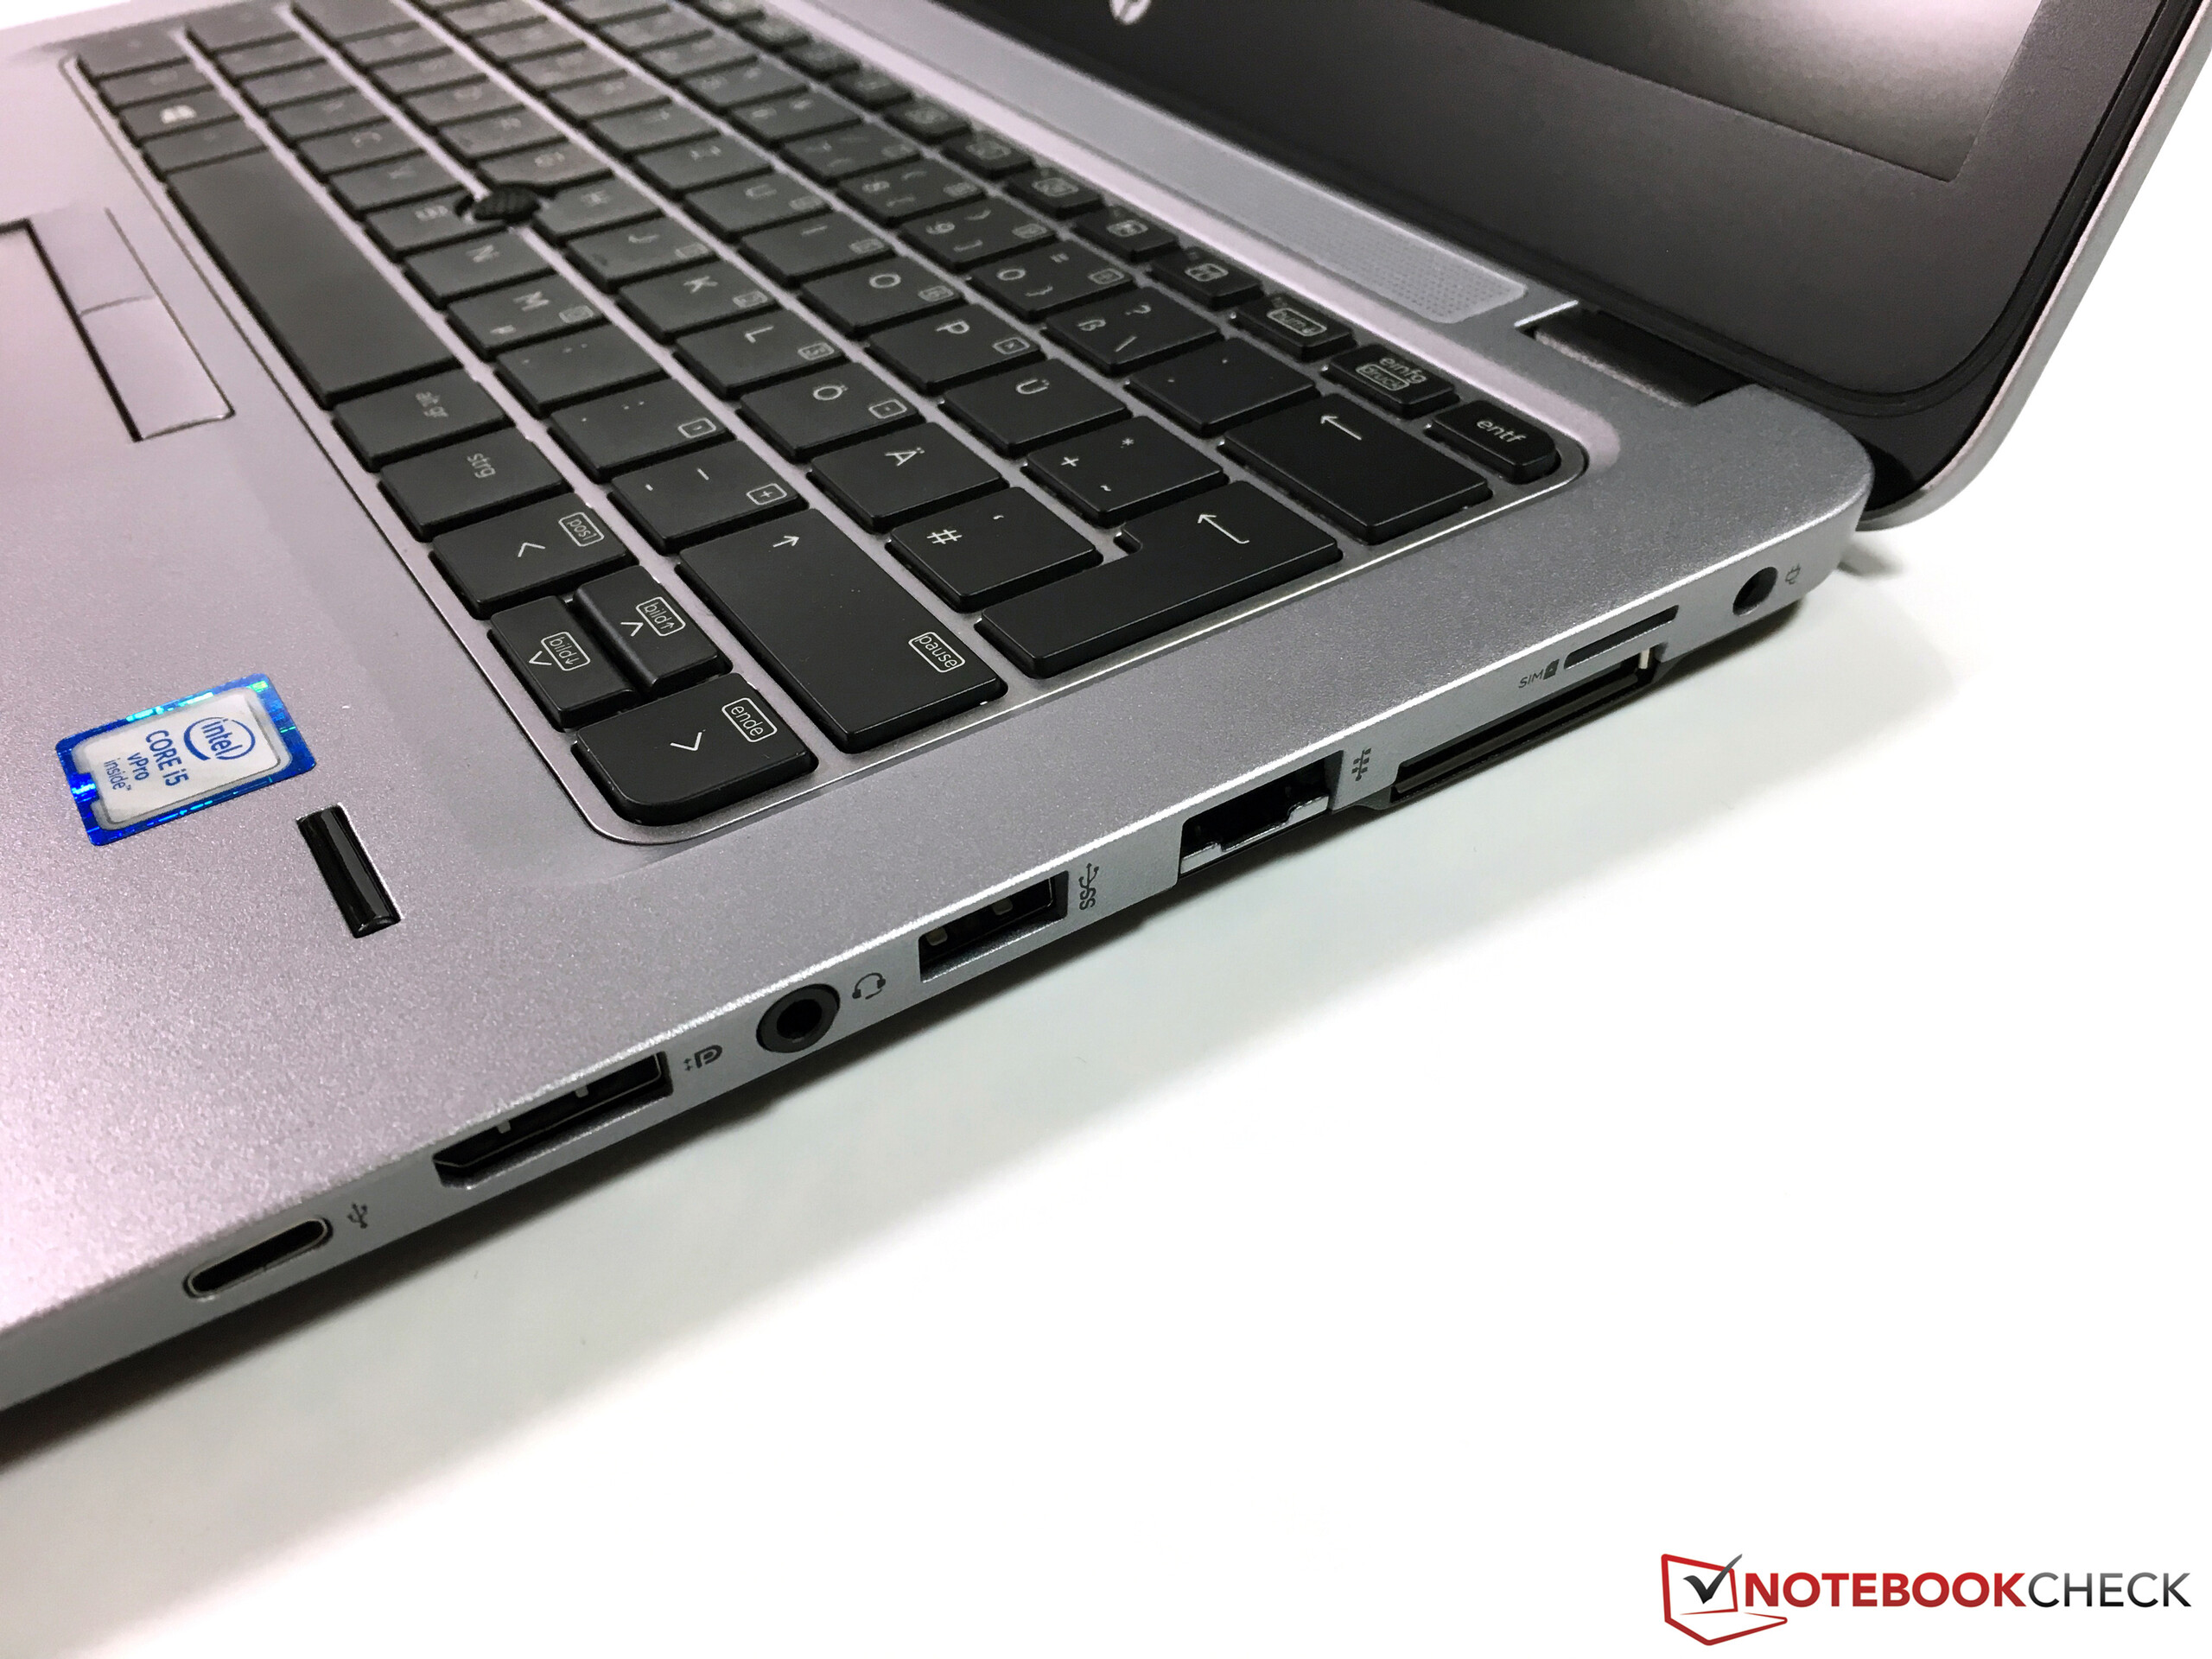
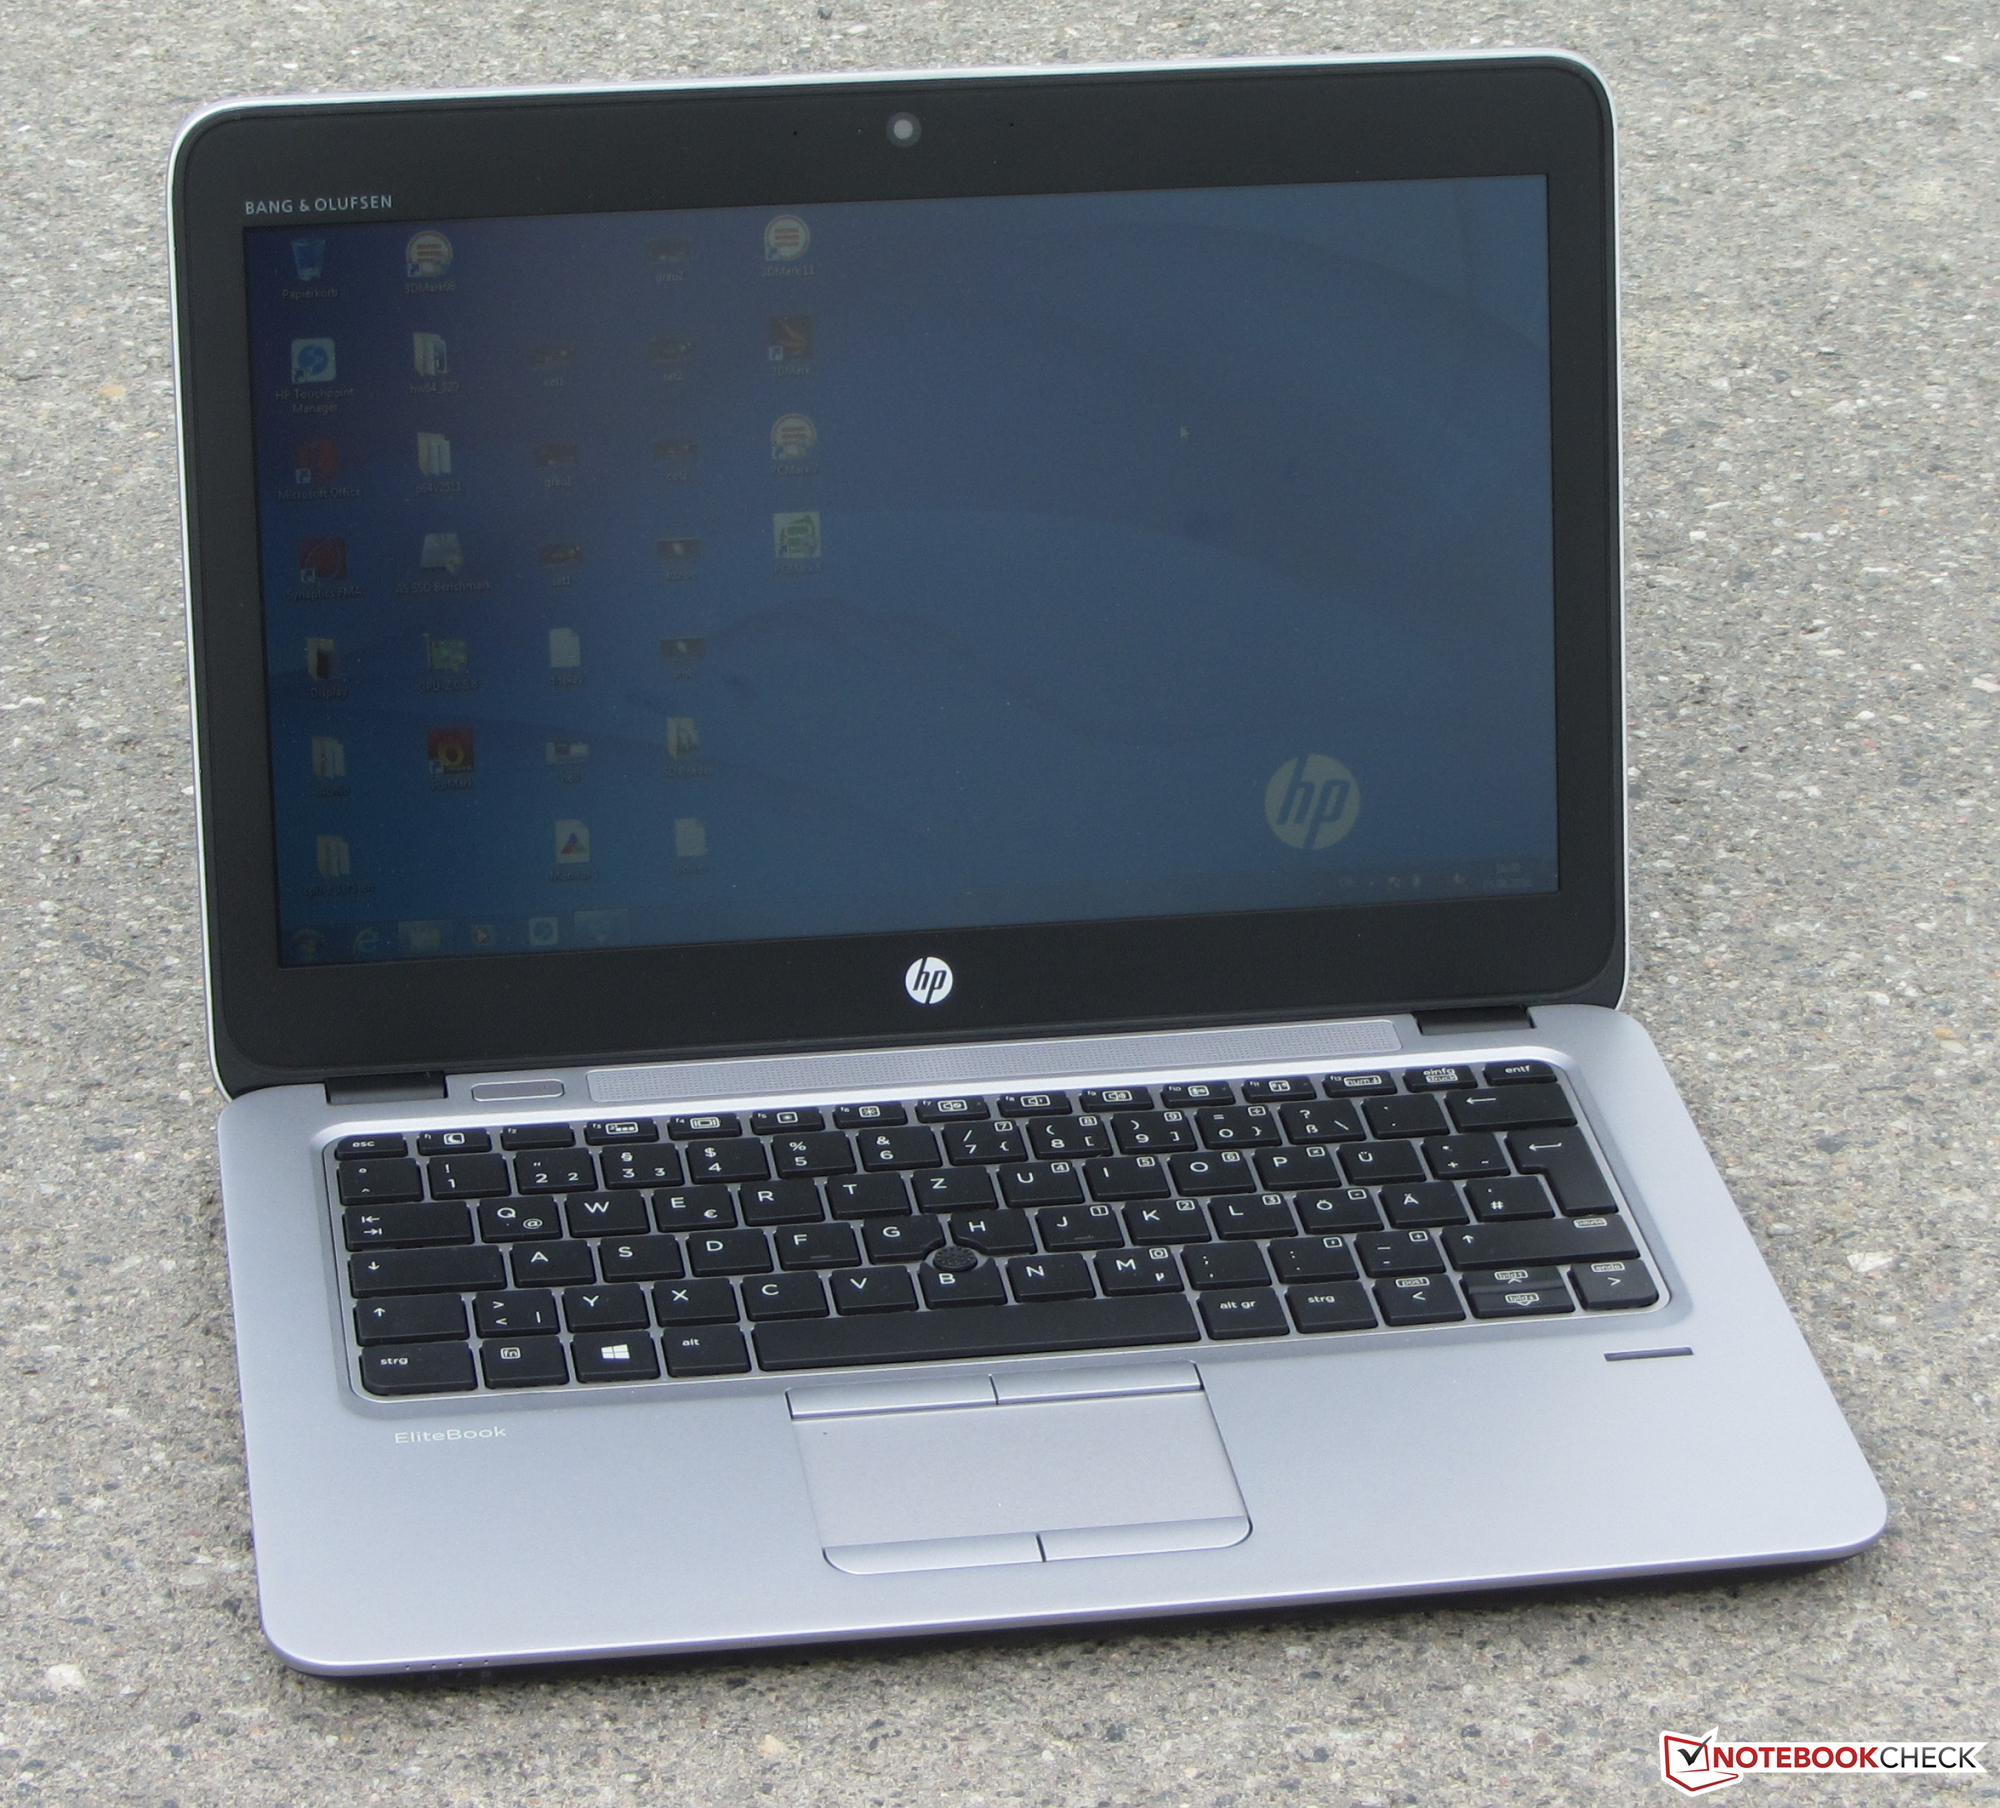
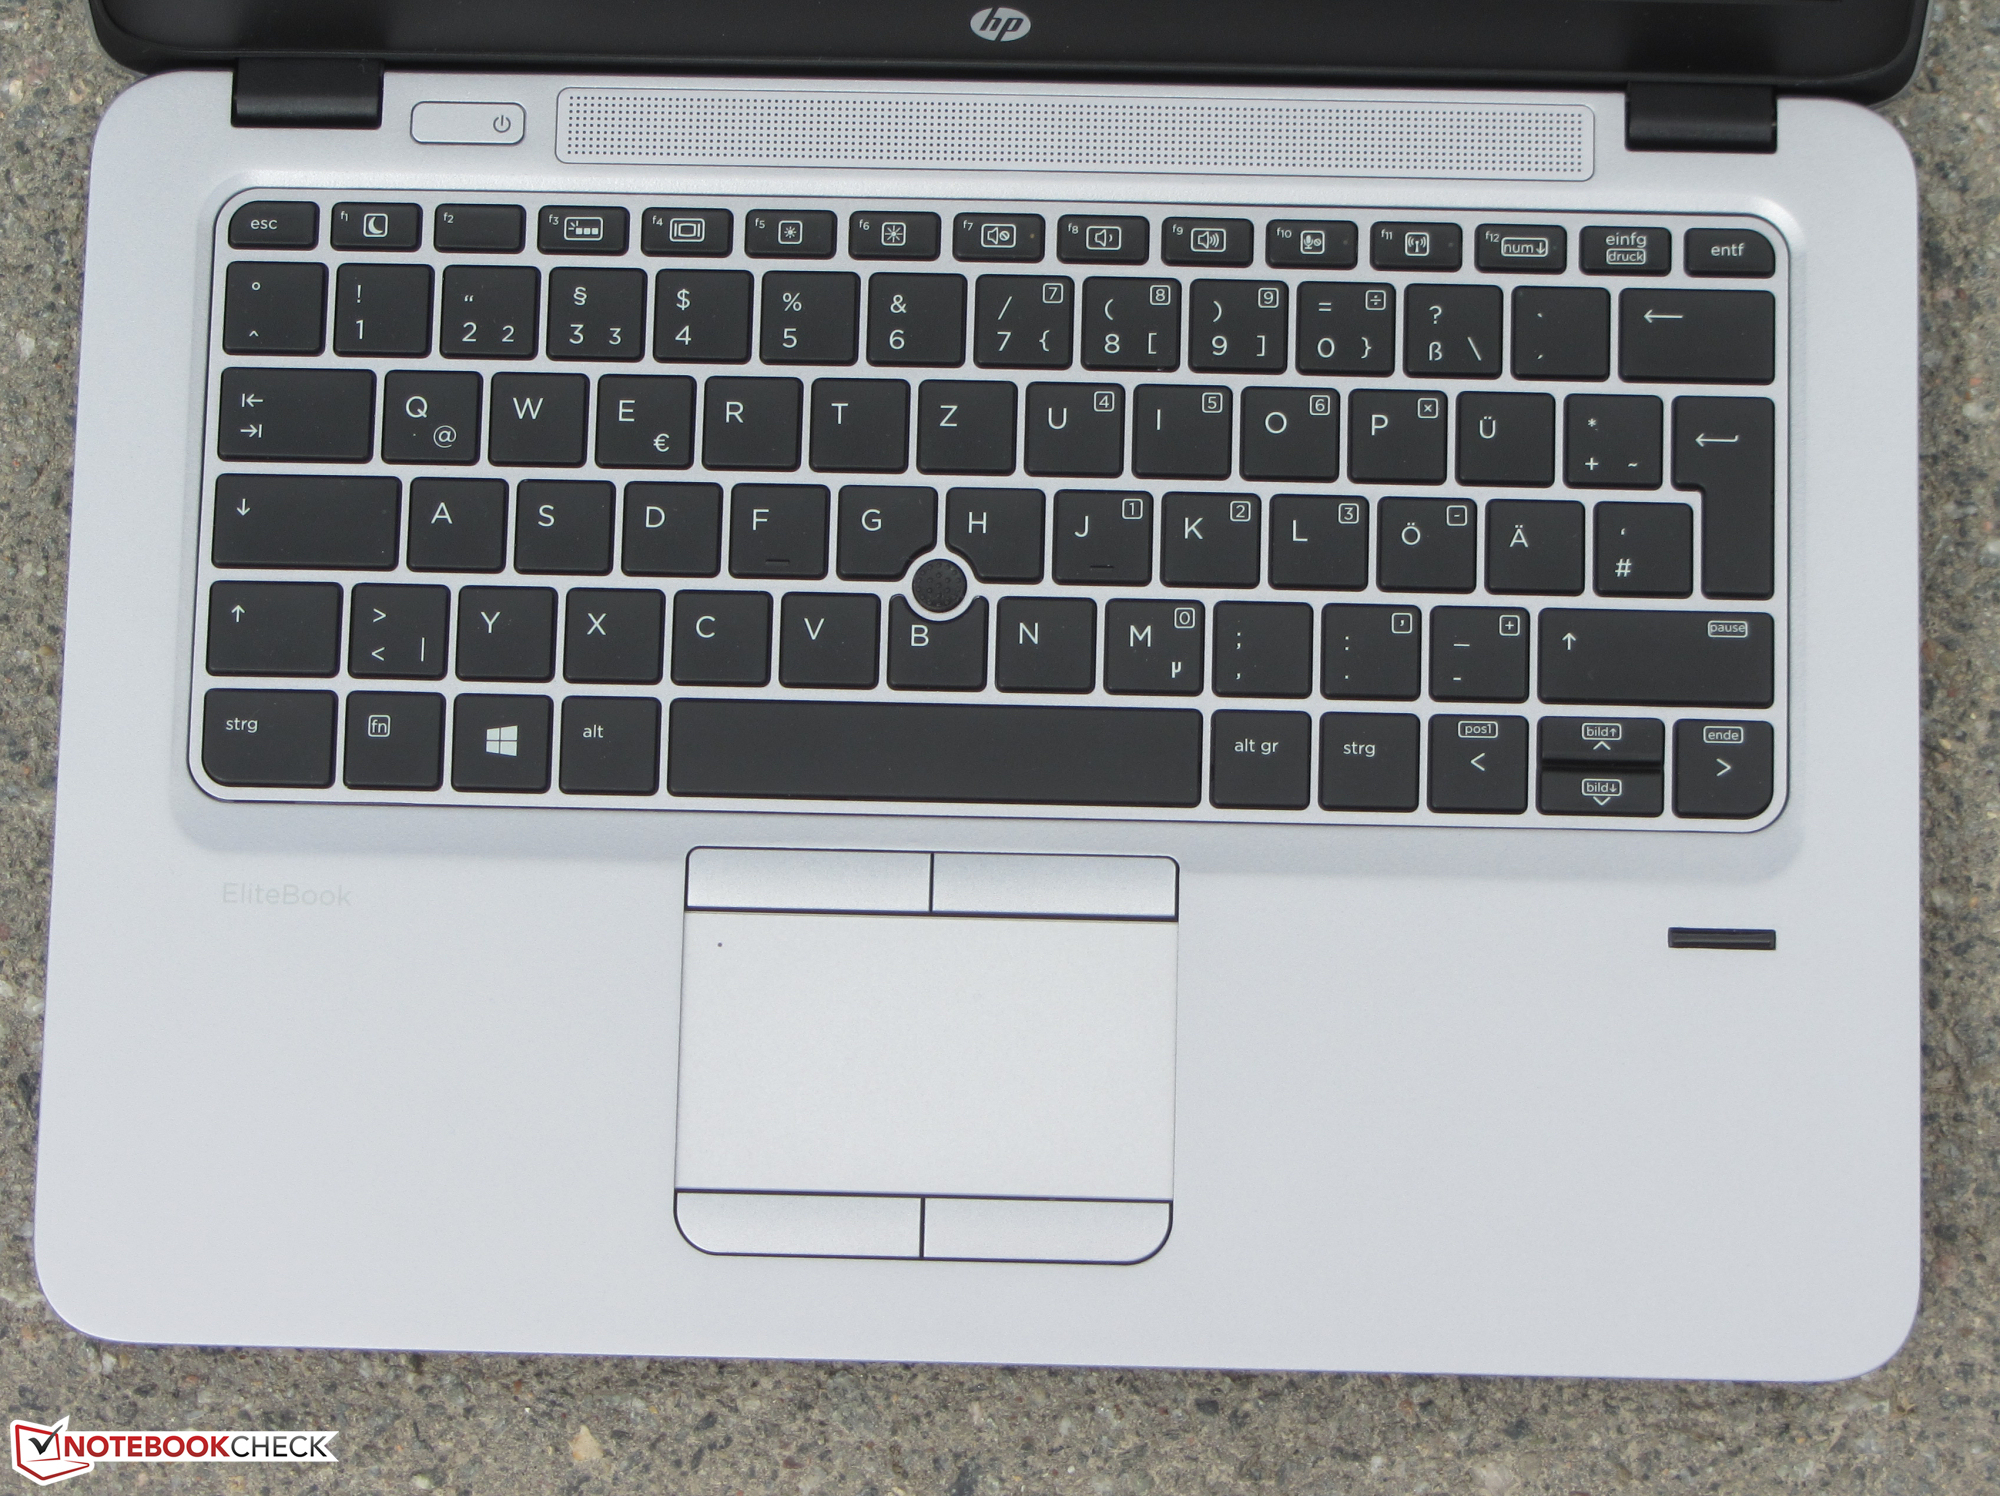
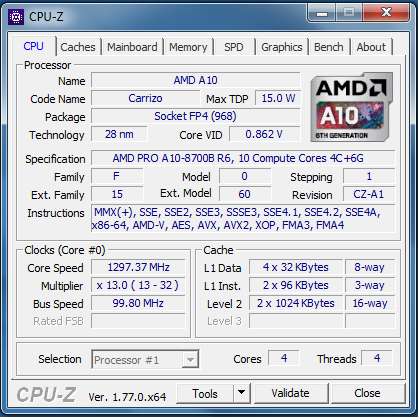
惠普EliteBook 725 G3是一台12.5寸亚笔记本电脑。这个机型的AMD处理器为日常应用提供了足够的性能。这台笔记本电脑采用了优秀的机身,提供了完善的连接性。它的键盘也十分优秀,同时它还有可选的LTE模组,天线和SIM卡槽已经就位。惠普为它提供了3年的质保。
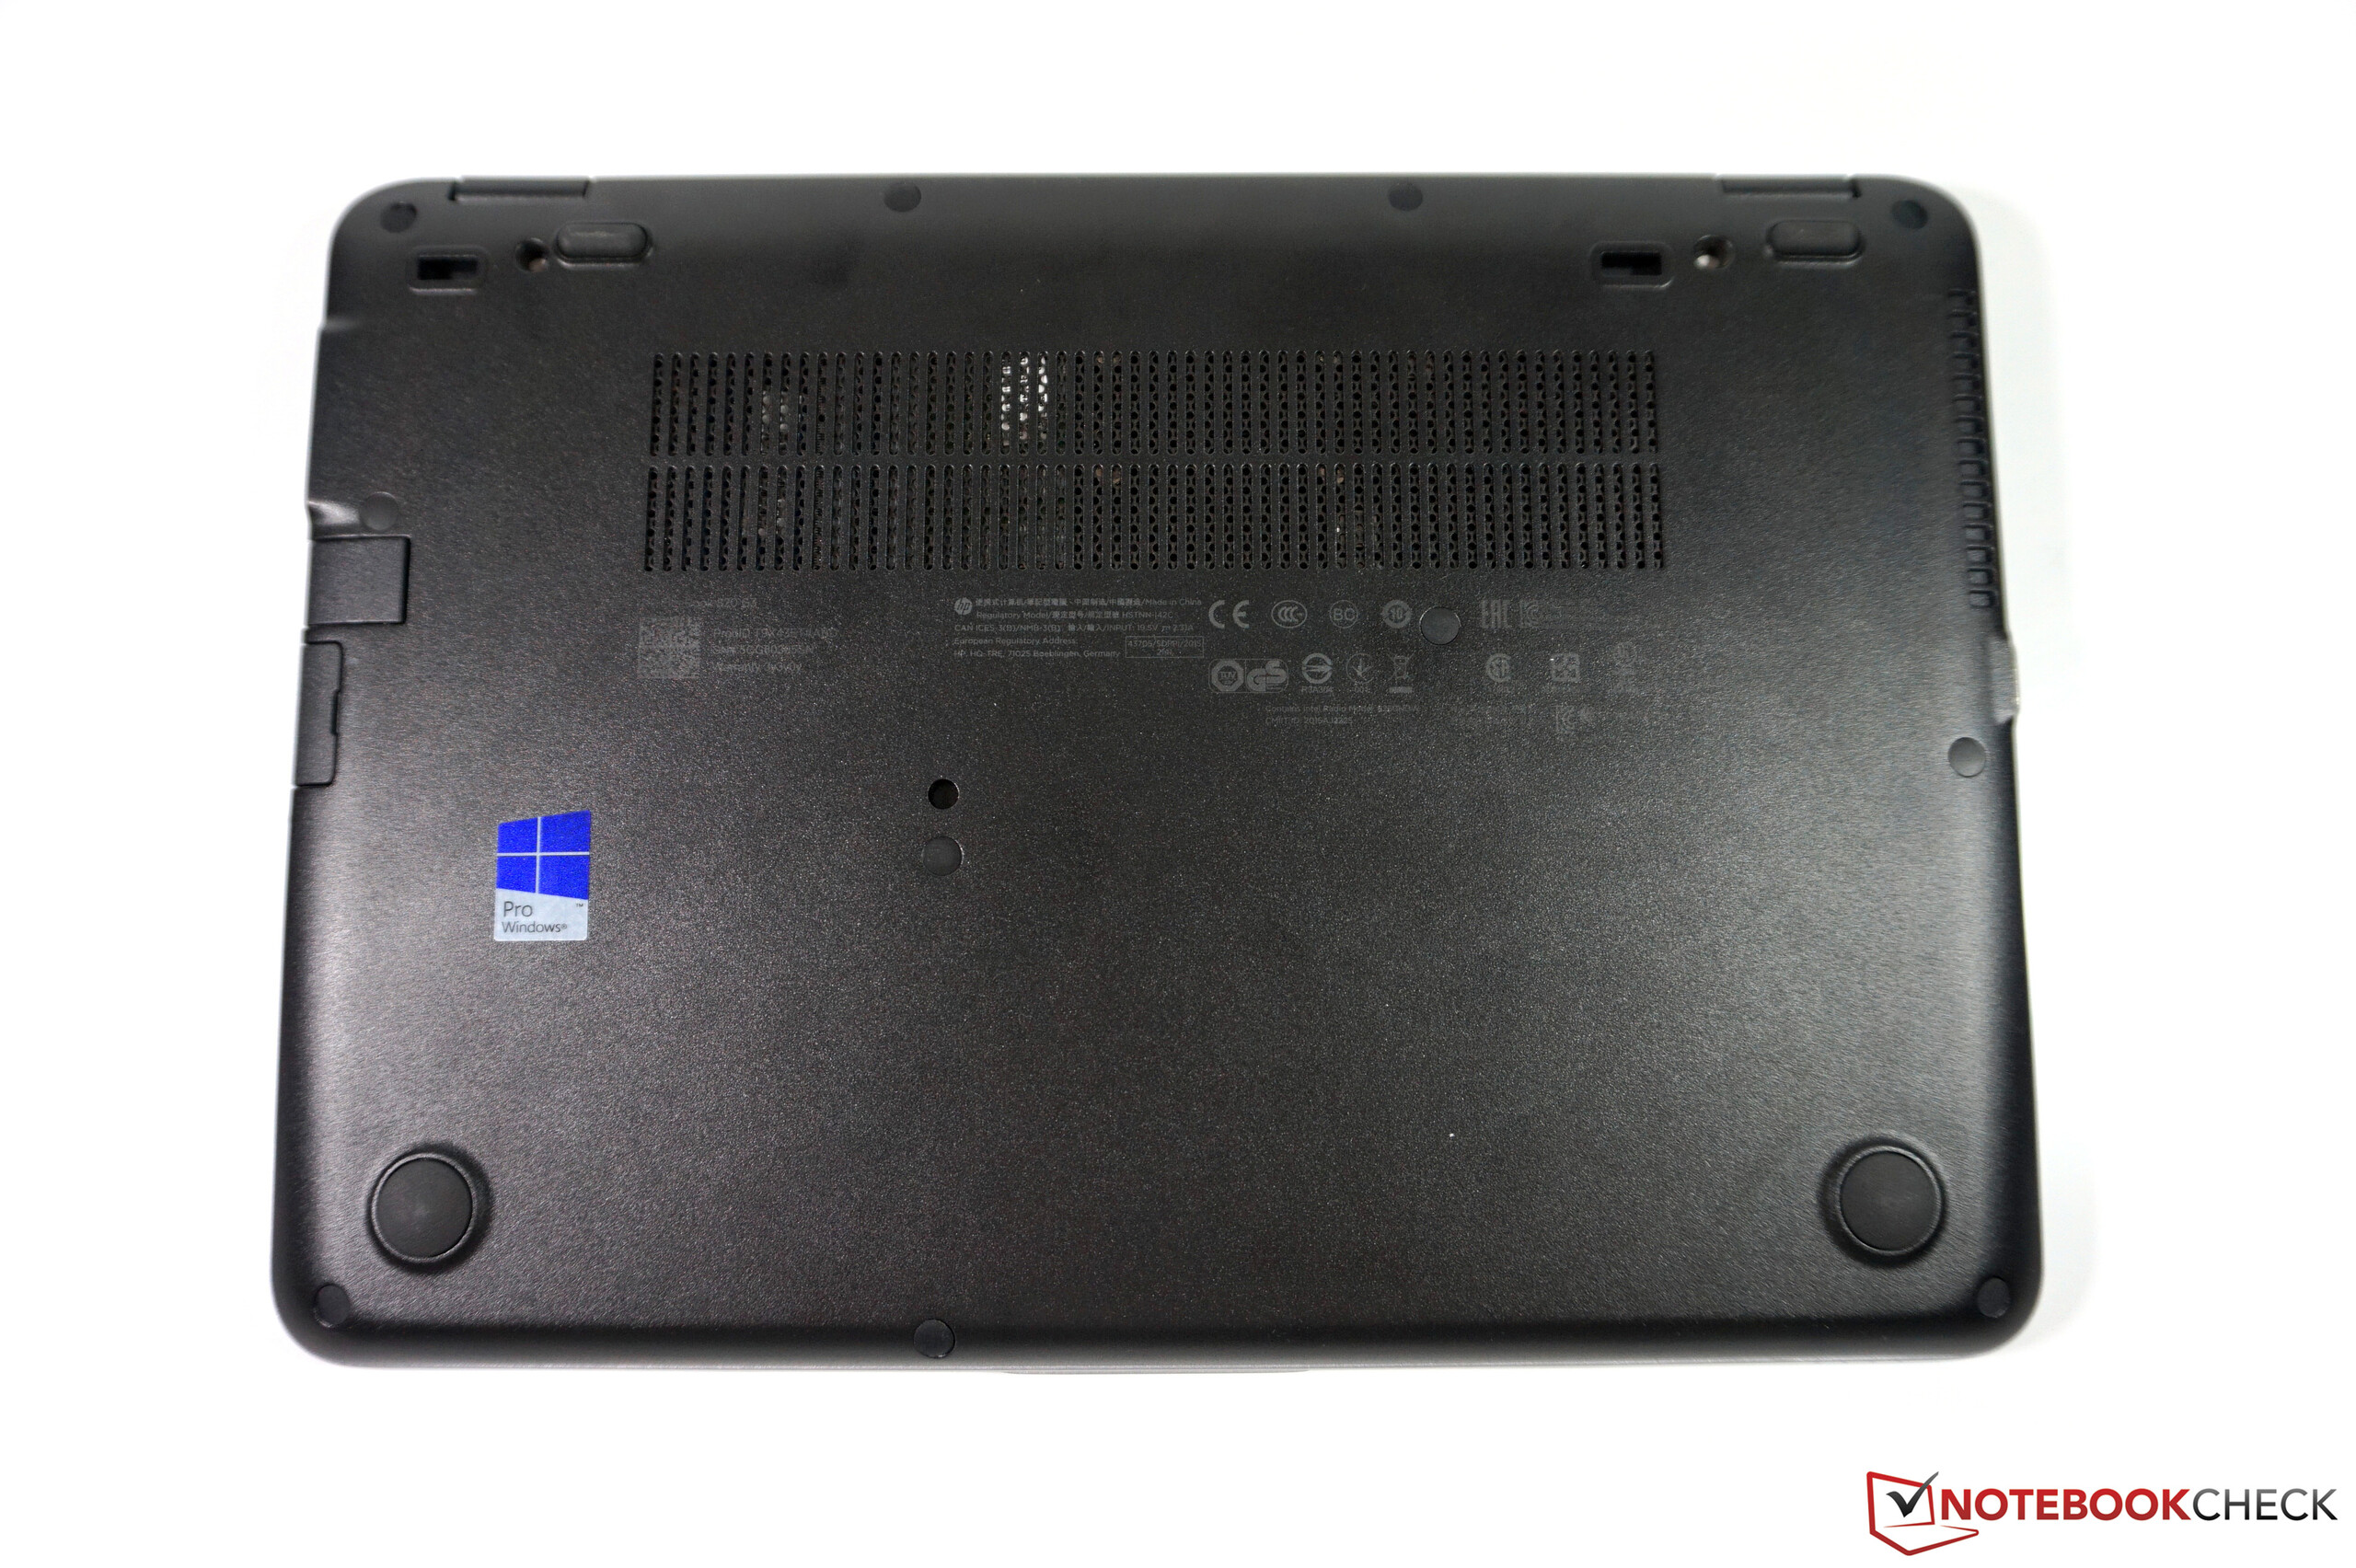
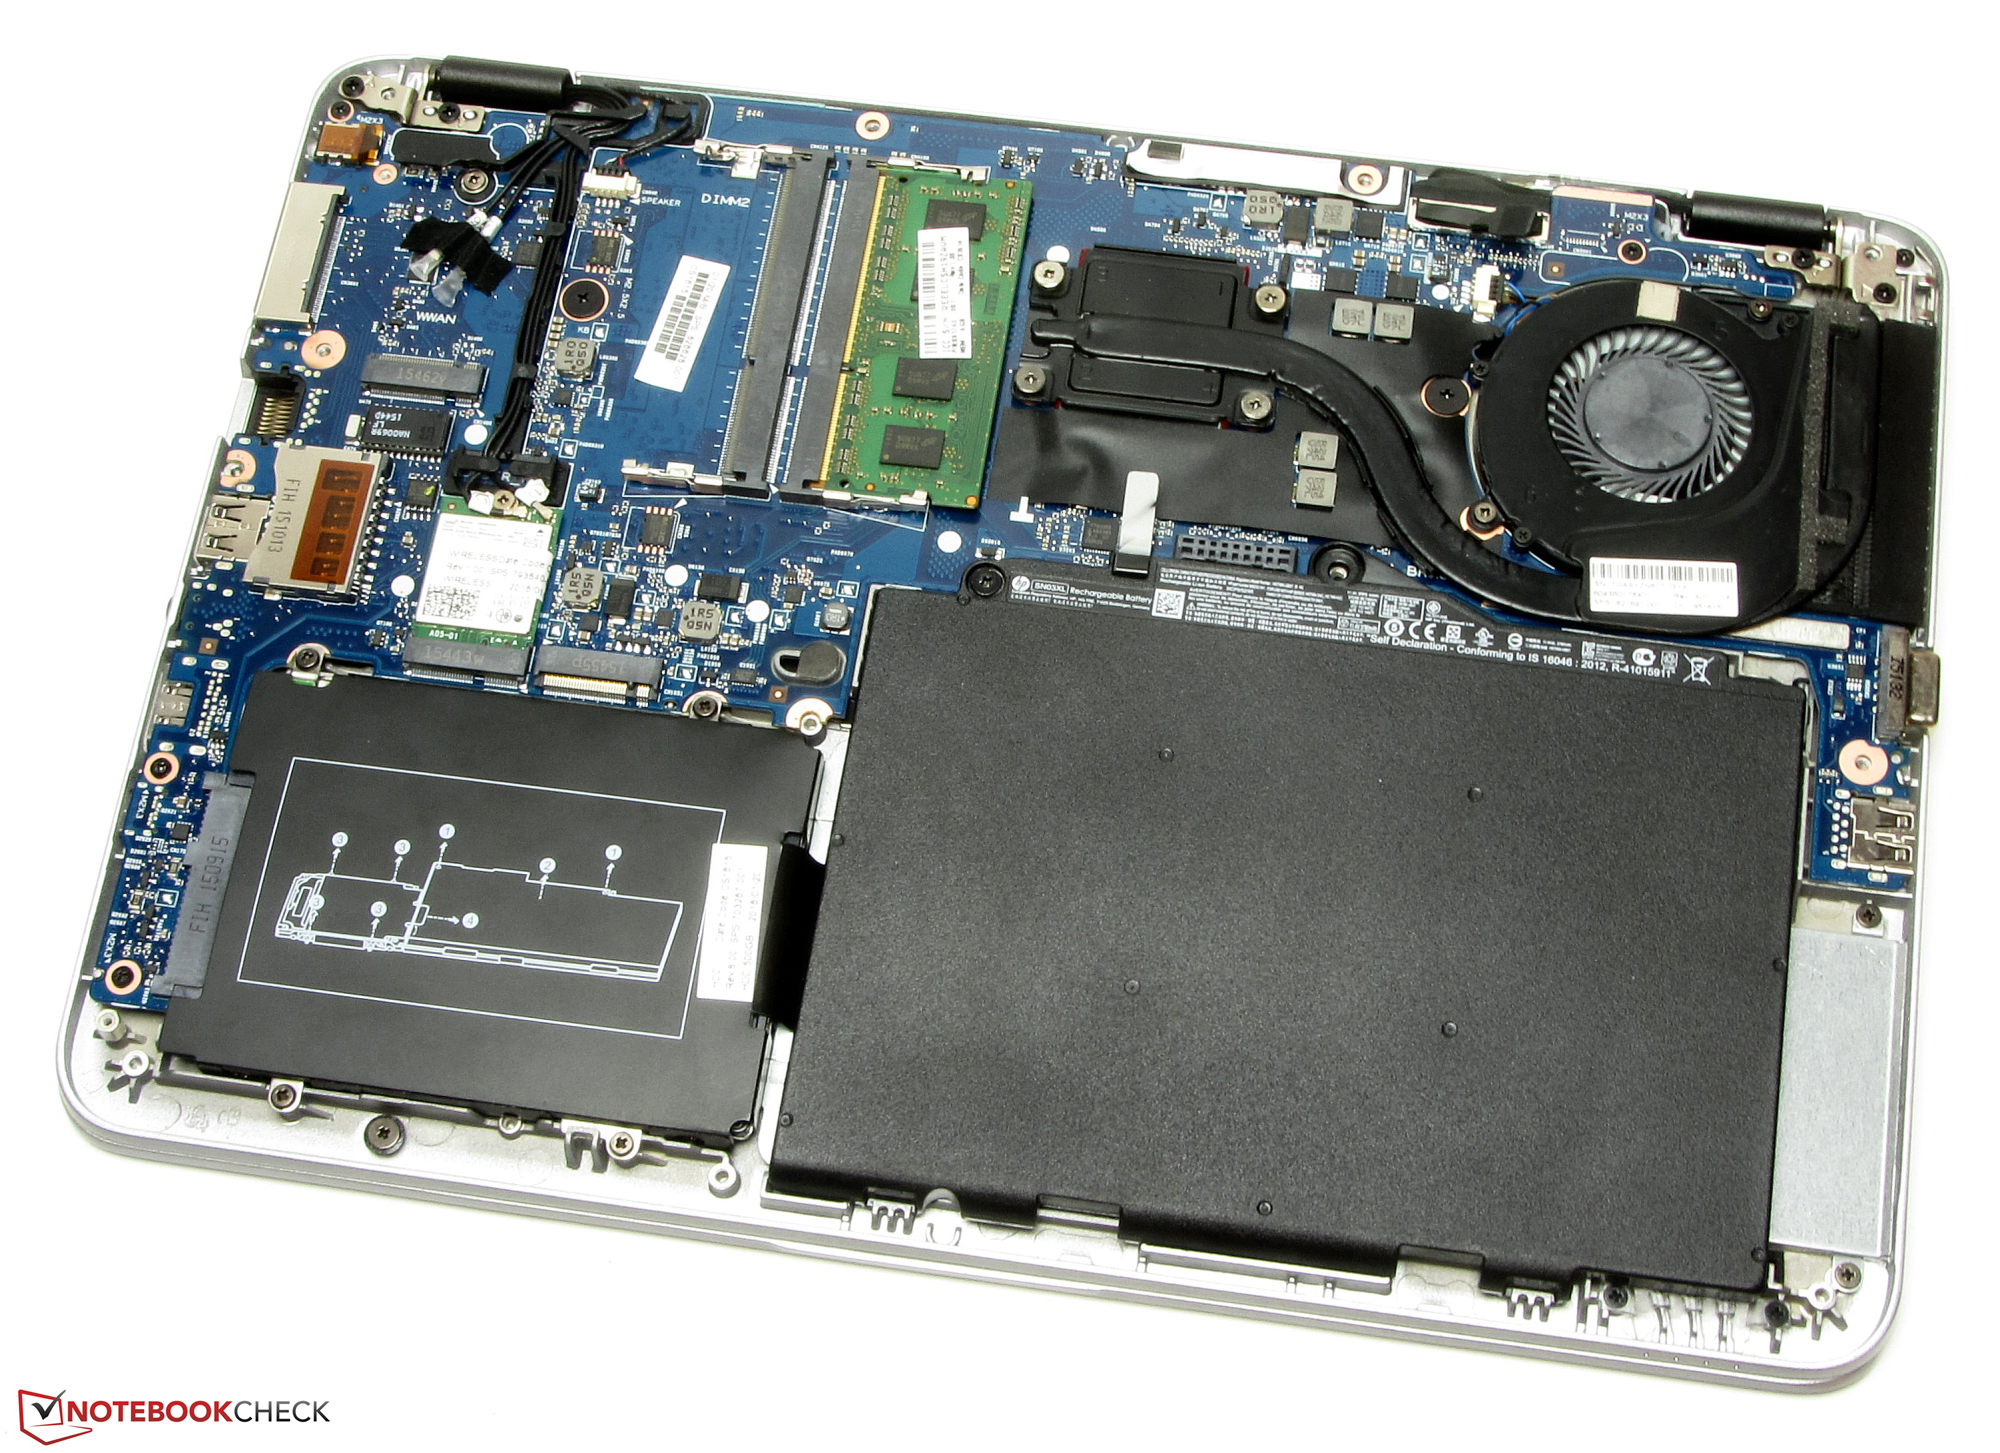
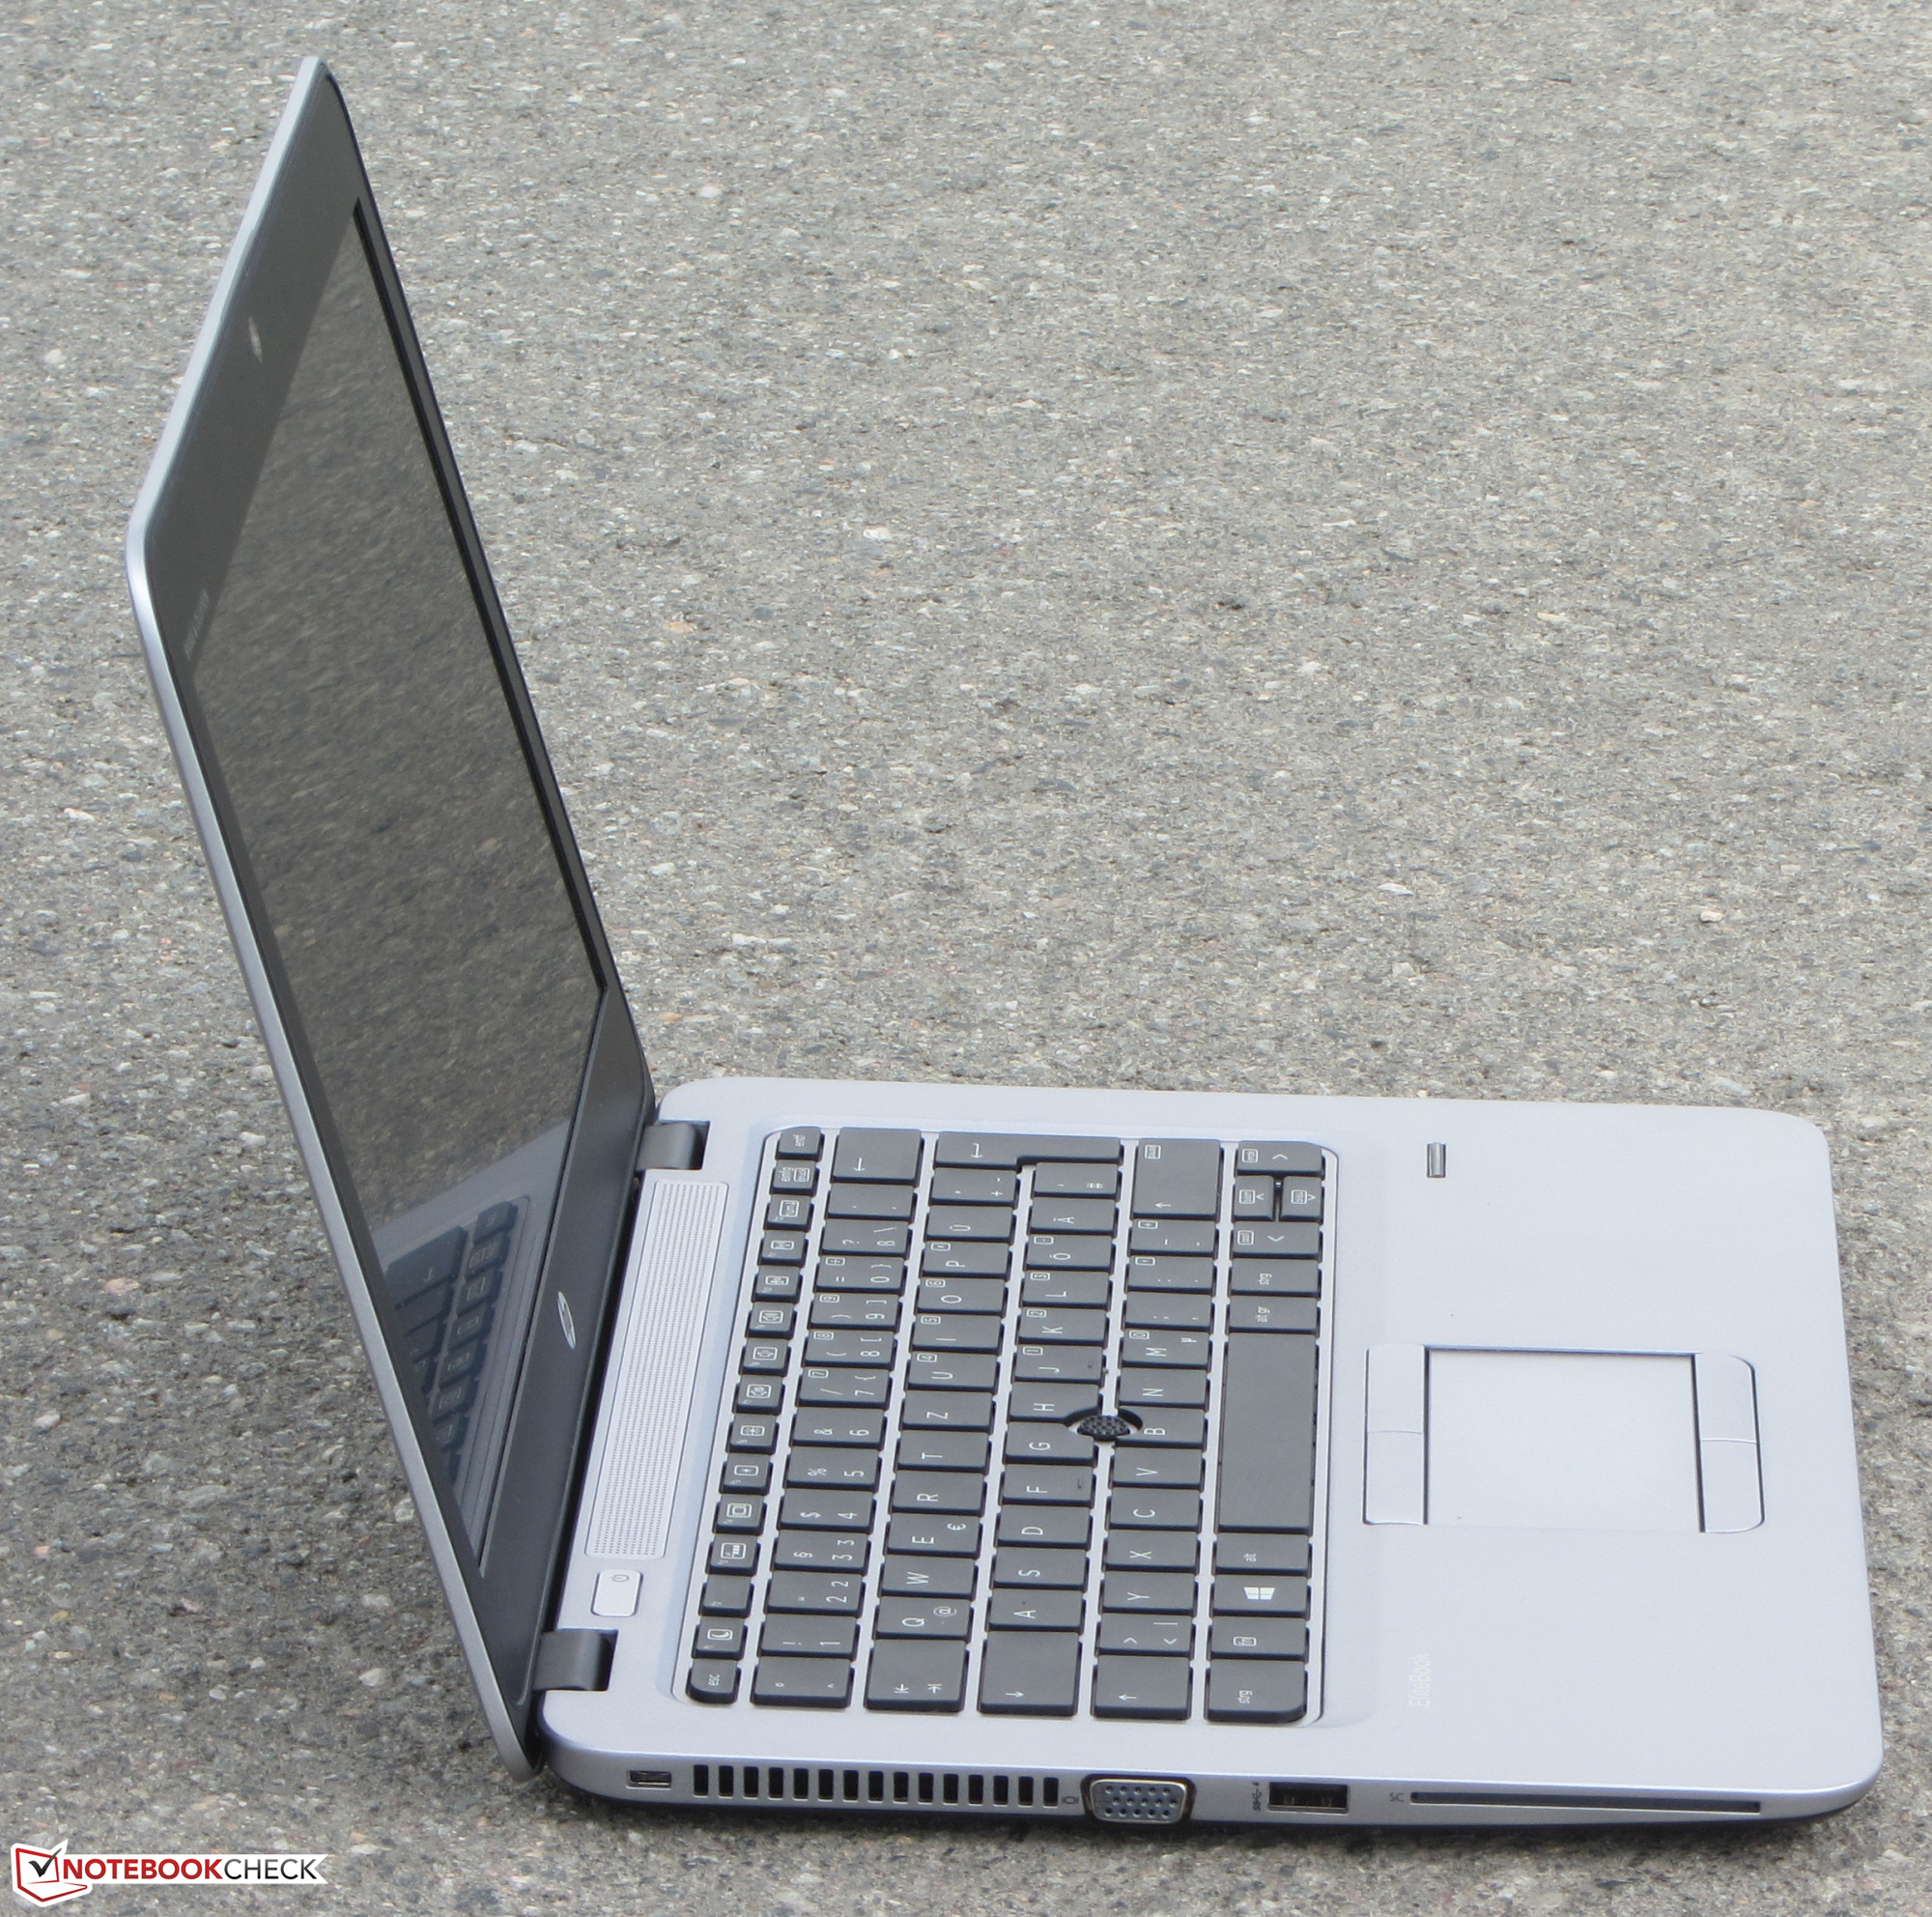
这台测试机的很多方面都存在不足。它只有在待机时可以保持安静,而当风扇开始旋转之后,就会发出哨声一样很吵人的噪音。再加上不菲的价码,它可能很难成为一台称职的商务笔记本电脑。EliteBook 725 G2有一个维护底盖,可以不使用任何工具轻松打开。而后续机型EliteBook 725 G3的底盖则使用了螺丝固定。说实话,只需一个螺丝刀用户可以很容易打开它的底盖,不过这仍然是一种退步。
它的电池续航也不算出色。这台12.5寸笔记本电脑需要有更长的续航时间,在这方面它落后于EliteBook 820 G3和联想 ThinkPad X260。它的屏幕在这个价位上显得十分简陋。它亮度较低,对比度和可视角度都不理想,同时只有高清分辨率。
EliteBook 725 G3将会在惠普的商务产品线中举步维艰。它的硬件、定价都不足以成为亮点。
整体上,我们很难找到理由向用户推荐EliteBook 725 G3。即使它的价位有所下降,它的电池续航无论如何很难满足此类产品的标准。另外,用户还有EliteBook 820 G3 (T9X40ET)可供选择,它搭配酷睿 i5-6200U且相比我们的测试机更加便宜。这款机型的其他功能都和这台测试机725 G3相似。我们的测试机售价1000欧元(约7479人民币),比820 G3贵出了近80欧元(约598人民币)。
注:本文是基于完整评测的缩减版本,阅读完整的英文评测,请点击这里。
HP EliteBook 725 G3-P4T48EA
-
08/11/2016 v5.1(old)
Sascha Mölck