 Deutsch
 English
 Español
 Français
 Italiano
 Nederlands
 Polski
 Português
 Русский
 Türkçe
 Svenska
 Chinese
 Magyar
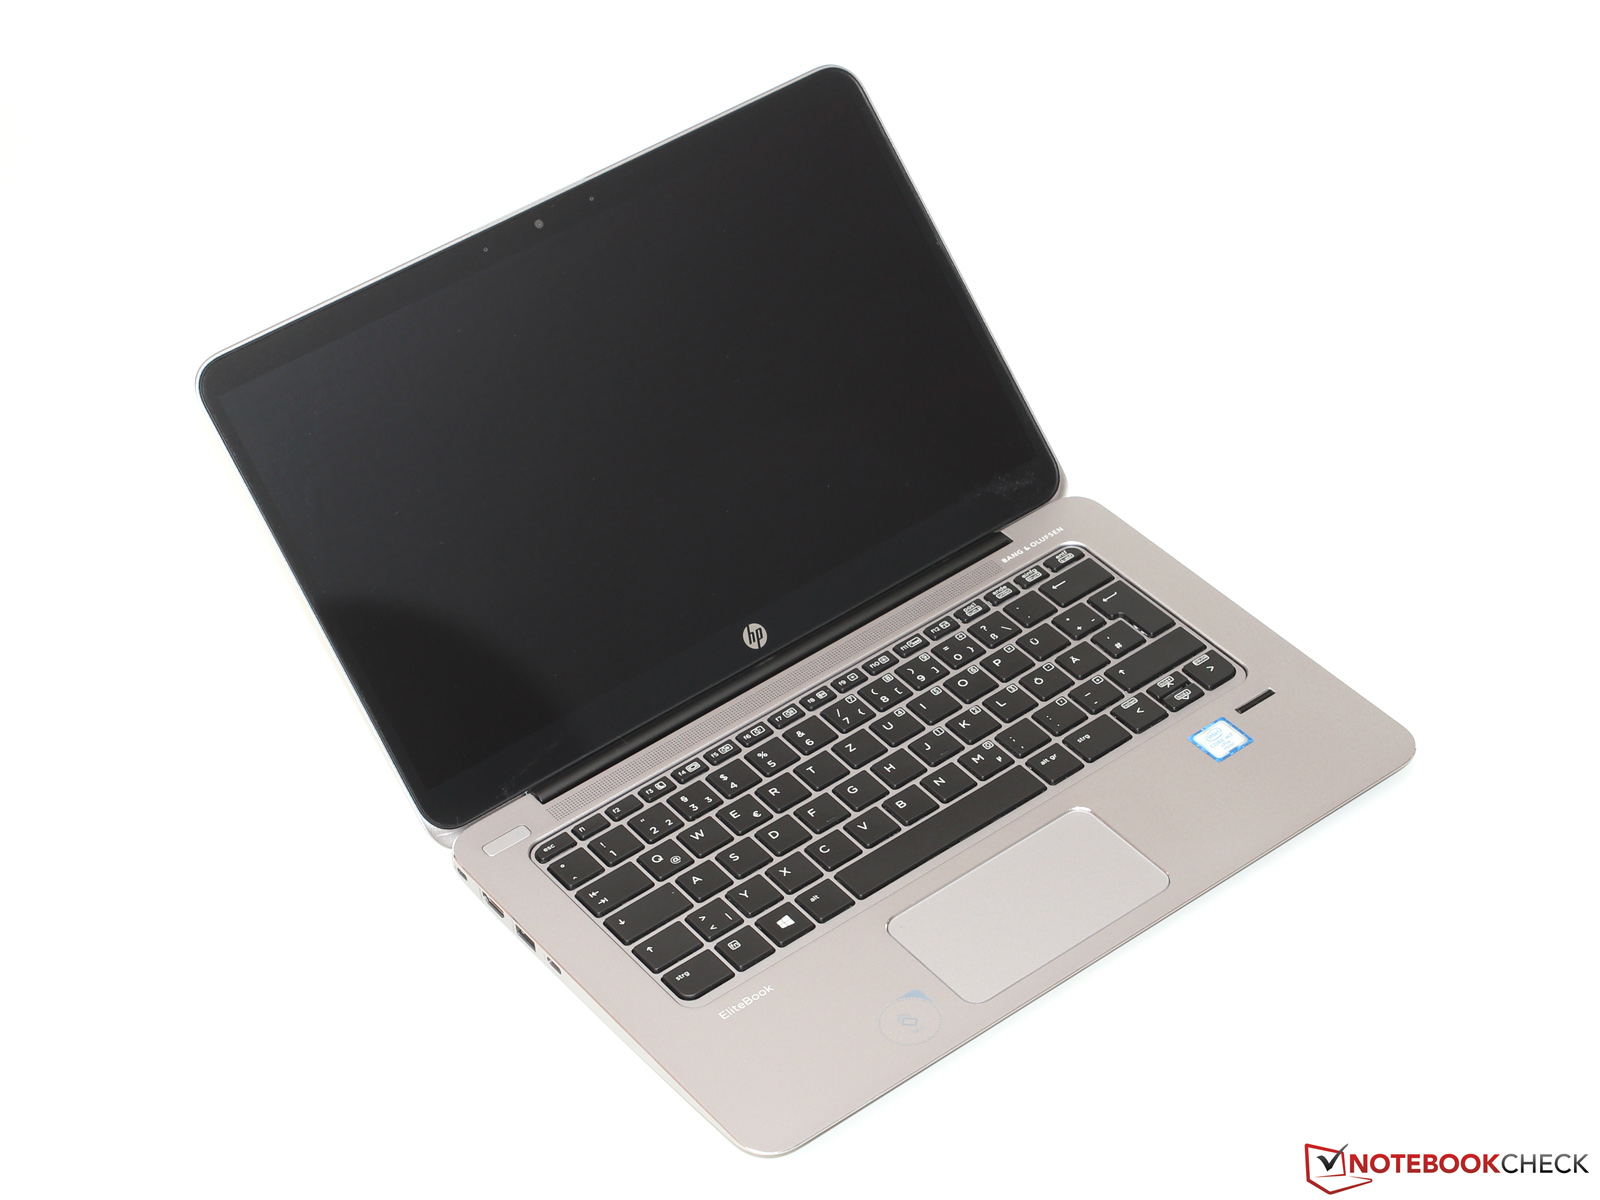
惠普 EliteBook 1030 G1 亚笔记本电脑简短评测
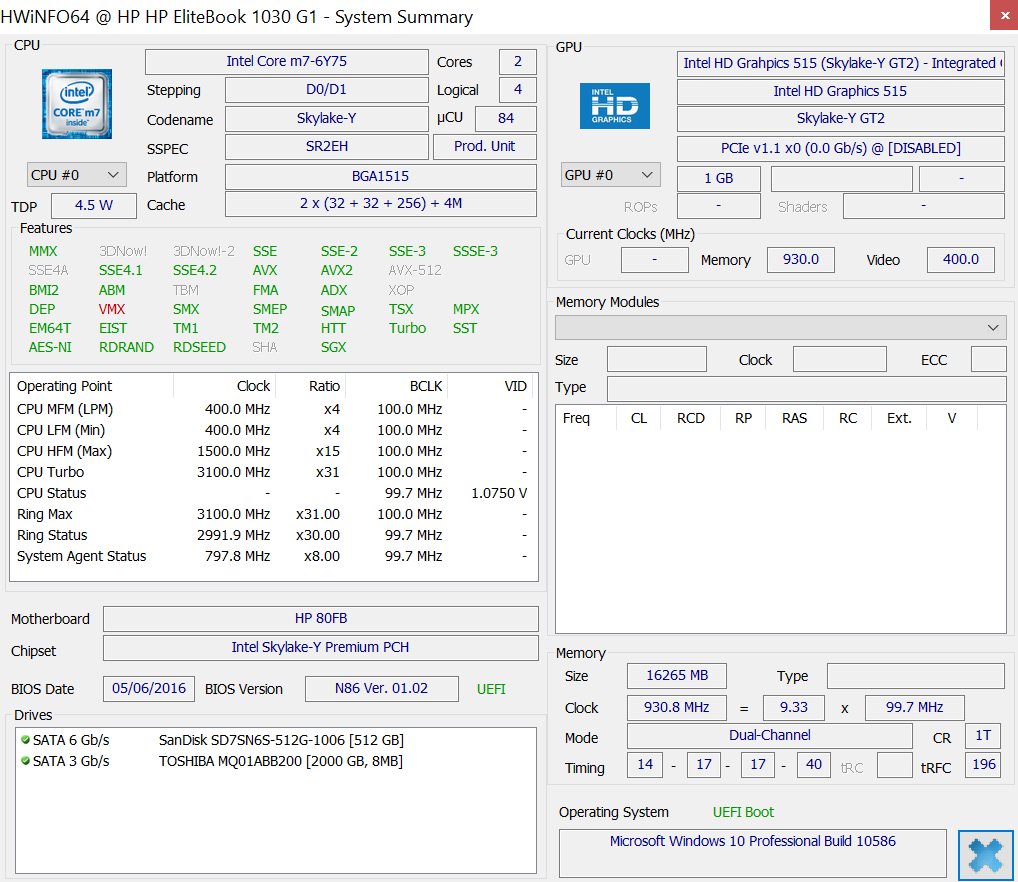
HP EliteBook 1030 G1-X2F03EA
Processor
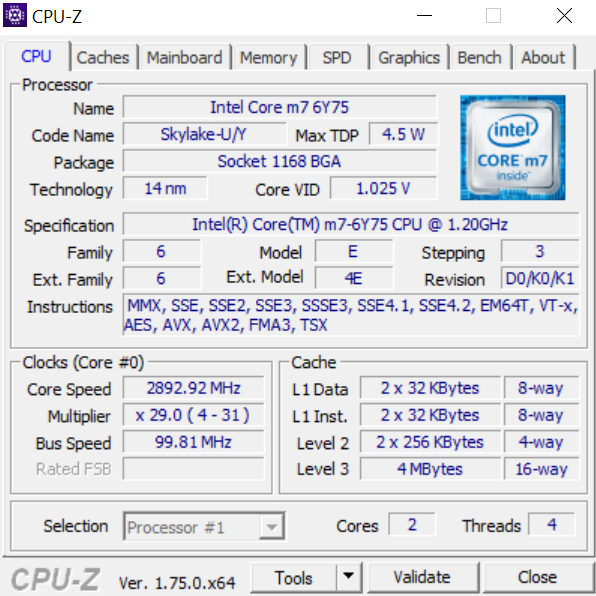
Intel Core m7-6Y75 2 x 1.2 - 3.1 GHz, Skylake
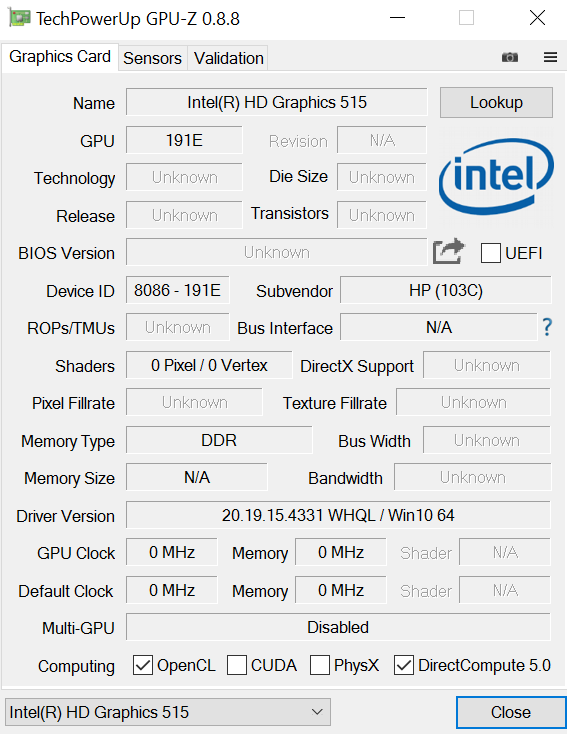
Graphics adapter
Intel HD Graphics 515, Core: 1000 MHz, 20.19.15.4331
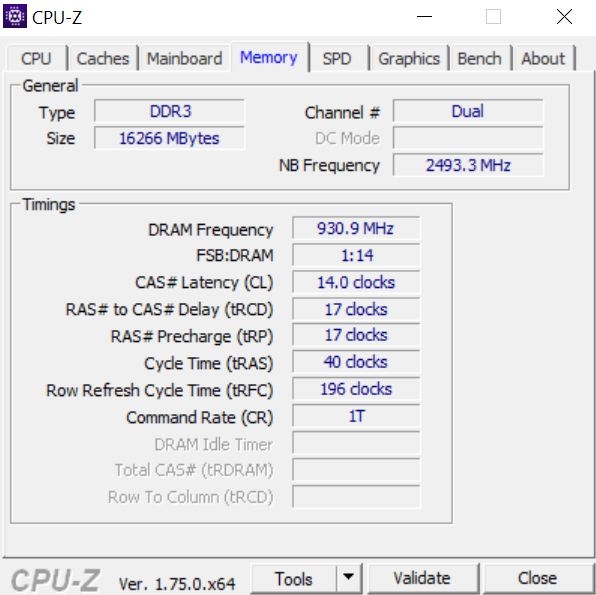
Memory
16 GB
, LPDDR3-1866, 双通道,板载
Display
13.30 inch 16:9, 3200 x 1800 pixel 276 PPI, 电容式, Sharp SHP1465, IPS, LED-背光, glossy: yes
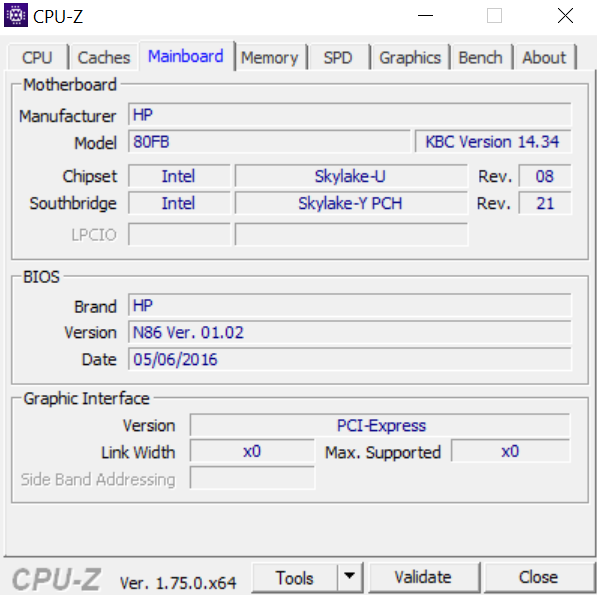
Mainboard
Intel Skylake-Y Premium PCH
Storage
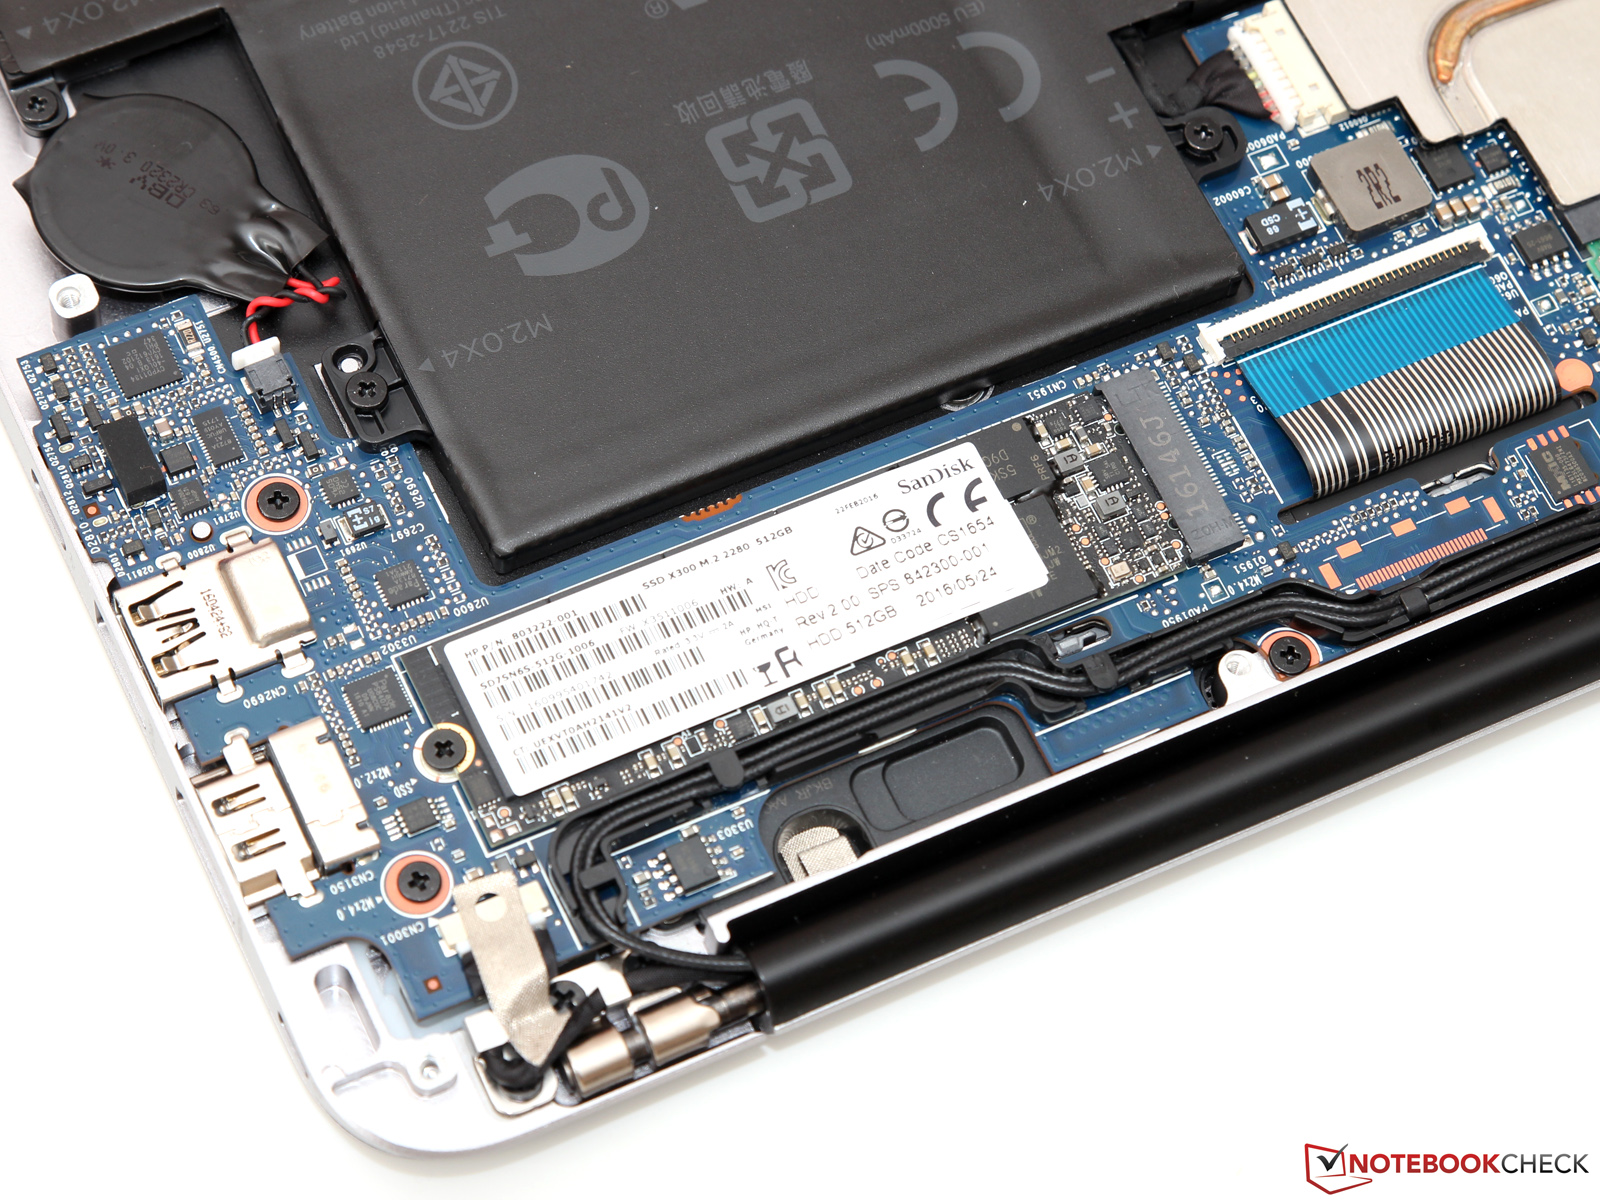
Sandisk X300 SD7SN6S-512G-1006, 512 GB
Weight
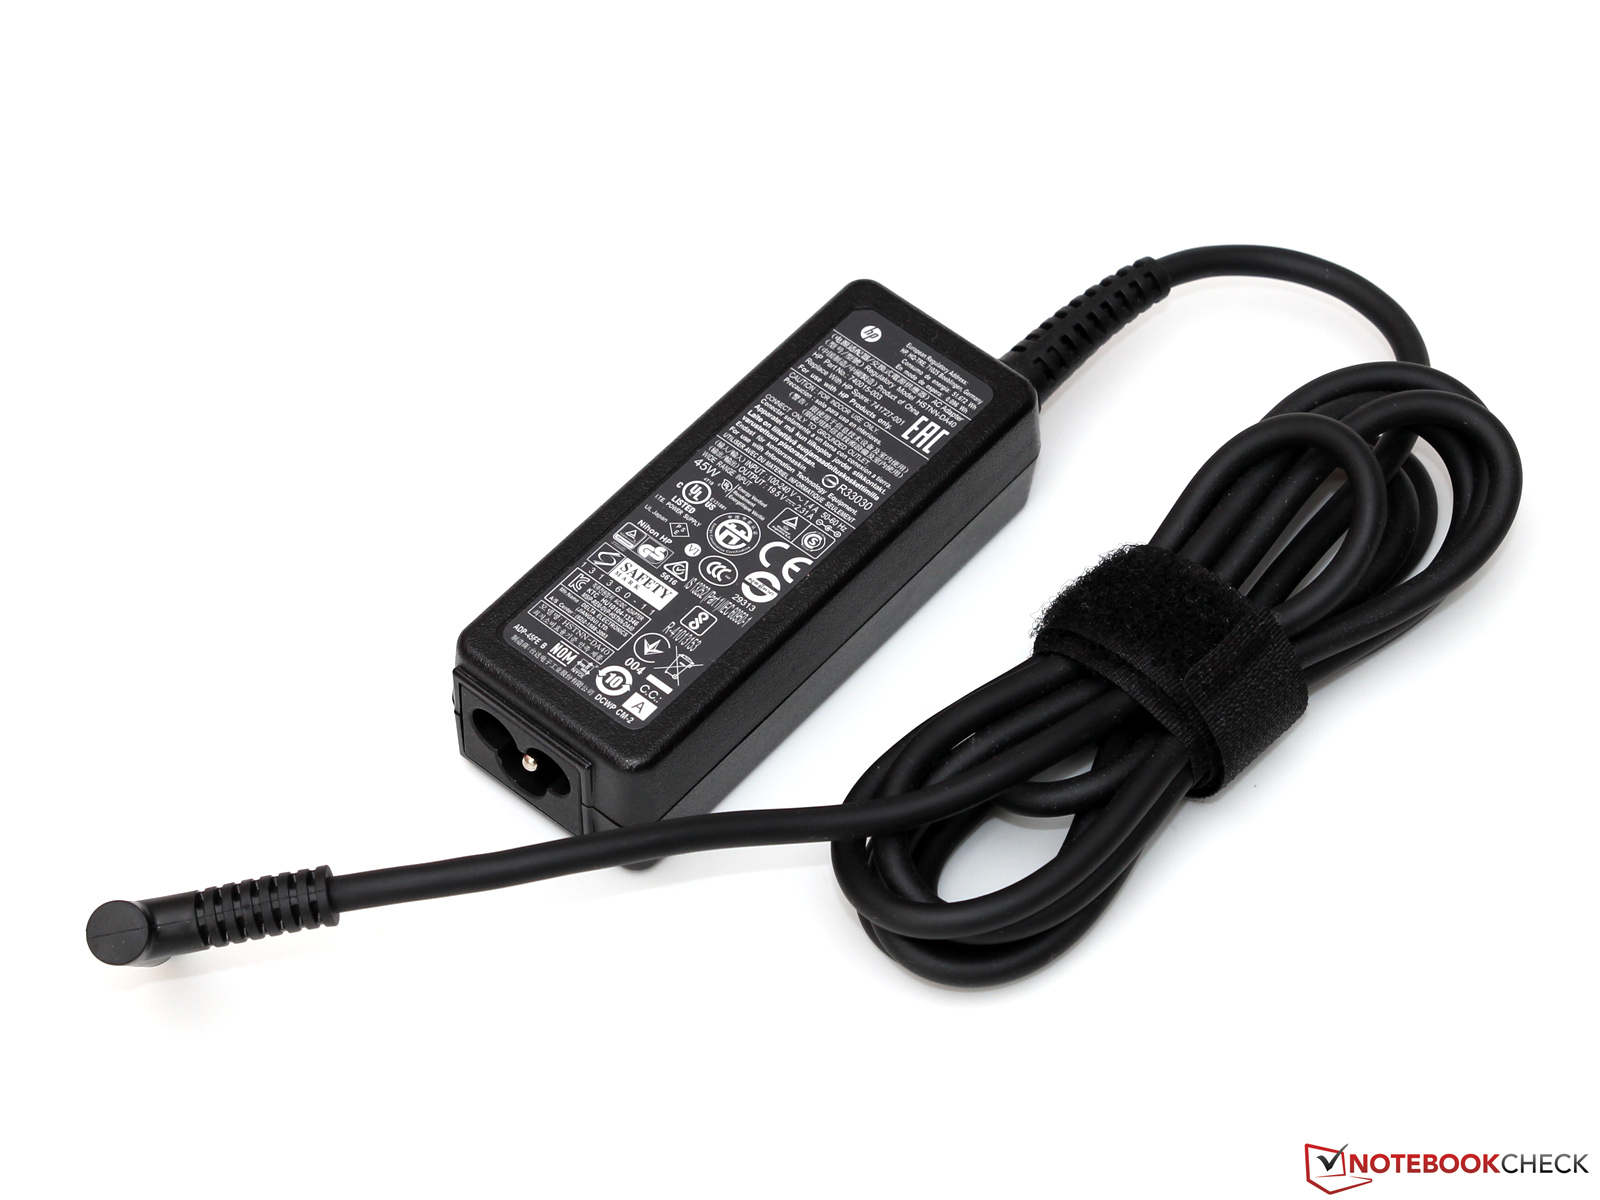
1.16 kg, Power Supply: 230 g
Price
2000 Euro
Links
Note: The manufacturer may use components from different suppliers including display panels, drives or memory sticks with similar specifications.


| Networking | |
| iperf Server (receive) TCP 1 m | |
| Apple MacBook 12 (Early 2016) 1.1 GHz | |
| iperf Client (transmit) TCP 1 m | |
| Apple MacBook 12 (Early 2016) 1.1 GHz | |
| |||||||||||||||||||||||||
Sharp SHP1465 tested with X-Rite i1Pro 2
Maximum: 401 cd/m² (Nits) Average: 369.3 cd/m² Minimum: 18 cd/m²Brightness Distribution: 85 %
Center on Battery: 399 cd/m²
Contrast: 1146:1 (Black: 0.35 cd/m²)
ΔE Color 3.5 | 0.5-29.43 Ø5
ΔE Greyscale 4.13 | 0.57-98 Ø5.3
94.64% sRGB (Argyll 1.6.3 3D)
61.56% AdobeRGB 1998 (Argyll 1.6.3 3D)
69% AdobeRGB 1998 (Argyll 2.2.0 3D)
94.7% sRGB (Argyll 2.2.0 3D)
67.6% Display P3 (Argyll 2.2.0 3D)
Gamma: 2.28
Screen Flickering / PWM (Pulse-Width Modulation)
ℹ
To dim the screen, some notebooks will simply cycle the backlight on and off in rapid succession - a method called Pulse Width Modulation (PWM) . This cycling frequency should ideally be undetectable to the human eye. If said frequency is too low, users with sensitive eyes may experience strain or headaches or even notice the flickering altogether.| Screen flickering / PWM not detected | ||
In comparison: 53 % of all tested devices do not use PWM to dim the display. If PWM was detected, an average of 17924 (minimum: 5 - maximum: 3846000) Hz was measured. | ||
| HP EliteBook 1030 G1-X2F03EA Sharp SHP1465, IPS, 3200x1800, 13.30 | Dell Latitude 13 7370 Sharp LQ133M1, IPS, 1920x1080, 13.30 | HP EliteBook Folio G1 V1C37EA AUO226D, IPS, 1920x1080, 12.50 | Toshiba Portege Z30-C-138 TOS508F, IPS, 1920x1080, 13.30 | Lenovo ThinkPad X1 Carbon 20FB003RGE VVX14T058J00, IPS, 2560x1440, 14.00 | |
|---|---|---|---|---|---|
| Display | -21% | -33% | 1% | -1% | |
| Display P3 Coverage | 67.6 | 52.2 -23% | 44.45 -34% | 67.9 0% | 66.7 -1% |
| sRGB Coverage | 94.7 | 78.3 -17% | 65.2 -31% | 98 3% | 94.7 0% |
| AdobeRGB 1998 Coverage | 69 | 53.9 -22% | 45.96 -33% | 69.8 1% | 68.4 -1% |
| Response Times | -25% | 16% | -4% | 1% | |
| Response Time Grey 50% / Grey 80% * | 42.4 ? | 50.4 ? -19% | 32 ? 25% | 42 ? 1% | 44 ? -4% |
| Response Time Black / White * | 25.6 ? | 33.6 ? -31% | 24 ? 6% | 28 ? -9% | 24 ? 6% |
| PWM Frequency | 217 ? | 220 ? | |||
| Screen | -20% | -19% | -19% | -2% | |
| Brightness middle | 401 | 261 -35% | 289 -28% | 300 -25% | 272 -32% |
| Brightness | 369 | 241 -35% | 298 -19% | 280 -24% | 268 -27% |
| Brightness Distribution | 85 | 85 0% | 87 2% | 87 2% | 95 12% |
| Black Level * | 0.35 | 0.26 26% | 0.27 23% | 0.31 11% | 0.32 9% |
| Contrast | 1146 | 1004 -12% | 1070 -7% | 968 -16% | 850 -26% |
| Colorchecker dE 2000 * | 3.5 | 4.3 -23% | 4.82 -38% | 4.9 -40% | 2.61 25% |
| Colorchecker dE 2000 max. * | 6.33 | 8.66 -37% | 10.73 -70% | 8.91 -41% | 6.43 -2% |
| Greyscale dE 2000 * | 4.13 | 5.82 -41% | 3.84 7% | 6.69 -62% | 3.31 20% |
| Gamma | 2.28 96% | 2.44 90% | 2.41 91% | 2.33 94% | 2.35 94% |
| CCT | 6508 100% | 6771 96% | 6492 100% | 6487 100% | 6360 102% |
| Color Space (Percent of AdobeRGB 1998) | 61.56 | 49.18 -20% | 42.03 -32% | 63 2% | 63 2% |
| Color Space (Percent of sRGB) | 94.64 | 77.84 -18% | 64.8 -32% | 98 4% | 95 0% |
| Total Average (Program / Settings) | -22% /
-20% | -12% /
-17% | -7% /
-13% | -1% /
-1% |
* ... smaller is better
Display Response Times
ℹ
Display response times show how fast the screen is able to change from one color to the next. Slow response times can lead to afterimages and can cause moving objects to appear blurry (ghosting). Gamers of fast-paced 3D titles should pay special attention to fast response times.| ↔ Response Time Black to White | ||
|---|---|---|
| 25.6 ms ... rise ↗ and fall ↘ combined | ↗ 11.6 ms rise | 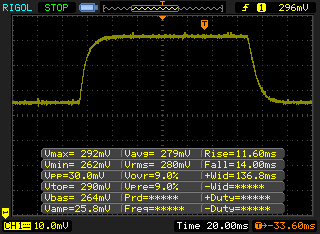 |
| ↘ 14 ms fall | ||
| The screen shows relatively slow response rates in our tests and may be too slow for gamers. In comparison, all tested devices range from 0.1 (minimum) to 240 (maximum) ms. » 56 % of all devices are better. This means that the measured response time is worse than the average of all tested devices (21.5 ms). | ||
| ↔ Response Time 50% Grey to 80% Grey | ||
| 42.4 ms ... rise ↗ and fall ↘ combined | ↗ 17.2 ms rise | 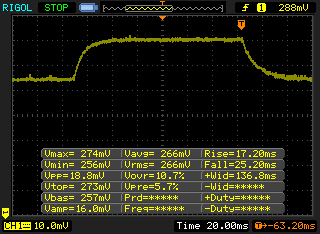 |
| ↘ 25.2 ms fall | ||
| The screen shows slow response rates in our tests and will be unsatisfactory for gamers. In comparison, all tested devices range from 0.2 (minimum) to 636 (maximum) ms. » 66 % of all devices are better. This means that the measured response time is worse than the average of all tested devices (33.7 ms). | ||
| Cinebench R15 | |
| CPU Single 64Bit | |
| Toshiba Portege Z30-C-125 | |
| HP EliteBook 820 G3 T8X20EA | |
| HP EliteBook 1030 G1-X2F03EA | |
| HP EliteBook Folio G1 V1C37EA | |
| Dell Latitude 13 7370 | |
| Apple MacBook 12 (Early 2016) 1.1 GHz | |
| Apple MacBook 12 (Early 2016) 1.1 GHz | |
| Microsoft Surface Pro 4, Core m3 | |
| CPU Multi 64Bit | |
| Toshiba Portege Z30-C-125 | |
| HP EliteBook 820 G3 T8X20EA | |
| HP EliteBook 1030 G1-X2F03EA | |
| HP EliteBook Folio G1 V1C37EA | |
| Apple MacBook 12 (Early 2016) 1.1 GHz | |
| Microsoft Surface Pro 4, Core m3 | |
| Dell Latitude 13 7370 | |
| Cinebench R11.5 | |
| CPU Single 64Bit | |
| HP EliteBook 1030 G1-X2F03EA | |
| HP EliteBook 820 G3 T8X20EA | |
| Dell Latitude 13 7370 | |
| Apple MacBook 12 (Early 2016) 1.1 GHz | |
| Apple MacBook 12 (Early 2016) 1.1 GHz | |
| Microsoft Surface Pro 4, Core m3 | |
| CPU Multi 64Bit | |
| HP EliteBook 1030 G1-X2F03EA | |
| HP EliteBook 820 G3 T8X20EA | |
| Apple MacBook 12 (Early 2016) 1.1 GHz | |
| Apple MacBook 12 (Early 2016) 1.1 GHz | |
| Microsoft Surface Pro 4, Core m3 | |
| Dell Latitude 13 7370 | |
| X264 HD Benchmark 4.0 | |
| Pass 1 | |
| HP EliteBook 1030 G1-X2F03EA | |
| Toshiba Portege Z30-C-125 | |
| HP EliteBook 820 G3 T8X20EA | |
| Dell Latitude 13 7370 | |
| Microsoft Surface Pro 4, Core m3 | |
| Apple MacBook 12 (Early 2016) 1.1 GHz | |
| Pass 2 | |
| Toshiba Portege Z30-C-125 | |
| HP EliteBook 1030 G1-X2F03EA | |
| HP EliteBook 820 G3 T8X20EA | |
| Microsoft Surface Pro 4, Core m3 | |
| Apple MacBook 12 (Early 2016) 1.1 GHz | |
| Dell Latitude 13 7370 | |
| HP EliteBook 1030 G1-X2F03EA Sandisk X300 SD7SN6S-512G-1006 | Dell Latitude 13 7370 Toshiba NVMe THNSN5256GPU7 | HP EliteBook Folio G1 V1C37EA Samsung SM951 MZVPV256 m.2 | Apple MacBook 12 (Early 2016) 1.1 GHz Apple SSD AP0256 | Toshiba Portege Z30-C-138 Toshiba HG6 THNSNJ512G8NY | |
|---|---|---|---|---|---|
| CrystalDiskMark 3.0 | 154% | 173% | 53% | 11% | |
| Read Seq | 387.5 | 1354 249% | 1482 282% | 754 95% | 518 34% |
| Write Seq | 348.7 | 1132 225% | 1232 253% | 638 83% | 423.3 21% |
| Read 512 | 239.9 | 1140 375% | 1191 396% | 616 157% | 414.8 73% |
| Write 512 | 335.3 | 1020 204% | 1220 264% | 678 102% | 379.9 13% |
| Read 4k | 30.34 | 42.13 39% | 46.96 55% | 14.6 -52% | 21.17 -30% |
| Write 4k | 75.9 | 105.8 39% | 100.7 33% | 20.5 -73% | 86.3 14% |
| Read 4k QD32 | 311.3 | 400.5 29% | 464 49% | 464 49% | 227.3 -27% |
| Write 4k QD32 | 192.8 | 328.4 70% | 292.1 52% | 315 63% | 174.7 -9% |
| PCMark 7 - Score | |
| Lenovo ThinkPad X1 Carbon 20FB003RGE | |
| HP EliteBook 1030 G1-X2F03EA | |
| Microsoft Surface Pro 4, Core m3 | |
| Dell Latitude 13 7370 | |
| PCMark 7 Score | 4917 points | |
| PCMark 8 Home Score Accelerated v2 | 2838 points | |
| PCMark 8 Creative Score Accelerated v2 | 3555 points | |
| PCMark 8 Work Score Accelerated v2 | 3784 points | |
Help | ||

Sandisk X300 SD7SN6S-512G-1006
Transfer Rate Minimum:
86.1 MB/s
Transfer Rate Maximum:
403.6 MB/s
Transfer Rate Average:
373.8 MB/s
Access Time:
0.1 ms
Burst Rate:
49.6 MB/s
CPU Usage:
3.5 %
| 3DMark 06 Standard Score | 7197 points | |
| 3DMark 11 Performance | 1219 points | |
| 3DMark Ice Storm Standard Score | 43571 points | |
| 3DMark Cloud Gate Standard Score | 5242 points | |
| 3DMark Fire Strike Score | 774 points | |
Help | ||
| low | med. | high | ultra | |
| BioShock Infinite (2013) | 44.6 | 19.5 | 16.7 | 5.1 |
| Metro: Last Light (2013) | 21.5 | 18 | 12.5 | |
| Dirt Rally (2015) | 67.2 | 15.8 | 12.5 |
(±) The average temperature for the upper side under maximal load is 37 °C / 99 F, compared to the average of 30.7 °C / 87 F for the devices in the class Subnotebook.
(±) The maximum temperature on the upper side is 43.4 °C / 110 F, compared to the average of 35.9 °C / 97 F, ranging from 21.4 to 59 °C for the class Subnotebook.
(±) The bottom heats up to a maximum of 44.5 °C / 112 F, compared to the average of 39.4 °C / 103 F
(+) In idle usage, the average temperature for the upper side is 30.6 °C / 87 F, compared to the device average of 30.7 °C / 87 F.
(±) The palmrests and touchpad can get very hot to the touch with a maximum of 38.7 °C / 101.7 F.
(-) The average temperature of the palmrest area of similar devices was 28.3 °C / 82.9 F (-10.4 °C / -18.8 F).
Power Consumption
| Off / Standby | |
| Idle | |
| Load |
|
| HP EliteBook 1030 G1-X2F03EA 6Y75, HD Graphics 515, Sandisk X300 SD7SN6S-512G-1006, IPS, 3200x1800, 13.30 | Dell Latitude 13 7370 6Y57, HD Graphics 515, Toshiba NVMe THNSN5256GPU7, IPS, 1920x1080, 13.30 | HP EliteBook Folio G1 V1C37EA 6Y54, HD Graphics 515, Samsung SM951 MZVPV256 m.2, IPS, 1920x1080, 12.50 | Toshiba Portege Z30-C-138 6500U, HD Graphics 520, Toshiba HG6 THNSNJ512G8NY, IPS, 1920x1080, 13.30 | Lenovo ThinkPad X1 Carbon 20FB003RGE 6500U, HD Graphics 520, Samsung SSD PM871 MZNLN256HCHP, IPS, 2560x1440, 14.00 | |
|---|---|---|---|---|---|
| Power Consumption | 11% | 13% | -8% | -3% | |
| Idle Minimum * | 4 | 5 -25% | 4.3 -8% | 3.2 20% | 3.8 5% |
| Idle Average * | 8 | 7.5 6% | 6 25% | 7.8 2% | 7.1 11% |
| Idle Maximum * | 8.6 | 8 7% | 6.4 26% | 8.7 -1% | 7.7 10% |
| Load Average * | 26.5 | 15.3 42% | 22.7 14% | 42.2 -59% | 30.2 -14% |
| Load Maximum * | 34.8 | 26.8 23% | 31.2 10% | 35.7 -3% | 44.7 -28% |
* ... smaller is better
| HP EliteBook 1030 G1-X2F03EA 6Y75, HD Graphics 515, 40 Wh | Dell Latitude 13 7370 6Y57, HD Graphics 515, 34 Wh | HP EliteBook Folio G1 V1C37EA 6Y54, HD Graphics 515, 38 Wh | Toshiba Portege Z30-C-138 6500U, HD Graphics 520, 52 Wh | Lenovo ThinkPad X1 Carbon 20FB003RGE 6500U, HD Graphics 520, 52 Wh | Apple MacBook 12 (Early 2016) 1.1 GHz 6Y30, HD Graphics 515, 41.4 Wh | |
|---|---|---|---|---|---|---|
| Battery Runtime | 10% | 4% | 13% | 27% | 53% | |
| Reader / Idle | 618 | 588 -5% | 526 -15% | 942 52% | ||
| H.264 | 377 | 391 4% | 413 10% | 510 35% | 512 36% | |
| WiFi v1.3 | 305 | 367 20% | 355 16% | 345 13% | 429 41% | 501 64% |
| Load | 144 | 176 22% | 152 6% | 115 -20% | 231 60% |
Pros
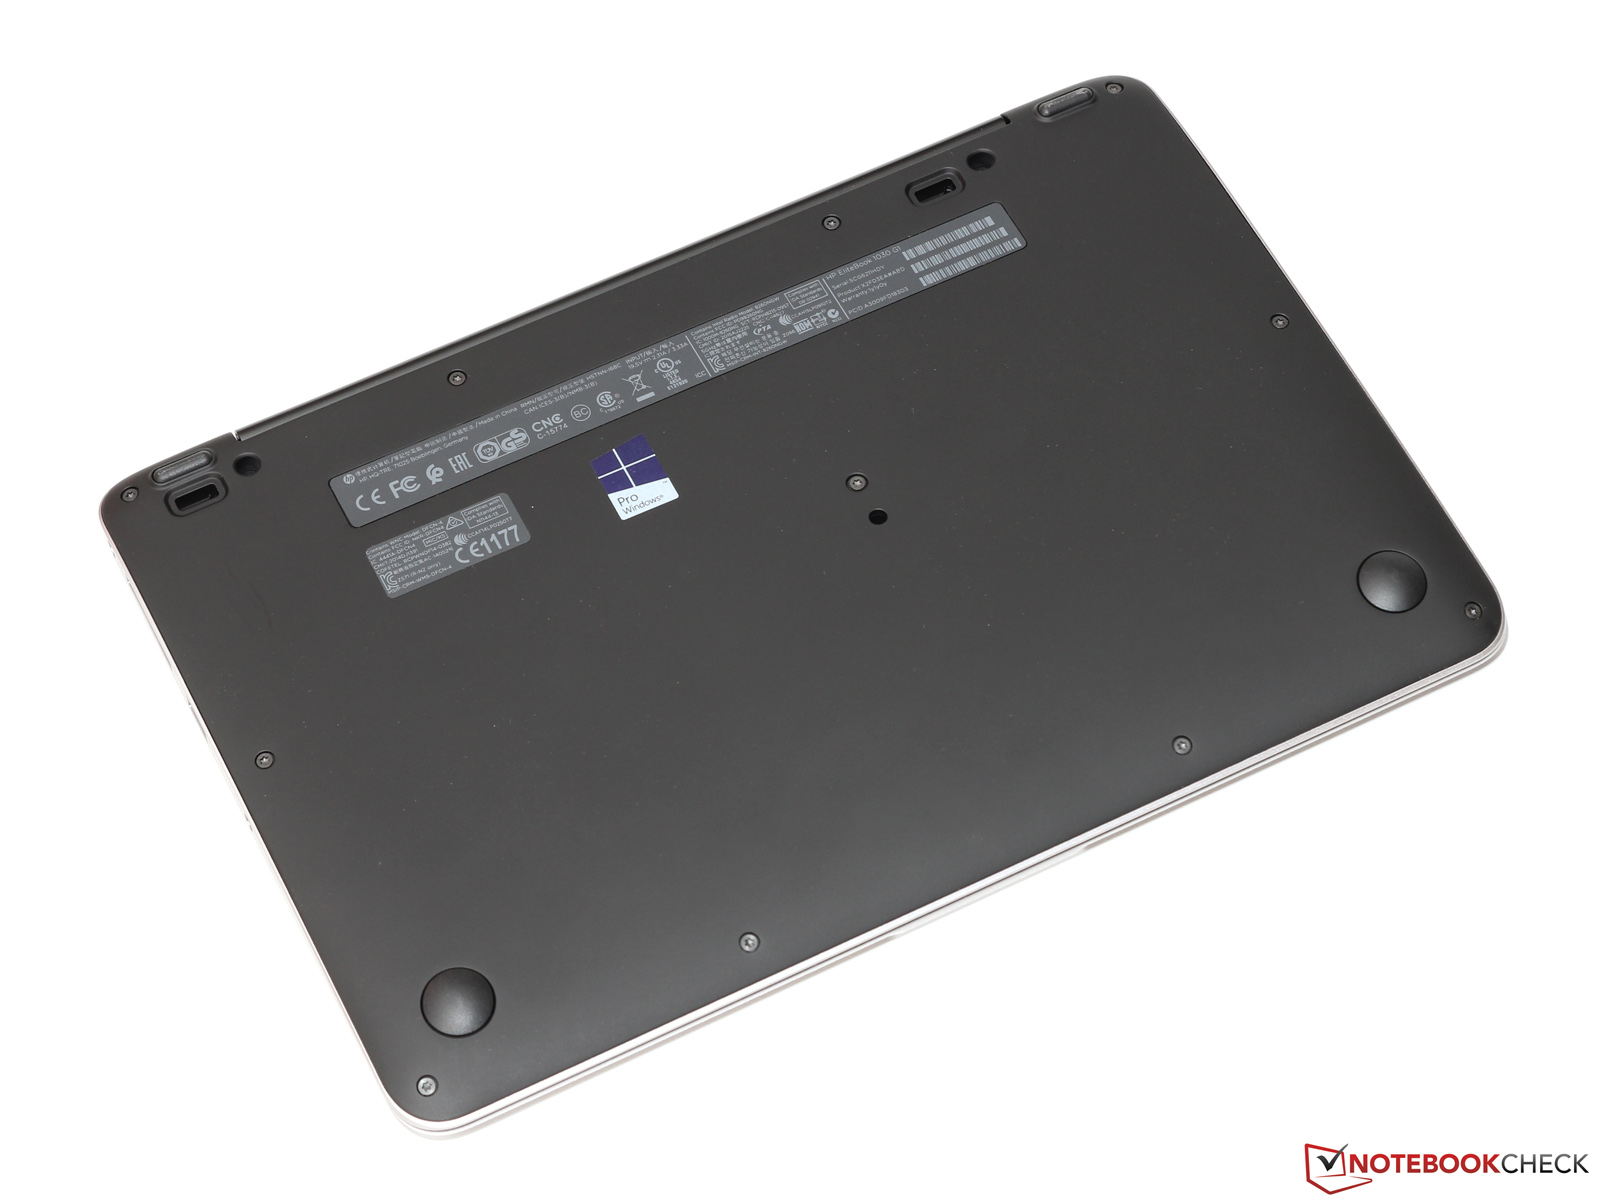
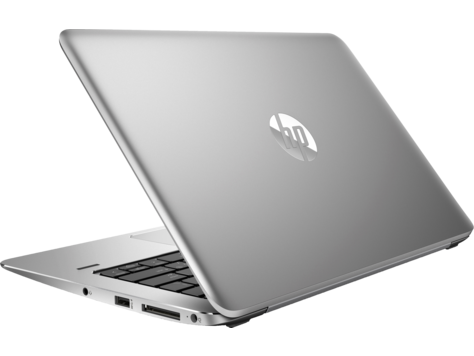
+ 高品质机身
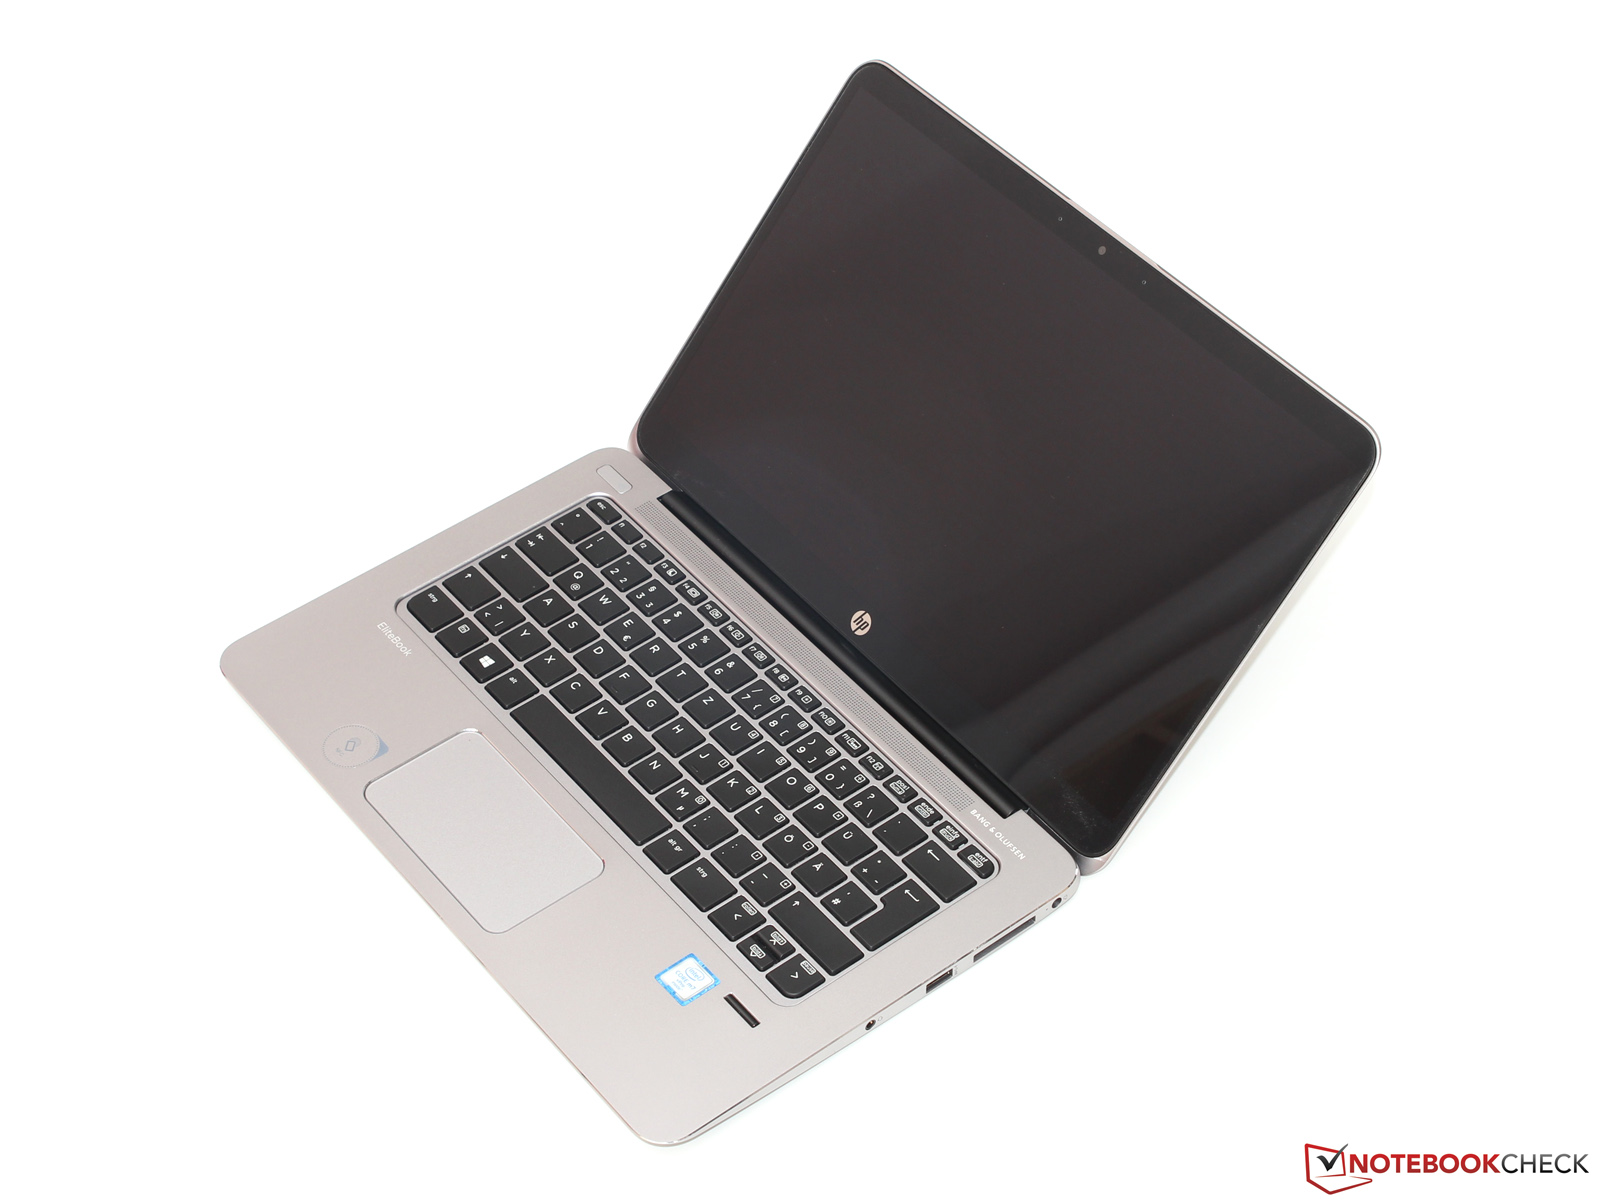
+ 出色的输入设备
+ 出色的QHD+屏幕
+ 应用程序性能高
+ 快速无线网络
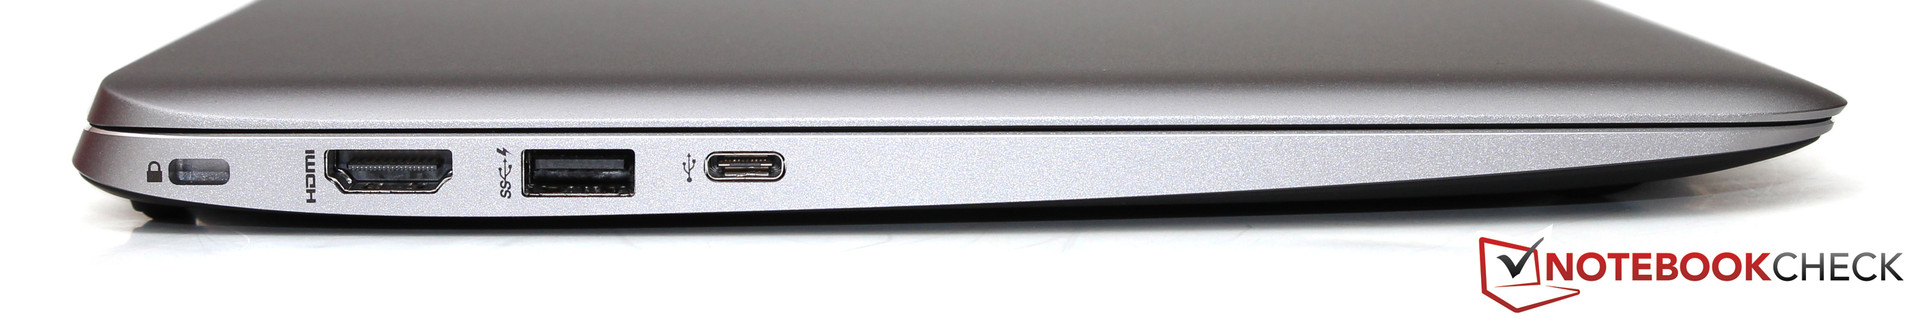
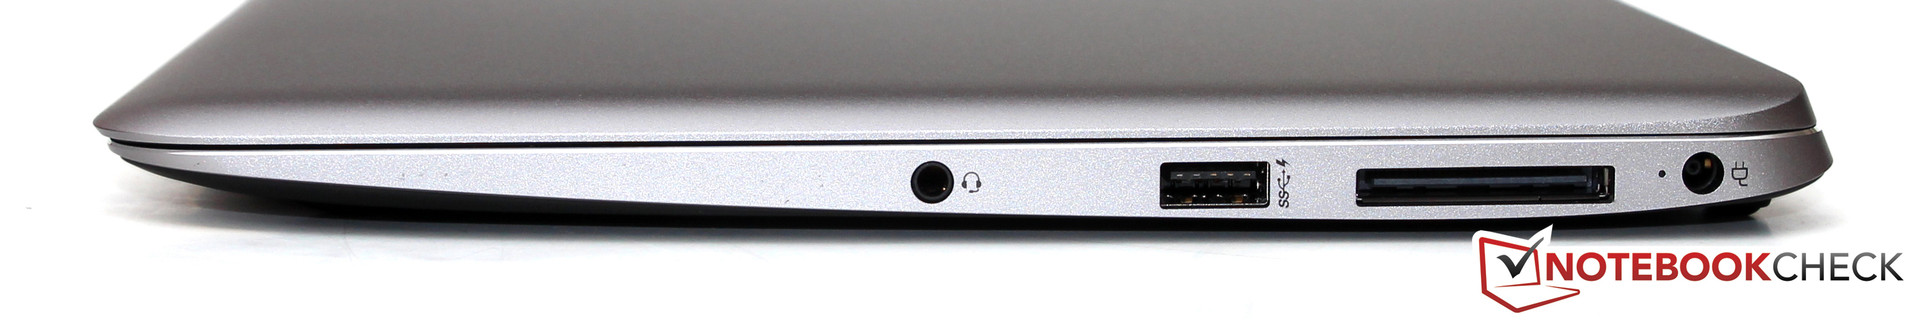
+ USB C型接口
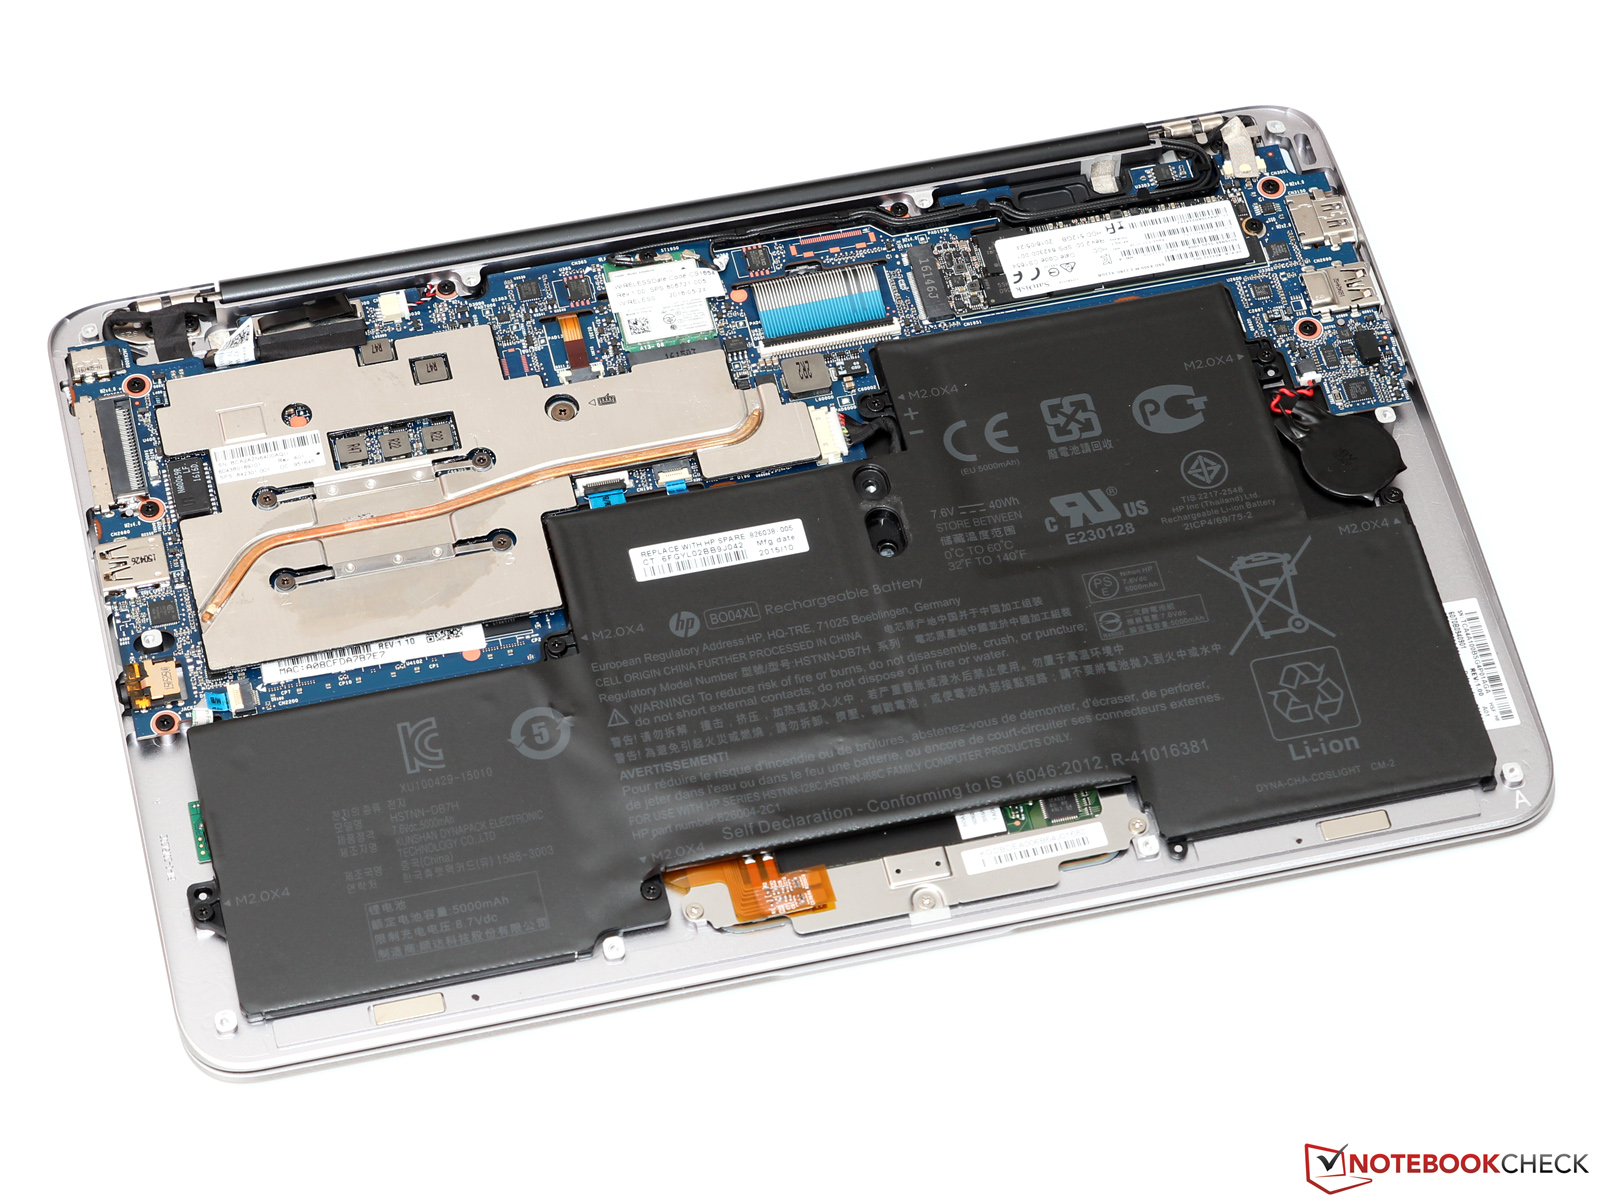
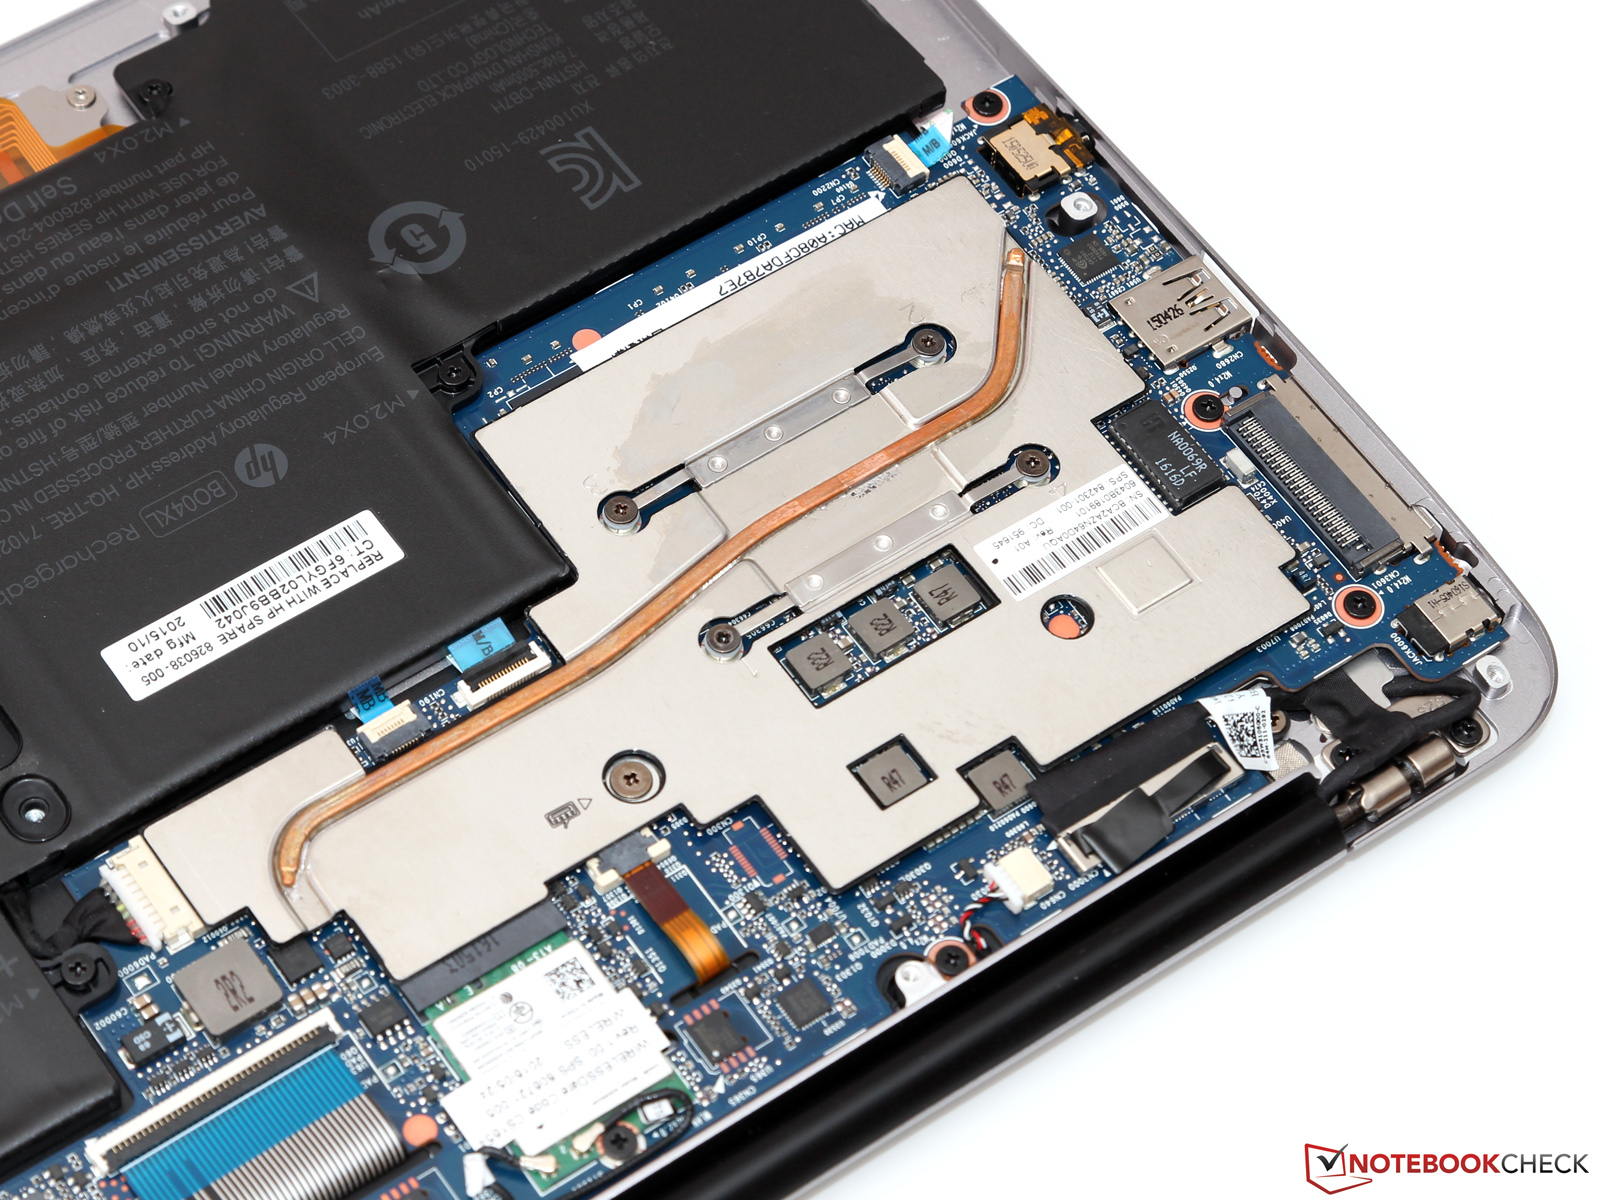
+ 无风扇
Cons
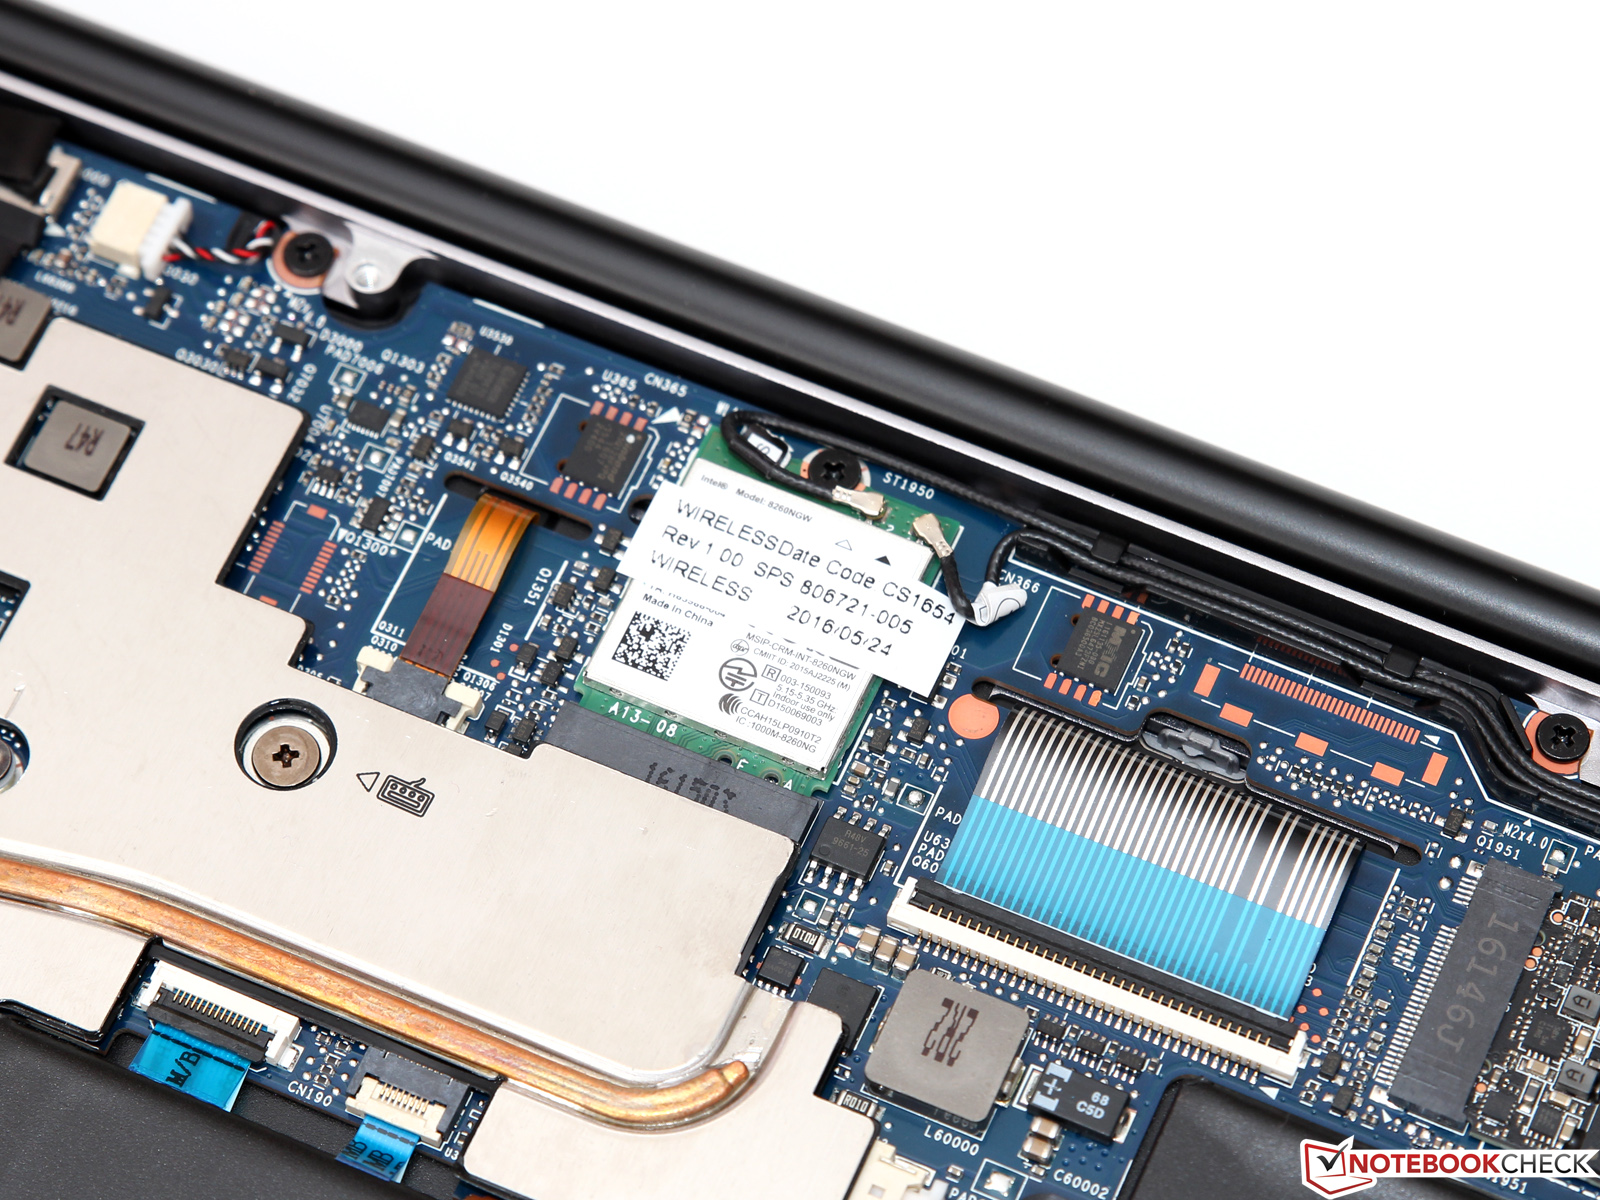
- 有限的升级空间
- 一般的电池续航
- DisplayPort只能通过底座获得
对于被动冷却的商务笔记本电脑大家可能有不同的看法:如果你在夏天也要使用需求较高的计算软件,需要尽量强的性能的话,那么可能经典的酷睿i系列处理器更适合你。对于简单的办公应用,比如上网浏览或者视频会议,并不需要很强的性能——而其他的方面如输入设备,重量或噪音控制则显得更加重要。
惠普从这个角度设计了一款几乎完美的设备EliteBook 1030 G1。这台笔记本电脑在工艺品质,键盘和屏幕方面都表现特别优秀。它的应用程序性能也特别优秀,尽管有以上提到过的限制,但惠普在性能和发热量间找到了一个巧妙的平衡,这要归功于它聪明的功率温度控制。
只有相对短的电池续航时间无法满足完美超极本的定义——即将上市的全高清机型可能会提供更长的续航,如果你能够放弃它极致瑞丽的QHD+屏幕的话。
整体上,我们认为1030 G1值得推荐,不过1500到2000欧元(约11219人民币到14912人民币)的较高零售价可能会让一些潜在消费者止步不前。不过,水平相当的竞争机型也同样价格不菲。
注:本文是基于完整评测的缩减版本,阅读完整的英文评测,请点击这里。
HP EliteBook 1030 G1-X2F03EA
-
07/11/2016 v5.1(old)
Till Schönborn
Subnotebook - Weighted Average
Pricecompare
