 Deutsch
 English
 Español
 Français
 Italiano
 Nederlands
 Polski
 Português
 Русский
 Türkçe
 Svenska
 Chinese
 Magyar
富士通 Celsius H760 工作站简短评测


| SD Card Reader | |
| average JPG Copy Test (av. of 3 runs) | |
| Fujitsu Celsius H760 | |
| maximum AS SSD Seq Read Test (1GB) | |
| Fujitsu Celsius H760 | |
| Networking | |
| WiFi Speed Client 1m | |
| WiFi Speed Server 1m |
| |||||||||||||||||||||||||
Brightness Distribution: 82 %
Center on Battery: 342 cd/m²
Contrast: 1003:1 (Black: 0.34 cd/m²)
ΔE Color 3.8 | 0.5-29.43 Ø5
ΔE Greyscale 2 | 0.57-98 Ø5.3
88% sRGB (Calman 2D)
82.2% sRGB (Argyll 1.6.3 3D)
54% AdobeRGB 1998 (Argyll 1.6.3 3D)
60.3% AdobeRGB 1998 (Argyll 2.2.0 3D)
82.4% sRGB (Argyll 2.2.0 3D)
63.9% Display P3 (Argyll 2.2.0 3D)
Gamma: 2.17
| Fujitsu Celsius H760 LGD046F LP156WF6-SPP1, , 1920x1080, 15.60 | HP ZBook 15 G3 Samsung SDC5344, , 1920x1080, 15.60 | Lenovo ThinkPad P50 LP156WF6-SPK1, , 1920x1080, 15.60 | Dell Precision 7510 (4K IGZO) Sharp LQ156D1, , 3840x2160, 15.60 | |
|---|---|---|---|---|
| Display | 12% | -34% | 40% | |
| Display P3 Coverage | 63.9 | 66.8 5% | 39.13 -39% | 86.2 35% |
| sRGB Coverage | 82.4 | 95.5 16% | 58.5 -29% | 99.7 21% |
| AdobeRGB 1998 Coverage | 60.3 | 69 14% | 40.45 -33% | 99 64% |
| Response Times | -40% | -11% | -6% | |
| Response Time Grey 50% / Grey 80% * | 38 ? | 54 ? -42% | 46 ? -21% | 40.4 ? -6% |
| Response Time Black / White * | 26 ? | 35.6 ? -37% | 26 ? -0% | 27.6 ? -6% |
| PWM Frequency | 198 ? | 198.4 ? | ||
| Screen | -29% | -18% | 4% | |
| Brightness middle | 341 | 306 -10% | 263 -23% | 279.2 -18% |
| Brightness | 310 | 289 -7% | 236 -24% | 271 -13% |
| Brightness Distribution | 82 | 85 4% | 78 -5% | 83 1% |
| Black Level * | 0.34 | 0.34 -0% | 0.34 -0% | 0.266 22% |
| Contrast | 1003 | 900 -10% | 774 -23% | 1050 5% |
| Colorchecker dE 2000 * | 3.8 | 5.1 -34% | 2.35 38% | 4.14 -9% |
| Colorchecker dE 2000 max. * | 10.8 | 9.9 8% | 6.56 39% | |
| Greyscale dE 2000 * | 2 | 7.4 -270% | 3.33 -67% | 3.26 -63% |
| Gamma | 2.17 101% | 2.37 93% | 2.38 92% | 2.19 100% |
| CCT | 6581 99% | 7263 89% | 6917 94% | 6375 102% |
| Color Space (Percent of AdobeRGB 1998) | 54 | 63 17% | 37 -31% | 85.68 59% |
| Color Space (Percent of sRGB) | 82.2 | 95 16% | 58 -29% | 99.72 21% |
| Total Average (Program / Settings) | -19% /
-22% | -21% /
-20% | 13% /
10% |
* ... smaller is better
Display Response Times
| ↔ Response Time Black to White | ||
|---|---|---|
| 26 ms ... rise ↗ and fall ↘ combined | ↗ 7 ms rise | 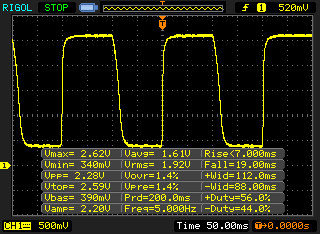 |
| ↘ 19 ms fall | ||
| The screen shows relatively slow response rates in our tests and may be too slow for gamers. In comparison, all tested devices range from 0.1 (minimum) to 240 (maximum) ms. » 57 % of all devices are better. This means that the measured response time is worse than the average of all tested devices (21.5 ms). | ||
| ↔ Response Time 50% Grey to 80% Grey | ||
| 38 ms ... rise ↗ and fall ↘ combined | ↗ 15 ms rise | 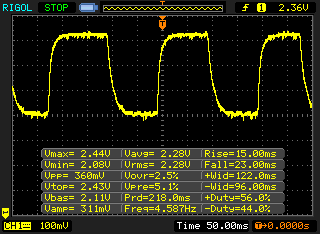 |
| ↘ 23 ms fall | ||
| The screen shows slow response rates in our tests and will be unsatisfactory for gamers. In comparison, all tested devices range from 0.2 (minimum) to 636 (maximum) ms. » 49 % of all devices are better. This means that the measured response time is worse than the average of all tested devices (33.7 ms). | ||
Screen Flickering / PWM (Pulse-Width Modulation)
| Screen flickering / PWM not detected | 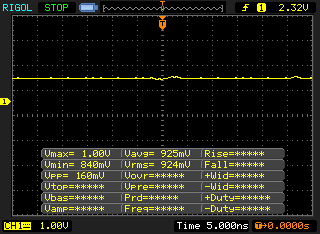 | ||
In comparison: 53 % of all tested devices do not use PWM to dim the display. If PWM was detected, an average of 17915 (minimum: 5 - maximum: 3846000) Hz was measured. | |||

| Cinebench R15 | |
| CPU Single 64Bit | |
| MSI WS60-6QJE316H11 | |
| Fujitsu Celsius H760 | |
| Lenovo ThinkPad P50 | |
| HP ZBook Studio G3 | |
| Dell Precision 3510 | |
| CPU Multi 64Bit | |
| Lenovo ThinkPad P50 | |
| Fujitsu Celsius H760 | |
| HP ZBook Studio G3 | |
| MSI WS60-6QJE316H11 | |
| Dell Precision 3510 | |
| Cinebench R11.5 | |
| CPU Single 64Bit | |
| Fujitsu Celsius H760 | |
| MSI WS60-6QJE316H11 | |
| Lenovo ThinkPad P50 | |
| HP ZBook Studio G3 | |
| Dell Precision 3510 | |
| CPU Multi 64Bit | |
| Lenovo ThinkPad P50 | |
| Fujitsu Celsius H760 | |
| HP ZBook Studio G3 | |
| MSI WS60-6QJE316H11 | |
| Dell Precision 3510 | |
| PCMark 8 | |
| Home Score Accelerated v2 | |
| Fujitsu Celsius H760 | |
| Lenovo ThinkPad P50 | |
| Dell Precision 7510 (4K IGZO) | |
| HP ZBook 15 G3 | |
| Creative Score Accelerated v2 | |
| Dell Precision 7510 (4K IGZO) | |
| HP ZBook 15 G3 | |
| Fujitsu Celsius H760 | |
| Lenovo ThinkPad P50 | |
| Work Score Accelerated v2 | |
| Fujitsu Celsius H760 | |
| HP ZBook 15 G3 | |
| Lenovo ThinkPad P50 | |
| Dell Precision 7510 (4K IGZO) | |
| Fujitsu Celsius H760 Samsung SM951 MZVPV512 m.2 PCI-e | Dell Precision 7510 (4K IGZO) Samsung SSD SM951a 512GB M.2 PCIe 3.0 x4 NVMe (MZVKV512) | Lenovo ThinkPad P50 Samsung SSD PM871 MZNLN256HCHP | HP ZBook Studio G3 Samsung SM951 MZVPV512HDGL m.2 PCI-e | Dell Precision 5510 SK hynix SC920 512 GB | MSI WS60 6QJ-535VPL 2x Plextor PX512M6GV-2280 (RAID 0) | |
|---|---|---|---|---|---|---|
| AS SSD | 3% | -69% | -10% | -515% | -48% | |
| Copy Game MB/s | 978 | 1045 7% | 206.7 -79% | 1104 13% | 349 -64% | |
| Copy Program MB/s | 571 | 480.1 -16% | 171.3 -70% | 593 4% | 221 -61% | |
| Copy ISO MB/s | 1325 | 1391 5% | 269.3 -80% | 1280 -3% | 387 -71% | |
| Access Time Read * | 0.036 | 0.036 -0% | 0.058 -61% | 0.046 -28% | 0.111 -208% | 0.054 -50% |
| Access Time Write * | 0.018 | 0.025 -39% | 0.038 -111% | 0.025 -39% | 0.74 -4011% | 0.041 -128% |
| 4K-64 Read | 801 | 1067 33% | 381.2 -52% | 1050 31% | 327 -59% | 437.1 -45% |
| 4K-64 Write | 285 | 375.7 32% | 258.3 -9% | 230.6 -19% | 257 -10% | 375.8 32% |
| Seq Read | 1916 | 1953 2% | 515 -73% | 1713 -11% | 474 -75% | 880 -54% |
| Seq Write | 1492 | 1484 -1% | 272.8 -82% | 947 -37% | 389 -74% | 821 -45% |
* ... smaller is better

| 3DMark | |
| 1280x720 Cloud Gate Standard Graphics | |
| Lenovo ThinkPad P50 | |
| Fujitsu Celsius H760 | |
| HP ZBook 15 G3 | |
| Dell Precision 7510 (4K IGZO) | |
| 1920x1080 Fire Strike Graphics | |
| Dell Precision 7510 (4K IGZO) | |
| Lenovo ThinkPad P50 | |
| HP ZBook 15 G3 | |
| Fujitsu Celsius H760 | |
| LuxMark v2.0 64Bit | |
| Sala GPUs-only | |
| HP ZBook 15 G3 | |
| Lenovo ThinkPad P50 | |
| Fujitsu Celsius H760 | |
| Room GPUs-only | |
| HP ZBook 15 G3 | |
| Lenovo ThinkPad P50 | |
| Fujitsu Celsius H760 | |
| Cinebench R11.5 - OpenGL 64Bit | |
| Fujitsu Celsius H760 | |
| HP ZBook 15 G3 | |
| Dell Precision 7510 (4K IGZO) | |
| Lenovo ThinkPad P50 | |
| 3DMark Ice Storm Standard Score | 90607 points | |
| 3DMark Cloud Gate Standard Score | 18192 points | |
| 3DMark Fire Strike Score | 3794 points | |
Help | ||
| low | med. | high | ultra | |
| Metro: Last Light (2013) | 118.9 | 94.8 | 55.3 | 29.5 |
| Dirt Rally (2015) | 272 | 136 | 76 | 33 |
| The Witcher 3 (2015) | 68 | 49 | 22 | 15 |
Noise Level
| Idle |
| 29 / 29 / 29 dB(A) |
| HDD |
| 29 dB(A) |
| Load |
| 43.1 / 49.2 dB(A) |
 | ||
30 dB silent 40 dB(A) audible 50 dB(A) loud |
||
min: | ||
(+) The maximum temperature on the upper side is 38.5 °C / 101 F, compared to the average of 38.1 °C / 101 F, ranging from 22.2 to 69.8 °C for the class Workstation.
(±) The bottom heats up to a maximum of 42.8 °C / 109 F, compared to the average of 41.3 °C / 106 F
(+) In idle usage, the average temperature for the upper side is 30 °C / 86 F, compared to the device average of 32 °C / 90 F.
(+) The palmrests and touchpad are reaching skin temperature as a maximum (32.1 °C / 89.8 F) and are therefore not hot.
(-) The average temperature of the palmrest area of similar devices was 27.8 °C / 82 F (-4.3 °C / -7.8 F).
| Off / Standby | |
| Idle | |
| Load |
|
| Fujitsu Celsius H760 E3-1505M v5, Quadro M2000M, Samsung SM951 MZVPV512 m.2 PCI-e, IPS LED, 1920x1080, 15.60 | Dell Precision 7510 (4K IGZO) E3-1535M v5, Quadro M2000M, Samsung SSD SM951a 512GB M.2 PCIe 3.0 x4 NVMe (MZVKV512), IGZO IPS, 3840x2160, 15.60 | HP ZBook 15 G3 E3-1505M v5, Quadro M2000M, Samsung SM951 MZVPV512HDGL m.2 PCI-e, UWVA-IPS, 1920x1080, 15.60 | Lenovo ThinkPad P50 6820HQ, Quadro M2000M, Samsung SSD PM871 MZNLN256HCHP, IPS, 1920x1080, 15.60 | Dell Precision 3510 6700HQ, FirePro W5130M, Samsung SM951 MZVPV256HDGL m.2 PCI-e, TN LED, 1366x768, 15.60 | |
|---|---|---|---|---|---|
| Power Consumption | -103% | 5% | 21% | 36% | |
| Idle Minimum * | 7.7 | 23.9 -210% | 5.7 26% | 5.6 27% | 4.2 45% |
| Idle Average * | 11.8 | 28.9 -145% | 12.2 -3% | 8.6 27% | 6.5 45% |
| Idle Maximum * | 12.9 | 30 -133% | 12.6 2% | 9.3 28% | 7.1 45% |
| Load Average * | 90.2 | 95.2 -6% | 83.1 8% | 89.5 1% | 74.6 17% |
| Load Maximum * | 130.8 | 157.1 -20% | 138.2 -6% | 105 20% | 92.2 30% |
* ... smaller is better
| Fujitsu Celsius H760 E3-1505M v5, Quadro M2000M, 72 Wh | Dell Precision 7510 (4K IGZO) E3-1535M v5, Quadro M2000M, 91 Wh | HP ZBook 15 G3 E3-1505M v5, Quadro M2000M, 90 Wh | Lenovo ThinkPad P50 6820HQ, Quadro M2000M, 90 Wh | Dell Precision 3510 6700HQ, FirePro W5130M, 84 Wh | |
|---|---|---|---|---|---|
| Battery Runtime | -38% | 33% | 52% | 79% | |
| Reader / Idle | 557 | 268 -52% | 822 48% | 860 54% | 1168 110% |
| H.264 | 273 | 449 64% | 533 95% | 605 122% | |
| WiFi v1.3 | 333 | 239 -28% | 386 16% | 498 50% | 591 77% |
| Load | 106 | 70 -34% | 110 4% | 113 7% | 111 5% |
Pros
Cons
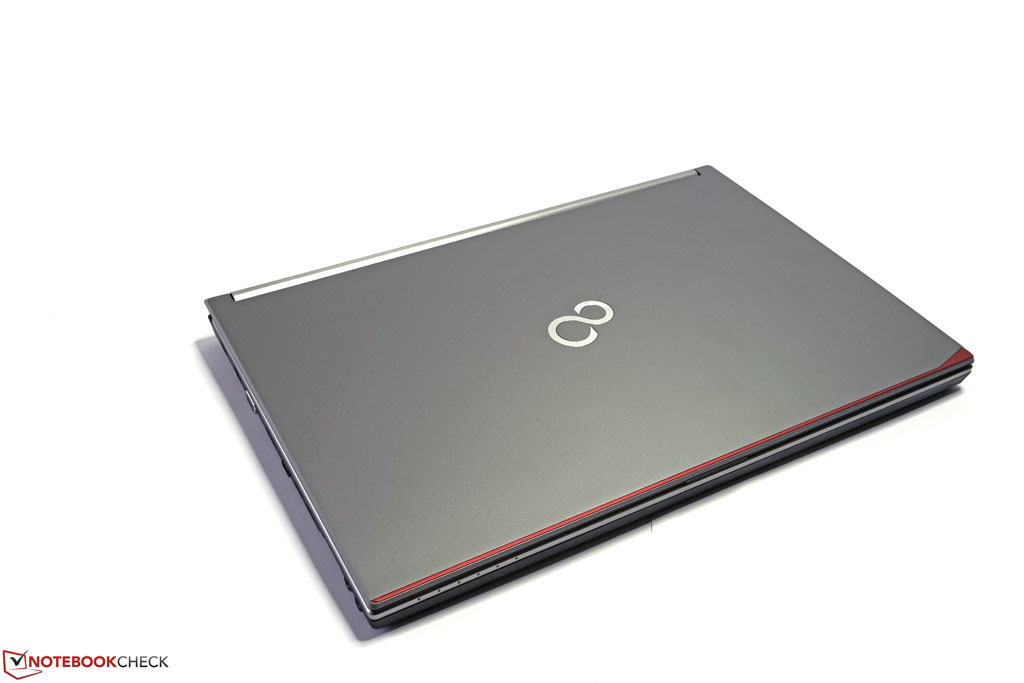
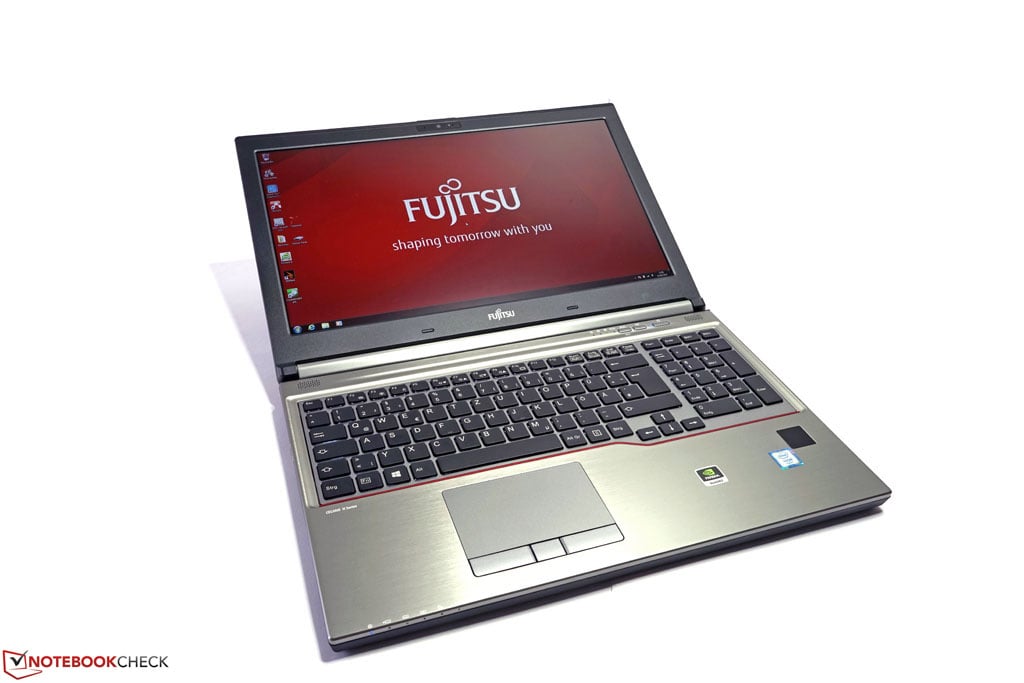
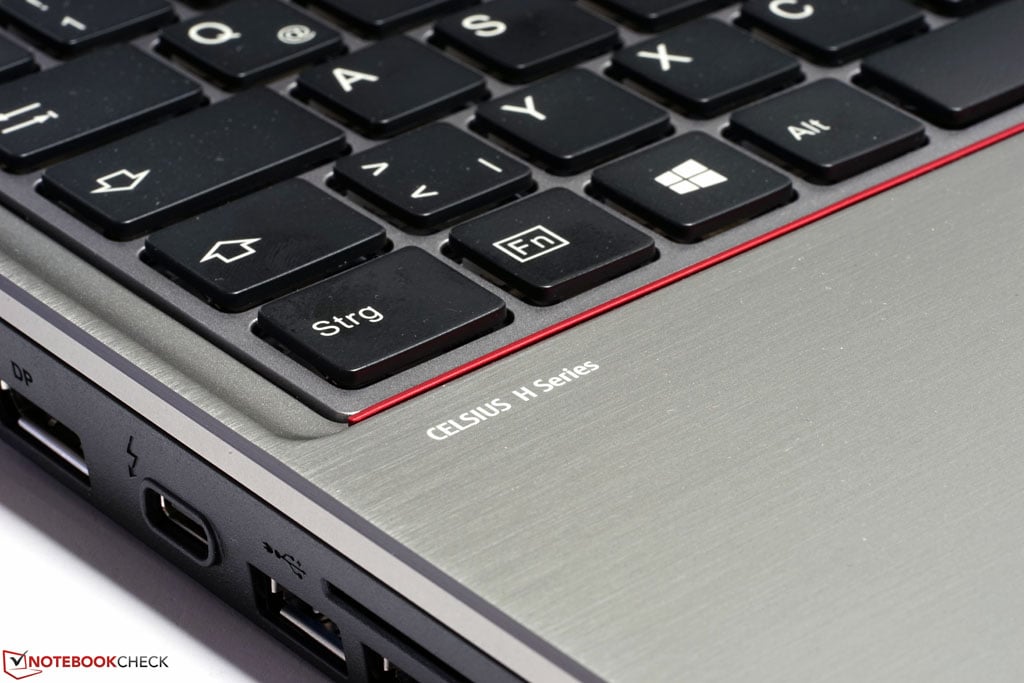
富士通Celsius H760是前代机型Celsius H740的改进版,它在各个方面都表现优秀。他的机身坚固优质,设计也看起来不差。
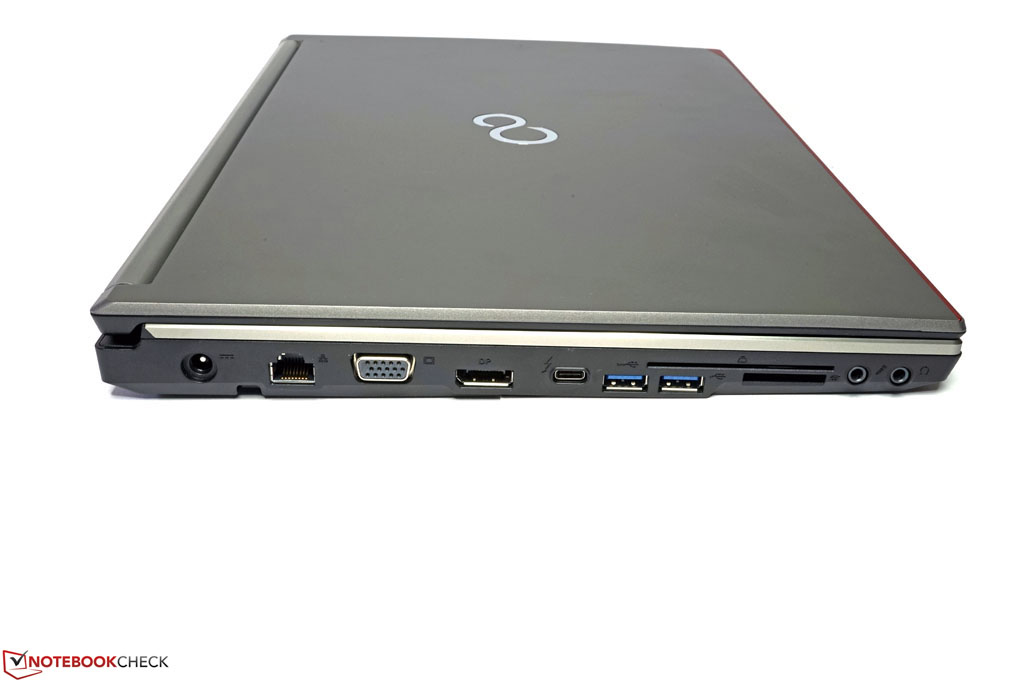
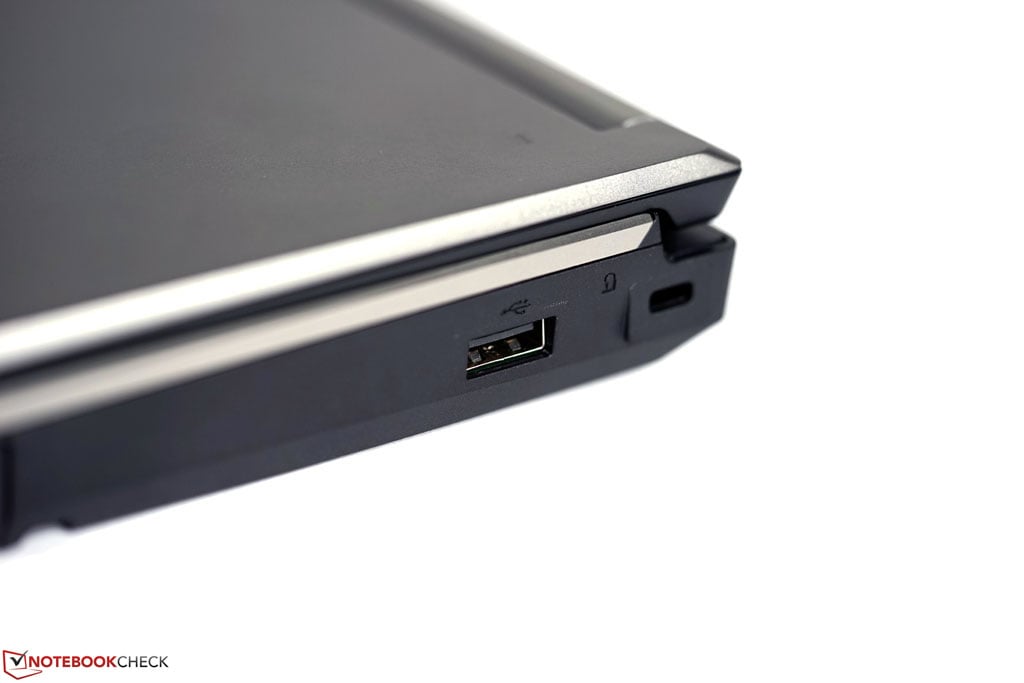
在实用性上,我们很喜欢它更新后的接口配备,丰富的配置组合和合理的性能水平。
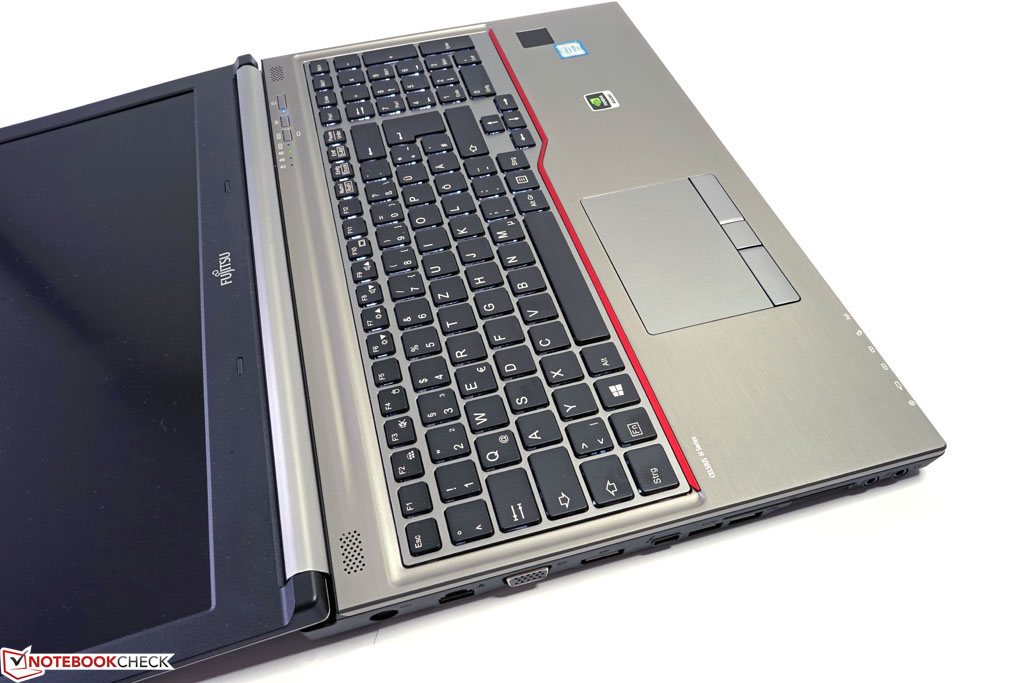
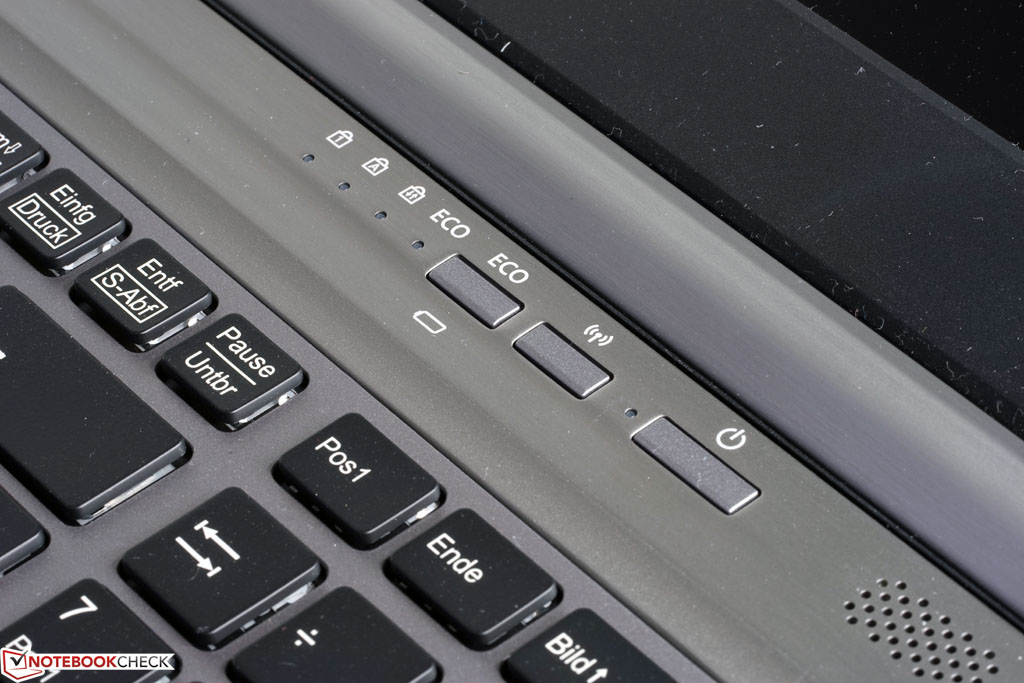
在工作站这类产品中,用户当然不希望为强劲性能而放弃常见的商务特性。它搭载了完备的安全功能,优秀的输入设备和可选质保和服务,这都让它更加全面。
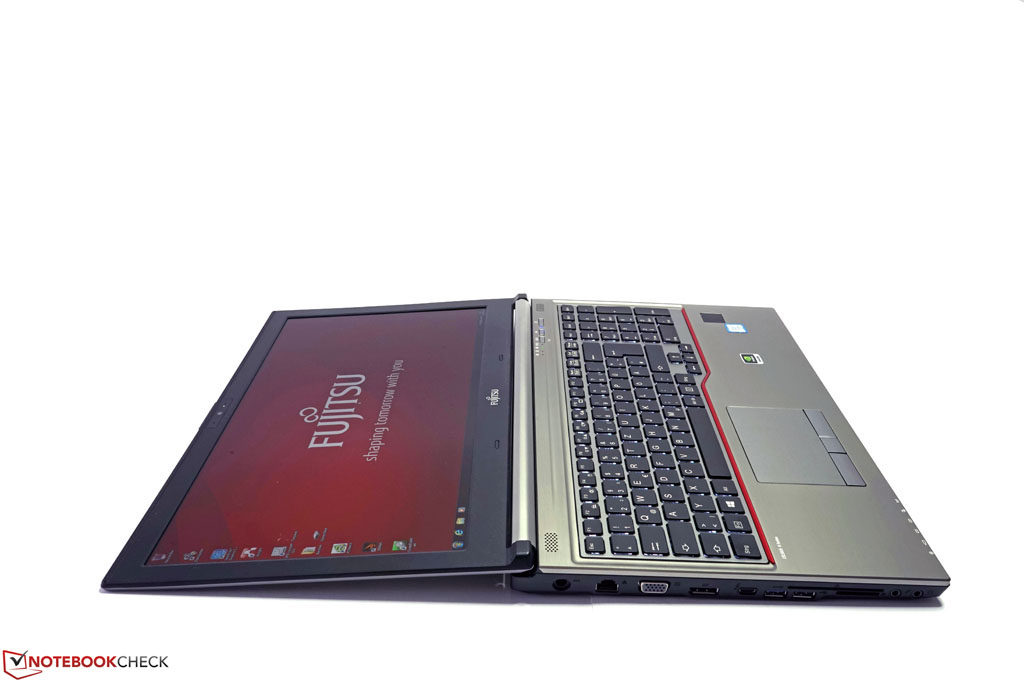
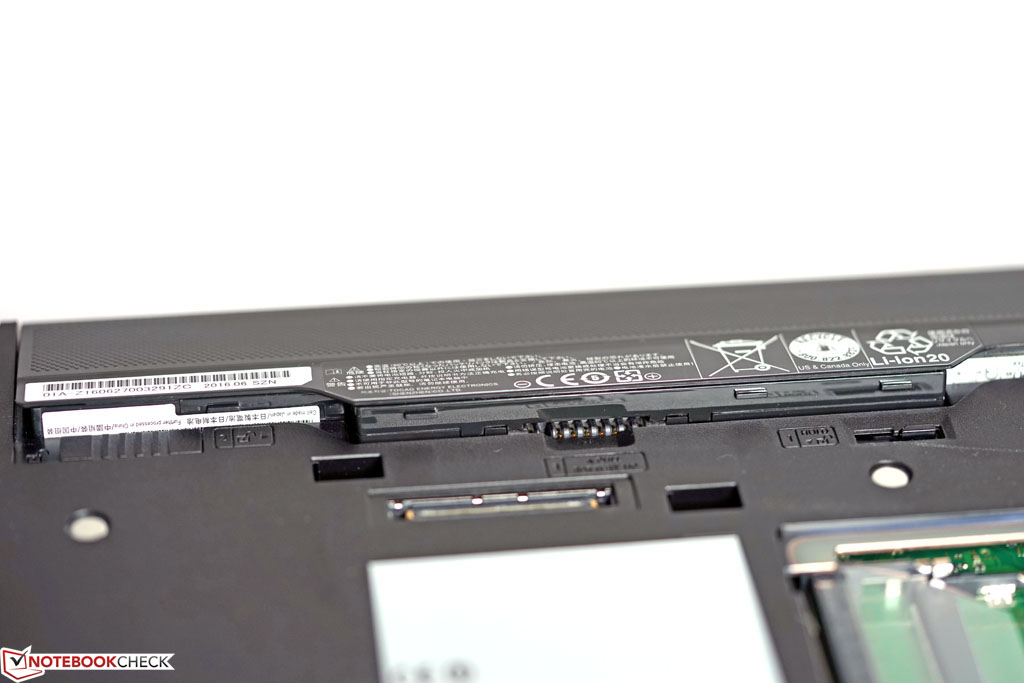
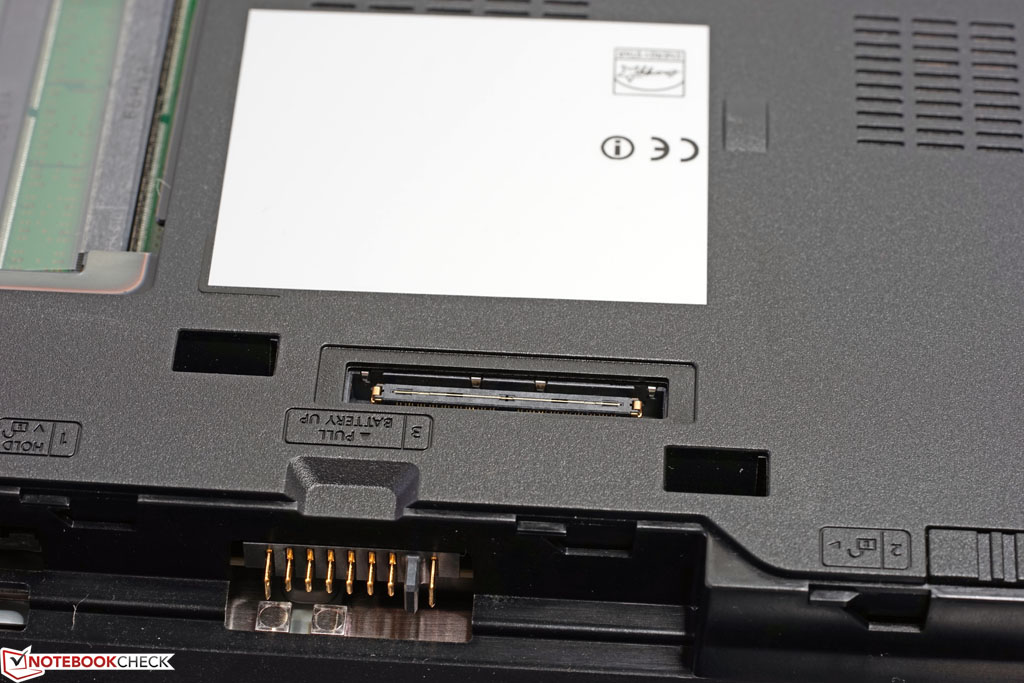
一项不显眼但十分重要的功能是内置的模块插槽。搭配不同的可选模块,它有了更高的灵活性,也可以与其他竞争对手有所区别。
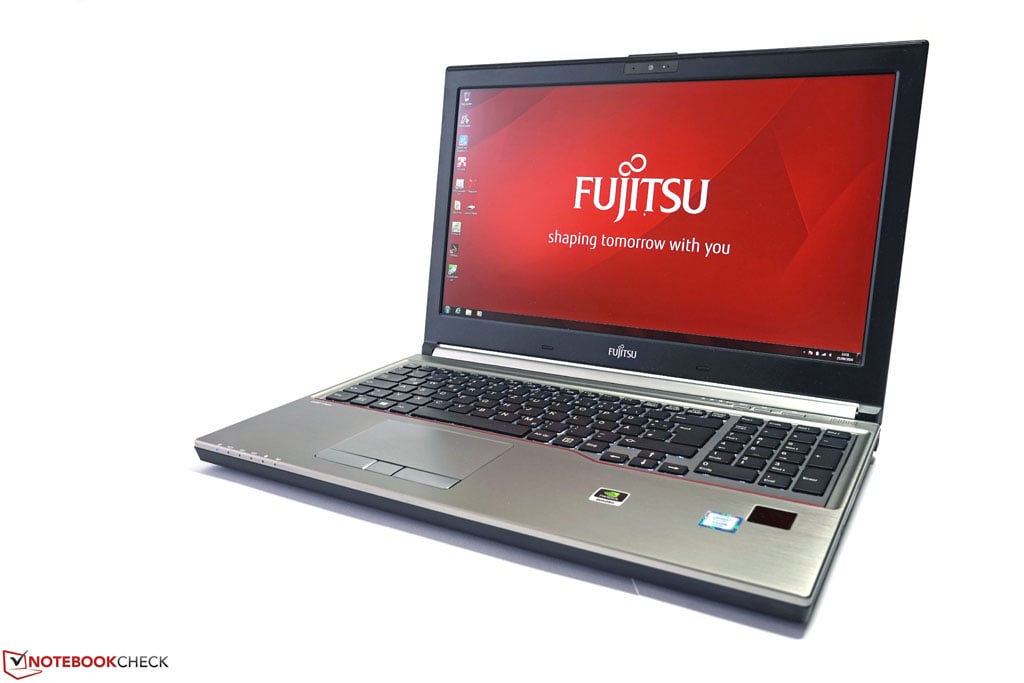
它的摄像头表现中规中矩,噪音在最高负载下较高,使用电池时性能会有所下降,这些你可能能勉强接受,但它最大的问题是全高清屏幕面板。尽管这是一块不错的宽视角IPS屏幕,但它很难达到这个价位的平均水平。它不够优秀的色域覆盖和色彩准确性,以及可见的像素网格都在一定程度上影响了优秀性能所带来的良好印象,也会影响需要准确色彩的一些专业用途。
整体上,富士通的Celsius H760移动工作站相比同类产品不乏独特之处,根据配置不同,它的定价也十分合理。
注:本文是基于完整评测的缩减版本,阅读完整的英文评测,请点击这里。
Fujitsu Celsius H760
-
10/12/2016 v5.1(old)
Tobias Winkler
Pricecompare
