 Deutsch
 English
 Español
 Français
 Italiano
 Nederlands
 Polski
 Português
 Русский
 Türkçe
 Svenska
 Chinese
 Magyar
微星 CX72-7QLi581 笔记本电脑简短评测
| SD Card Reader | |
| average JPG Copy Test (av. of 3 runs) | |
| Acer Aspire E5-774G-78NA | |
| Asus F756UX-T7013T | |
| MSI CX72-7QLi581 | |
| Lenovo IdeaPad 300-17ISK 80QH001EGE | |
| Acer TravelMate P278-MG-76L2 | |
| maximum AS SSD Seq Read Test (1GB) | |
| Acer Aspire E5-774G-78NA | |
| Asus F756UX-T7013T | |
| Acer TravelMate P278-MG-76L2 | |
| Lenovo IdeaPad 300-17ISK 80QH001EGE | |
| MSI CX72-7QLi581 | |
| Networking | |
| iperf Server (receive) TCP 1 m | |
| Acer Aspire E5-774G-78NA (seb) | |
| MSI CX72-7QLi581 (jseb) | |
| iperf Client (transmit) TCP 1 m | |
| Acer Aspire E5-774G-78NA (seb) | |
| MSI CX72-7QLi581 (jseb) | |
| |||||||||||||||||||||||||
Brightness Distribution: 77 %
Center on Battery: 268 cd/m²
Contrast: 273:1 (Black: 0.98 cd/m²)
ΔE Color 11.26 | 0.5-29.43 Ø5
ΔE Greyscale 12.45 | 0.57-98 Ø5.3
71% sRGB (Argyll 1.6.3 3D)
46% AdobeRGB 1998 (Argyll 1.6.3 3D)
52% AdobeRGB 1998 (Argyll 2.2.0 3D)
70.8% sRGB (Argyll 2.2.0 3D)
53% Display P3 (Argyll 2.2.0 3D)
Gamma: 2.03
| MSI CX72-7QLi581 TN LED, 1600x900, 17.30 | Acer Aspire E5-774G-78NA TN LED, 1920x1080, 17.30 | Asus F756UX-T7013T TN LED, 1920x1080, 17.30 | Acer TravelMate P278-MG-76L2 TN LED, 1920x1080, 17.30 | Lenovo IdeaPad 300-17ISK 80QH001EGE TN LED, 1600x900, 17.30 | |
|---|---|---|---|---|---|
| Display | 34% | 26% | 29% | 3% | |
| Display P3 Coverage | 53 | 72.3 36% | 63.9 21% | 68.8 30% | 52.4 -1% |
| sRGB Coverage | 70.8 | 94.8 34% | 93.7 32% | 90.6 28% | 76.1 7% |
| AdobeRGB 1998 Coverage | 52 | 69.3 33% | 64.6 24% | 66.3 28% | 54.2 4% |
| Response Times | 637% | 639% | 638% | 3% | |
| Response Time Grey 50% / Grey 80% * | 43 ? | 43 ? -0% | 42 ? 2% | 41 ? 5% | 42 ? 2% |
| Response Time Black / White * | 25 ? | 22 ? 12% | 21 ? 16% | 23 ? 8% | 24 ? 4% |
| PWM Frequency | 50 ? | 1000 ? 1900% | 1000 ? 1900% | 1000 ? 1900% | |
| Screen | 46% | 73% | 35% | 12% | |
| Brightness middle | 268 | 320 19% | 268 0% | 362 35% | 205 -24% |
| Brightness | 262 | 302 15% | 255 -3% | 344 31% | 182 -31% |
| Brightness Distribution | 77 | 86 12% | 83 8% | 84 9% | 77 0% |
| Black Level * | 0.98 | 0.4 59% | 0.17 83% | 0.57 42% | 0.43 56% |
| Contrast | 273 | 800 193% | 1576 477% | 635 133% | 477 75% |
| Colorchecker dE 2000 * | 11.26 | 7.78 31% | 7.18 36% | 9.54 15% | 9.75 13% |
| Colorchecker dE 2000 max. * | 17.88 | 12.74 29% | 11.67 35% | 16.11 10% | 16.02 10% |
| Greyscale dE 2000 * | 12.45 | 8.87 29% | 7.97 36% | 10.39 17% | 12.09 3% |
| Gamma | 2.03 108% | 2.27 97% | 2.34 94% | 2.55 86% | 2.62 84% |
| CCT | 12273 53% | 8979 72% | 8541 76% | 11093 59% | 12875 50% |
| Color Space (Percent of AdobeRGB 1998) | 46 | 62 35% | 59 28% | 59 28% | 49 7% |
| Color Space (Percent of sRGB) | 71 | 95 34% | 94 32% | 90 27% | 76 7% |
| Total Average (Program / Settings) | 239% /
154% | 246% /
170% | 234% /
147% | 6% /
9% |
* ... smaller is better
Screen Flickering / PWM (Pulse-Width Modulation)
| Screen flickering / PWM detected | 50 Hz | ≤ 50 % brightness setting | 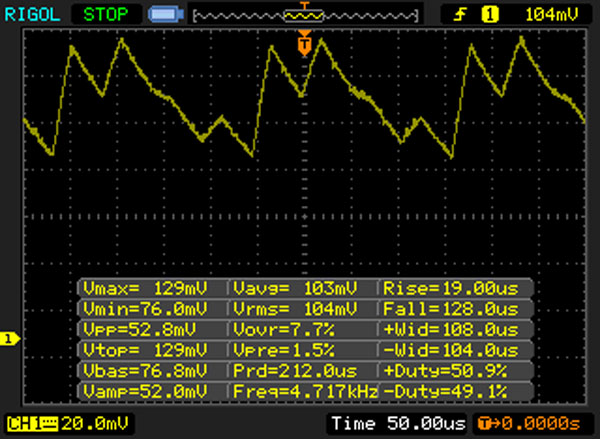 |
The display backlight flickers at 50 Hz (worst case, e.g., utilizing PWM) Flickering detected at a brightness setting of 50 % and below. There should be no flickering or PWM above this brightness setting. The frequency of 50 Hz is very low, so the flickering may cause eyestrain and headaches after extended use. In comparison: 53 % of all tested devices do not use PWM to dim the display. If PWM was detected, an average of 17900 (minimum: 5 - maximum: 3846000) Hz was measured. | |||
Display Response Times
| ↔ Response Time Black to White | ||
|---|---|---|
| 25 ms ... rise ↗ and fall ↘ combined | ↗ 7 ms rise | 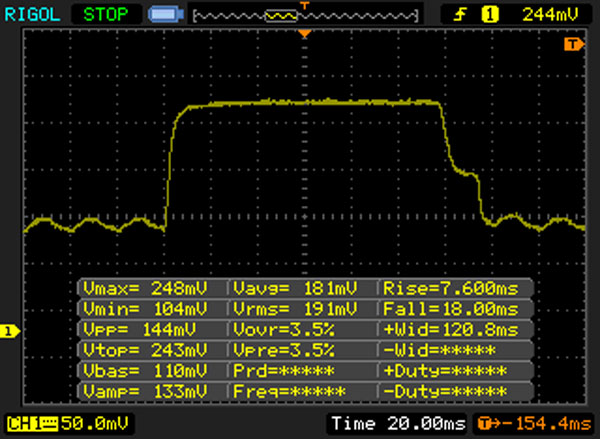 |
| ↘ 18 ms fall | ||
| The screen shows relatively slow response rates in our tests and may be too slow for gamers. In comparison, all tested devices range from 0.1 (minimum) to 240 (maximum) ms. » 53 % of all devices are better. This means that the measured response time is worse than the average of all tested devices (21.5 ms). | ||
| ↔ Response Time 50% Grey to 80% Grey | ||
| 43 ms ... rise ↗ and fall ↘ combined | ↗ 22 ms rise | 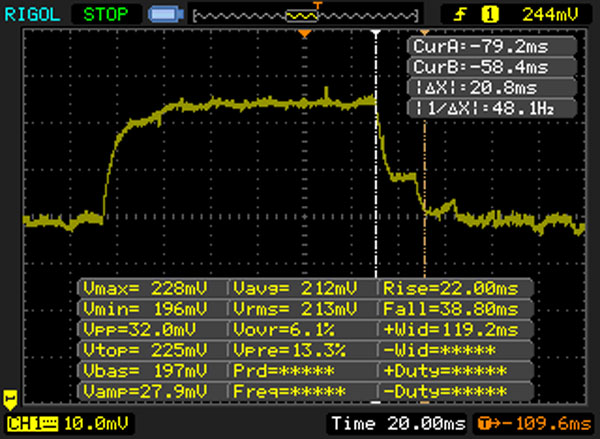 |
| ↘ 21 ms fall | ||
| The screen shows slow response rates in our tests and will be unsatisfactory for gamers. In comparison, all tested devices range from 0.2 (minimum) to 636 (maximum) ms. » 67 % of all devices are better. This means that the measured response time is worse than the average of all tested devices (33.7 ms). | ||
| Cinebench R15 | |
| CPU Single 64Bit | |
| Acer Aspire E5-774G-78NA | |
| Acer TravelMate P278-MG-76L2 | |
| MSI CX72-7QLi581 | |
| Lenovo IdeaPad 300-17ISK 80QH001EGE | |
| Asus F756UX-T7013T | |
| CPU Multi 64Bit | |
| MSI CX72-7QLi581 | |
| Acer Aspire E5-774G-78NA | |
| Acer TravelMate P278-MG-76L2 | |
| Lenovo IdeaPad 300-17ISK 80QH001EGE | |
| Asus F756UX-T7013T | |
| Geekbench 3 | |
| 32 Bit Single-Core Score | |
| Acer Aspire E5-774G-78NA | |
| MSI CX72-7QLi581 | |
| Lenovo IdeaPad 300-17ISK 80QH001EGE | |
| 32 Bit Multi-Core Score | |
| Acer Aspire E5-774G-78NA | |
| MSI CX72-7QLi581 | |
| Lenovo IdeaPad 300-17ISK 80QH001EGE | |
| Geekbench 4.0 | |
| 64 Bit Single-Core Score | |
| MSI CX72-7QLi581 | |
| 64 Bit Multi-Core Score | |
| MSI CX72-7QLi581 | |
| JetStream 1.1 - Total Score | |
| Acer Aspire E5-774G-78NA | |
| MSI CX72-7QLi581 | |
| Lenovo IdeaPad 300-17ISK 80QH001EGE | |
| Acer TravelMate P278-MG-76L2 | |
| PCMark 8 Home Score Accelerated v2 | 3586 points | |
Help | ||
| PCMark 8 - Home Score Accelerated v2 | |
| Acer Aspire E5-774G-78NA | |
| MSI CX72-7QLi581 | |
| Acer TravelMate P278-MG-76L2 | |
| Lenovo IdeaPad 300-17ISK 80QH001EGE | |
| Asus F756UX-T7013T | |

| MSI CX72-7QLi581 WDC Scorpio Blue WD10JPVX-22JC3T0 | Acer Aspire E5-774G-78NA Lite-On CV1-8B256 | Asus F756UX-T7013T HGST Travelstar 5K1000 HTS541010A9E680 | Acer TravelMate P278-MG-76L2 Lite-On CV1-8B256 | Lenovo IdeaPad 300-17ISK 80QH001EGE Toshiba MQ01ABD100 | |
|---|---|---|---|---|---|
| CrystalDiskMark 3.0 | 9146% | -6% | 7900% | -17% | |
| Read Seq | 102.8 | 520 406% | 105.8 3% | 473 360% | 100.6 -2% |
| Write Seq | 100.2 | 332.8 232% | 105 5% | 366.3 266% | 96.3 -4% |
| Read 512 | 34.83 | 382.8 999% | 33.33 -4% | 329.4 846% | 28.15 -19% |
| Write 512 | 46.87 | 357.7 663% | 39.12 -17% | 357.3 662% | 43.34 -8% |
| Read 4k | 0.422 | 32.31 7556% | 0.413 -2% | 30.83 7206% | 0.312 -26% |
| Write 4k | 1.063 | 85.1 7906% | 0.947 -11% | 74.8 6937% | 0.792 -25% |
| Read 4k QD32 | 0.918 | 277.7 30151% | 0.812 -12% | 245.1 26599% | 0.708 -23% |
| Write 4k QD32 | 1.064 | 269.8 25257% | 0.968 -9% | 217.3 20323% | 0.764 -28% |
| 3DMark 11 Performance | 2508 points | |
Help | ||
| 3DMark 11 - 1280x720 Performance GPU | |
| Asus F756UX-T7013T | |
| Acer Aspire E5-774G-78NA | |
| MSI CX72-7QLi581 | |
| Acer TravelMate P278-MG-76L2 | |
| Lenovo IdeaPad 300-17ISK 80QH001EGE | |
| low | med. | high | ultra | |
| BioShock Infinite (2013) | 99.9 | 53.8 | 45 | |
| Call of Duty Infinite Warfare (2016) | 37.6 | 34.4 | 17.8 | |
| Dishonored 2 (2016) | 18 | 14.7 |
Noise Level
| Idle |
| 30.9 / 30.9 / 30.9 dB(A) |
| HDD |
| 31.4 dB(A) |
| DVD |
| 36.3 / dB(A) |
| Load |
| 34 / 34.2 dB(A) |
 | ||
30 dB silent 40 dB(A) audible 50 dB(A) loud |
||
min: | ||
(±) The maximum temperature on the upper side is 40.1 °C / 104 F, compared to the average of 36.9 °C / 98 F, ranging from 21.1 to 71 °C for the class Multimedia.
(+) The bottom heats up to a maximum of 36.6 °C / 98 F, compared to the average of 39.1 °C / 102 F
(+) In idle usage, the average temperature for the upper side is 25.2 °C / 77 F, compared to the device average of 31.2 °C / 88 F.
(+) The palmrests and touchpad are cooler than skin temperature with a maximum of 31.7 °C / 89.1 F and are therefore cool to the touch.
(-) The average temperature of the palmrest area of similar devices was 28.8 °C / 83.8 F (-2.9 °C / -5.3 F).
Apple MacBook 12 (Early 2016) 1.1 GHz audio analysis
(+) | speakers can play relatively loud (83.6 dB)
Bass 100 - 315 Hz
(±) | reduced bass - on average 11.3% lower than median
(±) | linearity of bass is average (14.2% delta to prev. frequency)
Mids 400 - 2000 Hz
(+) | balanced mids - only 2.4% away from median
(+) | mids are linear (5.5% delta to prev. frequency)
Highs 2 - 16 kHz
(+) | balanced highs - only 2% away from median
(+) | highs are linear (4.5% delta to prev. frequency)
Overall 100 - 16.000 Hz
(+) | overall sound is linear (10.2% difference to median)
Compared to same class
» 5% of all tested devices in this class were better, 2% similar, 93% worse
» The best had a delta of 5%, average was 19%, worst was 53%
Compared to all devices tested
» 3% of all tested devices were better, 1% similar, 96% worse
» The best had a delta of 4%, average was 25%, worst was 134%
| Off / Standby | |
| Idle | |
| Load |
|
| Battery Runtime - WiFi Websurfing | |
| Lenovo IdeaPad 300-17ISK 80QH001EGE | |
| Acer Aspire E5-774G-78NA | |
| Acer TravelMate P278-MG-76L2 | |
| MSI CX72-7QLi581 | |
| Asus F756UX-T7013T | |
Pros
Cons
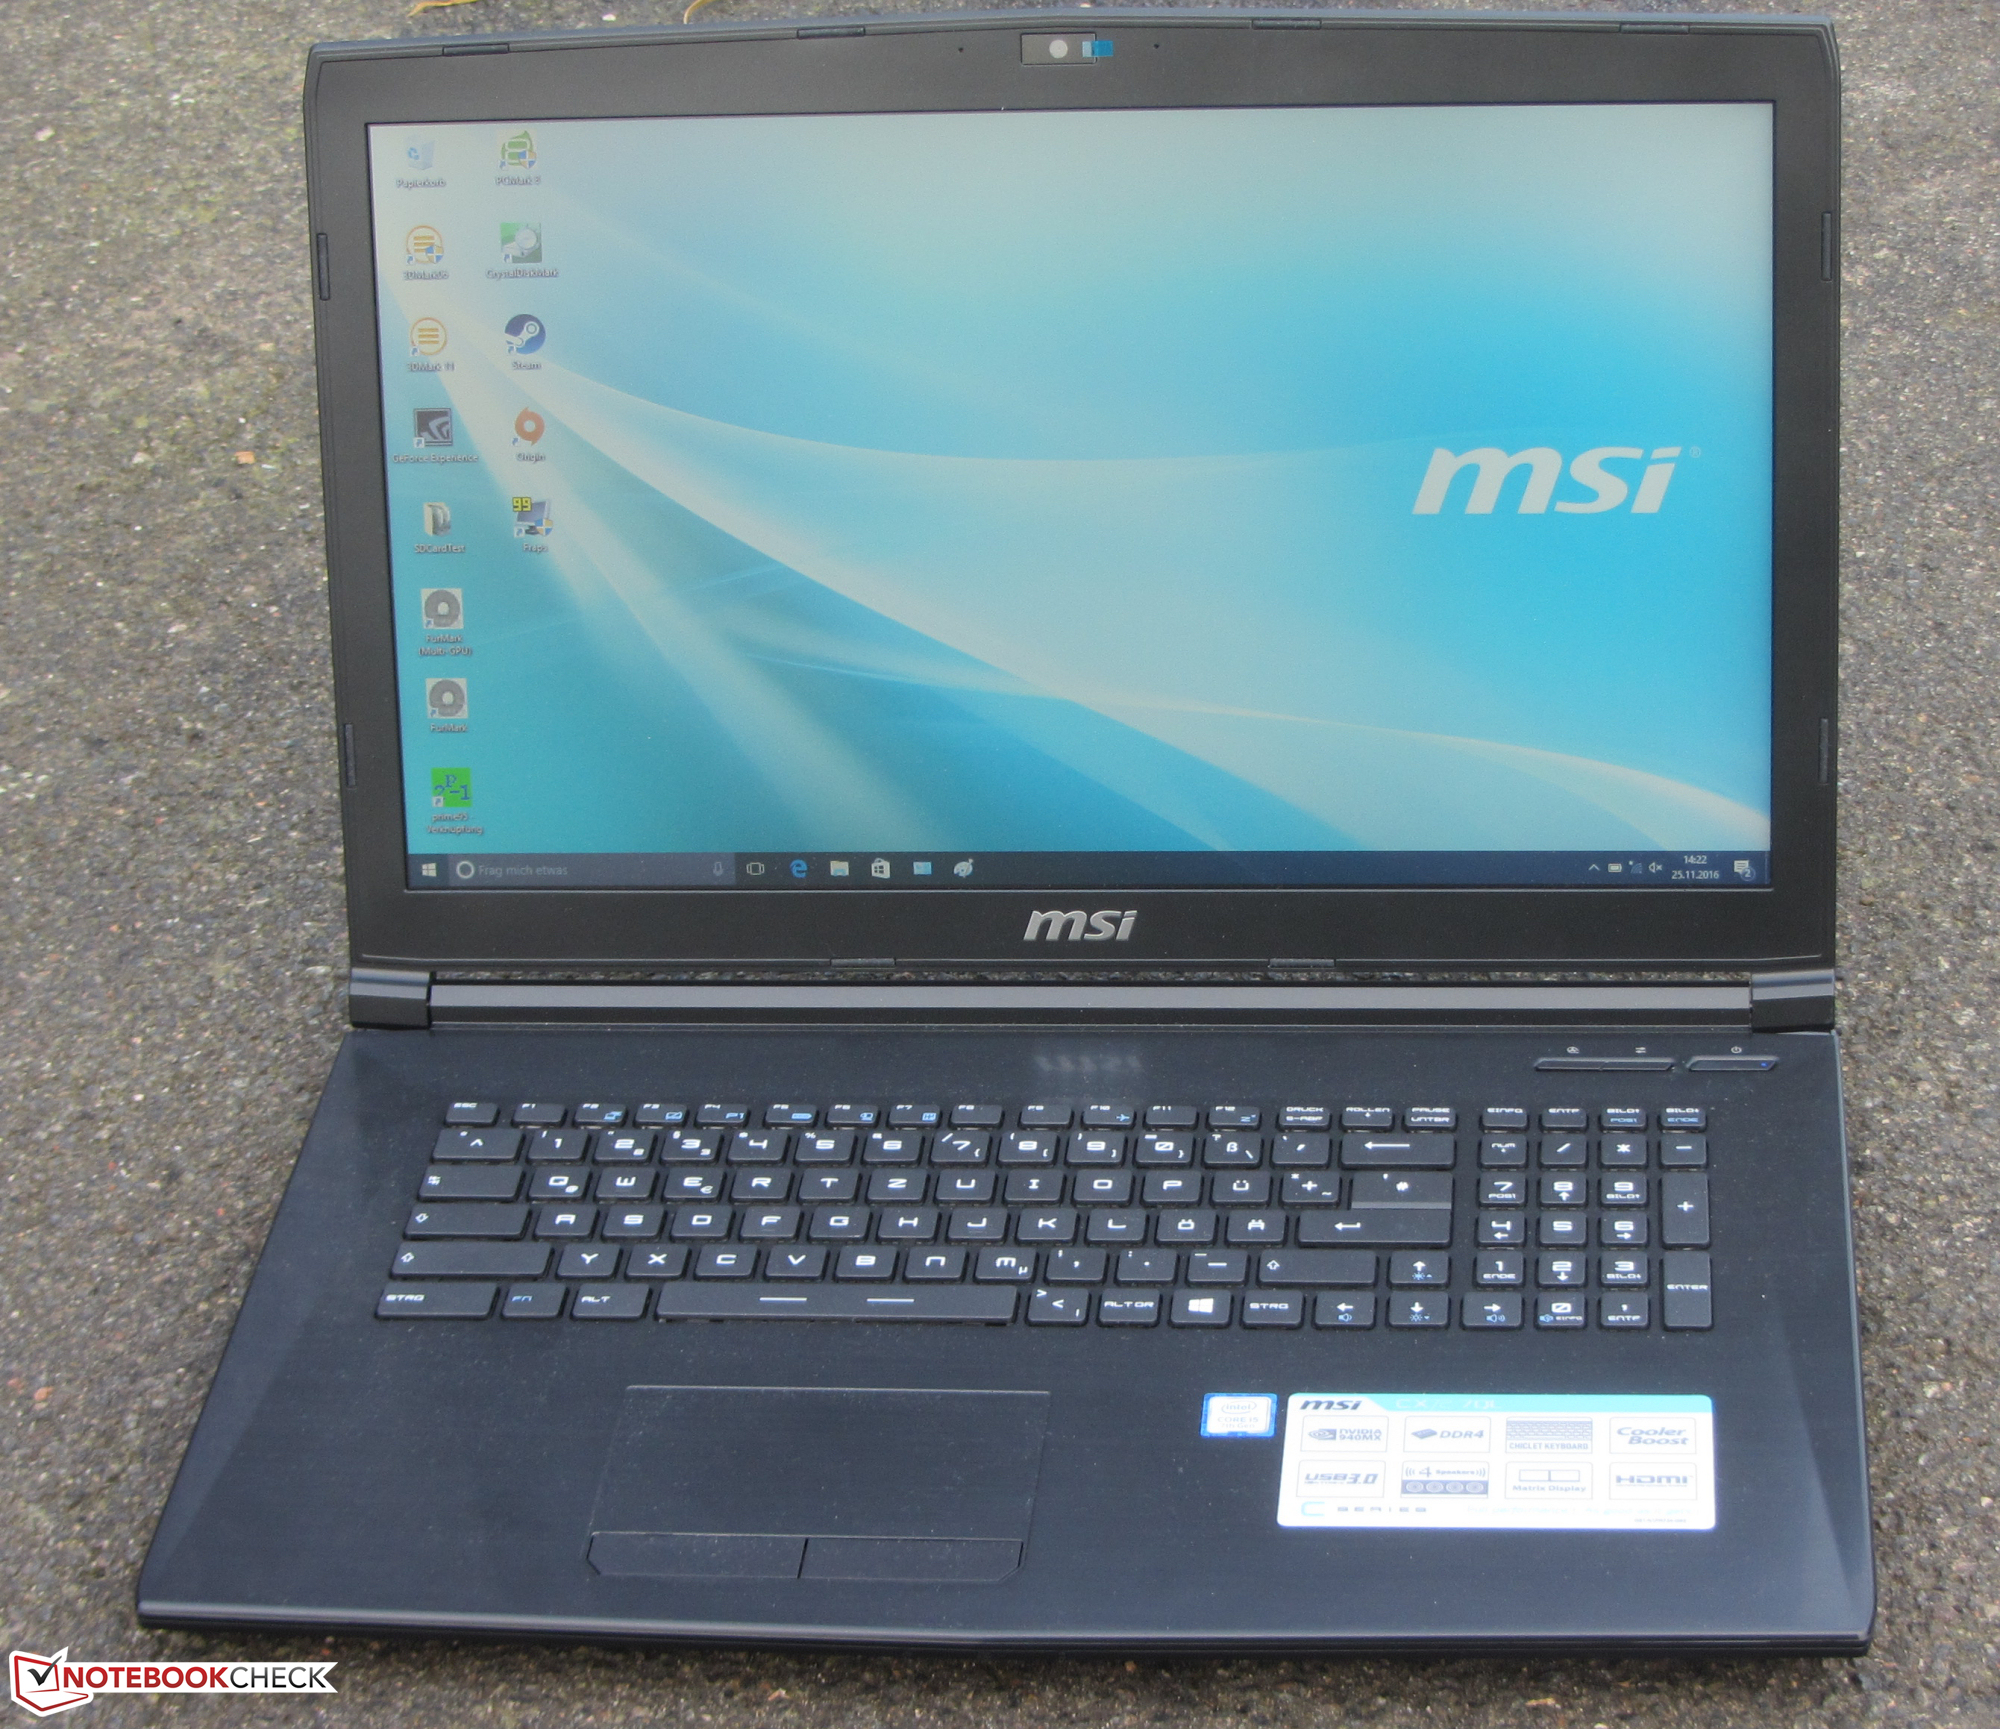
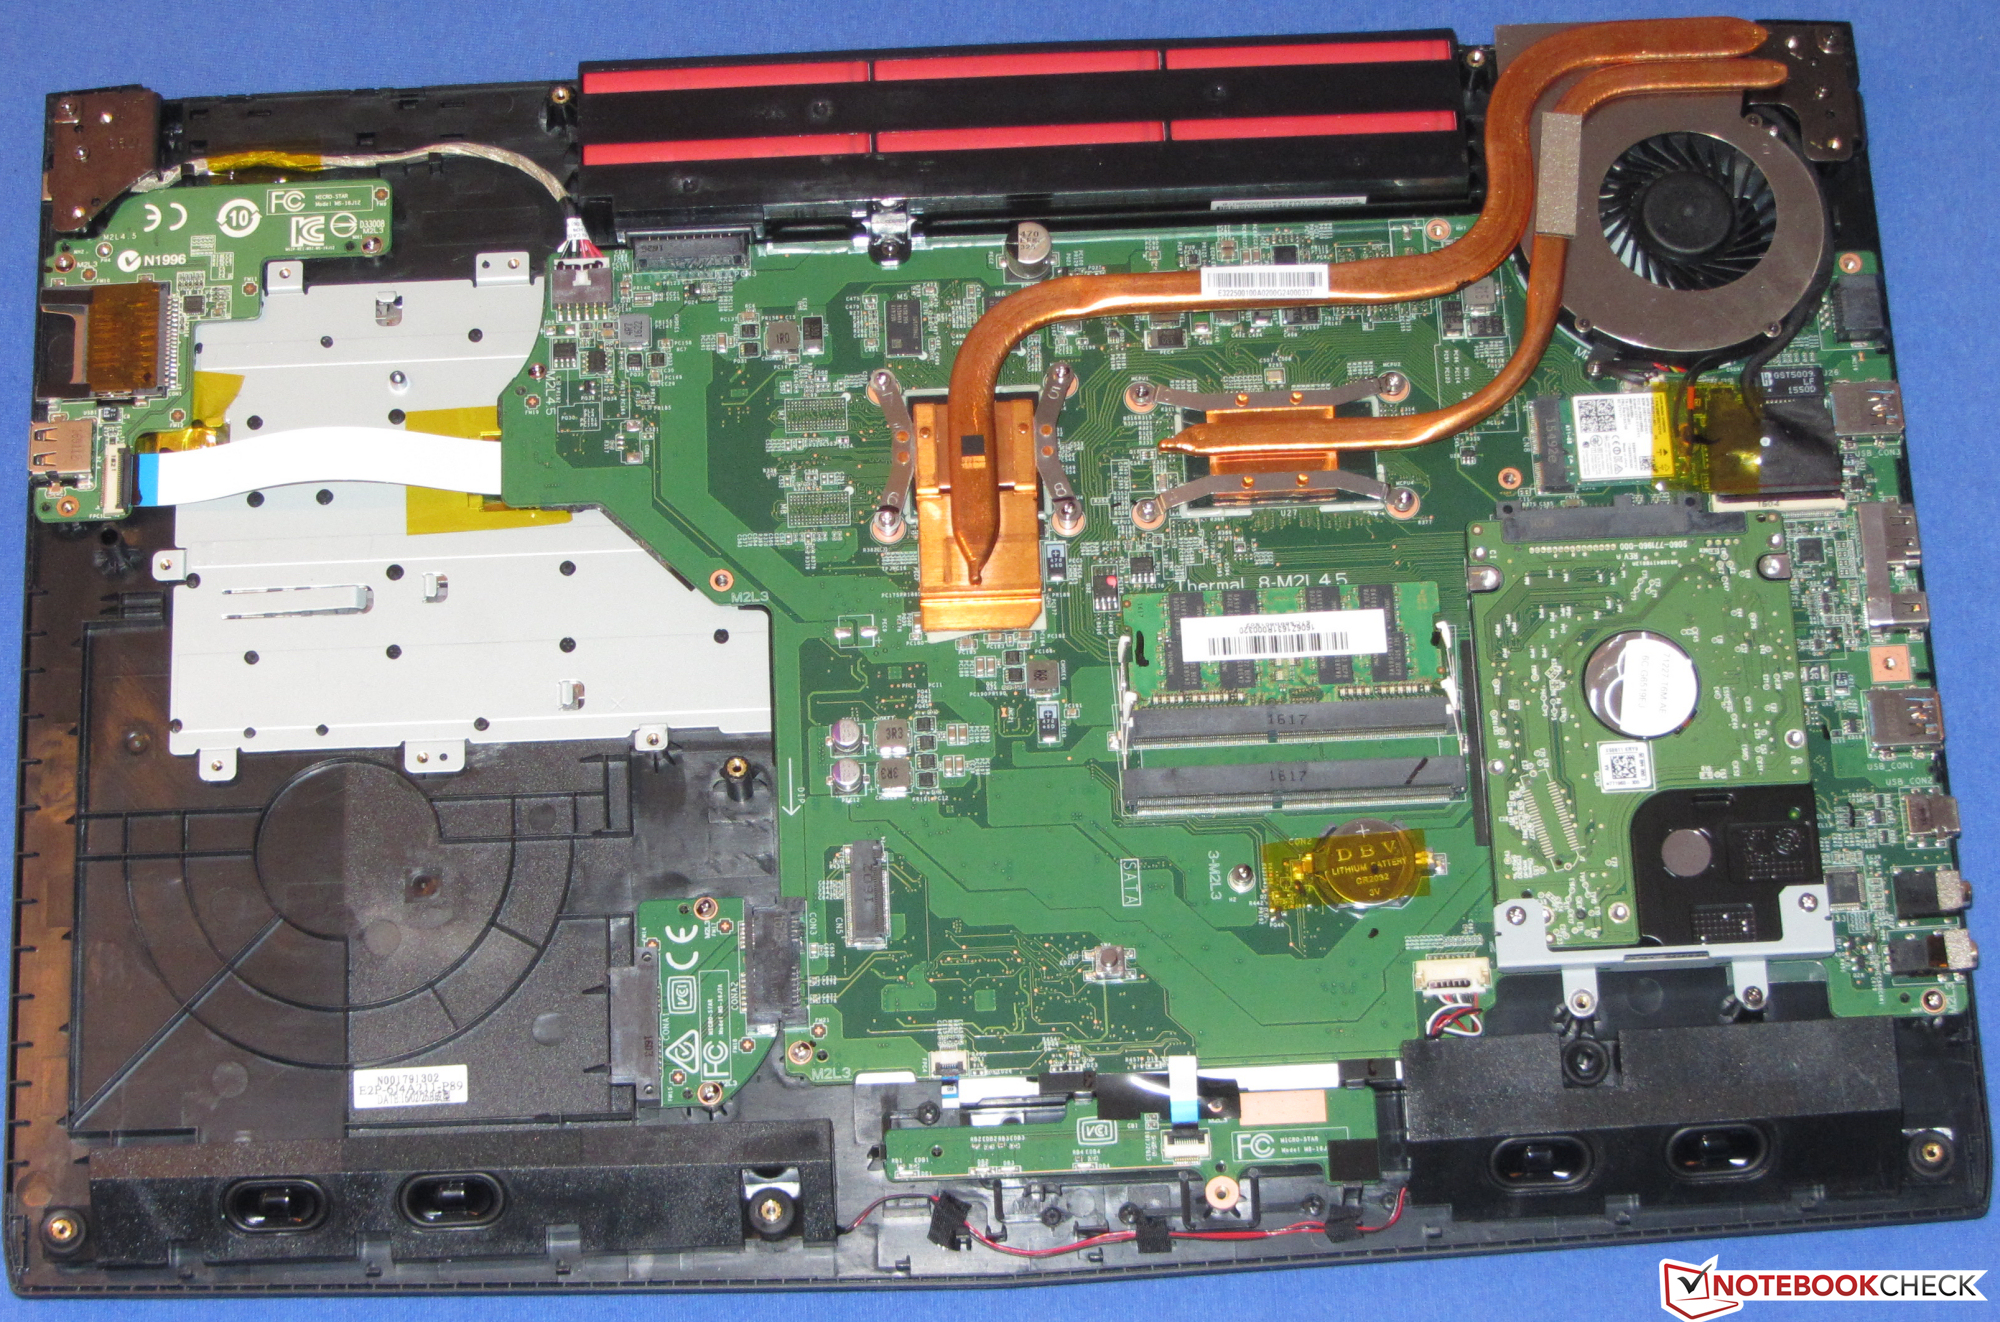
微星CX72-7QLi581是一台为家庭办公用途设计的笔记本电脑。它提供了足以应对日常用途和简单游戏的性能,在运行中也十分安静,不会变得很烫。另外,这台笔记本电脑搭配了1TB硬盘,并可以通过M.2 2280插槽增加一块固态硬盘。由于底盖上设计有维护窗口,升级所需的操作也十分简单。它的键盘可以出色地满足家庭使用需要,电池续航也还不错。我们不太满意的是它的HD+屏幕,它的亮度和对比度都较低。
微星CX72-7QLi581是一台优秀的17.3寸全能型家用设备。这台机型没有突出的优势,但也没有重大的缺陷。
我们最近测试的宏碁 Aspire E5-774G也是一个不错的备选方案。E5-774G-553R机型售价800欧元(约5873人民币),搭配1TB机械硬盘和一块固态硬盘。它提供了更优秀的全高清屏幕以及更强劲的GDDR5版本GeForce 940MX显卡。
注:本文是基于完整评测的缩减版本,阅读完整的英文评测,请点击这里。
MSI CX72-7QLi581
-
11/26/2016 v5.1(old)
Sascha Mölck