 Deutsch
 English
 Español
 Français
 Italiano
 Nederlands
 Polski
 Português
 Русский
 Türkçe
 Svenska
 Chinese
 Magyar
雷蛇 Blade (2016) 笔记本电脑简短评测
| Networking | |
| iperf3 transmit AX12 | |
| Razer Blade (2016) | |
| iperf3 receive AX12 | |
| Razer Blade (2016) | |
| |||||||||||||||||||||||||
Brightness Distribution: 69 %
Center on Battery: 328 cd/m²
Contrast: 1491:1 (Black: 0.22 cd/m²)
ΔE Color 1.91 | 0.5-29.43 Ø5
ΔE Greyscale 1.69 | 0.57-98 Ø5.3
97% sRGB (Argyll 1.6.3 3D)
63% AdobeRGB 1998 (Argyll 1.6.3 3D)
68.2% AdobeRGB 1998 (Argyll 2.2.0 3D)
96.8% sRGB (Argyll 2.2.0 3D)
66.9% Display P3 (Argyll 2.2.0 3D)
Gamma: 2.3
| Razer Blade (2016) Sharp LQ140Z1JW01 (SHP1401), IGZO, 3200x1800, 14.00 | SCHENKER XMG P406 LG Philips 140WF1 (LGD040A), IPS, 1920x1080, 14.00 | MSI GS43VR 6RE-006US Name: LG Philips LP140WF3-SPD1, ID: LGD046D, IPS, 1920x1080, 14.00 | Asus Strix GL502VS-FY032T LG Philips LP156WF6-SPB6 (LGD046F), IPS, 1920x1080, 15.60 | |
|---|---|---|---|---|
| Display | -9% | -7% | -10% | |
| Display P3 Coverage | 66.9 | 66.2 -1% | 65.5 -2% | 64.5 -4% |
| sRGB Coverage | 96.8 | 82.8 -14% | 86.4 -11% | 83.1 -14% |
| AdobeRGB 1998 Coverage | 68.2 | 60.5 -11% | 63.1 -7% | 60.8 -11% |
| Response Times | -9% | 29% | 23% | |
| Response Time Grey 50% / Grey 80% * | 41 ? | 56 ? -37% | 31.6 ? 23% | 38 ? 7% |
| Response Time Black / White * | 37 ? | 30 ? 19% | 24.4 ? 34% | 23 ? 38% |
| PWM Frequency | 200 ? | |||
| Screen | -58% | -27% | -58% | |
| Brightness middle | 328 | 282 -14% | 288.4 -12% | 315 -4% |
| Brightness | 328 | 266 -19% | 282 -14% | 290 -12% |
| Brightness Distribution | 69 | 81 17% | 83 20% | 85 23% |
| Black Level * | 0.22 | 0.22 -0% | 0.35 -59% | 0.32 -45% |
| Contrast | 1491 | 1282 -14% | 824 -45% | 984 -34% |
| Colorchecker dE 2000 * | 1.91 | 4.98 -161% | 2.61 -37% | 4.88 -155% |
| Colorchecker dE 2000 max. * | 3.23 | 10.2 -216% | 7.34 -127% | 8.88 -175% |
| Greyscale dE 2000 * | 1.69 | 4.08 -141% | 1.18 30% | 4.17 -147% |
| Gamma | 2.3 96% | 2.51 88% | 2.24 98% | 2.53 87% |
| CCT | 6418 101% | 5877 111% | 6506 100% | 6683 97% |
| Color Space (Percent of AdobeRGB 1998) | 63 | 54 -14% | 56.4 -10% | 55 -13% |
| Color Space (Percent of sRGB) | 97 | 83 -14% | 86.4 -11% | 83 -14% |
| Total Average (Program / Settings) | -25% /
-41% | -2% /
-15% | -15% /
-37% |
* ... smaller is better
Display Response Times
| ↔ Response Time Black to White | ||
|---|---|---|
| 37 ms ... rise ↗ and fall ↘ combined | ↗ 9 ms rise | 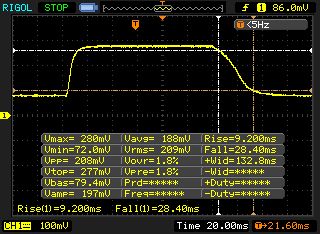 |
| ↘ 28 ms fall | ||
| The screen shows slow response rates in our tests and will be unsatisfactory for gamers. In comparison, all tested devices range from 0.1 (minimum) to 240 (maximum) ms. » 94 % of all devices are better. This means that the measured response time is worse than the average of all tested devices (21.5 ms). | ||
| ↔ Response Time 50% Grey to 80% Grey | ||
| 41 ms ... rise ↗ and fall ↘ combined | ↗ 15 ms rise | 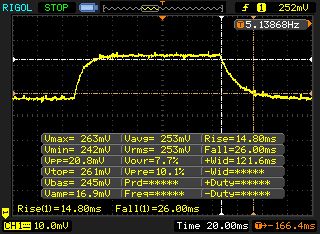 |
| ↘ 26 ms fall | ||
| The screen shows slow response rates in our tests and will be unsatisfactory for gamers. In comparison, all tested devices range from 0.2 (minimum) to 636 (maximum) ms. » 60 % of all devices are better. This means that the measured response time is worse than the average of all tested devices (33.7 ms). | ||
Screen Flickering / PWM (Pulse-Width Modulation)
| Screen flickering / PWM detected | 200 Hz | ≤ 90 % brightness setting | 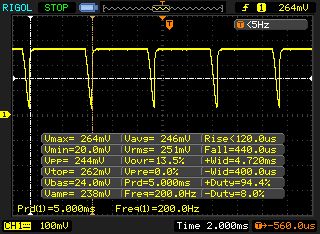 |
The display backlight flickers at 200 Hz (worst case, e.g., utilizing PWM) Flickering detected at a brightness setting of 90 % and below. There should be no flickering or PWM above this brightness setting. The frequency of 200 Hz is relatively low, so sensitive users will likely notice flickering and experience eyestrain at the stated brightness setting and below. In comparison: 53 % of all tested devices do not use PWM to dim the display. If PWM was detected, an average of 17924 (minimum: 5 - maximum: 3846000) Hz was measured. | |||
| Cinebench R15 | |
| CPU Single 64Bit | |
| Asus Strix GL502VS-FY032T | |
| Razer Blade (2016) | |
| SCHENKER XMG P406 | |
| MSI GS43VR 6RE-006US | |
| CPU Multi 64Bit | |
| SCHENKER XMG P406 | |
| Asus Strix GL502VS-FY032T | |
| MSI GS43VR 6RE-006US | |
| Razer Blade (2016) | |
| PCMark 8 | |
| Home Score Accelerated v2 | |
| Asus Strix GL502VS-FY032T | |
| MSI GS43VR 6RE-006US | |
| Razer Blade (2016) | |
| SCHENKER XMG P406 | |
| Work Score Accelerated v2 | |
| SCHENKER XMG P406 | |
| Asus Strix GL502VS-FY032T | |
| MSI GS43VR 6RE-006US | |
| Razer Blade (2016) | |
| PCMark 8 Home Score Accelerated v2 | 3417 points | |
| PCMark 8 Work Score Accelerated v2 | 4214 points | |
Help | ||
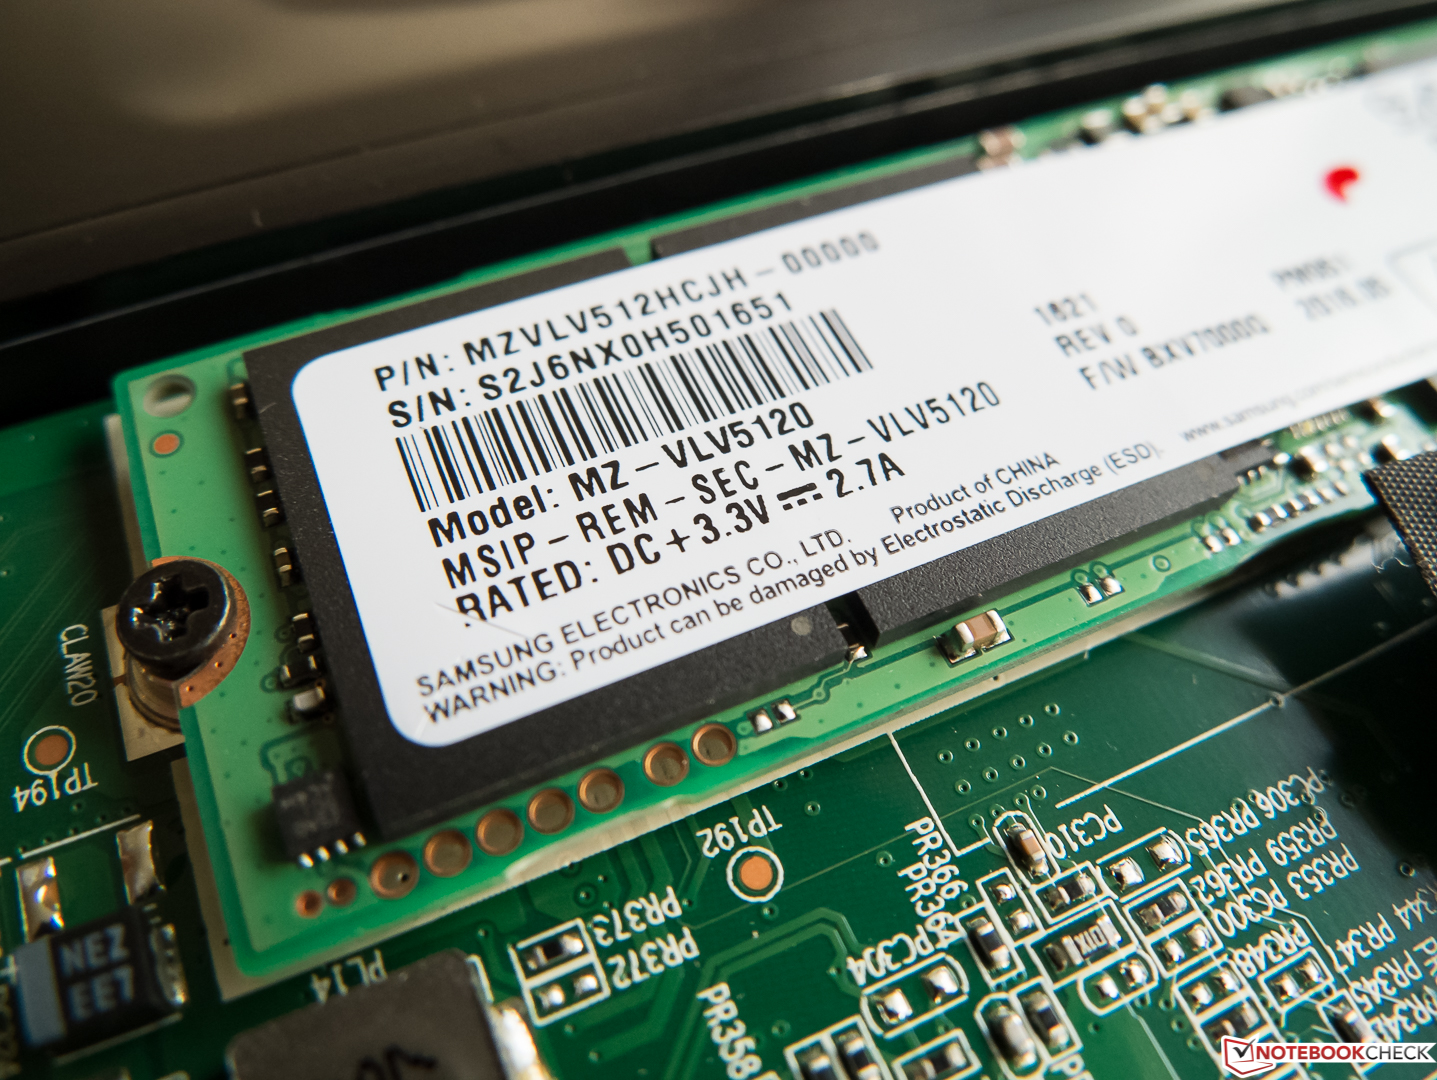
| Razer Blade (2016) Samsung PM951 NVMe MZVLV512 | SCHENKER XMG P406 Samsung SM951 MZHPV256HDGL m.2 PCI-e | MSI GS43VR 6RE-006US SanDisk SD8SN8U1T001122 | Asus Strix GL502VS-FY032T SanDisk SD8SNAT256G1002 | |
|---|---|---|---|---|
| CrystalDiskMark 3.0 | 28% | -63% | -54% | |
| Read Seq | 1296 | 1634 26% | 335.3 -74% | 485.4 -63% |
| Write Seq | 603 | 1290 114% | 299 -50% | 312.4 -48% |
| Read 512 | 655 | 1149 75% | 223 -66% | 294.8 -55% |
| Write 512 | 604 | 1285 113% | 246.7 -59% | 287.8 -52% |
| Read 4k | 42.22 | 43.82 4% | 17.68 -58% | 21.44 -49% |
| Write 4k | 139.6 | 110.3 -21% | 35.31 -75% | 75.7 -46% |
| Read 4k QD32 | 573 | 320.5 -44% | 247.4 -57% | 149.4 -74% |
| Write 4k QD32 | 480 | 287.3 -40% | 156.3 -67% | 256.3 -47% |

| 3DMark 11 - 1280x720 Performance GPU | |
| Asus Strix GL502VS-FY032T | |
| MSI GS43VR 6RE-006US | |
| Razer Blade (2016) | |
| SCHENKER XMG P406 | |
| 3DMark - 1920x1080 Fire Strike Graphics | |
| Asus Strix GL502VS-FY032T | |
| MSI GS43VR 6RE-006US | |
| Razer Blade (2016) | |
| SCHENKER XMG P406 | |
| 3DMark 11 Performance | 11139 points | |
| 3DMark Fire Strike Score | 9193 points | |
Help | ||
| Mirror's Edge Catalyst | |
| 1920x1080 Ultra Preset AF:16x | |
| Asus Strix GL502VS-FY032T | |
| Razer Blade (2016) | |
| 1920x1080 High Preset AF:16x | |
| Asus Strix GL502VS-FY032T | |
| Razer Blade (2016) | |
| The Witcher 3 | |
| 1920x1080 Ultra Graphics & Postprocessing (HBAO+) | |
| Asus Strix GL502VS-FY032T | |
| Razer Blade (2016) | |
| 1920x1080 High Graphics & Postprocessing (Nvidia HairWorks Off) | |
| Asus Strix GL502VS-FY032T | |
| Razer Blade (2016) | |
| low | med. | high | ultra | |
| The Witcher 3 (2015) | 66.2 | 37.3 | ||
| Star Wars Battlefront (2015) | 76.5 | |||
| Mirror's Edge Catalyst (2016) | 63.6 | 57.4 | 49.1 | |
| Battlefield 1 (2016) | 81.7 | 59.9 | 56.4 | |
| Dishonored 2 (2016) | 52.1 | 47 | 44.1 |
| Battlefield 1 | |
| 1920x1080 Ultra Preset AA:T | |
| Razer Blade (2016) EC 4.00 | |
| Razer Blade (2016) | |
| 1920x1080 High Preset AA:T | |
| Razer Blade (2016) EC 4.00 | |
| Razer Blade (2016) | |
Noise Level
| Idle |
| 31 / 33 / 35 dB(A) |
| Load |
| 39 / 51 dB(A) |
 | ||
30 dB silent 40 dB(A) audible 50 dB(A) loud |
||
min: | ||
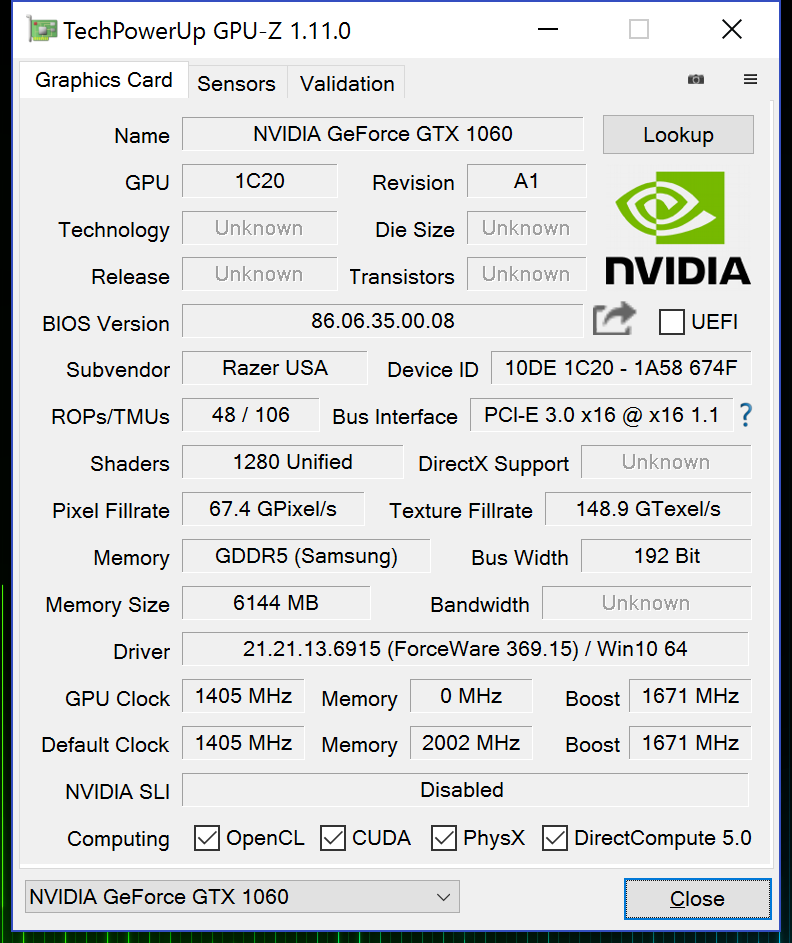
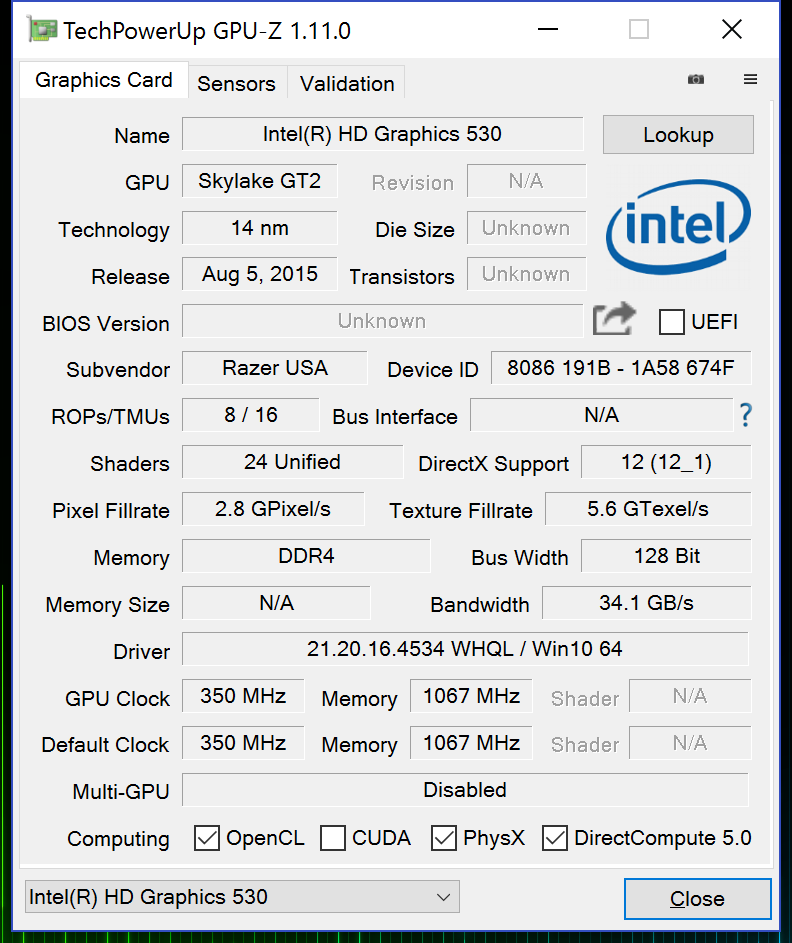
| Razer Blade (2016) GeForce GTX 1060 Mobile, 6700HQ | SCHENKER XMG P406 GeForce GTX 970M, 6700HQ | MSI GS43VR 6RE-006US GeForce GTX 1060 Mobile, 6700HQ | Asus Strix GL502VS-FY032T GeForce GTX 1070 Mobile, 6700HQ | |
|---|---|---|---|---|
| Noise | -6% | -4% | 0% | |
| off / environment * | 30 | 29.1 3% | 30 -0% | |
| Idle Minimum * | 31 | 30 3% | 32 -3% | 32 -3% |
| Idle Average * | 33 | 32 3% | 32 3% | 33 -0% |
| Idle Maximum * | 35 | 40 -14% | 33.5 4% | 34 3% |
| Load Average * | 39 | 47 -21% | 50 -28% | 39 -0% |
| Load Maximum * | 51 | 51 -0% | 51.5 -1% | 51 -0% |
* ... smaller is better
(-) The maximum temperature on the upper side is 52.7 °C / 127 F, compared to the average of 40.4 °C / 105 F, ranging from 21.2 to 68.8 °C for the class Gaming.
(-) The bottom heats up to a maximum of 48.4 °C / 119 F, compared to the average of 43.2 °C / 110 F
(+) In idle usage, the average temperature for the upper side is 26.6 °C / 80 F, compared to the device average of 33.8 °C / 93 F.
(±) The palmrests and touchpad can get very hot to the touch with a maximum of 39.1 °C / 102.4 F.
(-) The average temperature of the palmrest area of similar devices was 28.9 °C / 84 F (-10.2 °C / -18.4 F).
| Razer Blade (2016) GeForce GTX 1060 Mobile, 6700HQ | SCHENKER XMG P406 GeForce GTX 970M, 6700HQ | MSI GS43VR 6RE-006US GeForce GTX 1060 Mobile, 6700HQ | Asus Strix GL502VS-FY032T GeForce GTX 1070 Mobile, 6700HQ | |
|---|---|---|---|---|
| Heat | -25% | -20% | -3% | |
| Maximum Upper Side * | 52.7 | 55 -4% | 55.6 -6% | 48 9% |
| Maximum Bottom * | 48.4 | 58.7 -21% | 62.4 -29% | 46.8 3% |
| Idle Upper Side * | 29.3 | 36.9 -26% | 33.2 -13% | 33.7 -15% |
| Idle Bottom * | 28.4 | 41.7 -47% | 37.2 -31% | 30.5 -7% |
* ... smaller is better
Razer Blade (2016) audio analysis
(±) | speaker loudness is average but good (79 dB)
Bass 100 - 315 Hz
(±) | reduced bass - on average 8.4% lower than median
(±) | linearity of bass is average (11.2% delta to prev. frequency)
Mids 400 - 2000 Hz
(+) | balanced mids - only 4.6% away from median
(+) | mids are linear (4.3% delta to prev. frequency)
Highs 2 - 16 kHz
(+) | balanced highs - only 4.3% away from median
(+) | highs are linear (5.5% delta to prev. frequency)
Overall 100 - 16.000 Hz
(±) | linearity of overall sound is average (17.1% difference to median)
Compared to same class
» 43% of all tested devices in this class were better, 12% similar, 45% worse
» The best had a delta of 6%, average was 18%, worst was 132%
Compared to all devices tested
» 26% of all tested devices were better, 8% similar, 67% worse
» The best had a delta of 4%, average was 25%, worst was 134%
MSI GS43VR 6RE-006US audio analysis
(±) | speaker loudness is average but good (76.7 dB)
Bass 100 - 315 Hz
(-) | nearly no bass - on average 17.5% lower than median
(±) | linearity of bass is average (12% delta to prev. frequency)
Mids 400 - 2000 Hz
(+) | balanced mids - only 3.9% away from median
(±) | linearity of mids is average (9.5% delta to prev. frequency)
Highs 2 - 16 kHz
(±) | higher highs - on average 6.4% higher than median
(±) | linearity of highs is average (8.5% delta to prev. frequency)
Overall 100 - 16.000 Hz
(±) | linearity of overall sound is average (28.9% difference to median)
Compared to same class
» 94% of all tested devices in this class were better, 2% similar, 5% worse
» The best had a delta of 6%, average was 18%, worst was 132%
Compared to all devices tested
» 84% of all tested devices were better, 3% similar, 13% worse
» The best had a delta of 4%, average was 25%, worst was 134%
| Off / Standby | |
| Idle | |
| Load |
|
| Razer Blade (2016) GeForce GTX 1060 Mobile, 6700HQ | SCHENKER XMG P406 GeForce GTX 970M, 6700HQ | MSI GS43VR 6RE-006US GeForce GTX 1060 Mobile, 6700HQ | Asus Strix GL502VS-FY032T GeForce GTX 1070 Mobile, 6700HQ | |
|---|---|---|---|---|
| Power Consumption | -22% | -27% | -58% | |
| Idle Minimum * | 9 | 12 -33% | 12.1 -34% | 20 -122% |
| Idle Average * | 14 | 16 -14% | 19 -36% | 24 -71% |
| Idle Maximum * | 22 | 22 -0% | 19.5 11% | 29 -32% |
| Load Average * | 72 | 90 -25% | 106.7 -48% | 86 -19% |
| Load Maximum * | 124 | 170 -37% | 159 -28% | 183 -48% |
* ... smaller is better
| Razer Blade (2016) 70 Wh | SCHENKER XMG P406 45 Wh | MSI GS43VR 6RE-006US 61 Wh | Asus Strix GL502VS-FY032T 62 Wh | |
|---|---|---|---|---|
| Battery Runtime | ||||
| WiFi v1.3 | 243 | 197 -19% | 261 7% | 196 -19% |
Pros
Cons
考虑到众多的优势,我们对于严重的处理器降频问题感到格外遗憾。它的屏幕闪烁亮度控制和较慢的响应时间也可能会让一些潜在用户迟疑。正常使用所必须的注册账号程序也让我们感到十分不便。鉴于机身较薄,我们认为它的噪音控制属于可以接受的水平,不过风扇在高速旋转时发出的哨声一般的噪音则会给用户带来一些问题。
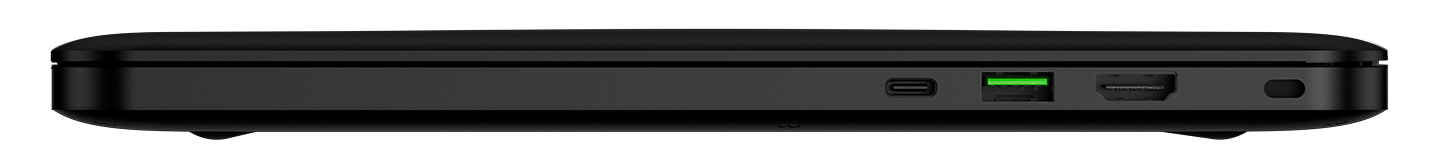
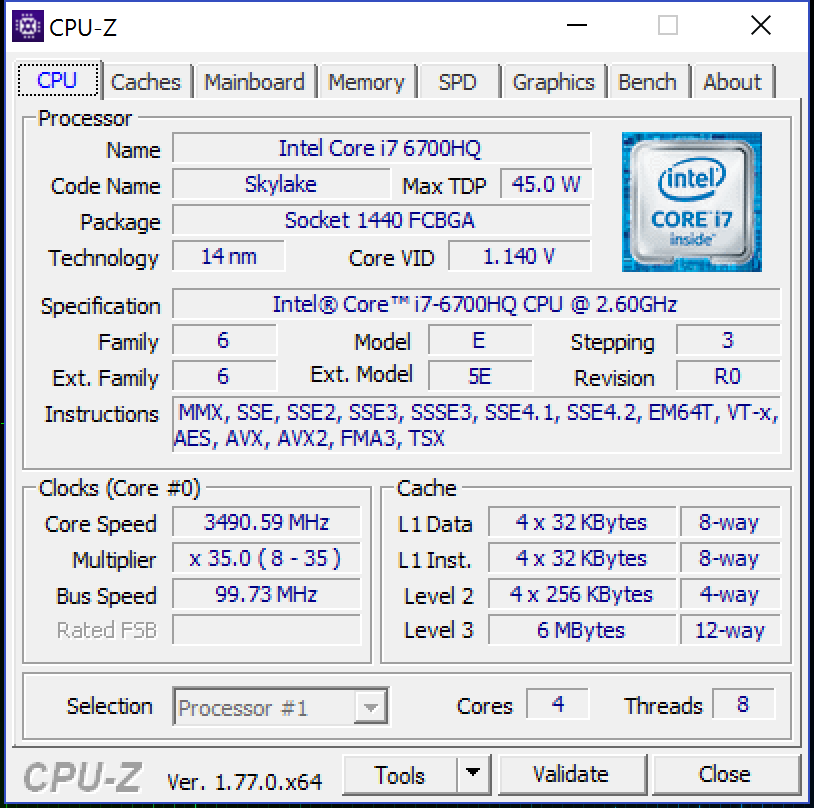
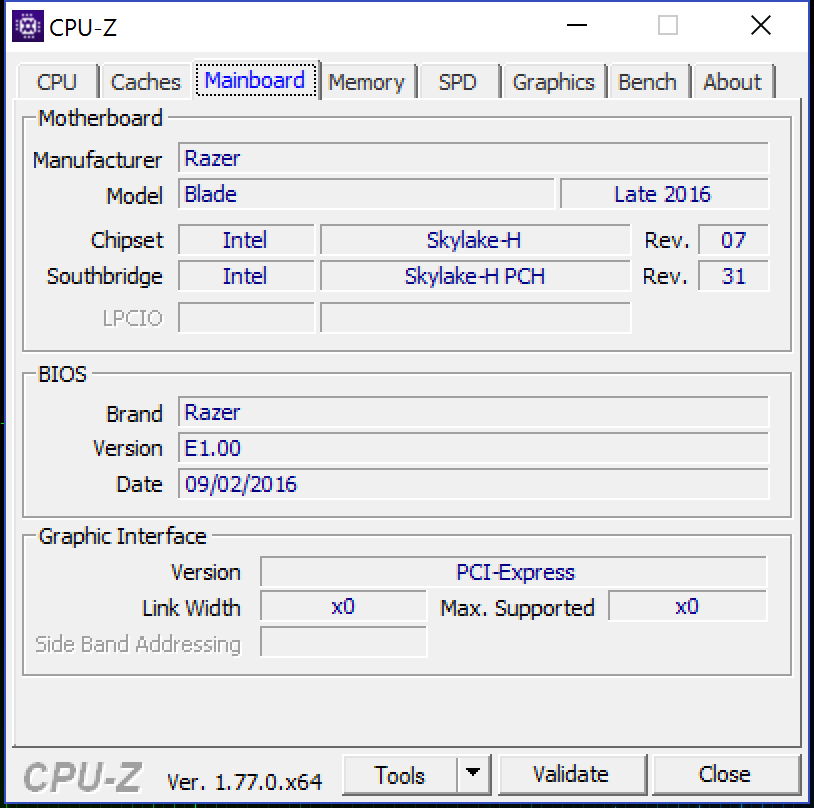
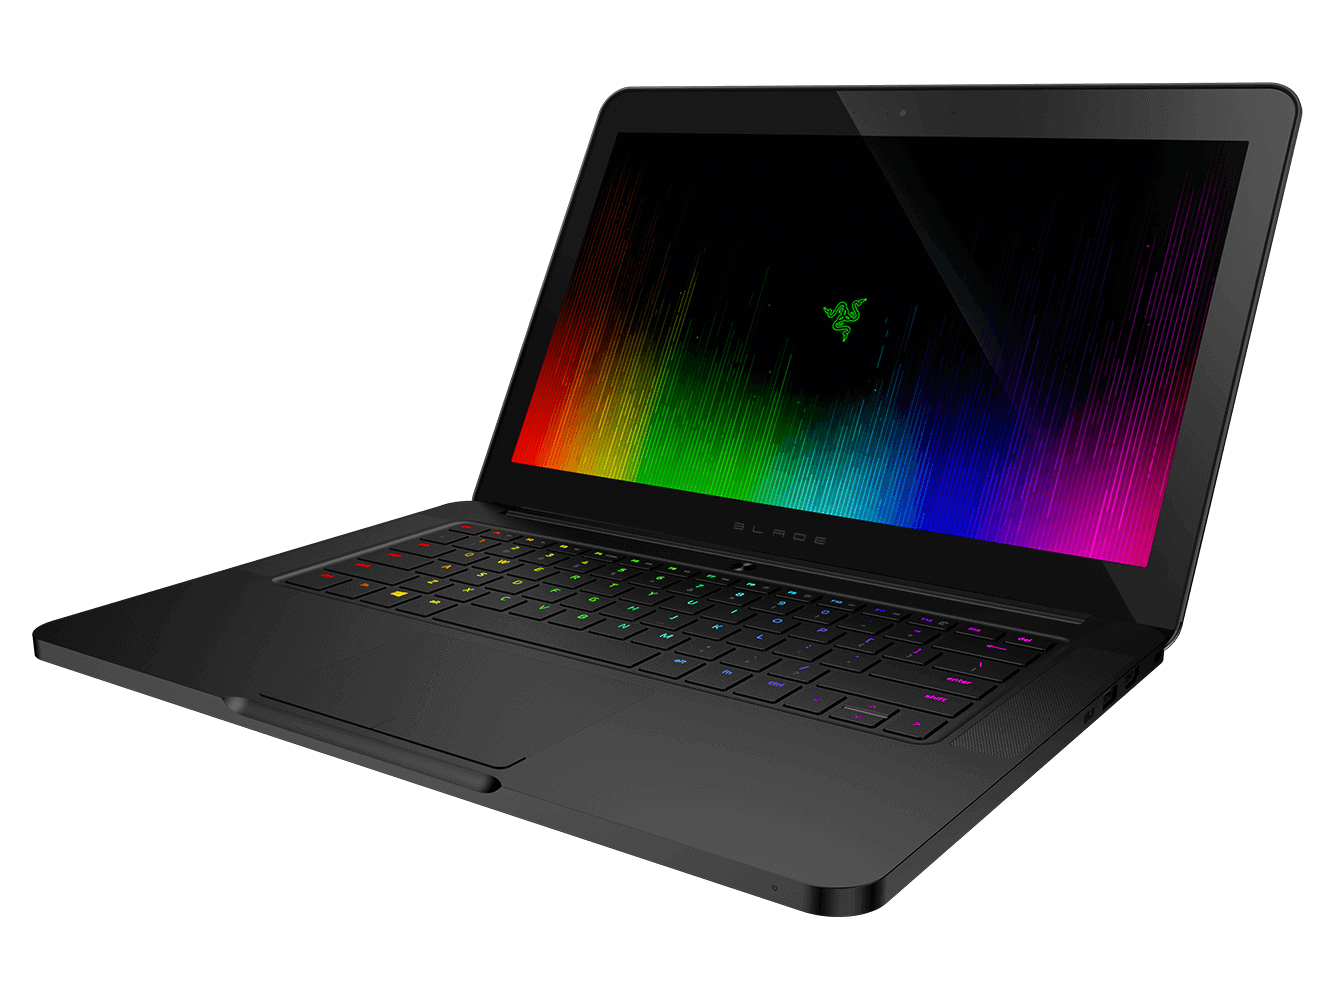
新一代的雷蛇Blade整体表现十分优秀,不过在处理器性能上受到了限制,无法发挥全部的潜力。它的最大优势是高品质的机身,我们几乎挑不出任何瑕疵。它的Chroma键盘布局不太寻常,不过丰富的个性化设置是个很大的优势。搭配高速ac无线网卡,Thunderbolt 3 USB-C和HDMI 2.0接口,Blade已经为未来做好了准备。这台游戏本也搭配了明亮的IGZO屏幕面板,高对比度和准确的色彩都可以令人满意。
更新12/05/16:之前已经提到,它的处理器降频问题已经通过EC更新得到了解决。因此它的分数调整到了最初的84%。
注:本文是基于完整评测的缩减版本,阅读完整的英文评测,请点击这里。
Razer Blade (2016)
-
12/25/2016 v6(old)
Sven Kloevekorn