 Deutsch
 English
 Español
 Français
 Italiano
 Nederlands
 Polski
 Português
 Русский
 Türkçe
 Svenska
 Chinese
 Magyar
Blackview R7 智能手机简短评测
| Networking | |
| iperf Server (receive) TCP 1 m | |
| Xiaomi Mi 5 | |
| Blackview R7 | |
| Honor 5C | |
| iperf Client (transmit) TCP 1 m | |
| Xiaomi Mi 5 | |
| Blackview R7 | |
| Honor 5C | |
| |||||||||||||||||||||||||
Brightness Distribution: 91 %
Center on Battery: 552 cd/m²
Contrast: 863:1 (Black: 0.64 cd/m²)
ΔE Color 11 | 0.5-29.43 Ø5
ΔE Greyscale 14.3 | 0.57-98 Ø5.3
Gamma: 2.21
| Blackview R7 IPS, 1920x1080, 5.50 | ZTE Blade V7 Lite IPS, 1280x720, 5.00 | Coolpad Torino S IPS, 1280x720, 4.70 | LG K10 IPS, 1280x720, 5.30 | Honor 5C IPS, 1920x1080, 5.20 | Xiaomi Mi 5 IPS, 1920x1080, 5.15 | |
|---|---|---|---|---|---|---|
| Screen | 25% | 12% | 18% | 22% | 36% | |
| Brightness middle | 552 | 312 -43% | 360 -35% | 370 -33% | 515 -7% | 598 8% |
| Brightness | 526 | 302 -43% | 358 -32% | 355 -33% | 498 -5% | 566 8% |
| Brightness Distribution | 91 | 79 -13% | 87 -4% | 92 1% | 93 2% | 90 -1% |
| Black Level * | 0.64 | 0.15 77% | 0.45 30% | 0.28 56% | 0.49 23% | 0.51 20% |
| Contrast | 863 | 2080 141% | 800 -7% | 1321 53% | 1051 22% | 1173 36% |
| Colorchecker dE 2000 * | 11 | 8.2 25% | 6.8 38% | 6.7 39% | 6.2 44% | 3.5 68% |
| Colorchecker dE 2000 max. * | 20.8 | 16.5 21% | 11.3 46% | 17.8 14% | 11.4 45% | 6.1 71% |
| Greyscale dE 2000 * | 14.3 | 9.2 36% | 6.2 57% | 7.9 45% | 7.4 48% | 3.5 76% |
| Gamma | 2.21 100% | 2.29 96% | 2.14 103% | 2.21 100% | 2.28 96% | 2.29 96% |
| CCT | 12996 50% | 9017 72% | 7975 82% | 9072 72% | 8664 75% | 6532 100% |
* ... smaller is better
Display Response Times
| ↔ Response Time Black to White | ||
|---|---|---|
| 28 ms ... rise ↗ and fall ↘ combined | ↗ 10 ms rise | 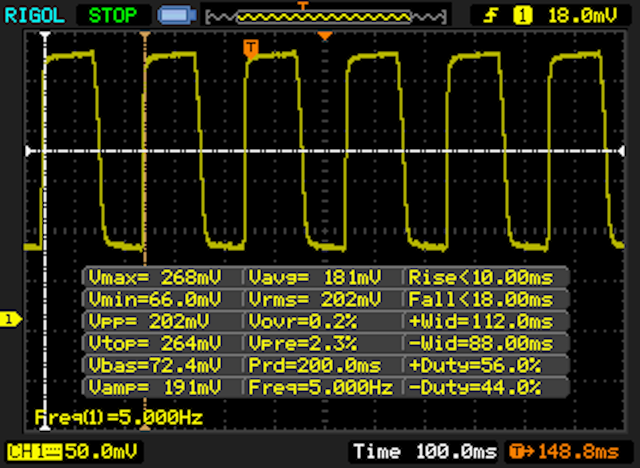 |
| ↘ 18 ms fall | ||
| The screen shows relatively slow response rates in our tests and may be too slow for gamers. In comparison, all tested devices range from 0.1 (minimum) to 240 (maximum) ms. » 67 % of all devices are better. This means that the measured response time is worse than the average of all tested devices (21.5 ms). | ||
| ↔ Response Time 50% Grey to 80% Grey | ||
| 32 ms ... rise ↗ and fall ↘ combined | ↗ 10 ms rise | 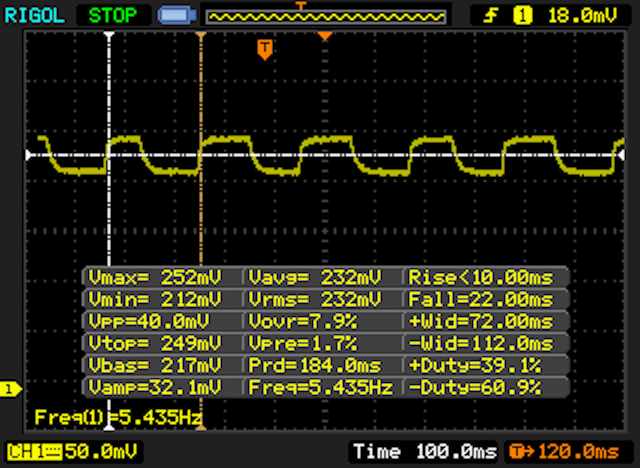 |
| ↘ 22 ms fall | ||
| The screen shows slow response rates in our tests and will be unsatisfactory for gamers. In comparison, all tested devices range from 0.2 (minimum) to 636 (maximum) ms. » 36 % of all devices are better. This means that the measured response time is similar to the average of all tested devices (33.8 ms). | ||
Screen Flickering / PWM (Pulse-Width Modulation)
| Screen flickering / PWM not detected | 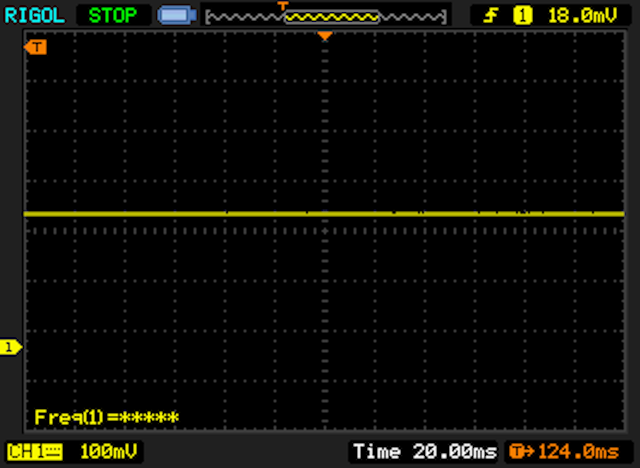 | ||
In comparison: 53 % of all tested devices do not use PWM to dim the display. If PWM was detected, an average of 17933 (minimum: 5 - maximum: 3846000) Hz was measured. | |||
| AndroBench 3-5 | |
| Sequential Write 256KB SDCard (sort by value) | |
| Blackview R7 | |
| ZTE Blade V7 Lite | |
| Coolpad Torino S | |
| LG K10 | |
| Honor 5C | |
| Sequential Read 256KB SDCard (sort by value) | |
| Blackview R7 | |
| ZTE Blade V7 Lite | |
| Coolpad Torino S | |
| LG K10 | |
| Honor 5C | |
| Random Write 4KB (sort by value) | |
| Blackview R7 | |
| ZTE Blade V7 Lite | |
| Coolpad Torino S | |
| LG K10 | |
| Honor 5C | |
| Xiaomi Mi 5 | |
| Random Read 4KB (sort by value) | |
| Blackview R7 | |
| ZTE Blade V7 Lite | |
| Coolpad Torino S | |
| LG K10 | |
| Honor 5C | |
| Xiaomi Mi 5 | |
| Sequential Write 256KB (sort by value) | |
| Blackview R7 | |
| ZTE Blade V7 Lite | |
| Coolpad Torino S | |
| LG K10 | |
| Honor 5C | |
| Xiaomi Mi 5 | |
| Sequential Read 256KB (sort by value) | |
| Blackview R7 | |
| ZTE Blade V7 Lite | |
| Coolpad Torino S | |
| LG K10 | |
| Honor 5C | |
| Xiaomi Mi 5 | |
| AnTuTu v6 - Total Score (sort by value) | |
| Blackview R7 | |
| ZTE Blade V7 Lite | |
| Coolpad Torino S | |
| LG K10 | |
| Honor 5C | |
| Xiaomi Mi 5 | |
| 3DMark | |
| 1280x720 offscreen Ice Storm Unlimited Score (sort by value) | |
| Blackview R7 | |
| ZTE Blade V7 Lite | |
| Coolpad Torino S | |
| LG K10 | |
| Honor 5C | |
| Xiaomi Mi 5 | |
| 1280x720 offscreen Ice Storm Unlimited Graphics Score (sort by value) | |
| Blackview R7 | |
| ZTE Blade V7 Lite | |
| Coolpad Torino S | |
| LG K10 | |
| Honor 5C | |
| Xiaomi Mi 5 | |
| 1280x720 offscreen Ice Storm Unlimited Physics (sort by value) | |
| Blackview R7 | |
| ZTE Blade V7 Lite | |
| Coolpad Torino S | |
| LG K10 | |
| Honor 5C | |
| Xiaomi Mi 5 | |
| 2560x1440 Sling Shot OpenGL ES 3.0 (sort by value) | |
| Blackview R7 | |
| ZTE Blade V7 Lite | |
| Coolpad Torino S | |
| LG K10 | |
| Honor 5C | |
| Xiaomi Mi 5 | |
| 2560x1440 Sling Shot OpenGL ES 3.0 Graphics (sort by value) | |
| Blackview R7 | |
| ZTE Blade V7 Lite | |
| Coolpad Torino S | |
| LG K10 | |
| Honor 5C | |
| Xiaomi Mi 5 | |
| 2560x1440 Sling Shot OpenGL ES 3.0 Physics (sort by value) | |
| Blackview R7 | |
| ZTE Blade V7 Lite | |
| Coolpad Torino S | |
| LG K10 | |
| Honor 5C | |
| Xiaomi Mi 5 | |
| GFXBench (DX / GLBenchmark) 2.7 | |
| T-Rex Onscreen (sort by value) | |
| Blackview R7 | |
| ZTE Blade V7 Lite | |
| Coolpad Torino S | |
| LG K10 | |
| Honor 5C | |
| Xiaomi Mi 5 | |
| 1920x1080 T-Rex Offscreen (sort by value) | |
| Blackview R7 | |
| ZTE Blade V7 Lite | |
| Coolpad Torino S | |
| LG K10 | |
| Honor 5C | |
| Xiaomi Mi 5 | |
| GFXBench 3.0 | |
| on screen Manhattan Onscreen OGL (sort by value) | |
| Blackview R7 | |
| ZTE Blade V7 Lite | |
| Coolpad Torino S | |
| LG K10 | |
| Honor 5C | |
| Xiaomi Mi 5 | |
| 1920x1080 1080p Manhattan Offscreen (sort by value) | |
| Blackview R7 | |
| ZTE Blade V7 Lite | |
| Coolpad Torino S | |
| LG K10 | |
| Honor 5C | |
| Xiaomi Mi 5 | |
| GFXBench 3.1 | |
| on screen Manhattan ES 3.1 Onscreen (sort by value) | |
| Blackview R7 | |
| ZTE Blade V7 Lite | |
| LG K10 | |
| Honor 5C | |
| Xiaomi Mi 5 | |
| 1920x1080 Manhattan ES 3.1 Offscreen (sort by value) | |
| Blackview R7 | |
| ZTE Blade V7 Lite | |
| LG K10 | |
| Honor 5C | |
| Xiaomi Mi 5 | |
| PCMark for Android - Work performance score (sort by value) | |
| Blackview R7 | |
| Coolpad Torino S | |
| LG K10 | |
| Honor 5C | |
| Xiaomi Mi 5 | |
| JetStream 1.1 - Total Score (sort by value) | |
| Blackview R7 | |
| ZTE Blade V7 Lite | |
| Coolpad Torino S | |
| LG K10 | |
| Honor 5C | |
| Xiaomi Mi 5 | |
| Octane V2 - Total Score (sort by value) | |
| Blackview R7 | |
| ZTE Blade V7 Lite | |
| Coolpad Torino S | |
| LG K10 | |
| Honor 5C | |
| Xiaomi Mi 5 | |
| Mozilla Kraken 1.1 - Total (sort by value) | |
| Blackview R7 | |
| ZTE Blade V7 Lite | |
| Coolpad Torino S | |
| LG K10 | |
| Honor 5C | |
| Xiaomi Mi 5 | |
* ... smaller is better
(+) The maximum temperature on the upper side is 39 °C / 102 F, compared to the average of 35 °C / 95 F, ranging from 21.9 to 56 °C for the class Smartphone.
(±) The bottom heats up to a maximum of 41.8 °C / 107 F, compared to the average of 33.8 °C / 93 F
(+) In idle usage, the average temperature for the upper side is 31 °C / 88 F, compared to the device average of 32.7 °C / 91 F.
Blackview R7 audio analysis
(±) | speaker loudness is average but good (74.4 dB)
Bass 100 - 315 Hz
(-) | nearly no bass - on average 30.5% lower than median
(-) | bass is not linear (15.5% delta to prev. frequency)
Mids 400 - 2000 Hz
(±) | reduced mids - on average 9.8% lower than median
(-) | mids are not linear (15.2% delta to prev. frequency)
Highs 2 - 16 kHz
(±) | higher highs - on average 11.7% higher than median
(+) | highs are linear (6.2% delta to prev. frequency)
Overall 100 - 16.000 Hz
(-) | overall sound is not linear (44.4% difference to median)
Compared to same class
» 84% of all tested devices in this class were better, 0% similar, 15% worse
» The best had a delta of 12%, average was 38%, worst was 134%
Compared to all devices tested
» 95% of all tested devices were better, 0% similar, 5% worse
» The best had a delta of 4%, average was 25%, worst was 134%
ZTE Blade V7 Lite audio analysis
(+) | speakers can play relatively loud (82.6 dB)
Bass 100 - 315 Hz
(-) | nearly no bass - on average 35.5% lower than median
(±) | linearity of bass is average (7% delta to prev. frequency)
Mids 400 - 2000 Hz
(±) | reduced mids - on average 5.1% lower than median
(±) | linearity of mids is average (8% delta to prev. frequency)
Highs 2 - 16 kHz
(+) | balanced highs - only 2.2% away from median
(+) | highs are linear (2.2% delta to prev. frequency)
Overall 100 - 16.000 Hz
(±) | linearity of overall sound is average (23.8% difference to median)
Compared to same class
» 48% of all tested devices in this class were better, 9% similar, 43% worse
» The best had a delta of 12%, average was 38%, worst was 134%
Compared to all devices tested
» 67% of all tested devices were better, 7% similar, 26% worse
» The best had a delta of 4%, average was 25%, worst was 134%
Honor 5C audio analysis
(+) | speakers can play relatively loud (87.9 dB)
Bass 100 - 315 Hz
(-) | nearly no bass - on average 30.9% lower than median
(±) | linearity of bass is average (8.1% delta to prev. frequency)
Mids 400 - 2000 Hz
(±) | higher mids - on average 7.1% higher than median
(±) | linearity of mids is average (8.8% delta to prev. frequency)
Highs 2 - 16 kHz
(±) | higher highs - on average 12.1% higher than median
(+) | highs are linear (2.9% delta to prev. frequency)
Overall 100 - 16.000 Hz
(-) | overall sound is not linear (31.7% difference to median)
Compared to same class
» 78% of all tested devices in this class were better, 3% similar, 19% worse
» The best had a delta of 12%, average was 38%, worst was 134%
Compared to all devices tested
» 89% of all tested devices were better, 2% similar, 9% worse
» The best had a delta of 4%, average was 25%, worst was 134%
Coolpad Torino S audio analysis
(±) | speaker loudness is average but good (81.1 dB)
Bass 100 - 315 Hz
(-) | nearly no bass - on average 39.6% lower than median
(±) | linearity of bass is average (8.6% delta to prev. frequency)
Mids 400 - 2000 Hz
(±) | reduced mids - on average 7.7% lower than median
(±) | linearity of mids is average (8.1% delta to prev. frequency)
Highs 2 - 16 kHz
(+) | balanced highs - only 2.8% away from median
(+) | highs are linear (3.8% delta to prev. frequency)
Overall 100 - 16.000 Hz
(±) | linearity of overall sound is average (29% difference to median)
Compared to same class
» 72% of all tested devices in this class were better, 4% similar, 24% worse
» The best had a delta of 12%, average was 38%, worst was 134%
Compared to all devices tested
» 85% of all tested devices were better, 3% similar, 13% worse
» The best had a delta of 4%, average was 25%, worst was 134%
| Off / Standby | |
| Idle | |
| Load |
|
| Blackview R7 3000 mAh | ZTE Blade V7 Lite 2500 mAh | Coolpad Torino S 1800 mAh | LG K10 2300 mAh | Honor 5C 3000 mAh | Xiaomi Mi 5 3000 mAh | |
|---|---|---|---|---|---|---|
| Power Consumption | 57% | 45% | 41% | 31% | ||
| Idle Minimum * | 1.83 | 0.63 66% | 0.68 63% | 0.89 51% | 0.45 75% | |
| Idle Average * | 3.21 | 1.37 57% | 2.2 31% | 2.07 36% | 1.68 48% | |
| Idle Maximum * | 3.45 | 1.71 50% | 2.26 34% | 2.15 38% | 1.71 50% | |
| Load Average * | 5.67 | 2.82 50% | 3.47 39% | 3.46 39% | 6.7 -18% | |
| Load Maximum * | 9.16 | 3.36 63% | 3.71 59% | 5.18 43% | 9.18 -0% |
* ... smaller is better
| Blackview R7 3000 mAh | ZTE Blade V7 Lite 2500 mAh | Coolpad Torino S 1800 mAh | LG K10 2300 mAh | Honor 5C 3000 mAh | Xiaomi Mi 5 3000 mAh | |
|---|---|---|---|---|---|---|
| Battery Runtime | ||||||
| WiFi v1.3 | 412 | 517 25% | 397 -4% | 453 10% | 584 42% | 504 22% |
Pros
Cons
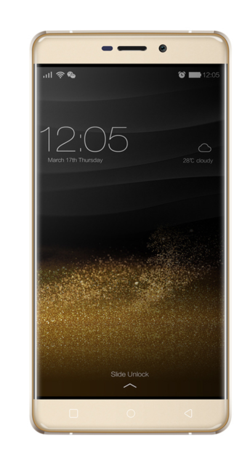
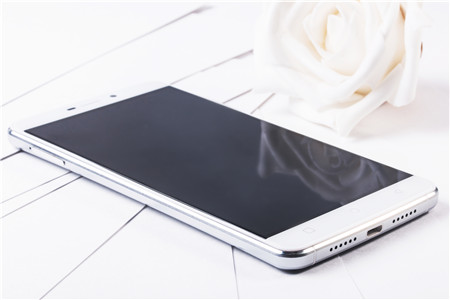
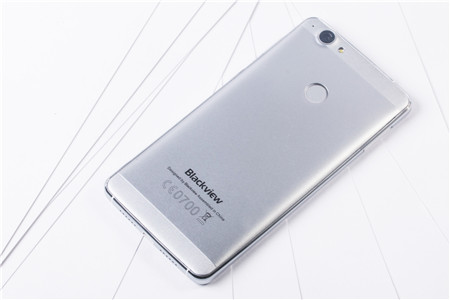
如果实事求是地为Blackview R7评分的话——这台并不能算作旗舰级机型实惠型主流智能手机的整体表现十分不错。它搭配了32GB闪存和4GB内存,相比大部分同价位产品都翻了一倍。而Helio P10处理器则保证了流畅的系统性能。除了实体按键它的机身品质也十分不错。
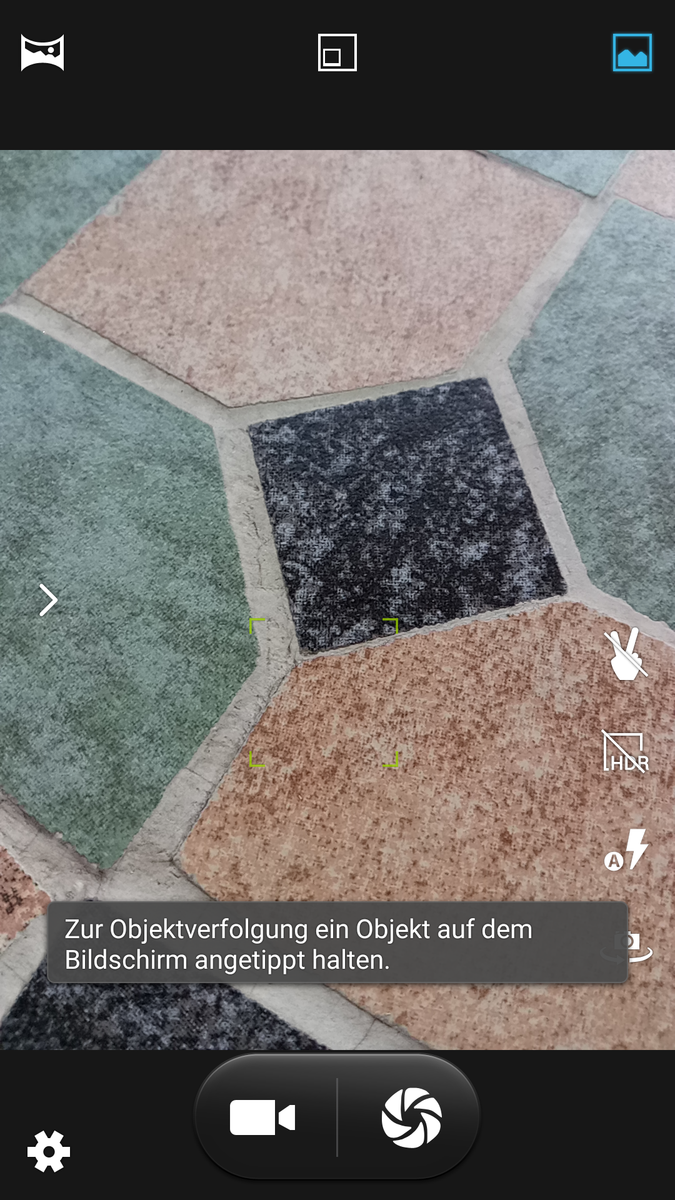
不过在较慢的整合micro-SD读卡器和较差的扬声器效果的方面,它就不那么让人满意了。1300万像素的主相机可以满足实际使用的需要,但有比较严重的偏色,会影响拍摄照片的品质,这应该可以通过软件更新得到解决。接近200克的重量对于一台5.5寸智能手机来说也有些过高。
R7很难达到它出色的配置表让人期待的水平,因为它的弱点也同样较多。不过考虑到160欧元(约1191人民币)的市场价,它整体上的表现可以说是十分优秀。
注:本文是基于完整评测的缩减版本,阅读完整的英文评测,请点击这里。
Blackview R7
-
09/05/2016 v5.1(old)
Marcus Herbrich
Pricecompare
