 Deutsch
 English
 Español
 Français
 Italiano
 Nederlands
 Polski
 Português
 Русский
 Türkçe
 Svenska
 Chinese
 Magyar
宏碁 Aspire ES1-533-P7WA 笔记本电脑简短评测
| SD Card Reader | |
| average JPG Copy Test (av. of 3 runs) | |
| Lenovo IdeaPad 300-15IBR | |
| Lenovo B50-10 80QR0013GE | |
| Lenovo B50-70 MCC2GGE | |
| Asus F540SA-XX087T | |
| Lenovo G51-35 80M8002HGE | |
| HP 250 G5 Y1V08UT | |
| Acer Aspire ES1-533-P7WA | |
| Acer Aspire ES1-521-87DN | |
| maximum AS SSD Seq Read Test (1GB) | |
| Lenovo B50-70 MCC2GGE | |
| Lenovo B50-10 80QR0013GE | |
| Lenovo IdeaPad 300-15IBR | |
| Acer Aspire ES1-533-P7WA | |
| Acer Aspire ES1-521-87DN | |
| Lenovo G51-35 80M8002HGE | |
| HP 250 G5 Y1V08UT | |
| Networking | |
| iperf Client (transmit) TCP 1 m | |
| Lenovo B50-70 MCC2GGE | |
| Lenovo B50-10 80QR0013GE | |
| iperf3 receive AX12 | |
| Acer Aspire ES1-533-P7WA | |
| iperf3 transmit AX12 | |
| Acer Aspire ES1-533-P7WA | |
| |||||||||||||||||||||||||
Brightness Distribution: 92 %
Center on Battery: 201 cd/m²
Contrast: 300:1 (Black: 0.67 cd/m²)
ΔE Color 10.36 | 0.5-29.43 Ø5
ΔE Greyscale 11.06 | 0.57-98 Ø5.3
57% sRGB (Argyll 1.6.3 3D)
36% AdobeRGB 1998 (Argyll 1.6.3 3D)
39.3% AdobeRGB 1998 (Argyll 2.2.0 3D)
57.2% sRGB (Argyll 2.2.0 3D)
38.04% Display P3 (Argyll 2.2.0 3D)
Gamma: 2.56
| Acer Aspire ES1-533-P7WA TN LED, 1920x1080, 15.60 | Acer Aspire ES1-521-87DN TN LED, 1366x768, 15.60 | Lenovo B50-10 80QR0013GE TN LED, 1366x768, 15.60 | HP 250 G5 Y1V08UT TN LED, 1366x768, 15.60 | Asus F540SA-XX087T TN LED, 1366x768, 15.60 | Lenovo G51-35 80M8002HGE ChiMei CMN15C6 N156BGE-EB2, 1366x768, 15.60 | |
|---|---|---|---|---|---|---|
| Display | 5% | 6% | -7% | 6% | -1% | |
| Display P3 Coverage | 38.04 | 39.83 5% | 40.21 6% | 35.43 -7% | 40.17 6% | 37.59 -1% |
| sRGB Coverage | 57.2 | 59.5 4% | 60.1 5% | 53.3 -7% | 60 5% | 56.3 -2% |
| AdobeRGB 1998 Coverage | 39.3 | 41.19 5% | 41.56 6% | 36.6 -7% | 41.54 6% | 38.85 -1% |
| Response Times | -11% | 24% | -12% | 33% | -6% | |
| Response Time Grey 50% / Grey 80% * | 43 ? | 47 ? -9% | 28 ? 35% | 42.4 ? 1% | 20 ? 53% | 43.6 ? -1% |
| Response Time Black / White * | 23 ? | 26 ? -13% | 20 ? 13% | 28.8 ? -25% | 20 ? 13% | 25.6 ? -11% |
| PWM Frequency | 1000 ? | 200 ? | 200 ? | 200 ? | ||
| Screen | 18% | 21% | -10% | 30% | 19% | |
| Brightness middle | 201 | 245 22% | 245 22% | 199.8 -1% | 215 7% | 206 2% |
| Brightness | 202 | 238 18% | 230 14% | 199 -1% | 200 -1% | 195 -3% |
| Brightness Distribution | 92 | 88 -4% | 84 -9% | 85 -8% | 87 -5% | 88 -4% |
| Black Level * | 0.67 | 0.42 37% | 0.46 31% | 0.712 -6% | 0.26 61% | 0.35 48% |
| Contrast | 300 | 583 94% | 533 78% | 281 -6% | 827 176% | 589 96% |
| Colorchecker dE 2000 * | 10.36 | 10.49 -1% | 8.34 19% | 13.24 -28% | 13.07 -26% | 8.96 14% |
| Colorchecker dE 2000 max. * | 18.88 | 16.84 11% | 12.31 35% | 21.52 -14% | 16.06 15% | 14.26 24% |
| Greyscale dE 2000 * | 11.06 | 11.47 -4% | 9.48 14% | 13.33 -21% | 4.34 61% | 9.27 16% |
| Gamma | 2.56 86% | 2.52 87% | 2.38 92% | 1.69 130% | 2.48 89% | 2.38 92% |
| CCT | 11368 57% | 13286 49% | 10624 61% | 15879 41% | 7212 90% | 11213 58% |
| Color Space (Percent of AdobeRGB 1998) | 36 | 38 6% | 38 6% | 33.8 -6% | 38 6% | 35.89 0% |
| Color Space (Percent of sRGB) | 57 | 60 5% | 57 0% | 53.4 -6% | 60 5% | 56.26 -1% |
| Total Average (Program / Settings) | 4% /
12% | 17% /
18% | -10% /
-9% | 23% /
25% | 4% /
12% |
* ... smaller is better
Screen Flickering / PWM (Pulse-Width Modulation)
| Screen flickering / PWM not detected | ||
In comparison: 53 % of all tested devices do not use PWM to dim the display. If PWM was detected, an average of 17900 (minimum: 5 - maximum: 3846000) Hz was measured. | ||
Display Response Times
| ↔ Response Time Black to White | ||
|---|---|---|
| 23 ms ... rise ↗ and fall ↘ combined | ↗ 7 ms rise | 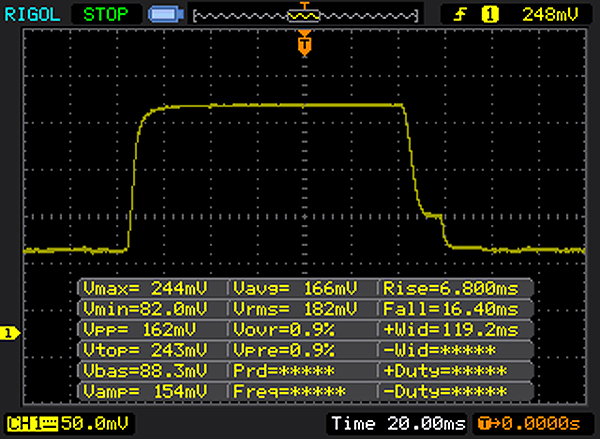 |
| ↘ 16 ms fall | ||
| The screen shows good response rates in our tests, but may be too slow for competitive gamers. In comparison, all tested devices range from 0.1 (minimum) to 240 (maximum) ms. » 45 % of all devices are better. This means that the measured response time is similar to the average of all tested devices (21.5 ms). | ||
| ↔ Response Time 50% Grey to 80% Grey | ||
| 43 ms ... rise ↗ and fall ↘ combined | ↗ 21 ms rise | 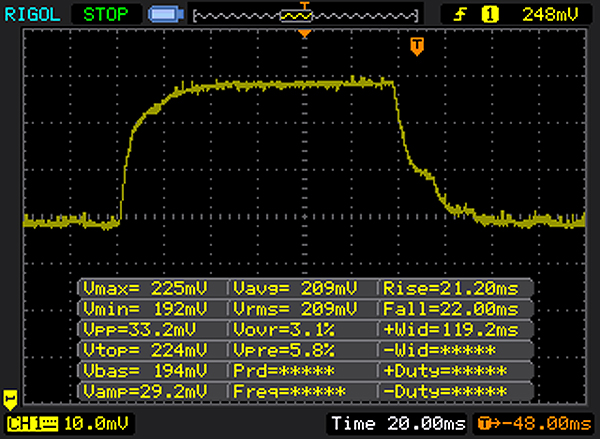 |
| ↘ 22 ms fall | ||
| The screen shows slow response rates in our tests and will be unsatisfactory for gamers. In comparison, all tested devices range from 0.2 (minimum) to 636 (maximum) ms. » 67 % of all devices are better. This means that the measured response time is worse than the average of all tested devices (33.7 ms). | ||
| Cinebench R15 | |
| CPU Single 64Bit | |
| Lenovo B50-70 MCC2GGE | |
| Acer Aspire ES1-533-P7WA | |
| Lenovo G51-35 80M8002HGE | |
| Acer Aspire ES1-521-87DN | |
| Acer Aspire E15 ES1-512-P1SM | |
| Lenovo B50-10 80QR0013GE | |
| HP 250 G5 Y1V08UT | |
| Lenovo IdeaPad 300-15IBR | |
| Asus F540SA-XX087T | |
| CPU Multi 64Bit | |
| Lenovo B50-70 MCC2GGE | |
| Lenovo G51-35 80M8002HGE | |
| Acer Aspire ES1-533-P7WA | |
| Acer Aspire E15 ES1-512-P1SM | |
| Acer Aspire ES1-521-87DN | |
| Lenovo B50-10 80QR0013GE | |
| Lenovo IdeaPad 300-15IBR | |
| HP 250 G5 Y1V08UT | |
| Asus F540SA-XX087T | |
| Cinebench R10 | |
| Rendering Multiple CPUs 32Bit | |
| Lenovo B50-70 MCC2GGE | |
| Acer Aspire ES1-521-87DN | |
| Acer Aspire ES1-533-P7WA | |
| Acer Aspire E15 ES1-512-P1SM | |
| Lenovo B50-10 80QR0013GE | |
| Lenovo G51-35 80M8002HGE | |
| Lenovo IdeaPad 300-15IBR | |
| HP 250 G5 Y1V08UT | |
| Asus F540SA-XX087T | |
| Rendering Single 32Bit | |
| Lenovo B50-70 MCC2GGE | |
| Acer Aspire ES1-521-87DN | |
| Acer Aspire ES1-533-P7WA | |
| Lenovo G51-35 80M8002HGE | |
| Acer Aspire E15 ES1-512-P1SM | |
| Lenovo B50-10 80QR0013GE | |
| HP 250 G5 Y1V08UT | |
| Lenovo IdeaPad 300-15IBR | |
| Asus F540SA-XX087T | |
| Geekbench 3 | |
| 32 Bit Single-Core Score | |
| Lenovo B50-70 MCC2GGE | |
| Acer Aspire ES1-533-P7WA | |
| Acer Aspire ES1-521-87DN | |
| Acer Aspire E15 ES1-512-P1SM | |
| Lenovo B50-10 80QR0013GE | |
| Asus F540SA-XX087T | |
| 32 Bit Multi-Core Score | |
| Acer Aspire ES1-533-P7WA | |
| Acer Aspire ES1-521-87DN | |
| Lenovo B50-70 MCC2GGE | |
| Acer Aspire E15 ES1-512-P1SM | |
| Lenovo B50-10 80QR0013GE | |
| Asus F540SA-XX087T | |
| Geekbench 4.0 | |
| 64 Bit Single-Core Score | |
| Acer Aspire ES1-533-P7WA | |
| 64 Bit Multi-Core Score | |
| Acer Aspire ES1-533-P7WA | |
| JetStream 1.1 - Total Score | |
| Lenovo B50-70 MCC2GGE | |
| Acer Aspire ES1-533-P7WA | |
| Acer Aspire ES1-521-87DN | |
| Lenovo G51-35 80M8002HGE | |
| Lenovo B50-10 80QR0013GE | |
| HP 250 G5 Y1V08UT | |
| Asus F540SA-XX087T | |
| Lenovo IdeaPad 300-15IBR | |
| PCMark 8 Home Score Accelerated v2 | 1993 points | |
Help | ||
| PCMark 8 - Home Score Accelerated v2 | |
| Lenovo B50-70 MCC2GGE | |
| Acer Aspire ES1-533-P7WA | |
| Lenovo G51-35 80M8002HGE | |
| Acer Aspire ES1-521-87DN | |
| Lenovo IdeaPad 300-15IBR | |
| HP 250 G5 Y1V08UT | |
| Asus F540SA-XX087T | |
| Lenovo B50-10 80QR0013GE | |

| Acer Aspire ES1-533-P7WA Toshiba MQ01ABD100 | Acer Aspire E15 ES1-512-P1SM Western Digital Scorpio Blue WD5000LPVX | Lenovo B50-10 80QR0013GE Seagate Momentus Thin ST500LT012-1DG142 | HP 250 G5 Y1V08UT Samsung CM871 MZNLF128HCHP | Asus F540SA-XX087T Seagate Momentus Thin ST500LT012-1DG142 | Lenovo G51-35 80M8002HGE WDC Scorpio Blue WD10JPCX-24UE4T0 | |
|---|---|---|---|---|---|---|
| CrystalDiskMark 3.0 | 9% | -0% | 2813% | -12% | 18% | |
| Read Seq | 107.6 | 105.1 -2% | 103.5 -4% | 484.4 350% | 98.3 -9% | 100 -7% |
| Write Seq | 96.6 | 102.8 6% | 91.1 -6% | 139.2 44% | 89.8 -7% | 99.8 3% |
| Read 512 | 22.5 | 31.56 40% | 33.74 50% | 338.1 1403% | 20.79 -8% | 35.48 58% |
| Write 512 | 24.23 | 45.47 88% | 38.77 60% | 134.7 456% | 34.84 44% | 46.19 91% |
| Read 4k | 0.474 | 0.35 -26% | 0.374 -21% | 17.21 3531% | 0.335 -29% | 0.424 -11% |
| Write 4k | 1.089 | 0.94 -14% | 0.649 -40% | 31.52 2794% | 0.619 -43% | 0.966 -11% |
| Read 4k QD32 | 0.861 | 0.72 -16% | 0.818 -5% | 94.6 10887% | 0.789 -8% | 1.031 20% |
| Write 4k QD32 | 0.991 | 0.94 -5% | 0.648 -35% | 31.08 3036% | 0.641 -35% | 1 1% |
| 3DMark 11 Performance | 686 points | |
Help | ||
| 3DMark 11 - 1280x720 Performance GPU | |
| Lenovo IdeaPad 300-15IBR | |
| Lenovo G51-35 80M8002HGE | |
| Acer Aspire ES1-521-87DN | |
| Lenovo B50-70 MCC2GGE | |
| Acer Aspire ES1-533-P7WA | |
| Asus F540SA-XX087T | |
| HP 250 G5 Y1V08UT | |
| Acer Aspire E15 ES1-512-P1SM | |
| Lenovo B50-10 80QR0013GE | |
| low | med. | high | ultra | |
| Counter-Strike: GO (2012) | 35 | 31 | ||
| BioShock Infinite (2013) | 23.7 | 13.6 | 11.5 | |
| Dota 2 Reborn (2015) | 32 | 22 |
Noise Level
| Idle |
| 31.2 / 31.2 / 31.2 dB(A) |
| HDD |
| 31.2 dB(A) |
| DVD |
| 34.8 / dB(A) |
| Load |
| 33.9 / 34.2 dB(A) |
 | ||
30 dB silent 40 dB(A) audible 50 dB(A) loud |
||
min: | ||
(+) The maximum temperature on the upper side is 33.3 °C / 92 F, compared to the average of 34.2 °C / 94 F, ranging from 21.2 to 62.5 °C for the class Office.
(+) The bottom heats up to a maximum of 39.4 °C / 103 F, compared to the average of 36.7 °C / 98 F
(+) In idle usage, the average temperature for the upper side is 25.1 °C / 77 F, compared to the device average of 29.5 °C / 85 F.
(+) The palmrests and touchpad are cooler than skin temperature with a maximum of 26 °C / 78.8 F and are therefore cool to the touch.
(±) The average temperature of the palmrest area of similar devices was 27.7 °C / 81.9 F (+1.7 °C / 3.1 F).
Acer Aspire ES1-533-P7WA audio analysis
(±) | speaker loudness is average but good (72 dB)
Bass 100 - 315 Hz
(-) | nearly no bass - on average 23% lower than median
(±) | linearity of bass is average (10.6% delta to prev. frequency)
Mids 400 - 2000 Hz
(+) | balanced mids - only 3.4% away from median
(+) | mids are linear (6.8% delta to prev. frequency)
Highs 2 - 16 kHz
(±) | higher highs - on average 9.6% higher than median
(±) | linearity of highs is average (10.8% delta to prev. frequency)
Overall 100 - 16.000 Hz
(±) | linearity of overall sound is average (29.4% difference to median)
Compared to same class
» 89% of all tested devices in this class were better, 3% similar, 8% worse
» The best had a delta of 7%, average was 22%, worst was 53%
Compared to all devices tested
» 85% of all tested devices were better, 3% similar, 12% worse
» The best had a delta of 4%, average was 25%, worst was 134%
Apple MacBook 12 (Early 2016) 1.1 GHz audio analysis
(+) | speakers can play relatively loud (83.6 dB)
Bass 100 - 315 Hz
(±) | reduced bass - on average 11.3% lower than median
(±) | linearity of bass is average (14.2% delta to prev. frequency)
Mids 400 - 2000 Hz
(+) | balanced mids - only 2.4% away from median
(+) | mids are linear (5.5% delta to prev. frequency)
Highs 2 - 16 kHz
(+) | balanced highs - only 2% away from median
(+) | highs are linear (4.5% delta to prev. frequency)
Overall 100 - 16.000 Hz
(+) | overall sound is linear (10.2% difference to median)
Compared to same class
» 5% of all tested devices in this class were better, 2% similar, 93% worse
» The best had a delta of 5%, average was 19%, worst was 53%
Compared to all devices tested
» 3% of all tested devices were better, 1% similar, 96% worse
» The best had a delta of 4%, average was 25%, worst was 134%
| Off / Standby | |
| Idle | |
| Load |
|
| Battery Runtime - WiFi Websurfing | |
| HP 250 G5 Y1V08UT | |
| Acer Aspire E15 ES1-512-P1SM | |
| Asus F540SA-XX087T | |
| Acer Aspire ES1-533-P7WA | |
| Acer Aspire ES1-521-87DN | |
| Lenovo IdeaPad 300-15IBR | |
| Lenovo B50-70 MCC2GGE | |
| Lenovo B50-10 80QR0013GE | |
| Lenovo G51-35 80M8002HGE | |
Pros
Cons
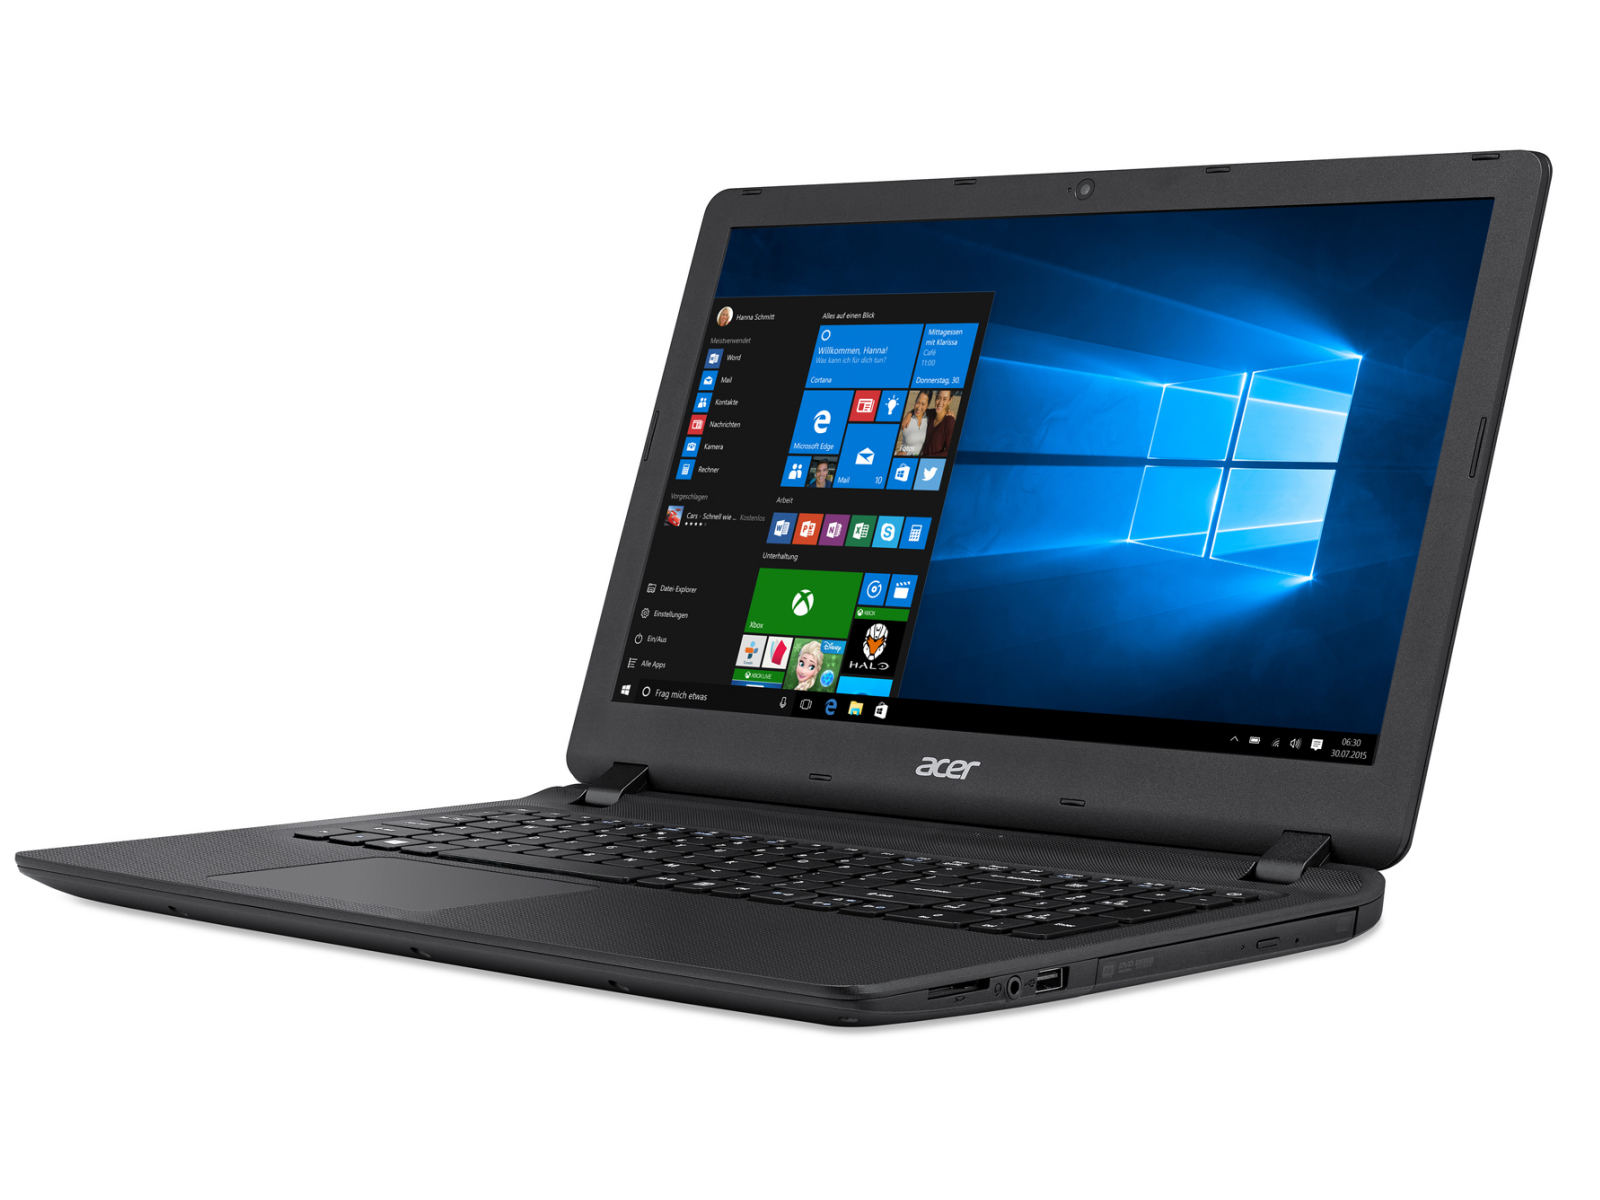
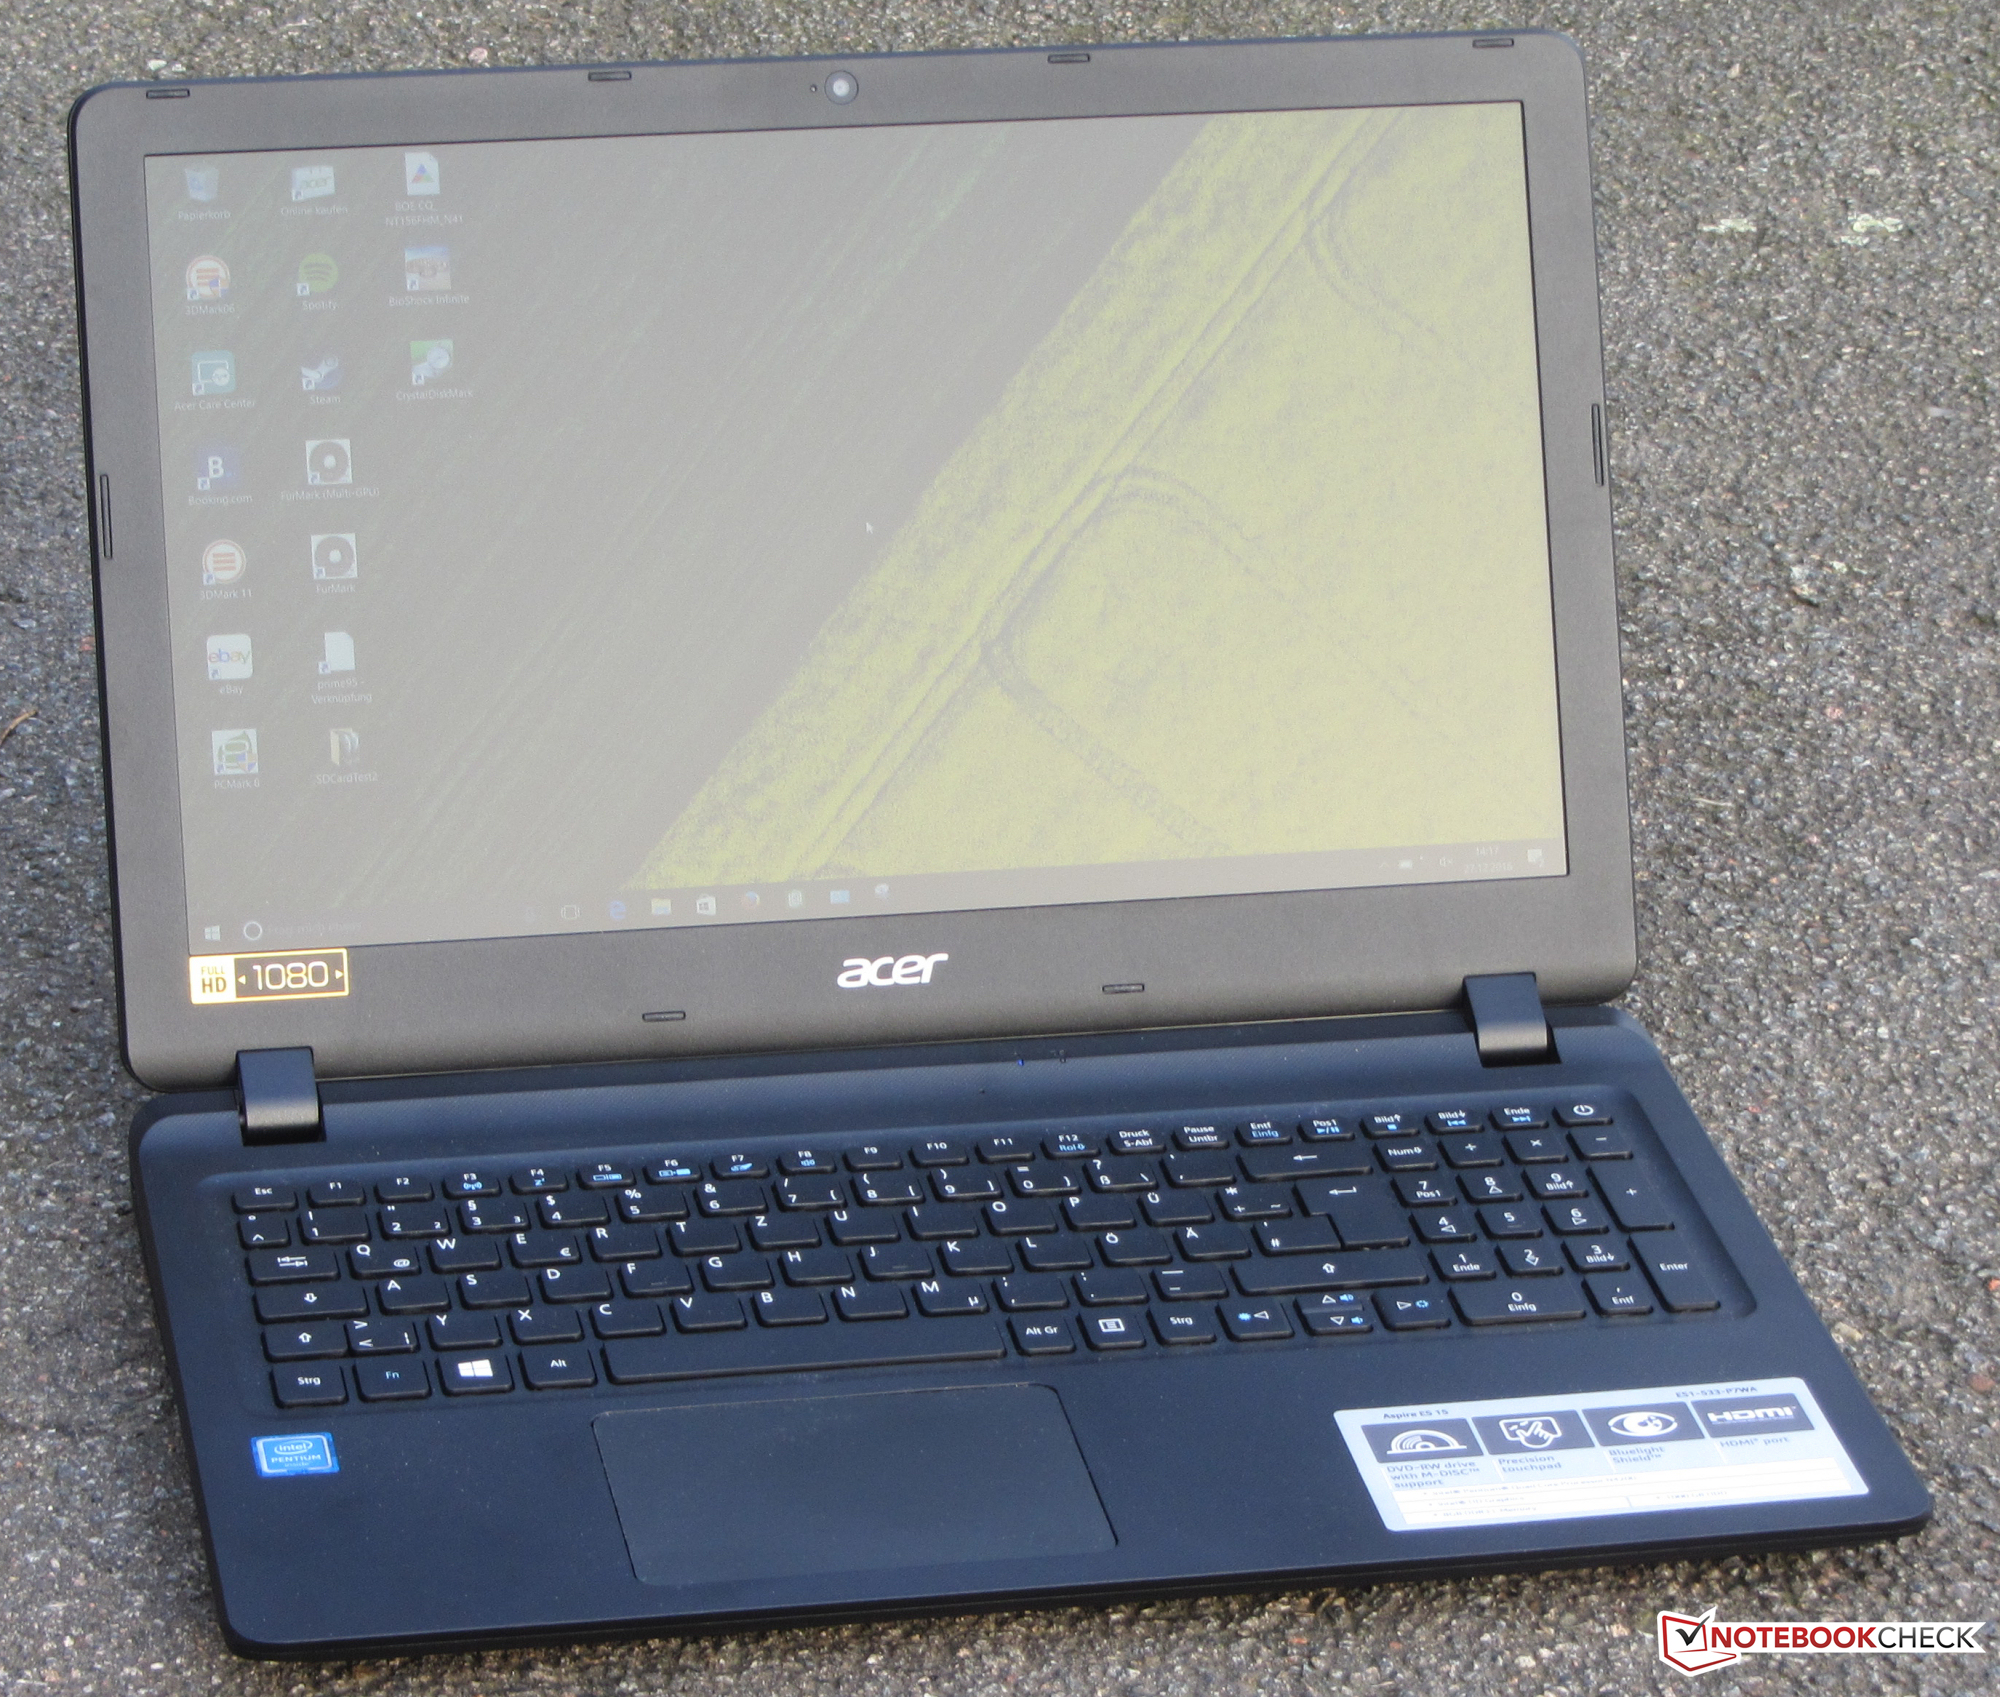
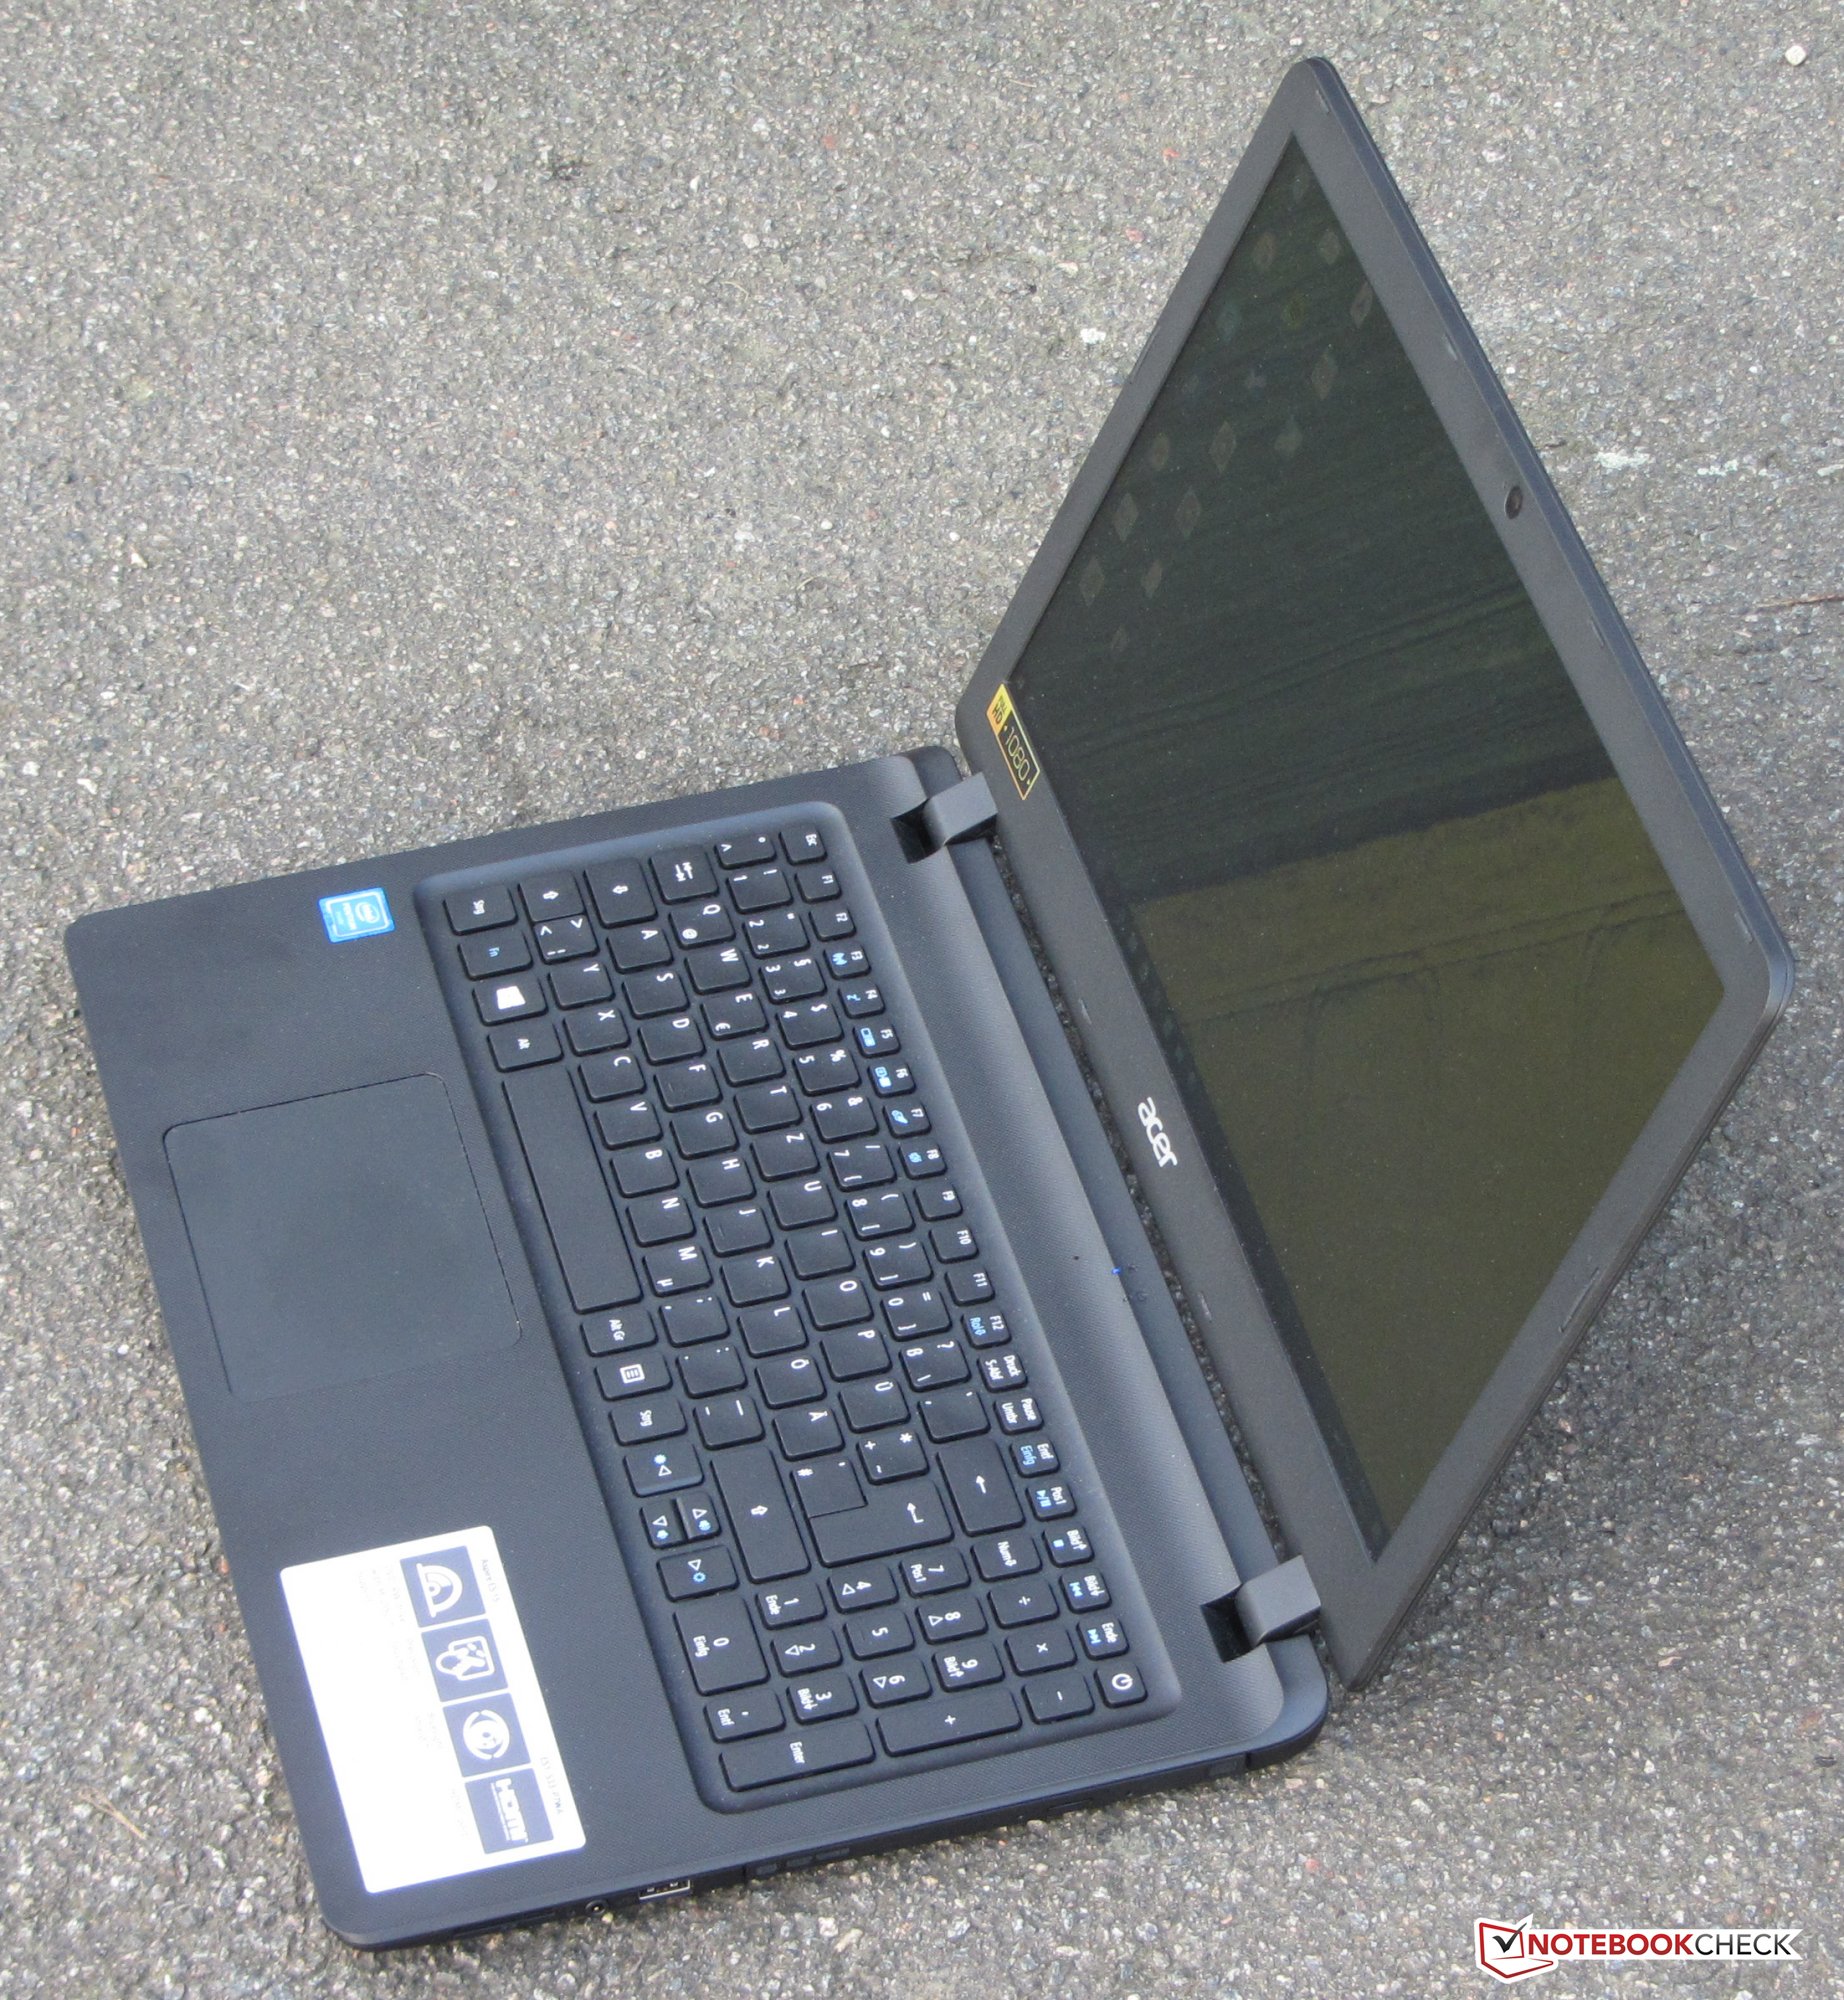
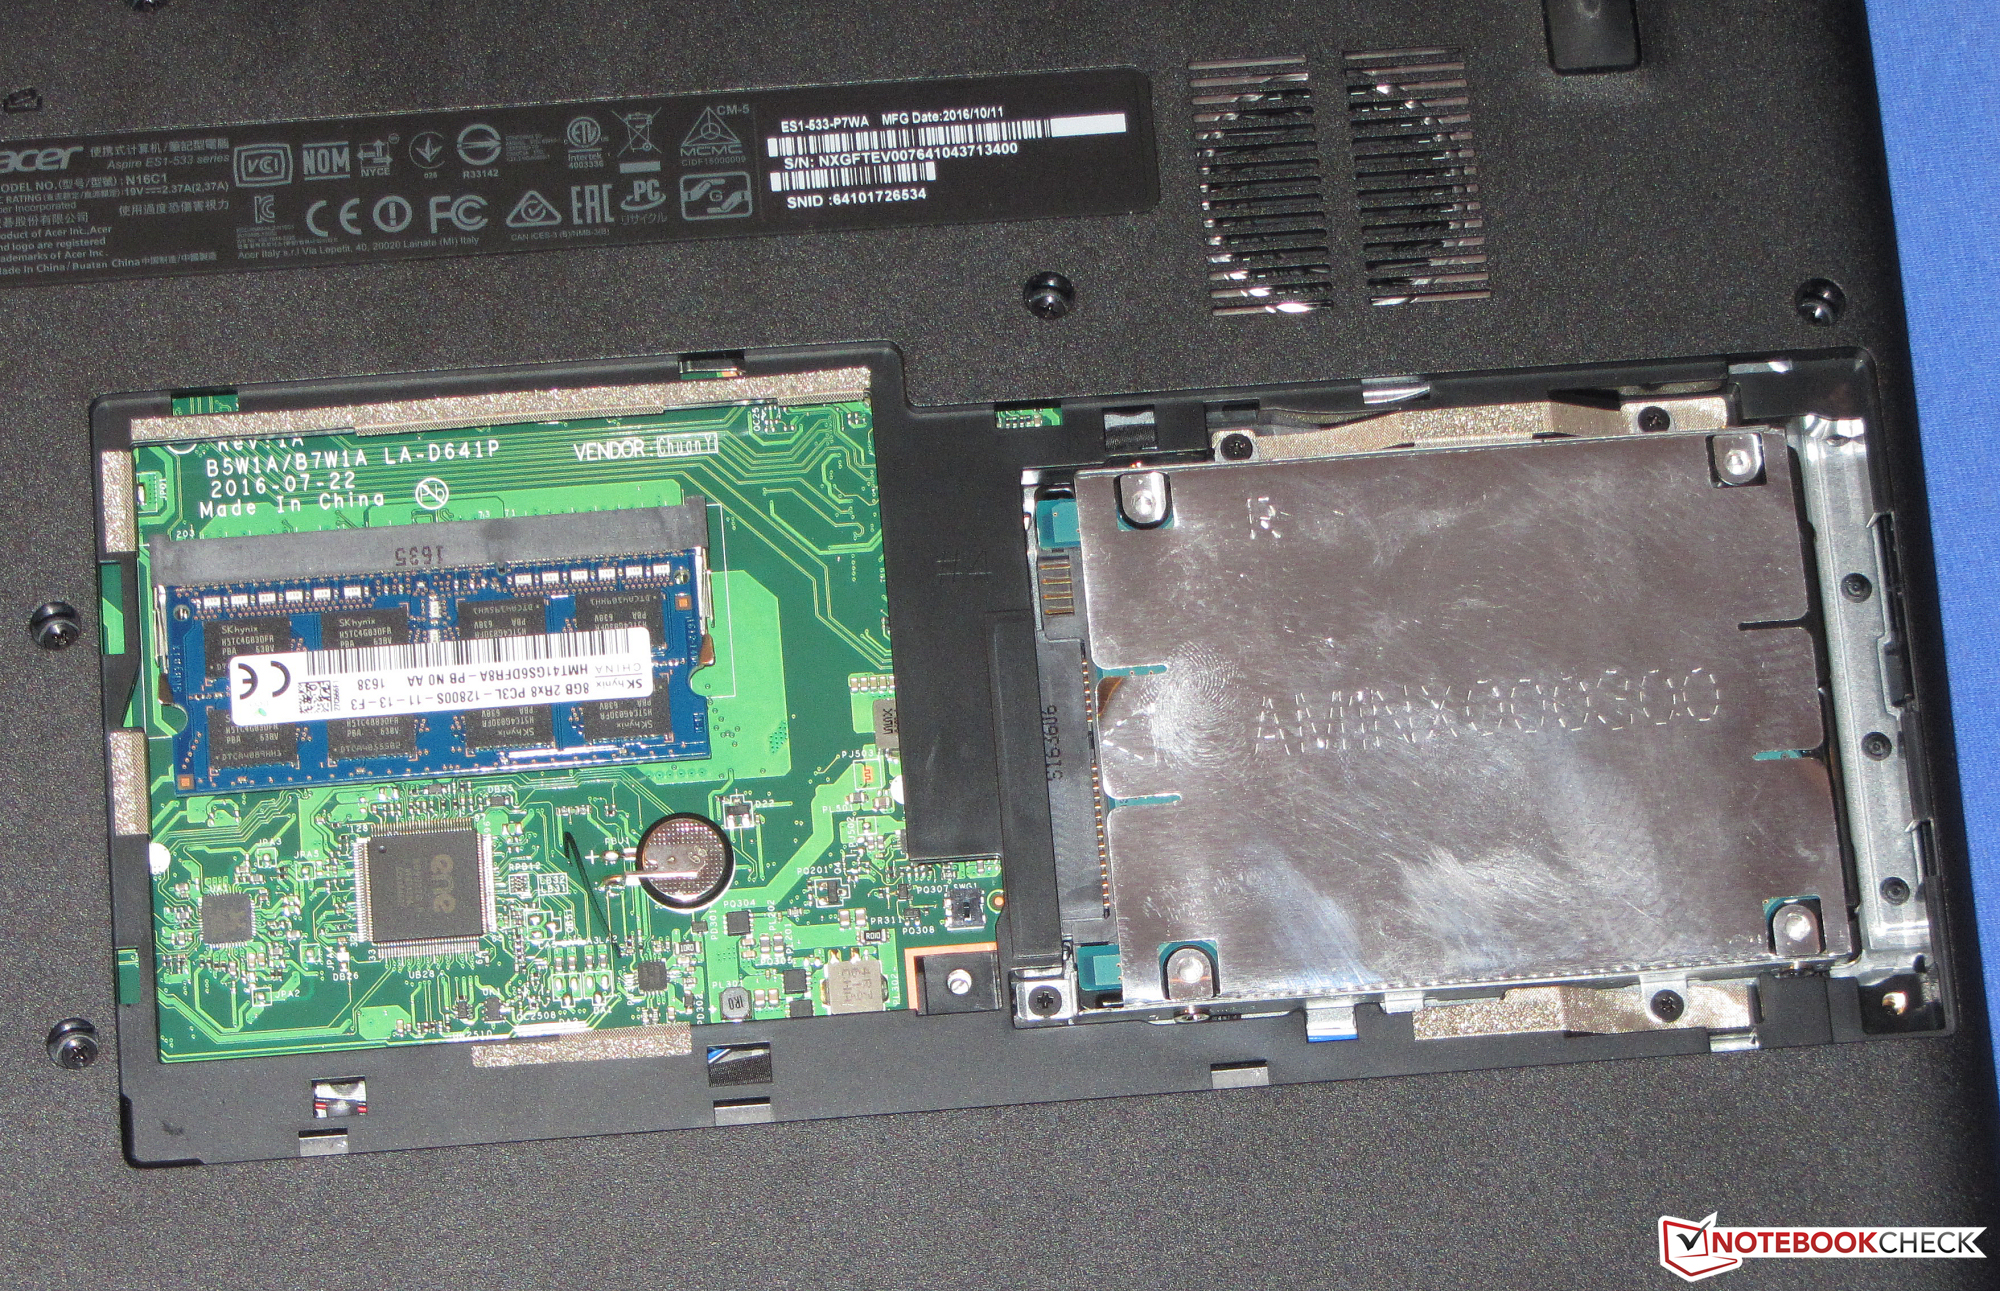
宏碁Aspire ES1-533-P7WA是一台简洁的15.6寸办公笔记本电脑,它采用了英特尔Apollo Lake平台。一颗四核处理器为办公软件和上网浏览提供了充足的性能。它的集成解码器能够支持常见的视频格式。这台笔记本电脑在运行中十分安静,几乎不会发热。这台测试机的1TB硬盘提供的存储空间十分充足。用户也可以通过打开维护底盖升级固态硬盘。它的键盘可能不是市场上最优秀的,不过可以满足家庭使用的需要。这台笔记本电脑的续航时间一般,不过用户可以得到两年的质保。
这台Aspire设备是一台适用于文字处理和上网浏览的简洁笔记本电脑。
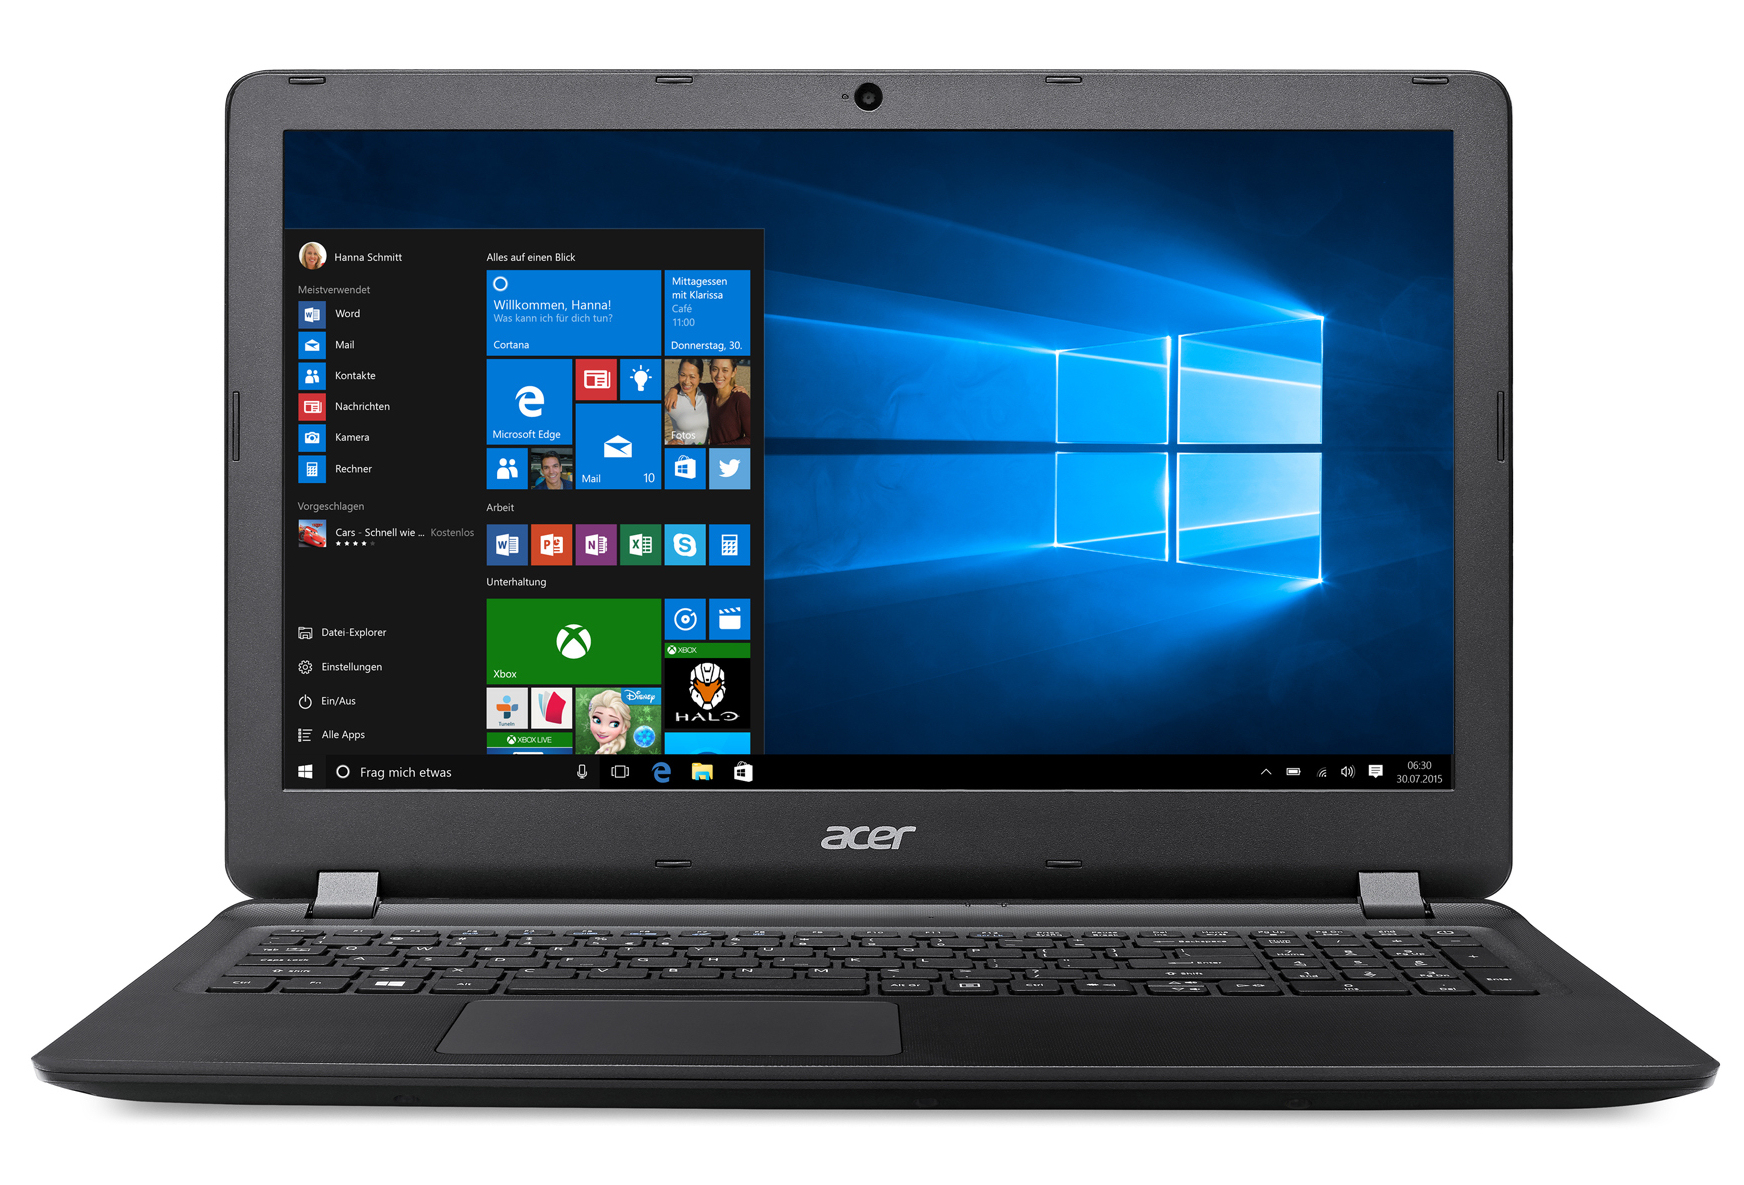
本应是它最大卖点的全高清屏幕反而成为了它最突出的缺点。宏碁选择了一块可视角度很窄的屏幕。不过还好生产商为它搭配的这块屏幕采用了磨砂表面,同时没有闪烁。
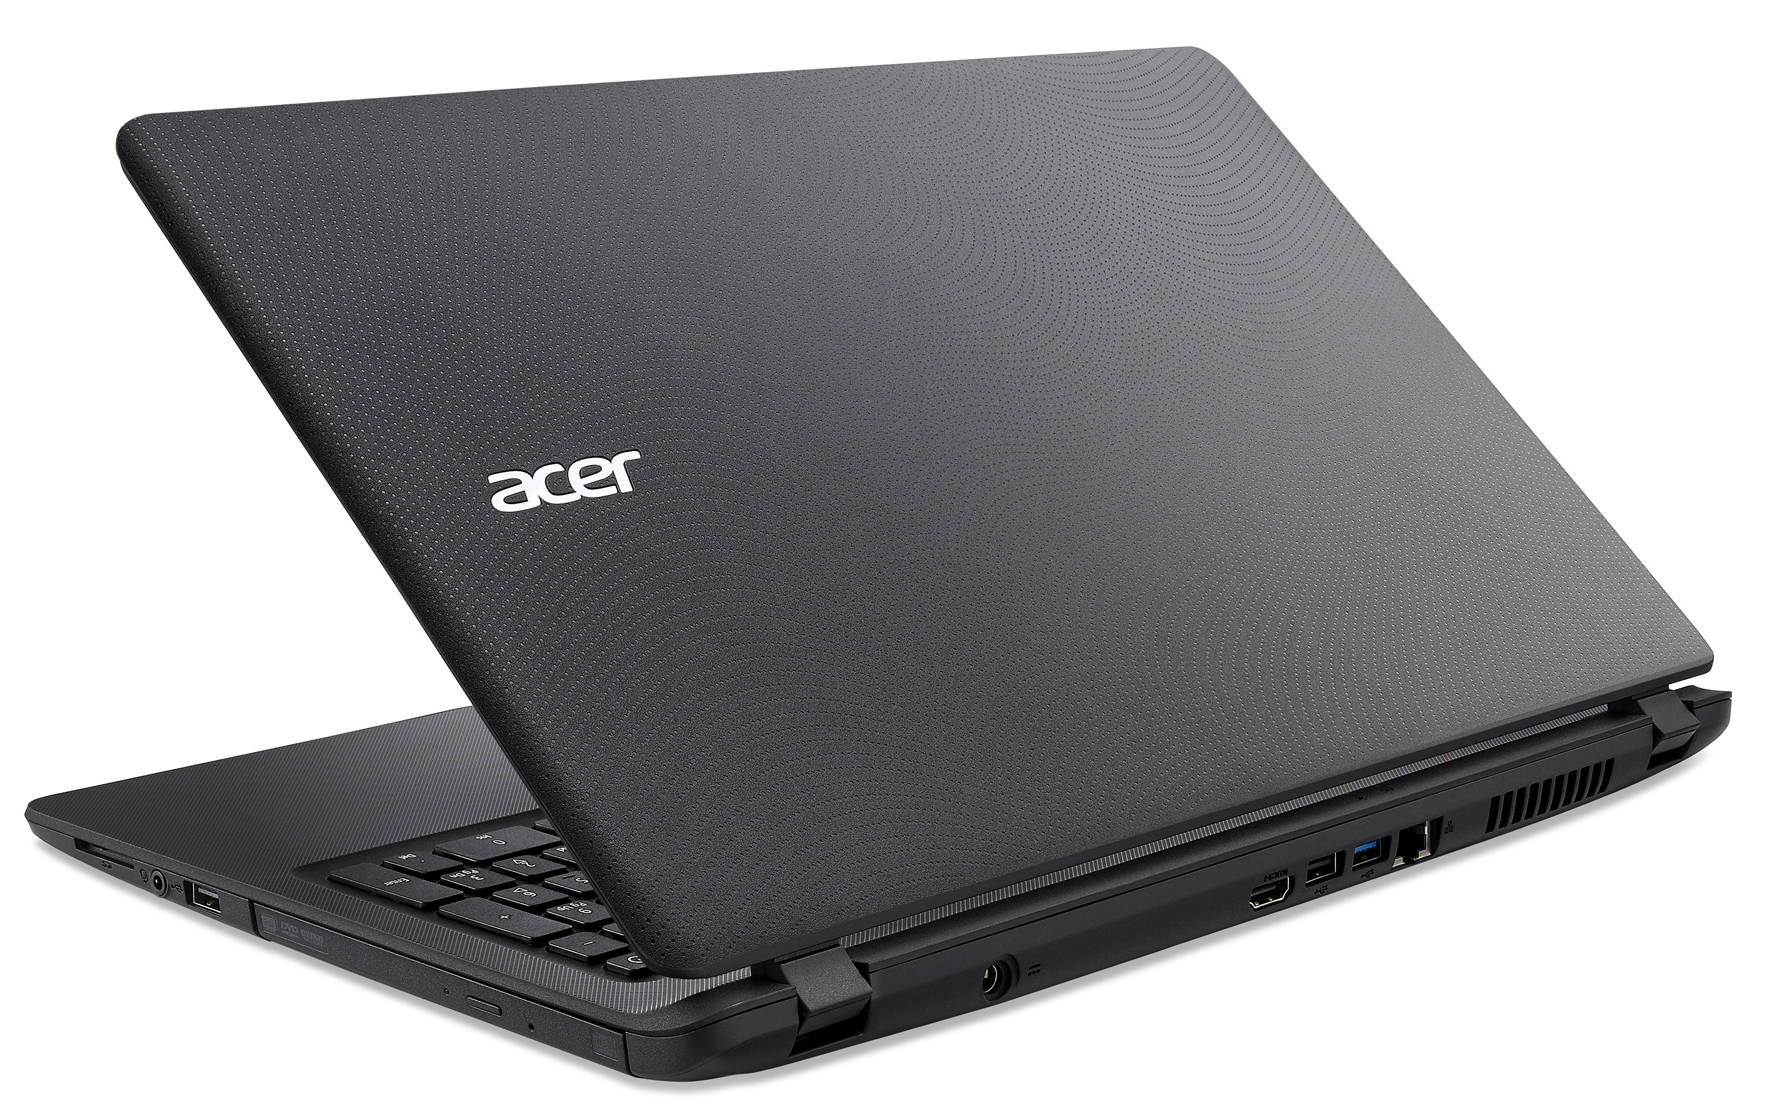
我们建议更喜欢固态硬盘的用户考虑一下Aspire ES1-533-P9CX。这台设备搭配了256GB固态硬盘而非机械硬盘,在连接性上它也和这台测试机十分相近。
注:本文是基于完整评测的缩减版本,阅读完整的英文评测,请点击这里。
Acer Aspire ES1-533-P7WA
-
12/30/2016 v6(old)
Sascha Mölck