 Deutsch
 English
 Español
 Français
 Italiano
 Nederlands
 Polski
 Português
 Русский
 Türkçe
 Svenska
 Chinese
 Magyar
Apple MacBook Pro 15 (2016年末, 2.7 GHz, 455) 笔记本电脑简短评测

| |||||||||||||||||||||||||
Brightness Distribution: 83 %
Center on Battery: 568 cd/m²
Contrast: 1912:1 (Black: 0.297 cd/m²)
ΔE Color 1.4 | 0.5-29.43 Ø5
ΔE Greyscale 2.3 | 0.57-98 Ø5.3
99.9% sRGB (Argyll 1.6.3 3D)
77.4% AdobeRGB 1998 (Argyll 1.6.3 3D)
86.4% AdobeRGB 1998 (Argyll 2.2.0 3D)
99.9% sRGB (Argyll 2.2.0 3D)
98.5% Display P3 (Argyll 2.2.0 3D)
Gamma: 2.29
| Apple MacBook Pro 15 2016 (2.7 GHz, 455) APPA031, , 2880x1800, 15.40 | Apple MacBook Pro 15 2016 (2.9 GHz, 460) Apple APPA030, , 2880x1800, 15.40 | Apple MacBook Pro 15 2016 (2.6 GHz, 450) 2880x1800, 15.40 | Apple MacBook Pro Retina 15 inch 2015-05 APPA02E, , 2880x1800, 15.40 | Dell XPS 15-9550 i7 SHARP LQ156D1JX01 Dell PN: 7PHPT, , 3840x2160, 15.60 | Dell XPS 15 2017 9560 (7300HQ, Full-HD) Sharp SHP1453 LQ156M1, , 1920x1080, 15.60 | |
|---|---|---|---|---|---|---|
| Display | 1% | -25% | 1% | -16% | ||
| Display P3 Coverage | 98.5 | 99 1% | 61.4 -38% | 87.8 -11% | 68.9 -30% | |
| sRGB Coverage | 99.9 | 100 0% | 90.8 -9% | 100 0% | 98.9 -1% | |
| AdobeRGB 1998 Coverage | 86.4 | 87.3 1% | 62.9 -27% | 99.4 15% | 70.9 -18% | |
| Response Times | -21% | 9% | -7% | -25% | ||
| Response Time Grey 50% / Grey 80% * | 46.4 ? | 46 ? 1% | 47.3 ? -2% | 58 ? -25% | 54 ? -16% | |
| Response Time Black / White * | 39.2 ? | 56 ? -43% | 31.2 ? 20% | 35 ? 11% | 52.4 ? -34% | |
| PWM Frequency | 119000 ? | 117000 ? | ||||
| Screen | -32% | -3% | -23% | -57% | -85% | |
| Brightness middle | 568 | 420 -26% | 483 -15% | 341 -40% | 361 -36% | 400 -30% |
| Brightness | 532 | 401 -25% | 465 -13% | 315 -41% | 344 -35% | 392 -26% |
| Brightness Distribution | 83 | 90 8% | 92 11% | 82 -1% | 90 8% | 89 7% |
| Black Level * | 0.297 | 0.3 -1% | 0.33 -11% | 0.34 -14% | 0.38 -28% | 0.26 12% |
| Contrast | 1912 | 1400 -27% | 1464 -23% | 1003 -48% | 950 -50% | 1538 -20% |
| Colorchecker dE 2000 * | 1.4 | 3.33 -138% | 1.4 -0% | 2.07 -48% | 5.34 -281% | 4.9 -250% |
| Colorchecker dE 2000 max. * | 2.7 | 5.11 -89% | 3 -11% | 3.27 -21% | 11 -307% | |
| Greyscale dE 2000 * | 2.3 | 2.73 -19% | 1.5 35% | 1.9 17% | 4.84 -110% | 7.2 -213% |
| Gamma | 2.29 96% | 2.48 89% | 2.34 94% | 2.62 84% | 2.21 100% | 2.11 104% |
| CCT | 7165 91% | 6457 101% | 6650 98% | 6514 100% | 7395 88% | 6911 94% |
| Color Space (Percent of AdobeRGB 1998) | 77.4 | 78.09 1% | 58 -25% | 89 15% | 64.2 -17% | |
| Color Space (Percent of sRGB) | 99.9 | 99.97 0% | 91 -9% | 100 0% | 98.9 -1% | |
| Total Average (Program / Settings) | -17% /
-24% | 3% /
-1% | -24% /
-23% | -21% /
-38% | -42% /
-63% |
* ... smaller is better
Display Response Times
| ↔ Response Time Black to White | ||
|---|---|---|
| 39.2 ms ... rise ↗ and fall ↘ combined | ↗ 7.6 ms rise | 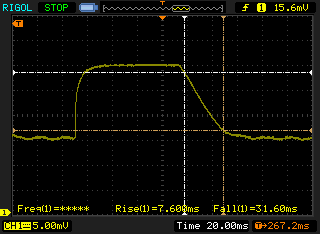 |
| ↘ 31.6 ms fall | ||
| The screen shows slow response rates in our tests and will be unsatisfactory for gamers. In comparison, all tested devices range from 0.1 (minimum) to 240 (maximum) ms. » 96 % of all devices are better. This means that the measured response time is worse than the average of all tested devices (21.5 ms). | ||
| ↔ Response Time 50% Grey to 80% Grey | ||
| 46.4 ms ... rise ↗ and fall ↘ combined | ↗ 18.8 ms rise | 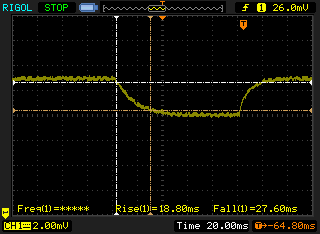 |
| ↘ 27.6 ms fall | ||
| The screen shows slow response rates in our tests and will be unsatisfactory for gamers. In comparison, all tested devices range from 0.2 (minimum) to 636 (maximum) ms. » 77 % of all devices are better. This means that the measured response time is worse than the average of all tested devices (33.7 ms). | ||
Screen Flickering / PWM (Pulse-Width Modulation)
| Screen flickering / PWM not detected | ||
In comparison: 53 % of all tested devices do not use PWM to dim the display. If PWM was detected, an average of 17915 (minimum: 5 - maximum: 3846000) Hz was measured. | ||
| PCMark 8 Home Score Accelerated v2 | 3728 points | |
| PCMark 8 Creative Score Accelerated v2 | 4569 points | |
| PCMark 8 Work Score Accelerated v2 | 4522 points | |
Help | ||

| 3DMark 06 Standard Score | 25873 points | |
| 3DMark Vantage P Result | 16522 points | |
| 3DMark 11 Performance | 5774 points | |
| 3DMark Cloud Gate Standard Score | 15766 points | |
| 3DMark Fire Strike Score | 3463 points | |
| 3DMark Time Spy Score | 1254 points | |
Help | ||
| Rise of the Tomb Raider - 1920x1080 High Preset AA:FX AF:4x | |
| Acer Aspire VX5-591G-D0DD | |
| HP Omen 15-ax007ng | |
| Asus Strix GL753VD-GC045T | |
| HP Pavilion 17 FHD V3A33AV | |
| Apple MacBook Pro 15 2016 (2.9 GHz, 460) | |
| Apple MacBook Pro 15 2016 (2.7 GHz, 455) | |
| Apple MacBook Pro 15 2016 (2.6 GHz, 450) | |
| Apple MacBook Pro 15 2016 (2.6 GHz, 450) | |
| The Witcher 3 - 1920x1080 High Graphics & Postprocessing (Nvidia HairWorks Off) | |
| Acer Aspire VX5-591G-D0DD | |
| Dell XPS 15 2017 9560 (7300HQ, Full-HD) | |
| Asus Strix GL753VD-GC045T | |
| Apple MacBook Pro 15 2016 (2.9 GHz, 460) | |
| Apple MacBook Pro 15 2016 (2.7 GHz, 455) | |
| Apple MacBook Pro 15 2016 (2.6 GHz, 450) | |
| Apple MacBook Pro Retina 15 inch 2015-05 | |
| Anno 2205 - 1920x1080 High Preset AA:4x | |
| Asus Strix GL753VD-GC045T | |
| Apple MacBook Pro 15 2016 (2.9 GHz, 460) | |
| Apple MacBook Pro 15 2016 (2.6 GHz, 450) | |
| Apple MacBook Pro 15 2016 (2.7 GHz, 455) | |
| Call of Duty Infinite Warfare - 1920x1080 High / On AA:FX | |
| SCHENKER XMG P507 PRO | |
| Asus Strix GL753VD-GC045T | |
| Apple MacBook Pro 15 2016 (2.9 GHz, 460) | |
| Apple MacBook Pro 15 2016 (2.7 GHz, 455) | |
| Apple MacBook Pro 15 2016 (2.6 GHz, 450) | |
| low | med. | high | ultra | 4K | |
| Counter-Strike: GO (2012) | 145 | ||||
| BioShock Infinite (2013) | 230 | 37.8 | |||
| Sims 4 (2014) | 50.6 | ||||
| GTA V (2015) | 37.1 | 11.1 | |||
| The Witcher 3 (2015) | 69.5 | 24.6 | 14.2 | ||
| Dota 2 Reborn (2015) | 67.2 | 61.5 | 22.8 | ||
| World of Warships (2015) | 188 | 70.7 | 53 | ||
| Anno 2205 (2015) | 86 | 17.5 | 7.7 | ||
| Fallout 4 (2015) | 27.8 | ||||
| Rainbow Six Siege (2015) | 162 | 52.7 | 33.7 | ||
| Rise of the Tomb Raider (2016) | 84 | 24.9 | 18.3 | ||
| XCOM 2 (2016) | 70 | 27.2 | 17.9 | 5.9 | |
| Far Cry Primal (2016) | 70 | 32 | 30 | 20 | |
| The Division (2016) | 88 | 25.2 | 18.5 | ||
| Hitman 2016 (2016) | 75 | 20.4 | |||
| Ashes of the Singularity (2016) | 33.8 | 21.3 | 19.3 | ||
| Doom (2016) | 53.1 | 19.8 | |||
| Overwatch (2016) | 178 | 65.8 | 30.1 | 18.7 | |
| Deus Ex Mankind Divided (2016) | 59.5 | 21.5 | 8.9 | ||
| FIFA 17 (2016) | 107 | ||||
| Mafia 3 (2016) | 32.8 | 15.1 | |||
| Battlefield 1 (2016) | 109 | 28.9 | 25.3 | ||
| Civilization VI (2016) | 69 | 28.8 | 21.6 | ||
| Farming Simulator 17 (2016) | 71.7 | 25.8 | 22.8 | ||
| Titanfall 2 (2016) | 33.1 | 28.8 | |||
| Call of Duty Infinite Warfare (2016) | 40.2 | 34.4 | |||
| Dishonored 2 (2016) | 44.1 | 20.6 | |||
| Watch Dogs 2 (2016) | 54.4 | 20.7 | |||
| Resident Evil 7 (2017) | 146 | 59.4 | 34.6 | 19.7 |
Noise Level
| Idle |
| 30.8 / 30.8 / 30.8 dB(A) |
| HDD |
| 30.8 dB(A) |
| Load |
| 38.7 / 48.8 dB(A) |
 | ||
30 dB silent 40 dB(A) audible 50 dB(A) loud |
||
min: | ||
| 6820HQ, Radeon Pro 455 Radeon Pro 455, 6820HQ, Apple SSD SM0512L | 6920HQ, Radeon Pro 460 Radeon Pro 460, 6920HQ, Apple SSD SM1024L | 6700HQ, Radeon Pro 450 Radeon Pro 450, 6700HQ, Apple SSD SM0256L | 4870HQ, Radeon R9 M370X Radeon R9 M370X, 4870HQ, Apple SSD SM0512G | 6700HQ, GeForce GTX 960M GeForce GTX 960M, 6700HQ, Samsung PM951 NVMe 512 GB | i5-7300HQ, GeForce GTX 1050 Mobile GeForce GTX 1050 Mobile, i5-7300HQ, WDC WD10SPCX-75KHST0 + SanDisk Z400s M.2 2242 32 GB Cache | |
|---|---|---|---|---|---|---|
| Noise | 4% | 3% | 1% | -6% | -6% | |
| off / environment * | 30.4 | 29 5% | 30.4 -0% | 30.3 -0% | ||
| Idle Minimum * | 30.8 | 30.3 2% | 30.6 1% | 28.9 6% | 31.4 -2% | 31.6 -3% |
| Idle Average * | 30.8 | 30.3 2% | 30.6 1% | 28.9 6% | 32.5 -6% | 31.6 -3% |
| Idle Maximum * | 30.8 | 30.3 2% | 30.6 1% | 28.9 6% | 33.6 -9% | 33.4 -8% |
| Load Average * | 38.7 | 35.1 9% | 34.7 10% | 46 -19% | 45.2 -17% | 47.8 -24% |
| Load Maximum * | 48.8 | 46 6% | 46.3 5% | 46 6% | 46 6% | 47.8 2% |
* ... smaller is better
(-) The maximum temperature on the upper side is 46 °C / 115 F, compared to the average of 36.9 °C / 98 F, ranging from 21.1 to 71 °C for the class Multimedia.
(+) The bottom heats up to a maximum of 39 °C / 102 F, compared to the average of 39.1 °C / 102 F
(+) The palmrests and touchpad are cooler than skin temperature with a maximum of 29 °C / 84.2 F and are therefore cool to the touch.
(±) The average temperature of the palmrest area of similar devices was 28.8 °C / 83.8 F (-0.2 °C / -0.4 F).
| Apple MacBook Pro 15 2016 (2.7 GHz, 455) 6820HQ, Radeon Pro 455 | Apple MacBook Pro 15 2016 (2.9 GHz, 460) 6920HQ, Radeon Pro 460 | Apple MacBook Pro 15 2016 (2.6 GHz, 450) 6700HQ, Radeon Pro 450 | Apple MacBook Pro Retina 15 inch 2015-05 4870HQ, Radeon R9 M370X | Dell XPS 15-9550 i7 6700HQ, GeForce GTX 960M | Dell XPS 15 2017 9560 (7300HQ, Full-HD) i5-7300HQ, GeForce GTX 1050 Mobile | |
|---|---|---|---|---|---|---|
| Heat | -2% | 2% | 3% | -25% | -6% | |
| Maximum Upper Side * | 46 | 44.2 4% | 43 7% | 43.2 6% | 55.9 -22% | 47.6 -3% |
| Maximum Bottom * | 39 | 41.6 -7% | 40 -3% | 39 -0% | 50 -28% | 42.1 -8% |
| Idle Upper Side * | 33.6 | 26 | 30 | 28.1 | 29.9 | |
| Idle Bottom * | 31.1 | 25 | 29.3 | 27.9 | 29.8 |
* ... smaller is better
| Idle | |
| Load |
|
| Apple MacBook Pro 15 2016 (2.7 GHz, 455) 6820HQ, Radeon Pro 455 | Apple MacBook Pro 15 2016 (2.9 GHz, 460) 6920HQ, Radeon Pro 460 | Apple MacBook Pro 15 2016 (2.6 GHz, 450) 6700HQ, Radeon Pro 450 | Apple MacBook Pro Retina 15 inch 2015-05 4870HQ, Radeon R9 M370X | Dell XPS 15-9550 i7 6700HQ, GeForce GTX 960M | Dell XPS 15 2017 9560 (7300HQ, Full-HD) i5-7300HQ, GeForce GTX 1050 Mobile | |
|---|---|---|---|---|---|---|
| Power Consumption | 1% | 8% | -25% | -97% | -23% | |
| Idle Minimum * | 4 | 3 25% | 2.9 27% | 6 -50% | 12.5 -213% | 6.6 -65% |
| Idle Average * | 10.9 | 9.9 9% | 9.7 11% | 12.8 -17% | 19.6 -80% | 9 17% |
| Idle Maximum * | 10.9 | 12.5 -15% | 10.1 7% | 13.3 -22% | 22.8 -109% | 10.7 2% |
| Load Average * | 64.6 | 70.6 -9% | 65 -1% | 82.4 -28% | 102 -58% | 77.5 -20% |
| Load Maximum * | 86.7 | 90.8 -5% | 89.5 -3% | 91.8 -6% | 107 -23% | 130 -50% |
* ... smaller is better
| Apple MacBook Pro 15 2016 (2.7 GHz, 455) 6820HQ, Radeon Pro 455, 76 Wh | Apple MacBook Pro 15 2016 (2.9 GHz, 460) 6920HQ, Radeon Pro 460, 76 Wh | Apple MacBook Pro 15 2016 (2.6 GHz, 450) 6700HQ, Radeon Pro 450, 76 Wh | Apple MacBook Pro Retina 15 inch 2015-05 4870HQ, Radeon R9 M370X, 100 Wh | Dell XPS 15-9550 i7 6700HQ, GeForce GTX 960M, 84 Wh | Dell XPS 15 2017 9560 (7300HQ, Full-HD) i5-7300HQ, GeForce GTX 1050 Mobile, 56 Wh | |
|---|---|---|---|---|---|---|
| Battery Runtime | -4% | -2% | 31% | 40% | 4% | |
| WiFi v1.3 | 637 | 619 -3% | 602 -5% | 432 -32% | 309 -51% | 334 -48% |
| Load | 54 | 52 -4% | 55 2% | 105 94% | 125 131% | 84 56% |
| H.264 | 547 | 516 | 413 | 318 | ||
| Reader / Idle | 1039 | 528 | 565 |
Pros
Cons
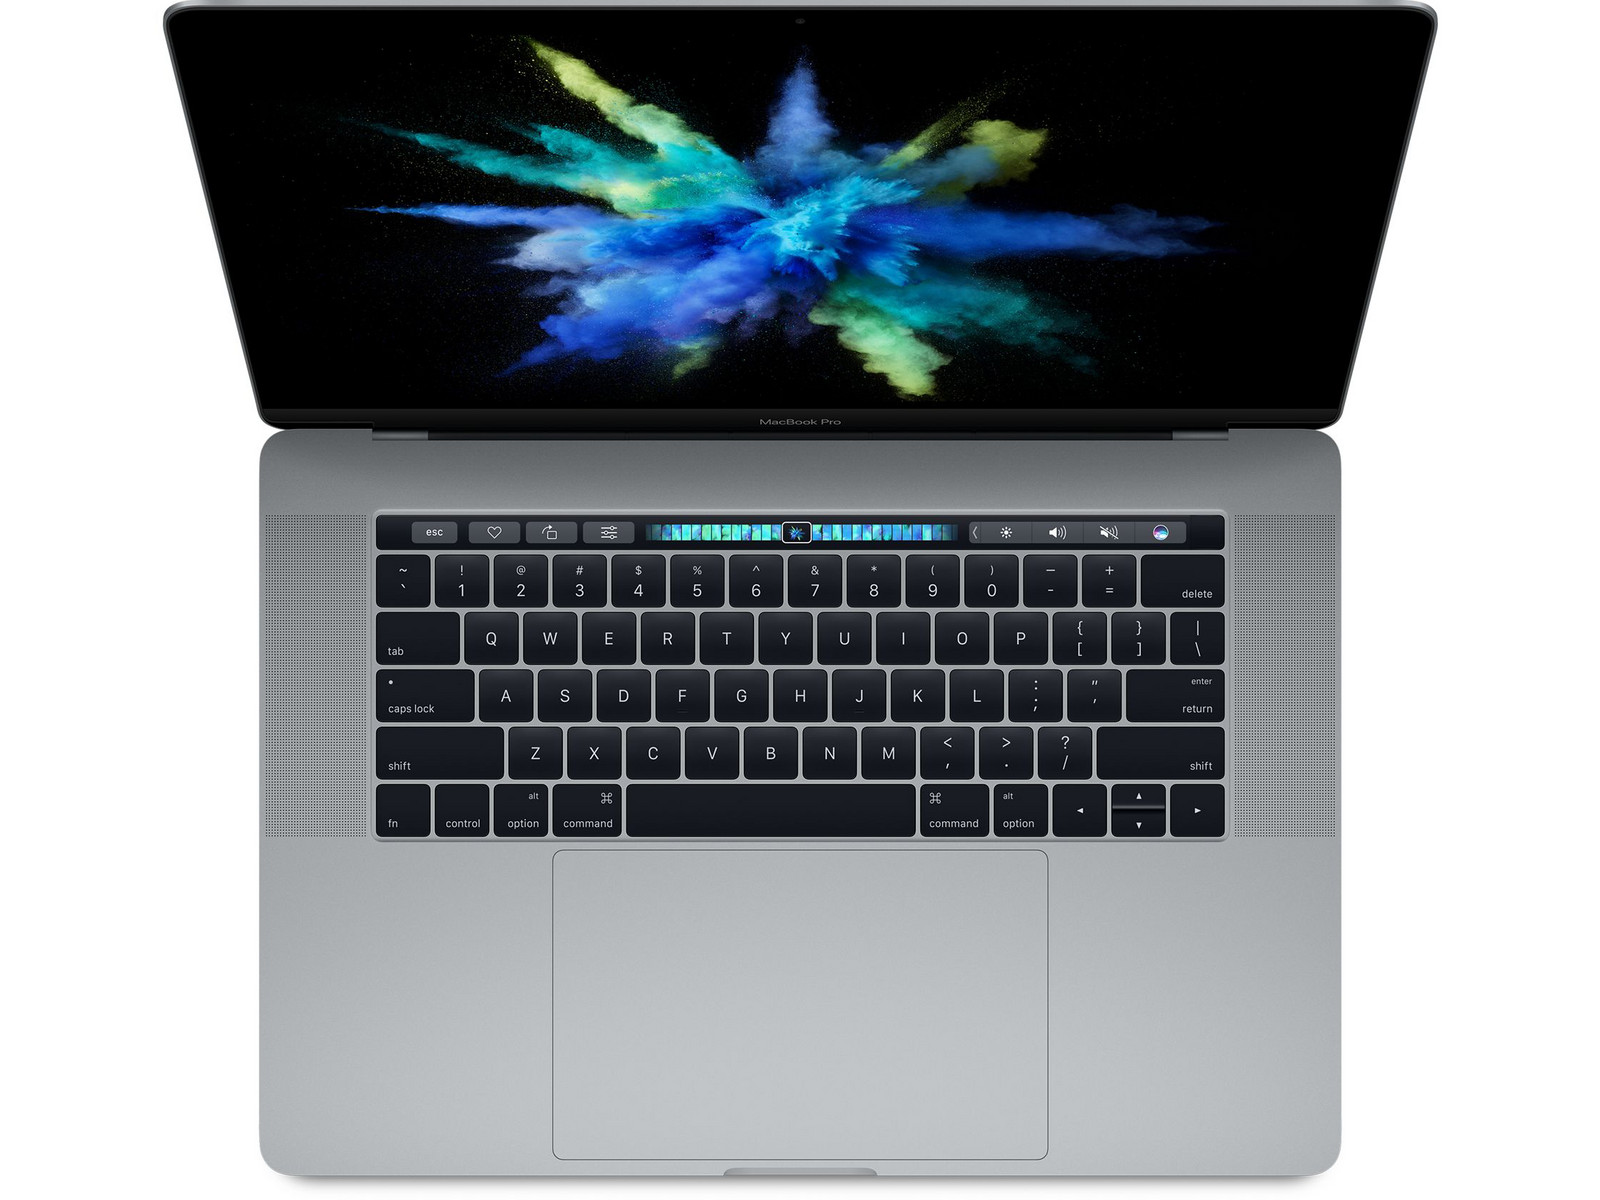
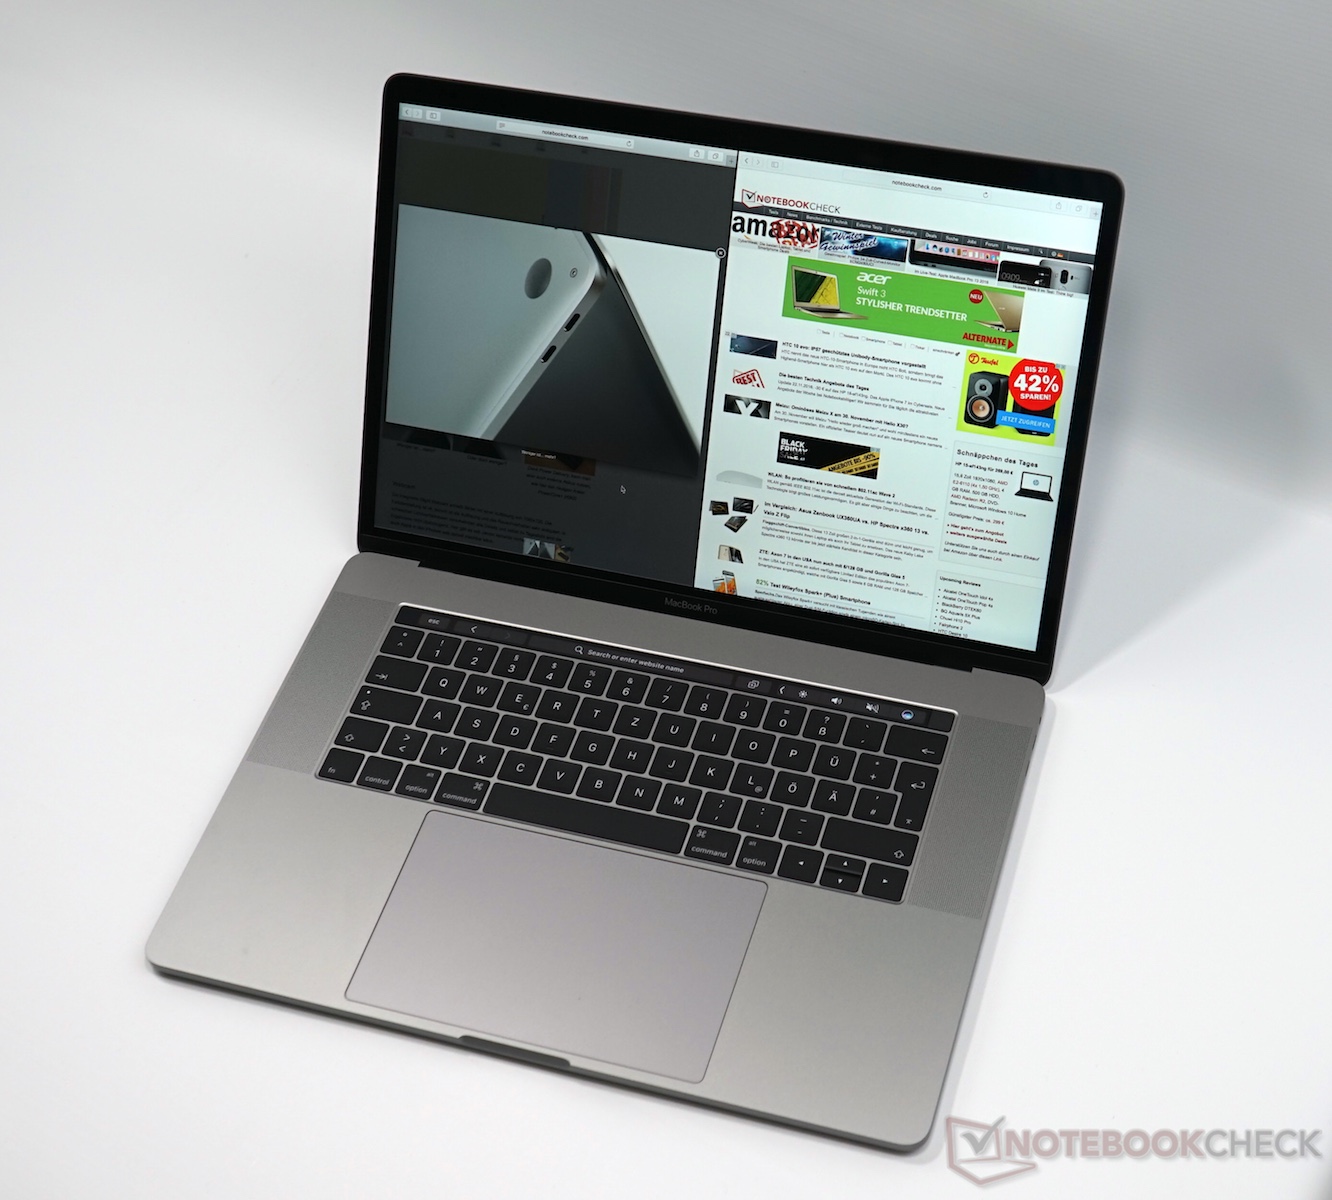
Apple MacBook Pro 15的第三个配置型号的评测带来了让我们意想不到的结论。不过,这并不是指它的更快硬件。这台售价2799欧元的主流机型的处理器相比入门机型高100MHz,也相应带来了个位数的优势,不过在实际使用中则很难察觉到。
它的AMD Radeon Pro 455显卡介于450和460之间,实际表现也属于意料之中。但是由于搭配了较小的显存(2GB GDDR5),它的性能更接近于入门级的Radeon Pro 450。如果你对于Radeon Pro 450的性能不满意的话,可能升级到更强大的搭配4GB GDDR5显存的460是个更好的选择。
我们所说的惊喜来自于它的屏幕,这块型号略有不同(APPA031)的屏幕面板带来了更高的亮度。它的黑值却没有受到负面影响,因此对比度的数据也有所提高。目前看来你会得到哪个批次的面板完全要靠运气。入门级和高配版本都搭配了同样的较暗屏幕,因此看来这和硬件配置没有直接的关系。
我们在评测开始时提出了它是否值得升级的问题。到现在为止我们会给出的回答大概是“看情况”。它的处理器几乎并没有太大的优势,而需要性能的用户大概会考虑选择更强劲的酷睿i7-6920HQ,对于显卡来说也是如此。不过这个升级还包括了512GB固态硬盘,且官网的预配置型号通常相对便宜,因此如果你只是想要更大容量硬盘的话它也值得考虑。Apple MacBook Pro 15其他型号的优缺点对它来说依然存在,因此我们建议用户阅读我们对它的入门机型的评测。
- Apple MacBook Pro 15 Late 2016 review (2.6 GHz, Radeon Pro 450)
- Apple MacBook Pro 15 Late 2016 review (2.9 GHz, Radeon Pro 460)
注:本文是基于完整评测的缩减版本,阅读完整的英文评测,请点击这里。
Apple MacBook Pro 15 2016 (2.7 GHz, 455)
-
02/13/2017 v6(old)
Klaus A. Hinum, Andreas Osthoff
Pricecompare
