 Deutsch
 English
 Español
 Français
 Italiano
 Nederlands
 Polski
 Português
 Русский
 Türkçe
 Svenska
 Chinese
 Magyar
Aorus X5 v6 笔记本电脑简短评测


| SD Card Reader | |
| average JPG Copy Test (av. of 3 runs) | |
| MSI GT72VR 6RD-063US | |
| Aorus X5 v6 | |
| MSI GS73VR 6RF | |
| maximum AS SSD Seq Read Test (1GB) | |
| MSI GT72VR 6RD-063US | |
| Aorus X5 v6 | |
| MSI GS73VR 6RF | |
| Networking | |
| iperf Server (receive) TCP 1 m 512KB | |
| Eurocom Sky X7E2 | |
| MSI GT72VR 6RD-063US | |
| Aorus X5 v6 | |
| iperf Client (transmit) TCP 1 m 512KB | |
| MSI GT72VR 6RD-063US | |
| Eurocom Sky X7E2 | |
| Aorus X5 v6 | |
| |||||||||||||||||||||||||
Brightness Distribution: 83 %
Center on Battery: 280.4 cd/m²
Contrast: 1126:1 (Black: 0.249 cd/m²)
ΔE Color 4.94 | 0.5-29.43 Ø5
ΔE Greyscale 5.13 | 0.57-98 Ø5.3
85.9% sRGB (Argyll 1.6.3 3D)
55.9% AdobeRGB 1998 (Argyll 1.6.3 3D)
62.5% AdobeRGB 1998 (Argyll 2.2.0 3D)
86.2% sRGB (Argyll 2.2.0 3D)
62.5% Display P3 (Argyll 2.2.0 3D)
Gamma: 2.26
| Aorus X5 v6 IPS, 15.60, 2880x1620 | Asus Strix GL502VS-FY032T LG Philips LP156WF6-SPB6 (LGD046F), IPS, 15.60, 1920x1080 | MSI GS63VR-6RF16H22 Stealth Pro Samsung 156HL01-104 (SDC324C) , IPS, 15.60, 1920x1080 | Gigabyte P35X v5 SHP144E , IPS, 15.60, 3840x2160 | MSI GT62VR-6RE16H21 LG Philips LP156WF6 (LGD046F), IPS, 15.60, 1920x1080 | |
|---|---|---|---|---|---|
| Display | -1% | 11% | 7% | 0% | |
| Display P3 Coverage | 62.5 | 64.5 3% | 67.8 8% | 64.8 4% | 64.6 3% |
| sRGB Coverage | 86.2 | 83.1 -4% | 97.4 13% | 95.8 11% | 84.6 -2% |
| AdobeRGB 1998 Coverage | 62.5 | 60.8 -3% | 69.7 12% | 66.9 7% | 61.8 -1% |
| Response Times | 8% | 11% | -24% | 16% | |
| Response Time Grey 50% / Grey 80% * | 34 ? | 38 ? -12% | 51.2 ? -51% | 34 ? -0% | |
| Response Time Black / White * | 32 ? | 23 ? 28% | 26 ? 19% | 39.2 ? -23% | 22 ? 31% |
| PWM Frequency | 198.4 | 202 ? 2% | 200 ? 1% | ||
| Screen | -2% | 6% | -18% | 6% | |
| Brightness middle | 280.4 | 315 12% | 293 4% | 278.9 -1% | 273 -3% |
| Brightness | 271 | 290 7% | 279 3% | 272 0% | 278 3% |
| Brightness Distribution | 83 | 85 2% | 84 1% | 80 -4% | 88 6% |
| Black Level * | 0.249 | 0.32 -29% | 0.33 -33% | 0.562 -126% | 0.27 -8% |
| Contrast | 1126 | 984 -13% | 888 -21% | 496 -56% | 1011 -10% |
| Colorchecker dE 2000 * | 4.94 | 4.88 1% | 3.59 27% | 4.47 10% | 3.67 26% |
| Colorchecker dE 2000 max. * | 8.13 | 8.88 -9% | 5.79 29% | 8.64 -6% | 8.33 -2% |
| Greyscale dE 2000 * | 5.13 | 4.17 19% | 3.86 25% | 6.13 -19% | 2.73 47% |
| Gamma | 2.26 97% | 2.53 87% | 2.53 87% | 2.2 100% | 2.49 88% |
| CCT | 7433 87% | 6683 97% | 7229 90% | 7047 92% | 7029 92% |
| Color Space (Percent of AdobeRGB 1998) | 55.9 | 55 -2% | 63 13% | 60.87 9% | 55 -2% |
| Color Space (Percent of sRGB) | 85.9 | 83 -3% | 97 13% | 95.43 11% | 84 -2% |
| Total Average (Program / Settings) | 2% /
-0% | 9% /
8% | -12% /
-15% | 7% /
6% |
* ... smaller is better
Display Response Times
| ↔ Response Time Black to White | ||
|---|---|---|
| 32 ms ... rise ↗ and fall ↘ combined | ↗ 8 ms rise | 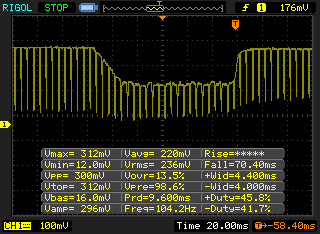 |
| ↘ 24 ms fall | ||
| The screen shows slow response rates in our tests and will be unsatisfactory for gamers. In comparison, all tested devices range from 0.1 (minimum) to 240 (maximum) ms. » 84 % of all devices are better. This means that the measured response time is worse than the average of all tested devices (21.5 ms). | ||
| ↔ Response Time 50% Grey to 80% Grey | ||
| 34 ms ... rise ↗ and fall ↘ combined | ↗ 19 ms rise | 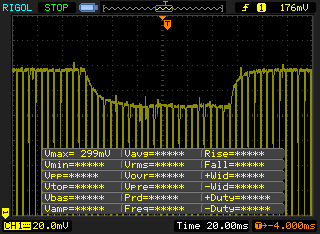 |
| ↘ 25 ms fall | ||
| The screen shows slow response rates in our tests and will be unsatisfactory for gamers. In comparison, all tested devices range from 0.2 (minimum) to 636 (maximum) ms. » 40 % of all devices are better. This means that the measured response time is similar to the average of all tested devices (33.7 ms). | ||
Screen Flickering / PWM (Pulse-Width Modulation)
| Screen flickering / PWM detected | 198.4 Hz | 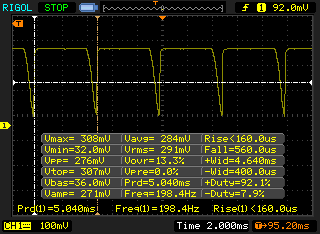 | |
The display backlight flickers at 198.4 Hz (worst case, e.g., utilizing PWM) . The frequency of 198.4 Hz is relatively low, so sensitive users will likely notice flickering and experience eyestrain at the stated brightness setting and below. In comparison: 53 % of all tested devices do not use PWM to dim the display. If PWM was detected, an average of 17900 (minimum: 5 - maximum: 3846000) Hz was measured. | |||


| Cinebench R15 | |
| CPU Single 64Bit | |
| Aorus X5 v6 | |
| DogHouse Systems Mobius SS | |
| Asus G701VO-CS74K | |
| MSI GE62 2QC-468XPL | |
| Lenovo ThinkPad T560-20FH002RGE | |
| Lenovo ThinkPad T560-20FH002RGE | |
| MSI GT72VR 6RD-063US | |
| Lenovo IdeaPad Y50 | |
| CPU Multi 64Bit | |
| DogHouse Systems Mobius SS | |
| Aorus X5 v6 | |
| MSI GE62 2QC-468XPL | |
| Asus G701VO-CS74K | |
| MSI GT72VR 6RD-063US | |
| Lenovo IdeaPad Y50 | |
| Lenovo ThinkPad T560-20FH002RGE | |
| Lenovo ThinkPad T560-20FH002RGE | |
| Cinebench R11.5 | |
| CPU Single 64Bit | |
| Aorus X5 v6 | |
| DogHouse Systems Mobius SS | |
| Asus G701VO-CS74K | |
| MSI GE62 2QC-468XPL | |
| Lenovo ThinkPad T560-20FH002RGE | |
| Lenovo ThinkPad T560-20FH002RGE | |
| MSI GT72VR 6RD-063US | |
| Lenovo IdeaPad Y50 | |
| CPU Multi 64Bit | |
| DogHouse Systems Mobius SS | |
| Aorus X5 v6 | |
| MSI GE62 2QC-468XPL | |
| Asus G701VO-CS74K | |
| MSI GT72VR 6RD-063US | |
| Lenovo IdeaPad Y50 | |
| Lenovo ThinkPad T560-20FH002RGE | |
| Lenovo ThinkPad T560-20FH002RGE | |
| Cinebench R10 | |
| Rendering Multiple CPUs 32Bit | |
| DogHouse Systems Mobius SS | |
| Aorus X5 v6 | |
| MSI GE62 2QC-468XPL | |
| Asus G701VO-CS74K | |
| MSI GT72VR 6RD-063US | |
| Lenovo IdeaPad Y50 | |
| Lenovo ThinkPad T560-20FH002RGE | |
| Rendering Single 32Bit | |
| DogHouse Systems Mobius SS | |
| Aorus X5 v6 | |
| Asus G701VO-CS74K | |
| MSI GE62 2QC-468XPL | |
| Lenovo ThinkPad T560-20FH002RGE | |
| MSI GT72VR 6RD-063US | |
| Lenovo IdeaPad Y50 | |
| wPrime 2.10 - 1024m | |
| Lenovo IdeaPad Y50 | |
| MSI GT72VR 6RD-063US | |
| Asus G701VO-CS74K | |
| Aorus X5 v6 | |
| MSI GE62 2QC-468XPL | |
| DogHouse Systems Mobius SS | |
| Super Pi Mod 1.5 XS 32M - 32M | |
| MSI GT72VR 6RD-063US | |
| MSI GE62 2QC-468XPL | |
| Lenovo IdeaPad Y50 | |
| Asus G701VO-CS74K | |
| DogHouse Systems Mobius SS | |
| Aorus X5 v6 | |
* ... smaller is better
| PCMark 8 | |
| Home Score Accelerated v2 | |
| Aorus X5 v6 | |
| Asus Strix GL502VS-FY032T | |
| MSI GT62VR-6RE16H21 | |
| MSI GS63VR-6RF16H22 Stealth Pro | |
| Gigabyte P35X v5 | |
| Work Score Accelerated v2 | |
| Aorus X5 v6 | |
| Asus Strix GL502VS-FY032T | |
| MSI GT62VR-6RE16H21 | |
| MSI GS63VR-6RF16H22 Stealth Pro | |
| Gigabyte P35X v5 | |
| PCMark 8 Home Score Accelerated v2 | 4828 points | |
| PCMark 8 Creative Score Accelerated v2 | 7973 points | |
| PCMark 8 Work Score Accelerated v2 | 5053 points | |
Help | ||
| Aorus X5 v6 Samsung SM951 MZVPV256 m.2 | Asus Strix GL502VS-FY032T SanDisk SD8SNAT256G1002 | Gigabyte P35X v5 Samsung SM951 MZVPV256HDGL m.2 PCI-e | MSI GS73VR 6RF SanDisk SD8SN8U1T001122 | Eurocom Sky X7E2 Samsung SM951 MZVPV512HDGL m.2 PCI-e | |
|---|---|---|---|---|---|
| CrystalDiskMark 3.0 | -64% | -1% | -70% | 11% | |
| Read Seq | 1565 | 485.4 -69% | 1541 -2% | 334.3 -79% | 1673 7% |
| Write Seq | 1275 | 312.4 -75% | 1247 -2% | 319 -75% | 1576 24% |
| Read 512 | 990 | 294.8 -70% | 1119 13% | 242.3 -76% | 1180 19% |
| Write 512 | 1221 | 287.8 -76% | 1214 -1% | 254.4 -79% | 1561 28% |
| Read 4k | 53 | 21.44 -60% | 51.4 -3% | 20.3 -62% | 51.5 -3% |
| Write 4k | 158.8 | 75.7 -52% | 145.1 -9% | 42.51 -73% | 144 -9% |
| Read 4k QD32 | 688 | 149.4 -78% | 593 -14% | 251.6 -63% | 694 1% |
| Write 4k QD32 | 358.7 | 256.3 -29% | 385.5 7% | 167.1 -53% | 422.1 18% |

| 3DMark | |
| 1920x1080 Fire Strike Graphics | |
| Eurocom Sky X7E2 | |
| Aorus X5 v6 | |
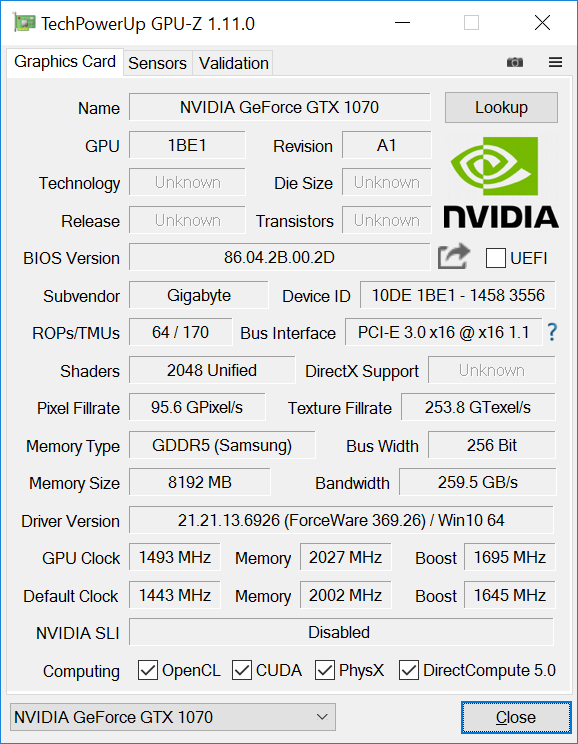
| Nvidia GeForce GTX 1070 Founders Edition | |
| Asus G701VO-CS74K | |
| MSI GT72VR 6RD-063US | |
| EVGA SC17 | |
| 3840x2160 Fire Strike Ultra Graphics | |
| Eurocom Sky X7E2 | |
| Aorus X5 v6 | |
| Nvidia GeForce GTX 1070 Founders Edition | |
| Asus G701VO-CS74K | |
| MSI GT72VR 6RD-063US | |
| EVGA SC17 | |
| Fire Strike Extreme Graphics | |
| Eurocom Sky X7E2 | |
| Aorus X5 v6 | |
| Asus G701VO-CS74K | |
| MSI GT72VR 6RD-063US | |
| EVGA SC17 | |
| 3DMark 11 | |
| 1280x720 Performance GPU | |
| Eurocom Sky X7E2 | |
| Nvidia GeForce GTX 1070 Founders Edition | |
| Aorus X5 v6 | |
| Asus G701VO-CS74K | |
| EVGA SC17 | |
| MSI GT72VR 6RD-063US | |
| 1280x720 Performance Combined | |
| Nvidia GeForce GTX 1070 Founders Edition | |
| Aorus X5 v6 | |
| Eurocom Sky X7E2 | |
| EVGA SC17 | |
| Asus G701VO-CS74K | |
| MSI GT72VR 6RD-063US | |
| 3DMark 11 Performance | 18156 points | |
| 3DMark Ice Storm Standard Score | 144778 points | |
| 3DMark Cloud Gate Standard Score | 30162 points | |
| 3DMark Fire Strike Score | 14476 points | |
| 3DMark Fire Strike Extreme Score | 7857 points | |
Help | ||
| Fallout 4 - 1920x1080 Ultra Preset AA:T AF:16x | |
| Aorus X5 v6 | |
| Asus G701VO-CS74K | |
| MSI GT72VR 6RD-063US | |
| EVGA SC17 | |
| Asus Strix GL502VT-DS74 | |
| Sleeping Dogs - 1920x1080 Extreme Preset AA:Extreme | |
| Aorus X5 v6 | |
| Asus G701VO-CS74K | |
| EVGA SC17 | |
| Asus Strix GL502VT-DS74 | |
| Guild Wars 2 - 1920x1080 All Maximum / On AA:FX | |
| Aorus X5 v6 | |
| MSI GT72VR 6RD-063US | |
| BioShock Infinite - 1920x1080 Ultra Preset, DX11 (DDOF) | |
| Aorus X5 v6 | |
| Asus G701VO-CS74K | |
| MSI GT72VR 6RD-063US | |
| EVGA SC17 | |
| Asus Strix GL502VT-DS74 | |
| Metro: Last Light - 1920x1080 Very High (DX11) AF:16x | |
| Aorus X5 v6 | |
| Asus G701VO-CS74K | |
| MSI GT72VR 6RD-063US | |
| EVGA SC17 | |
| Asus Strix GL502VT-DS74 | |
| Thief - 1920x1080 Very High Preset AA:FXAA & High SS AF:8x | |
| Aorus X5 v6 | |
| MSI GT72VR 6RD-063US | |
| Asus G701VO-CS74K | |
| EVGA SC17 | |
| Asus Strix GL502VT-DS74 | |
| Batman: Arkham Knight - 1920x1080 High / On AA:SM AF:16x | |
| Aorus X5 v6 | |
| Asus G701VO-CS74K | |
| MSI GT72VR 6RD-063US | |
| EVGA SC17 | |
| Asus Strix GL502VT-DS74 | |
| Metal Gear Solid V - 1920x1080 Extra High / On | |
| EVGA SC17 | |
| Asus Strix GL502VT-DS74 | |
| Asus G701VO-CS74K | |
| MSI GT72VR 6RD-063US | |
| Aorus X5 v6 | |
| Rise of the Tomb Raider - 1920x1080 Very High Preset AA:FX AF:16x | |
| Aorus X5 v6 | |
| MSI GT72VR 6RD-063US | |
| Asus G701VO-CS74K | |
| EVGA SC17 | |
| Asus Strix GL502VT-DS74 | |
| Doom - 1920x1080 Ultra Preset AA:SM | |
| Aorus X5 v6 | |
| MSI GT72VR 6RD-063US | |
| Asus G701VO-CS74K | |
| Overwatch - 1920x1080 Epic (Render Scale 100 %) AA:SM AF:16x | |
| Aorus X5 v6 | |
| Asus G701VO-CS74K | |
| MSI GT72VR 6RD-063US | |
| low | med. | high | ultra | |
| Sleeping Dogs (2012) | 118.6 | |||
| Guild Wars 2 (2012) | 78.8 | |||
| BioShock Infinite (2013) | 136.8 | |||
| Metro: Last Light (2013) | 117.9 | |||
| Thief (2014) | 106.6 | |||
| Batman: Arkham Knight (2015) | 89 | |||
| Metal Gear Solid V (2015) | 60 | |||
| Fallout 4 (2015) | 111.3 | |||
| Rise of the Tomb Raider (2016) | 97.4 | |||
| Doom (2016) | 128.9 | |||
| Overwatch (2016) | 162 |
Noise Level
| Idle |
| 33.4 / 35.2 / 35.2 dB(A) |
| Load |
| 53.3 / 57.6 dB(A) |
 | ||
30 dB silent 40 dB(A) audible 50 dB(A) loud |
||
min: | ||
| Aorus X5 v6 GeForce GTX 1070 Mobile, 6820HK, Samsung SM951 MZVPV256 m.2 | Asus Strix GL502VS-FY032T GeForce GTX 1070 Mobile, 6700HQ, SanDisk SD8SNAT256G1002 | MSI GT62VR-6RE16H21 GeForce GTX 1070 Mobile, 6700HQ, Toshiba HG6 THNSNJ256G8NY | MSI GS63VR-6RF16H22 Stealth Pro GeForce GTX 1060 Mobile, 6700HQ, Samsung SM951 MZVPV256HDGL m.2 PCI-e | Acer Predator 15 G9-592-7925 GeForce GTX 970M, 6700HQ, Samsung SSD PM871 MZNLN512HCJH | |
|---|---|---|---|---|---|
| Noise | 8% | 9% | 10% | 11% | |
| off / environment * | 29.3 | 30 -2% | 30 -2% | 30 -2% | |
| Idle Minimum * | 33.4 | 32 4% | 32 4% | 32 4% | 31 7% |
| Idle Average * | 35.2 | 33 6% | 33 6% | 33 6% | 32 9% |
| Idle Maximum * | 35.2 | 34 3% | 34 3% | 34 3% | 36 -2% |
| Load Average * | 53.3 | 39 27% | 40 25% | 37 31% | 40 25% |
| Load Maximum * | 57.6 | 51 11% | 46 20% | 46 20% | 47 18% |
* ... smaller is better
(-) The maximum temperature on the upper side is 57 °C / 135 F, compared to the average of 40.4 °C / 105 F, ranging from 21.2 to 68.8 °C for the class Gaming.
(-) The bottom heats up to a maximum of 54 °C / 129 F, compared to the average of 43.2 °C / 110 F
(±) In idle usage, the average temperature for the upper side is 32.8 °C / 91 F, compared to the device average of 33.8 °C / 93 F.
(+) The palmrests and touchpad are reaching skin temperature as a maximum (33 °C / 91.4 F) and are therefore not hot.
(-) The average temperature of the palmrest area of similar devices was 28.9 °C / 84 F (-4.1 °C / -7.4 F).
Aorus X5 v6 audio analysis
(±) | speaker loudness is average but good (72.3 dB)
Bass 100 - 315 Hz
(±) | reduced bass - on average 14.1% lower than median
(±) | linearity of bass is average (10% delta to prev. frequency)
Mids 400 - 2000 Hz
(+) | balanced mids - only 1.9% away from median
(±) | linearity of mids is average (8.9% delta to prev. frequency)
Highs 2 - 16 kHz
(±) | higher highs - on average 5.3% higher than median
(±) | linearity of highs is average (7.5% delta to prev. frequency)
Overall 100 - 16.000 Hz
(±) | linearity of overall sound is average (24.2% difference to median)
Compared to same class
» 85% of all tested devices in this class were better, 5% similar, 10% worse
» The best had a delta of 6%, average was 18%, worst was 132%
Compared to all devices tested
» 69% of all tested devices were better, 7% similar, 25% worse
» The best had a delta of 4%, average was 25%, worst was 134%
Apple MacBook 12 (Early 2016) 1.1 GHz audio analysis
(+) | speakers can play relatively loud (83.6 dB)
Bass 100 - 315 Hz
(±) | reduced bass - on average 11.3% lower than median
(±) | linearity of bass is average (14.2% delta to prev. frequency)
Mids 400 - 2000 Hz
(+) | balanced mids - only 2.4% away from median
(+) | mids are linear (5.5% delta to prev. frequency)
Highs 2 - 16 kHz
(+) | balanced highs - only 2% away from median
(+) | highs are linear (4.5% delta to prev. frequency)
Overall 100 - 16.000 Hz
(+) | overall sound is linear (10.2% difference to median)
Compared to same class
» 5% of all tested devices in this class were better, 2% similar, 93% worse
» The best had a delta of 5%, average was 19%, worst was 53%
Compared to all devices tested
» 3% of all tested devices were better, 1% similar, 96% worse
» The best had a delta of 4%, average was 25%, worst was 134%
| Off / Standby | |
| Idle | |
| Load |
|
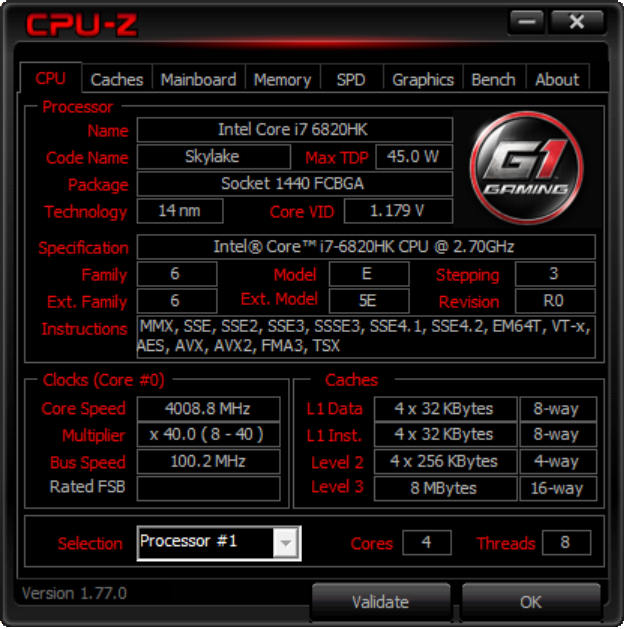
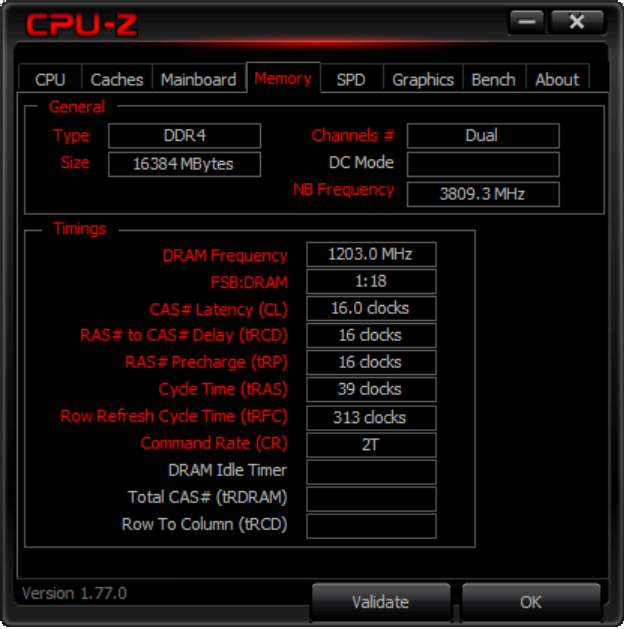
| Aorus X5 v6 6820HK, GeForce GTX 1070 Mobile, Samsung SM951 MZVPV256 m.2, IPS, 2880x1620, 15.60 | Lenovo IdeaPad Y900 6820HK, GeForce GTX 980M, Samsung SM951 MZVPV256 m.2, , 1920x1080, 17.30 | MSI GT72VR 6RD-063US 6700HQ, GeForce GTX 1060 Mobile, SanDisk SD8SN8U1T001122, IPS, 1920x1080, 17.30 | MSI GT72VR 6RE-015US 6700HQ, GeForce GTX 1070 Mobile, SanDisk SD8SNAT256G1122, IPS, 1920x1080, 17.30 | Asus G701VO-CS74K 6820HK, GeForce GTX 980 (Laptop), 2x Samsung SM951 MZVPV512HDGL (RAID 0), IPS, 1920x1080, 17.30 | |
|---|---|---|---|---|---|
| Power Consumption | 12% | 9% | 7% | -1% | |
| Idle Minimum * | 25 | 24.3 3% | 24.4 2% | 22.3 11% | 28.2 -13% |
| Idle Average * | 28.9 | 29.6 -2% | 26.6 8% | 27.3 6% | 32 -11% |
| Idle Maximum * | 30.1 | 29.9 1% | 36.4 -21% | 30 -0% | 32.6 -8% |
| Load Average * | 167.3 | 110.1 34% | 117 30% | 152.2 9% | 162.2 3% |
| Load Maximum * | 222.6 | 171.4 23% | 163.6 27% | 204.2 8% | 173.5 22% |
* ... smaller is better
| Aorus X5 v6 6820HK, GeForce GTX 1070 Mobile, 94.24 Wh | Asus Strix GL502VS-FY032T 6700HQ, GeForce GTX 1070 Mobile, 62 Wh | MSI GT62VR-6RE16H21 6700HQ, GeForce GTX 1070 Mobile, 75.24 Wh | Gigabyte P35X v5 6700HQ, GeForce GTX 980M, 76 Wh | Acer Predator 15 G9-592-7925 6700HQ, GeForce GTX 970M, Wh | |
|---|---|---|---|---|---|
| Battery Runtime | -12% | 17% | 28% | 162% | |
| Reader / Idle | 249 | 243 -2% | 300 20% | 345 39% | |
| WiFi v1.3 | 182 | 196 8% | 246 35% | 261 43% | 476 162% |
| Load | 100 | 58 -42% | 97 -3% | 101 1% |
Pros
Cons

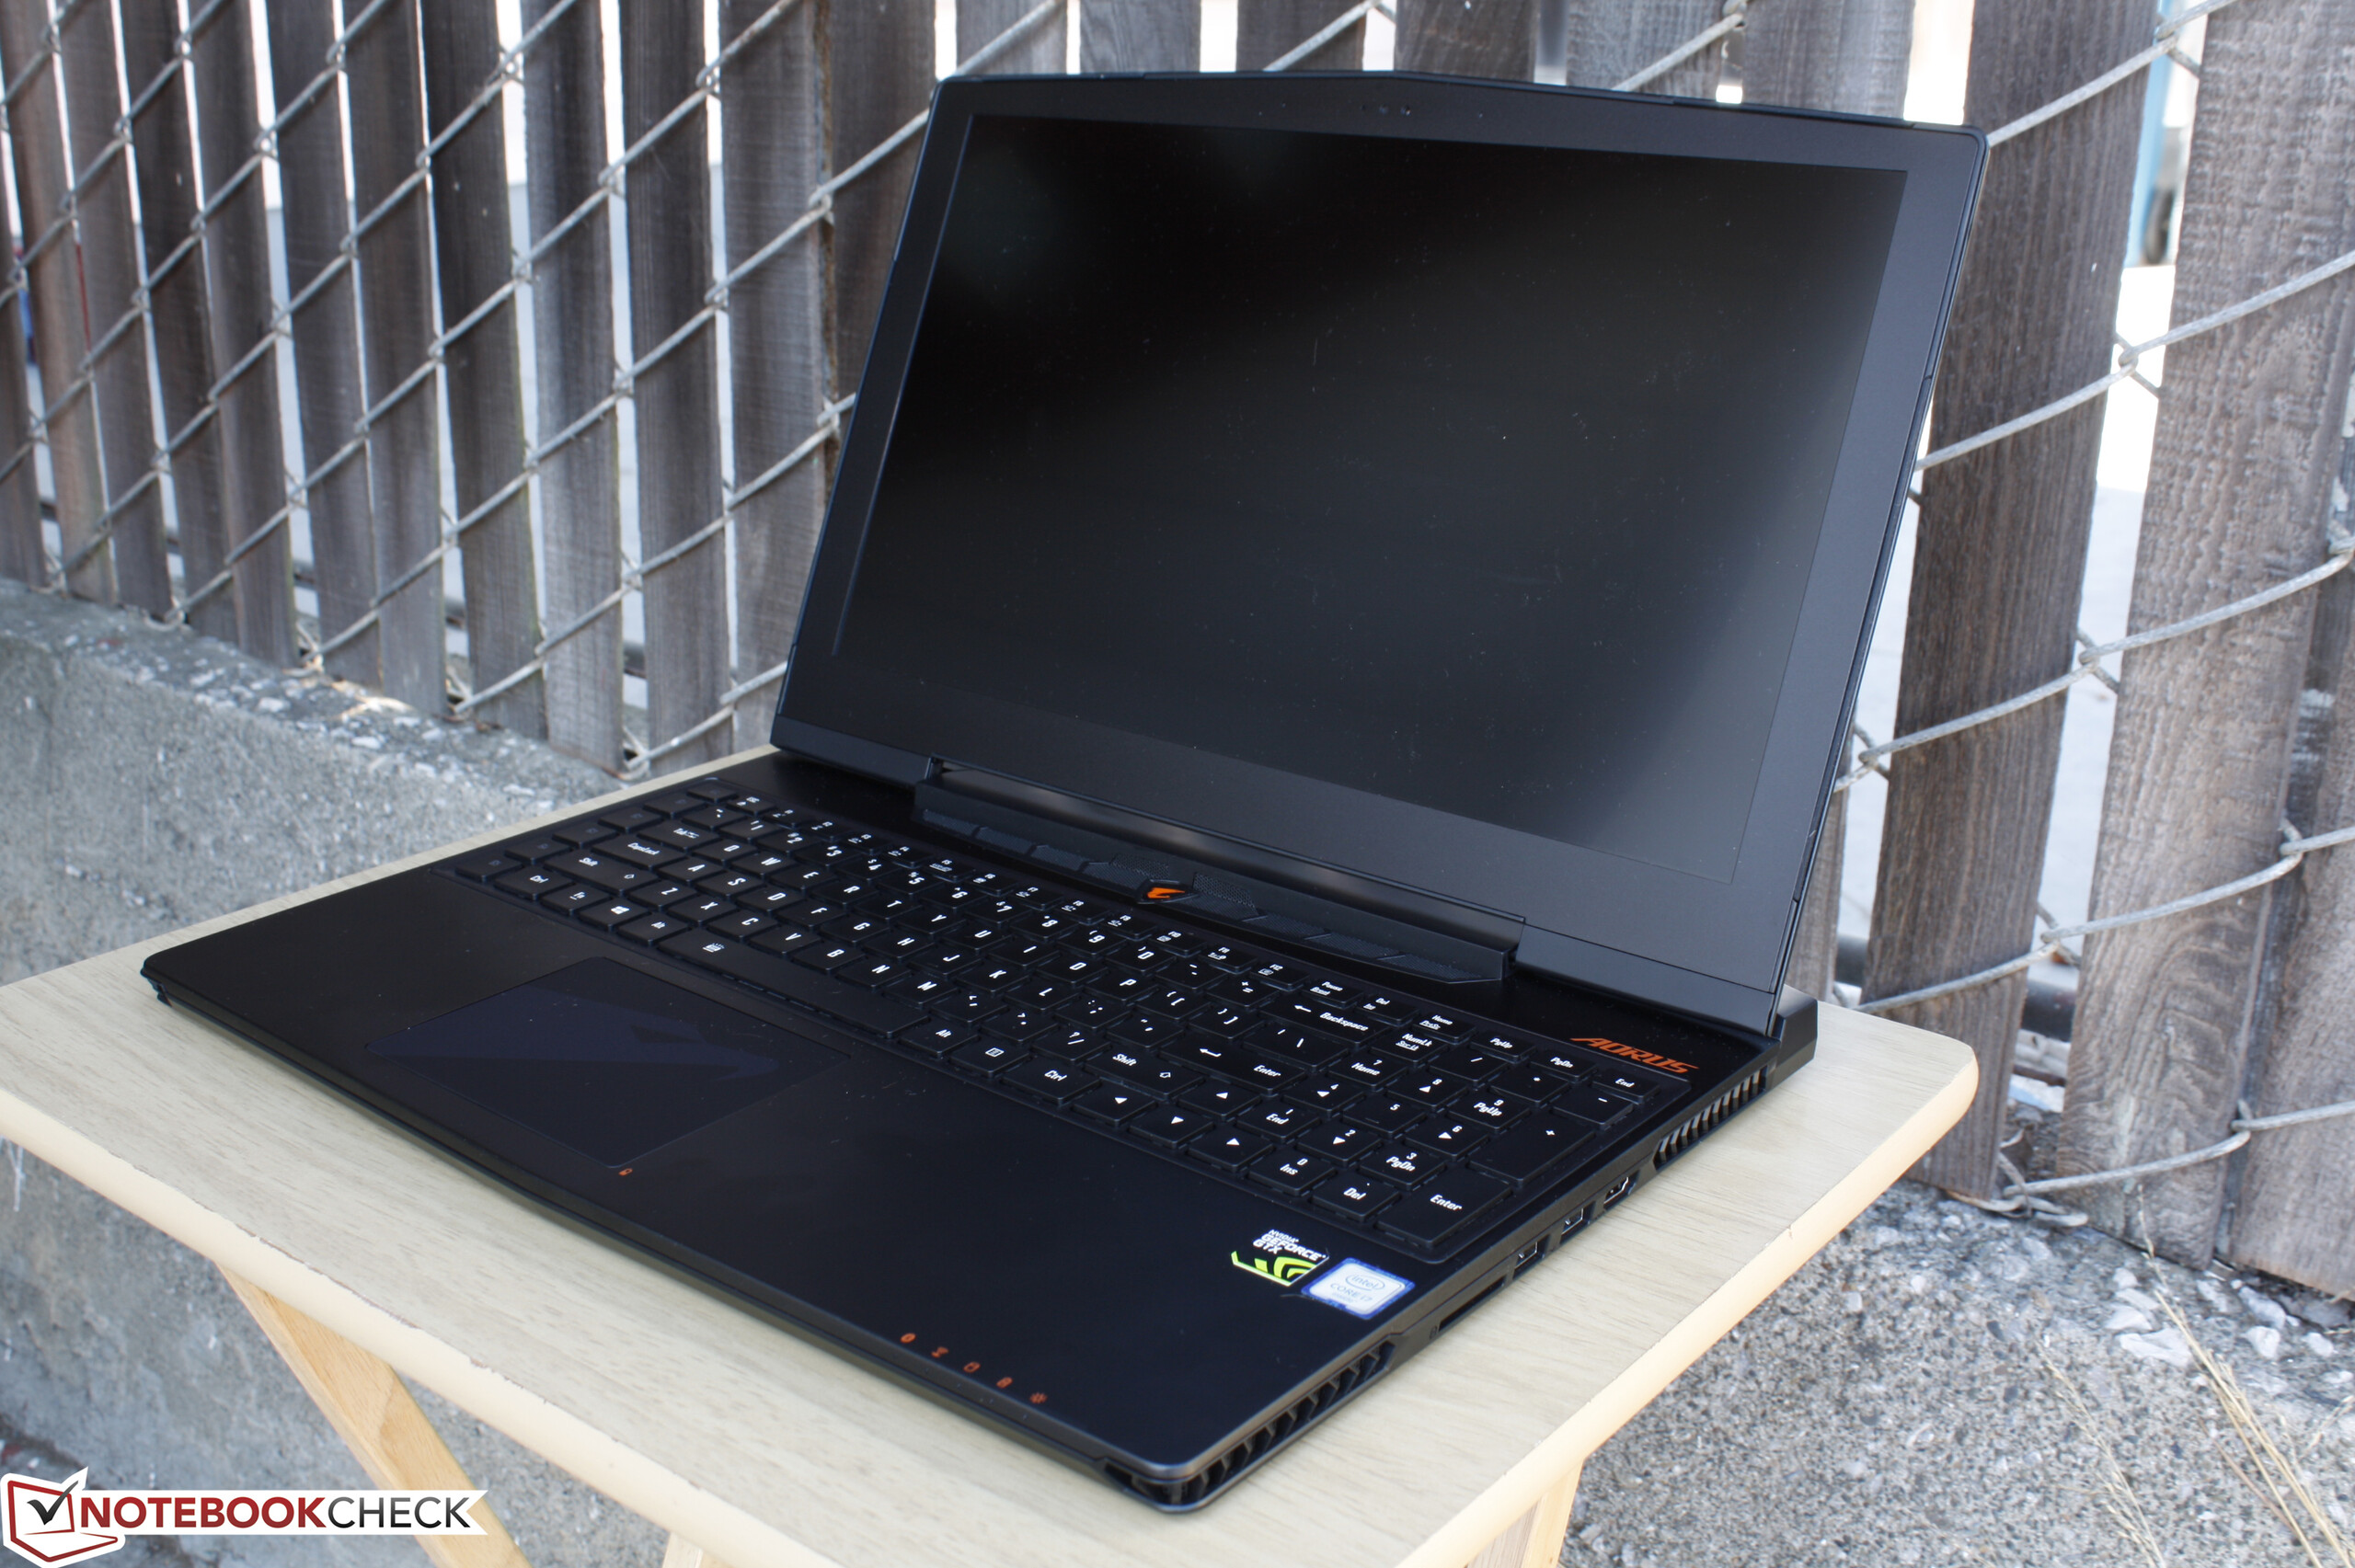
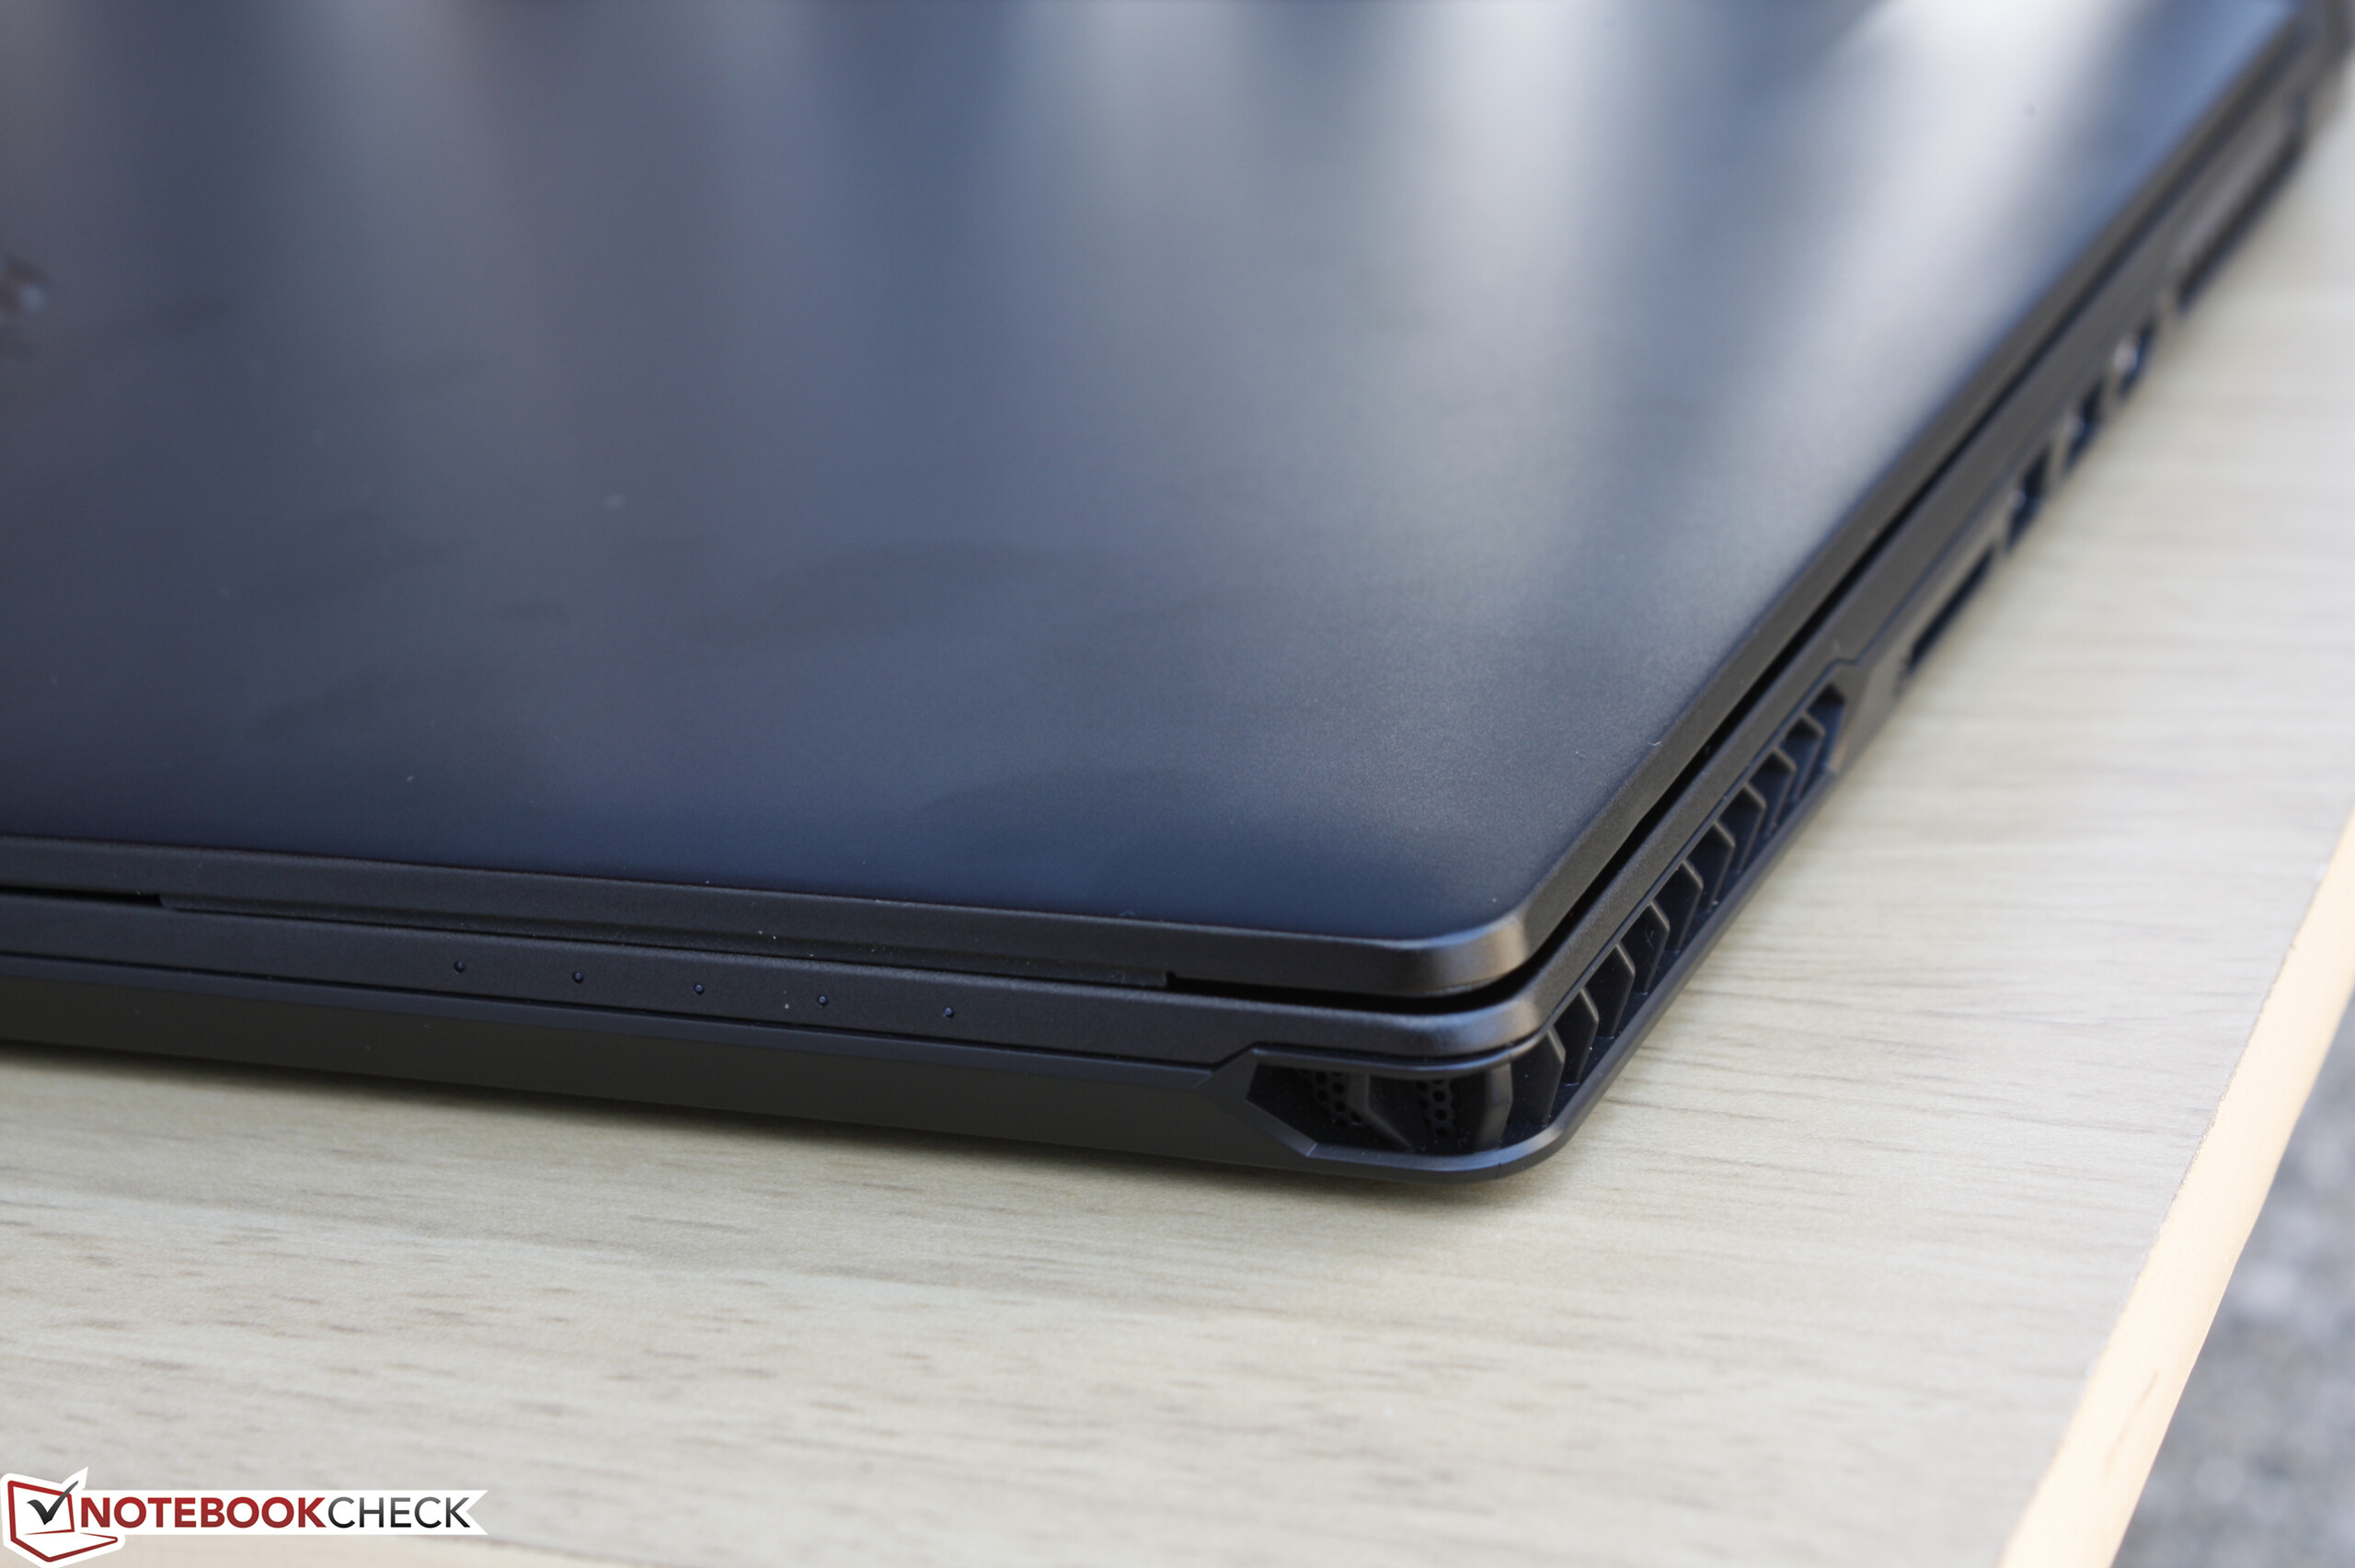
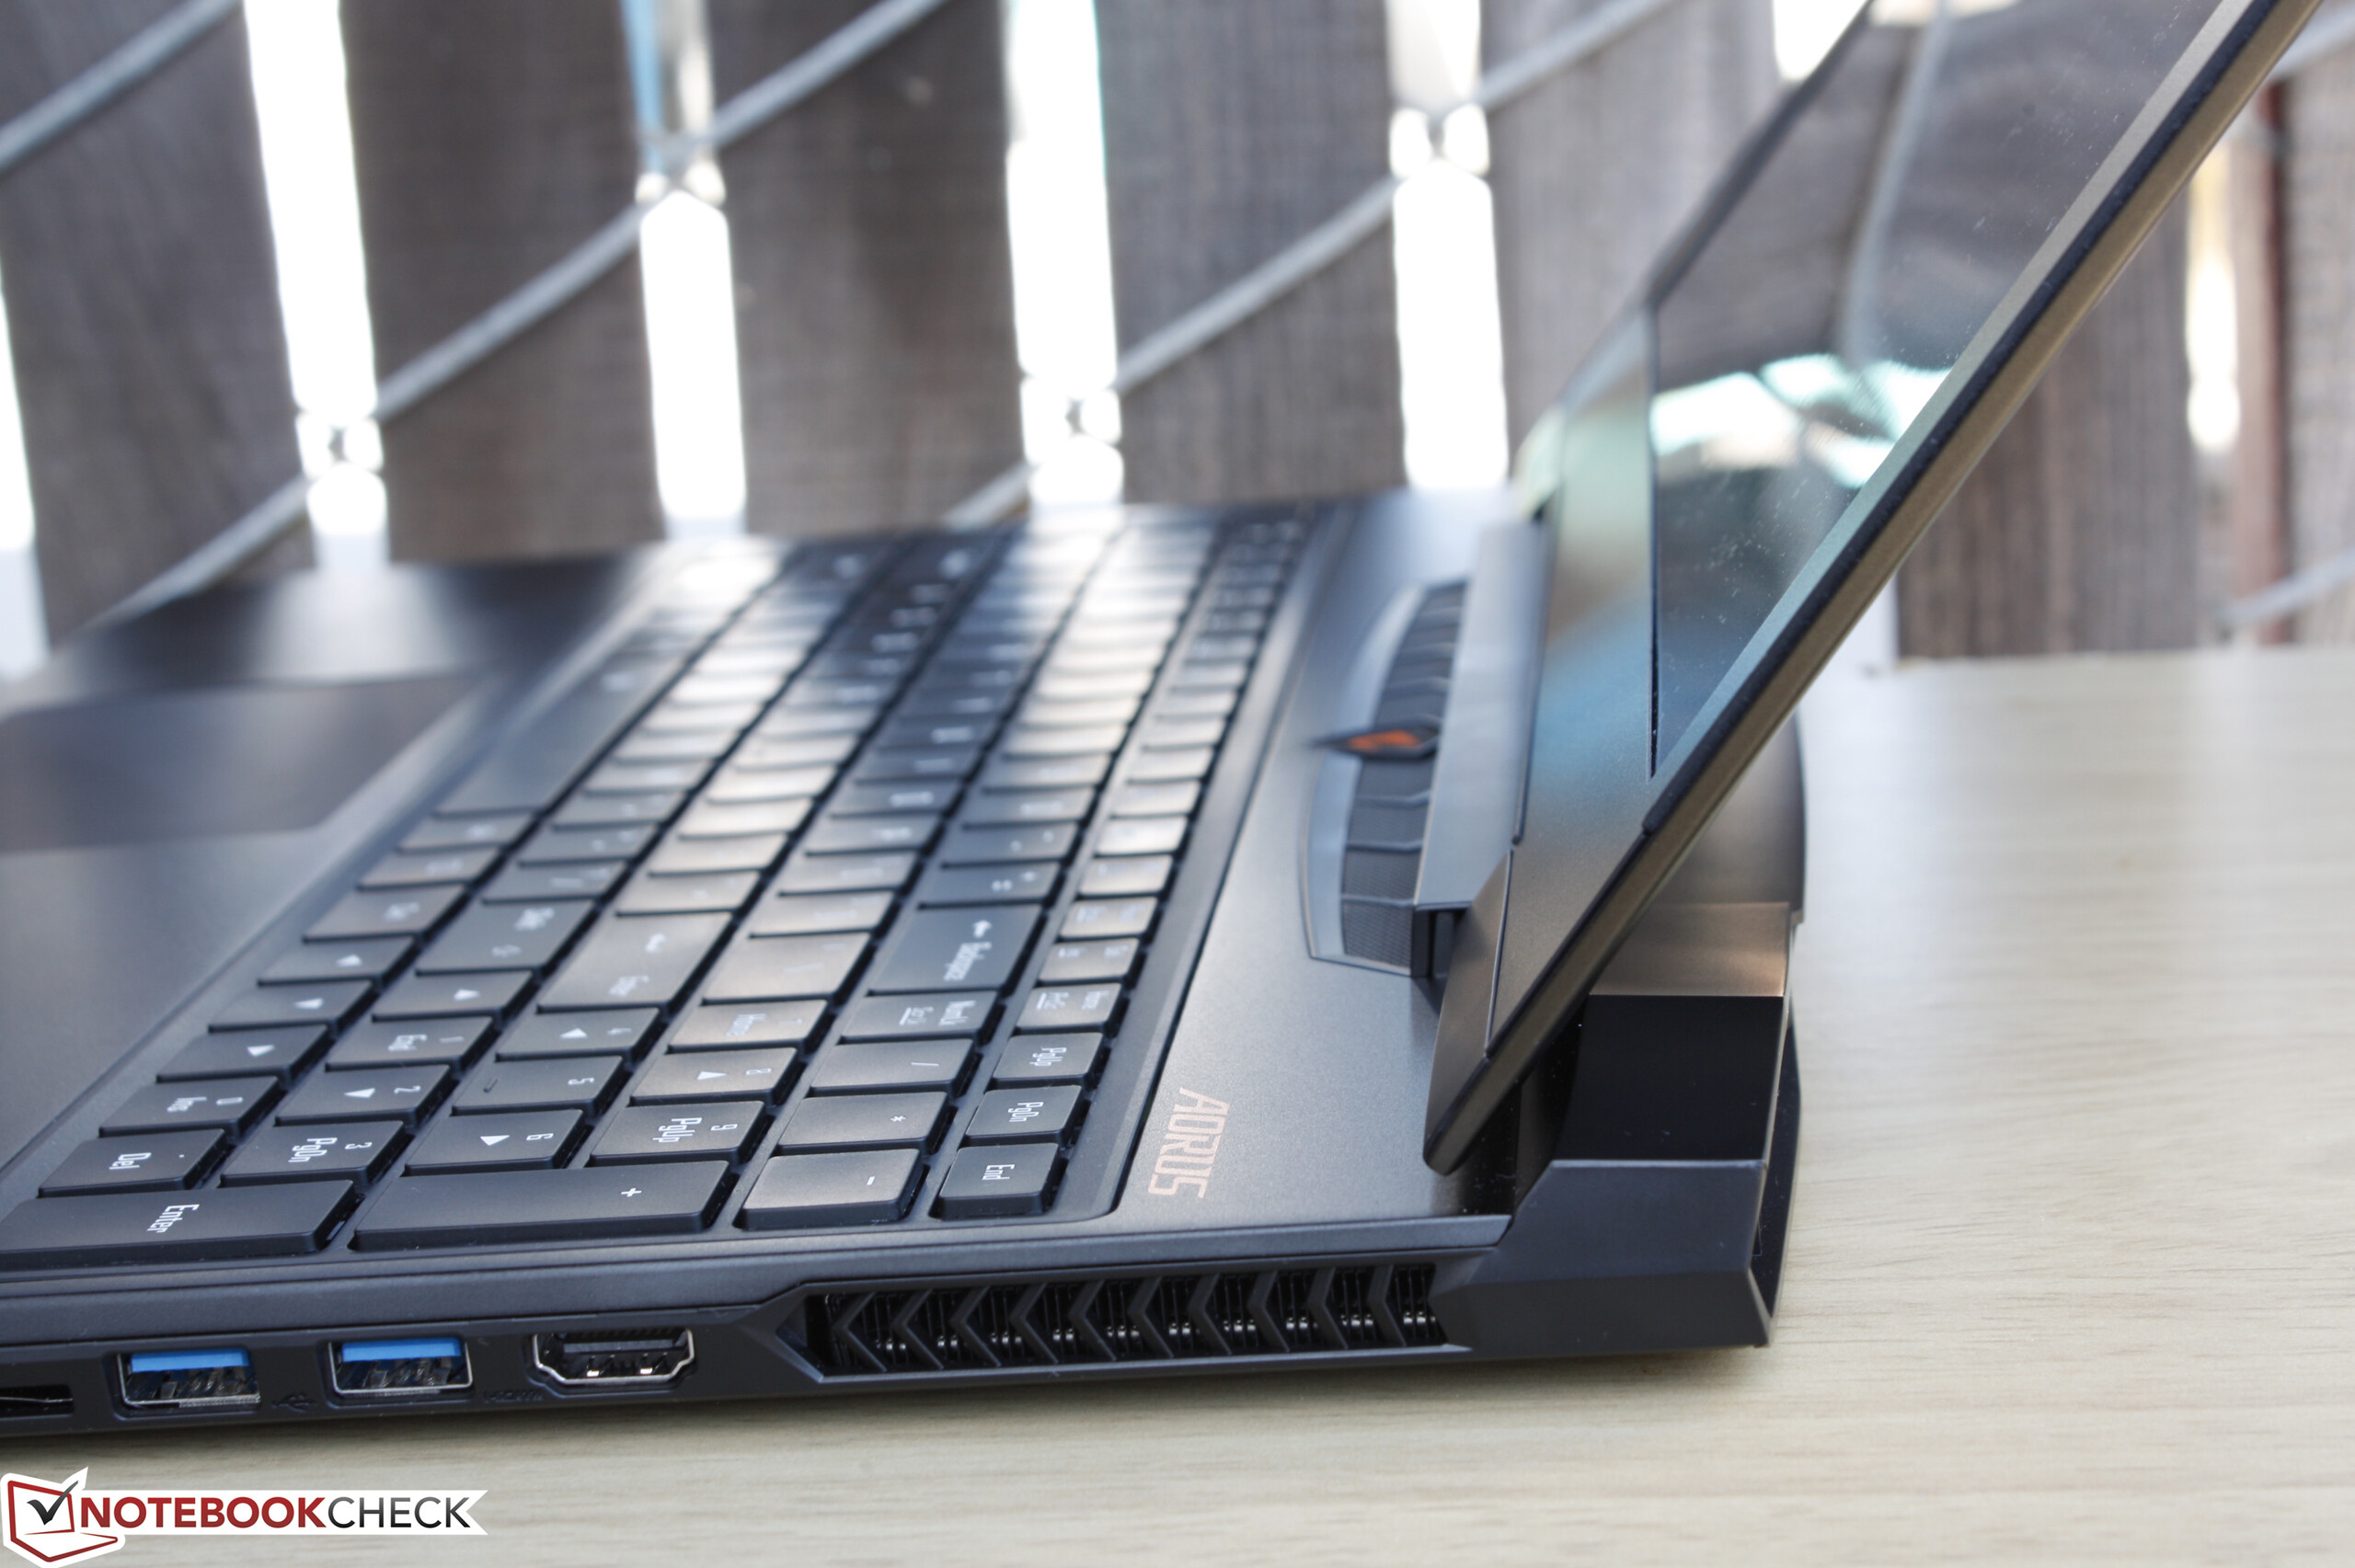
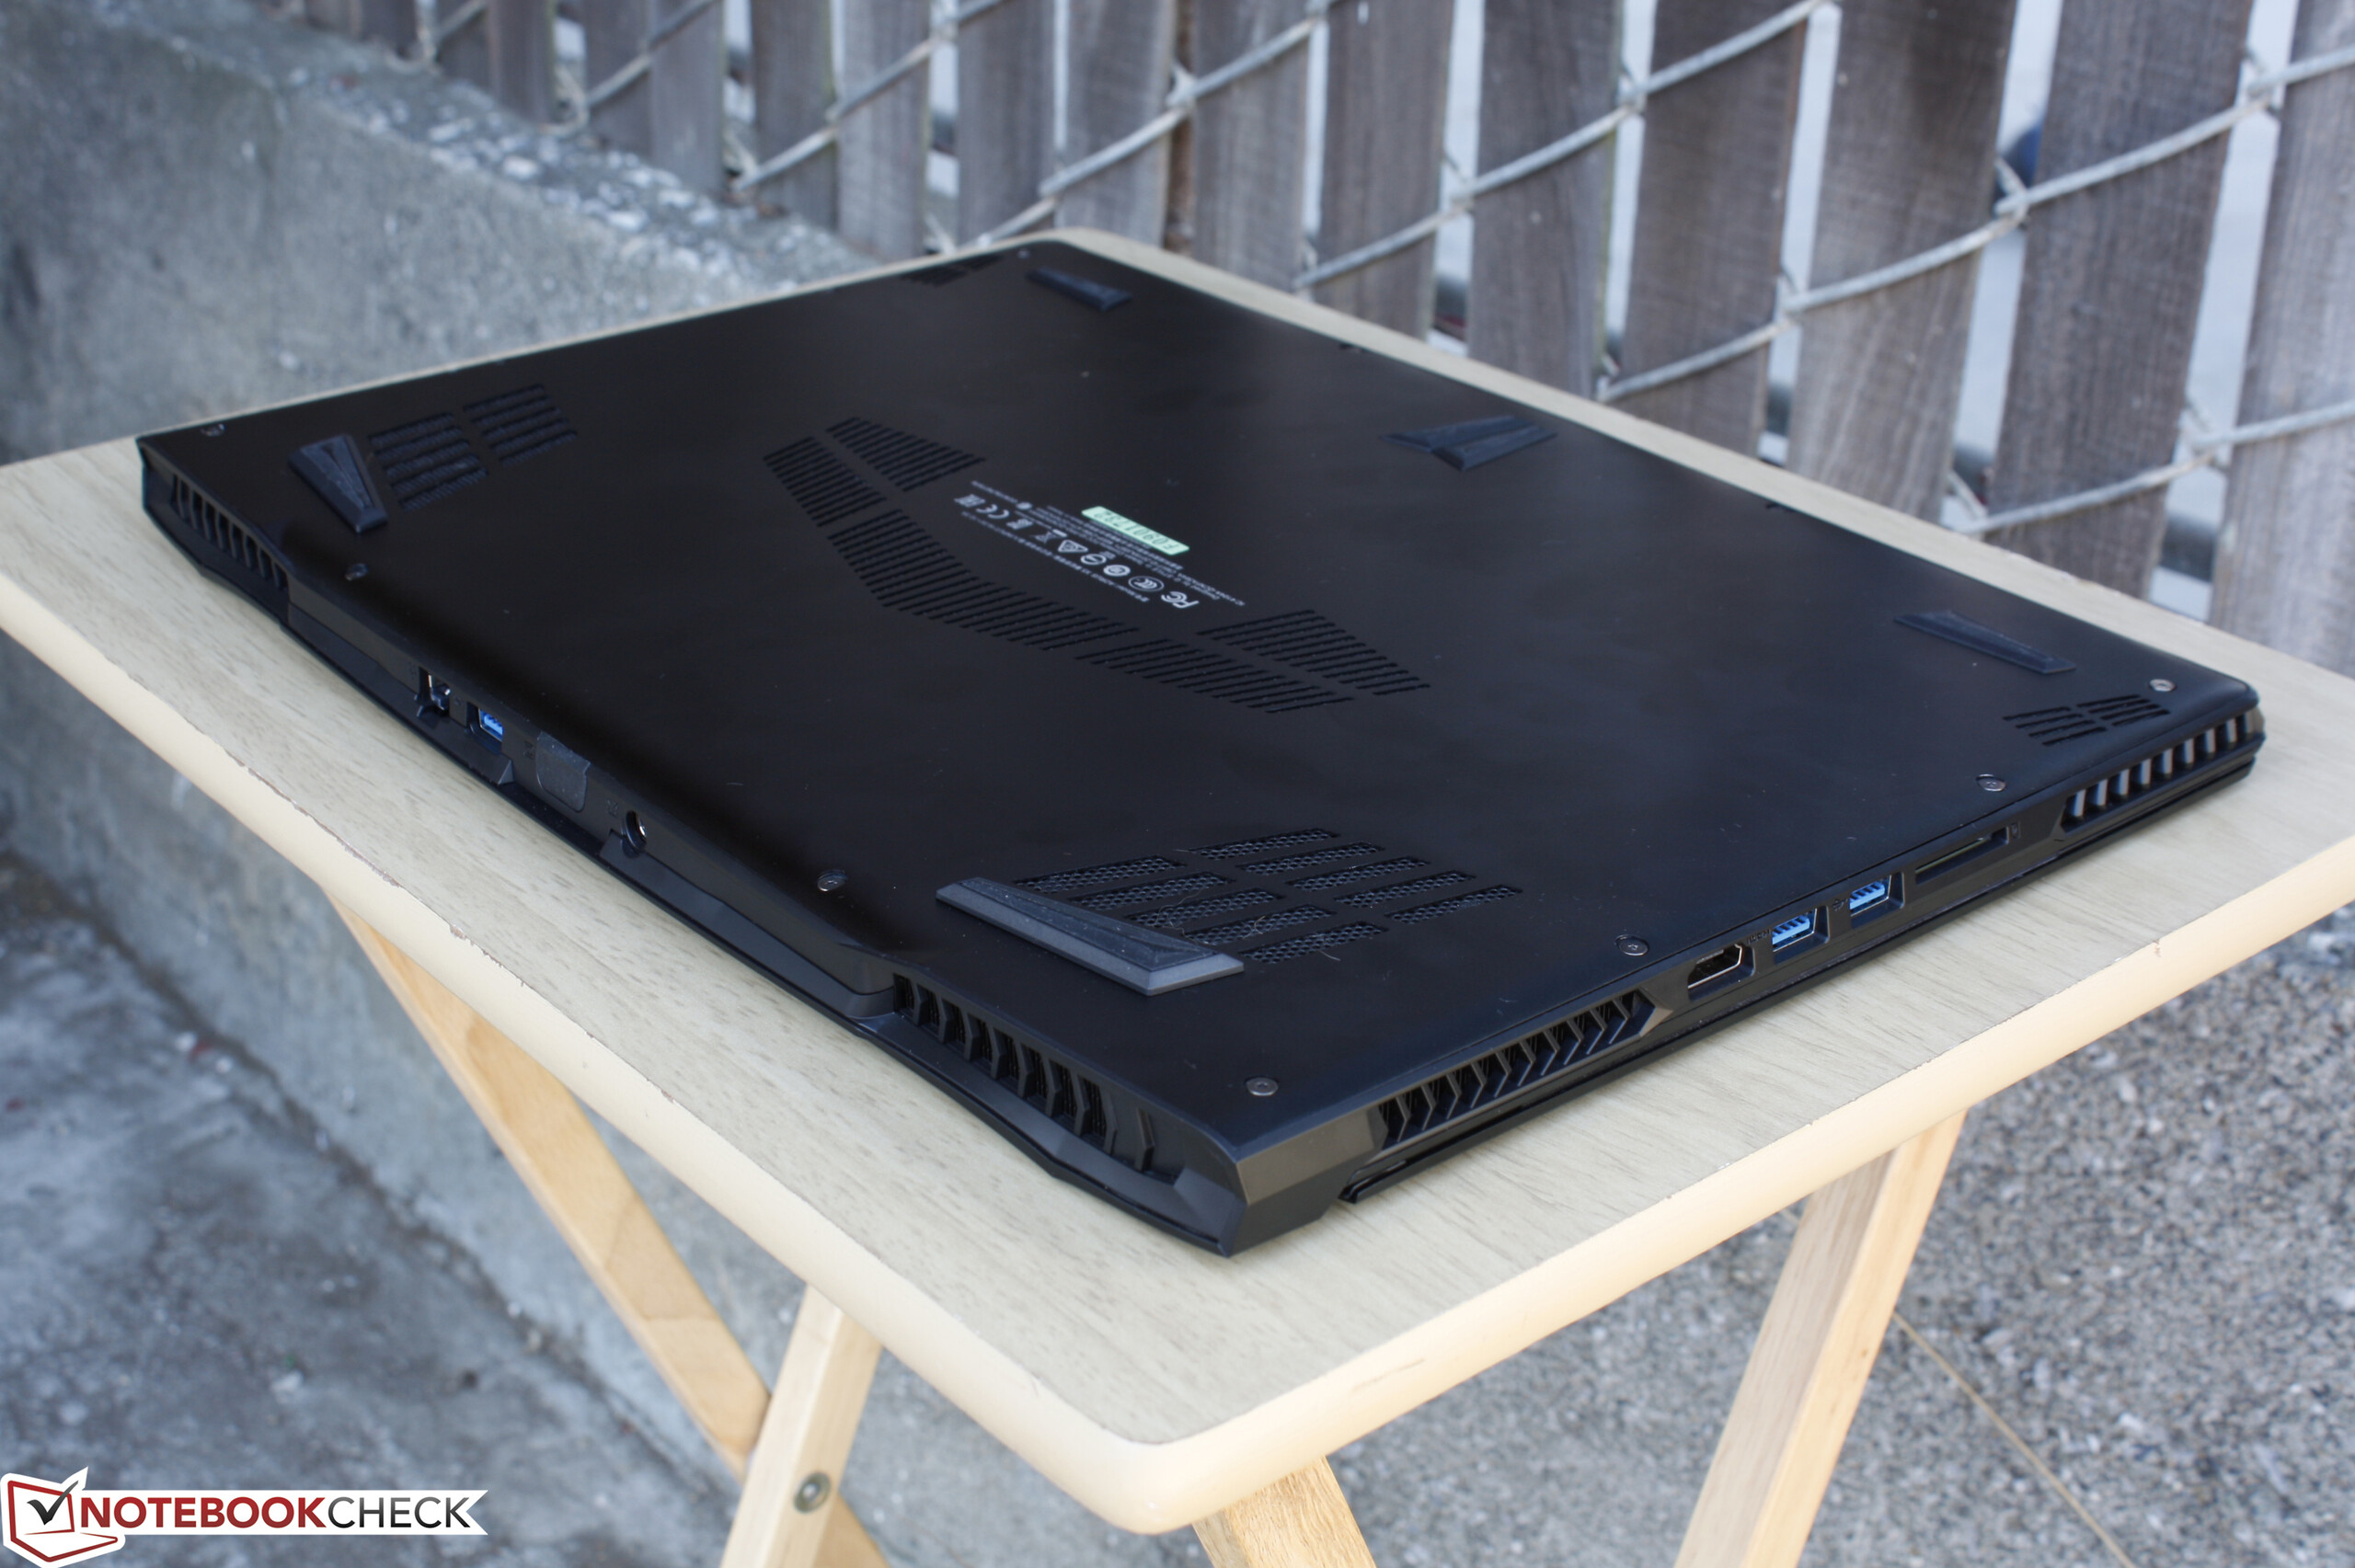
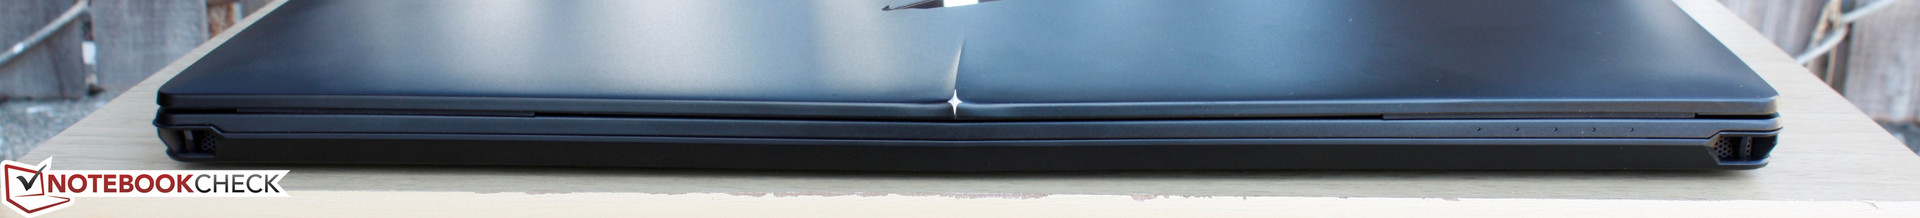
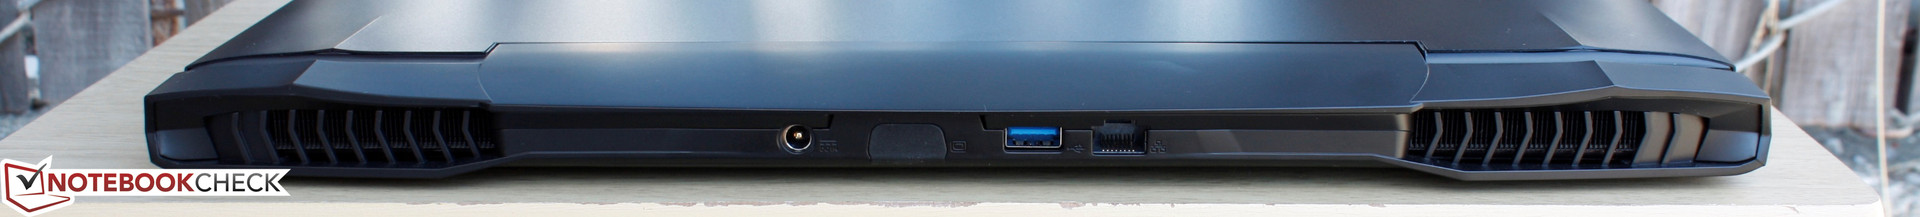
Aorus通过把强劲硬件放进同配置机型一半厚的机身内而在游戏市场上得到了一席之地。X5 v6甚至提供了竞争机型中少见的功能组合:3K 1620p屏幕,双HDMI 2.0接口和为方便直播的内置硬件。那么当存在搭配同样处理器和显卡却相对更薄的Aorus时,为什么还要购买更笨重的机型呢?
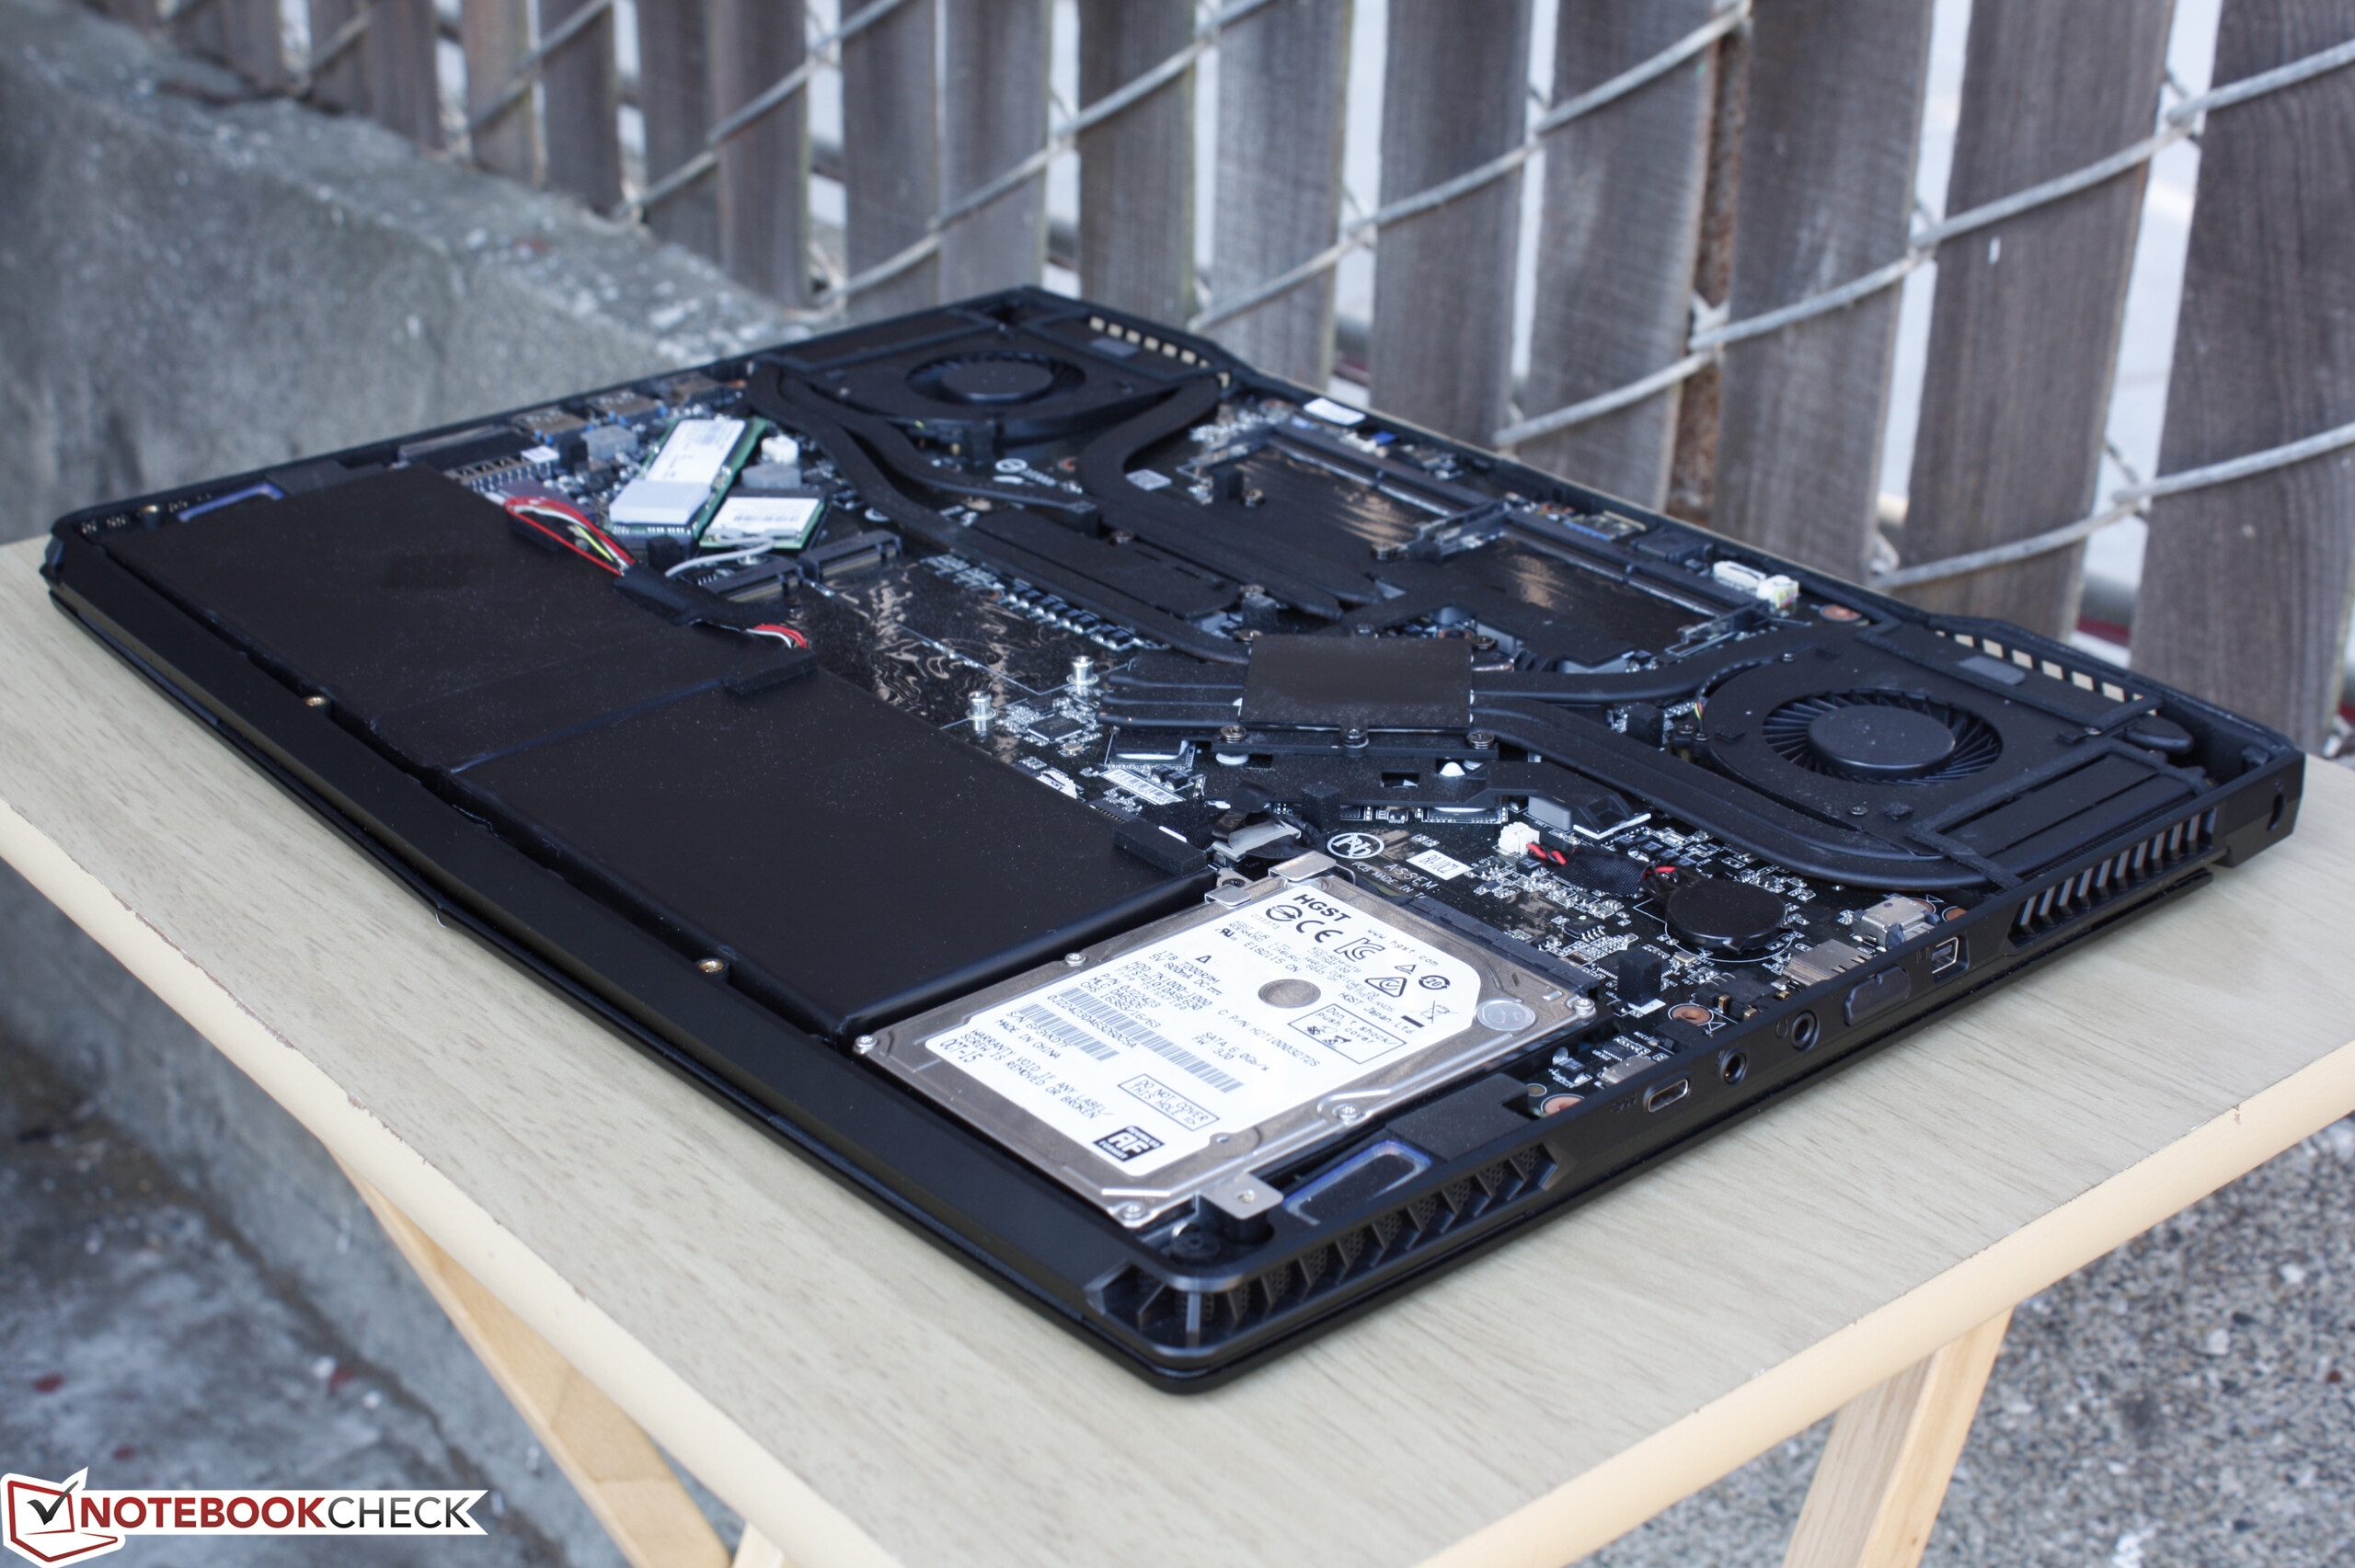
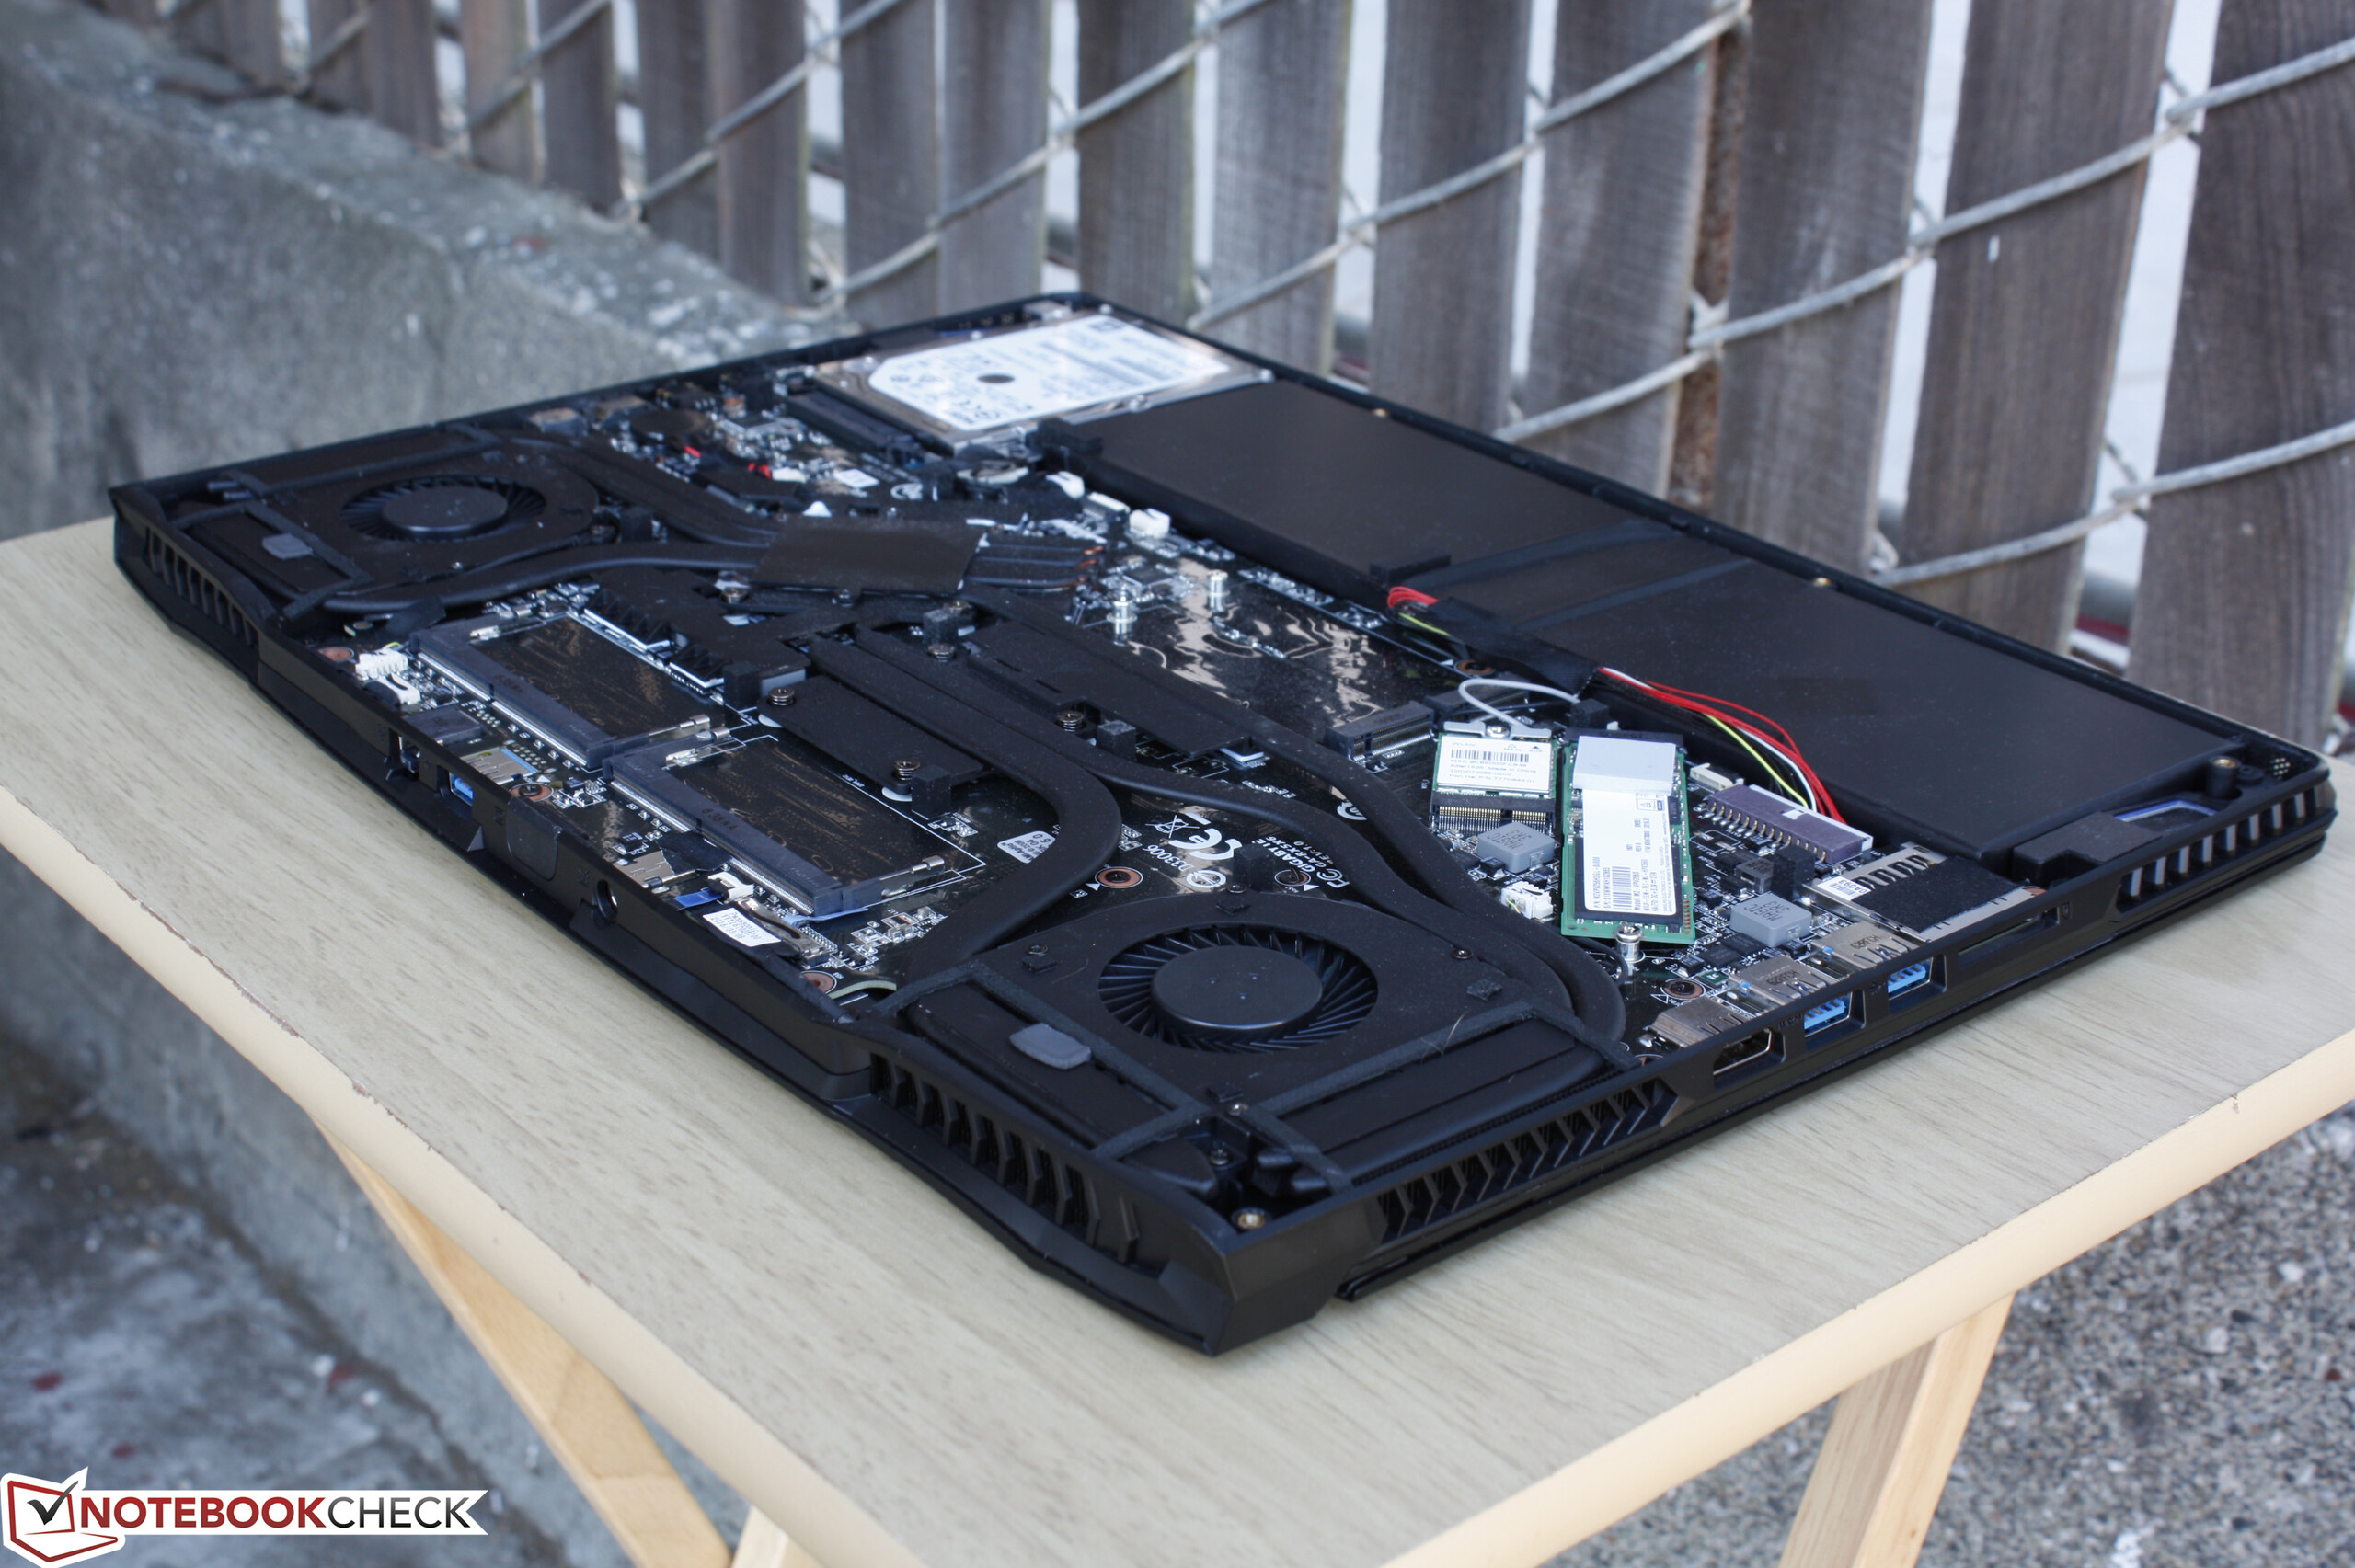
答案与性能和功能的关系比较小,而更多是关于风扇噪音的问题。我们测试机中的GTX 1070显卡和台式GTX 1070标准卡速度相当,因此它并没有过热降频的问题。而120赫兹/5毫秒屏幕选项,独立背光按键,四个支持RAID的硬盘槽,和方便的维护升级都让X5 v6在其他超薄游戏本中脱颖而出。另外,不常见的WQHD屏幕相比4K屏幕更接近于GTX 1070的性能表现。
它的系统噪音是最大的缺点所在。它的风扇非常吵人,如果不戴耳机的话在MGS V等较为安静的游戏中将会带来很大的问题。其他的小缺陷还包括一般的电池续航,所有亮度下的屏幕闪烁,缺少Thunderbolt 3和MXM 3.0,以及极端情况下的处理器降频。同时它的功耗表现也十分奇怪(搭配200瓦电源适配器,功耗却大于200瓦),另外我们所测试过的一台搭配更便宜的酷睿i7-6700HQ处理器的机型性能表现也十分相近。
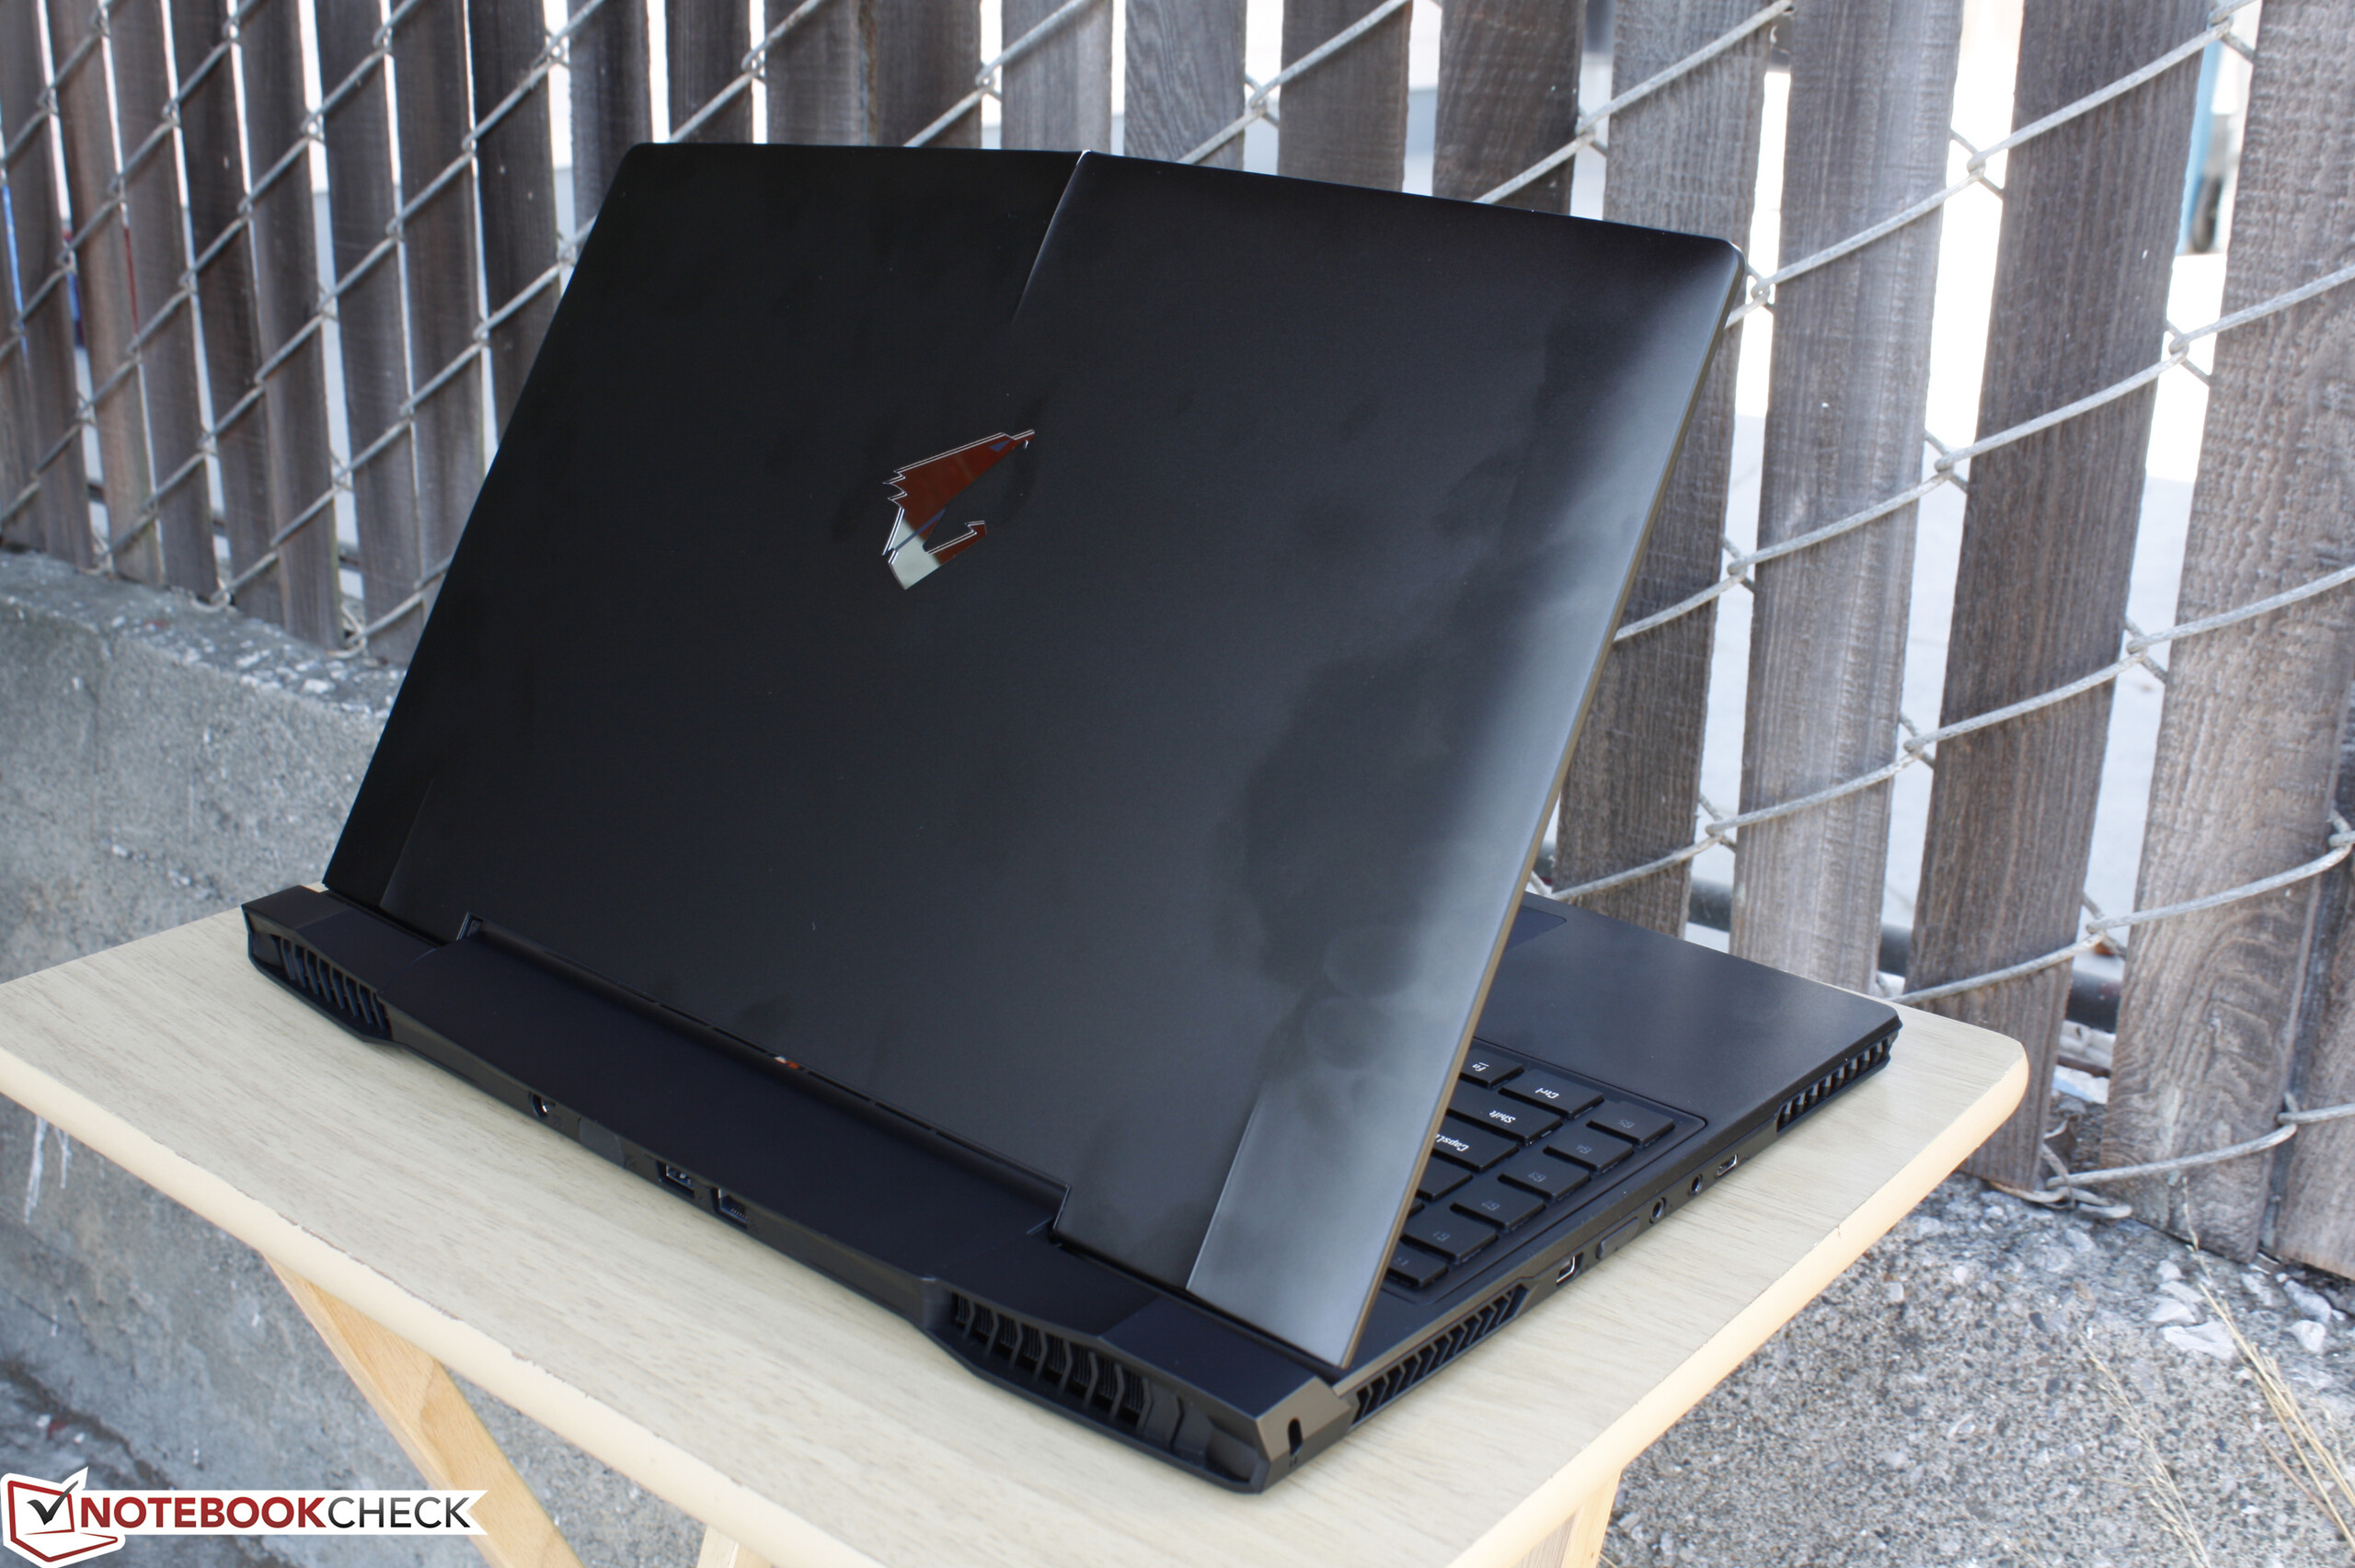
非常便携的Aorus X5 v6是一台全面的游戏笔记本电脑,它可以适合骨灰级游戏玩家和游戏直播,提供了丰富的功能。和其他轻薄游戏本相似,它的最大缺陷也是来自于风扇噪音。
注:本文是基于完整评测的缩减版本,阅读完整的英文评测,请点击这里。
Aorus X5 v6
-
10/08/2016 v5.1(old)
Allen Ngo
Pricecompare
