 Deutsch
 English
 Español
 Français
 Italiano
 Nederlands
 Polski
 Português
 Русский
 Türkçe
 Svenska
 Chinese
 Magyar
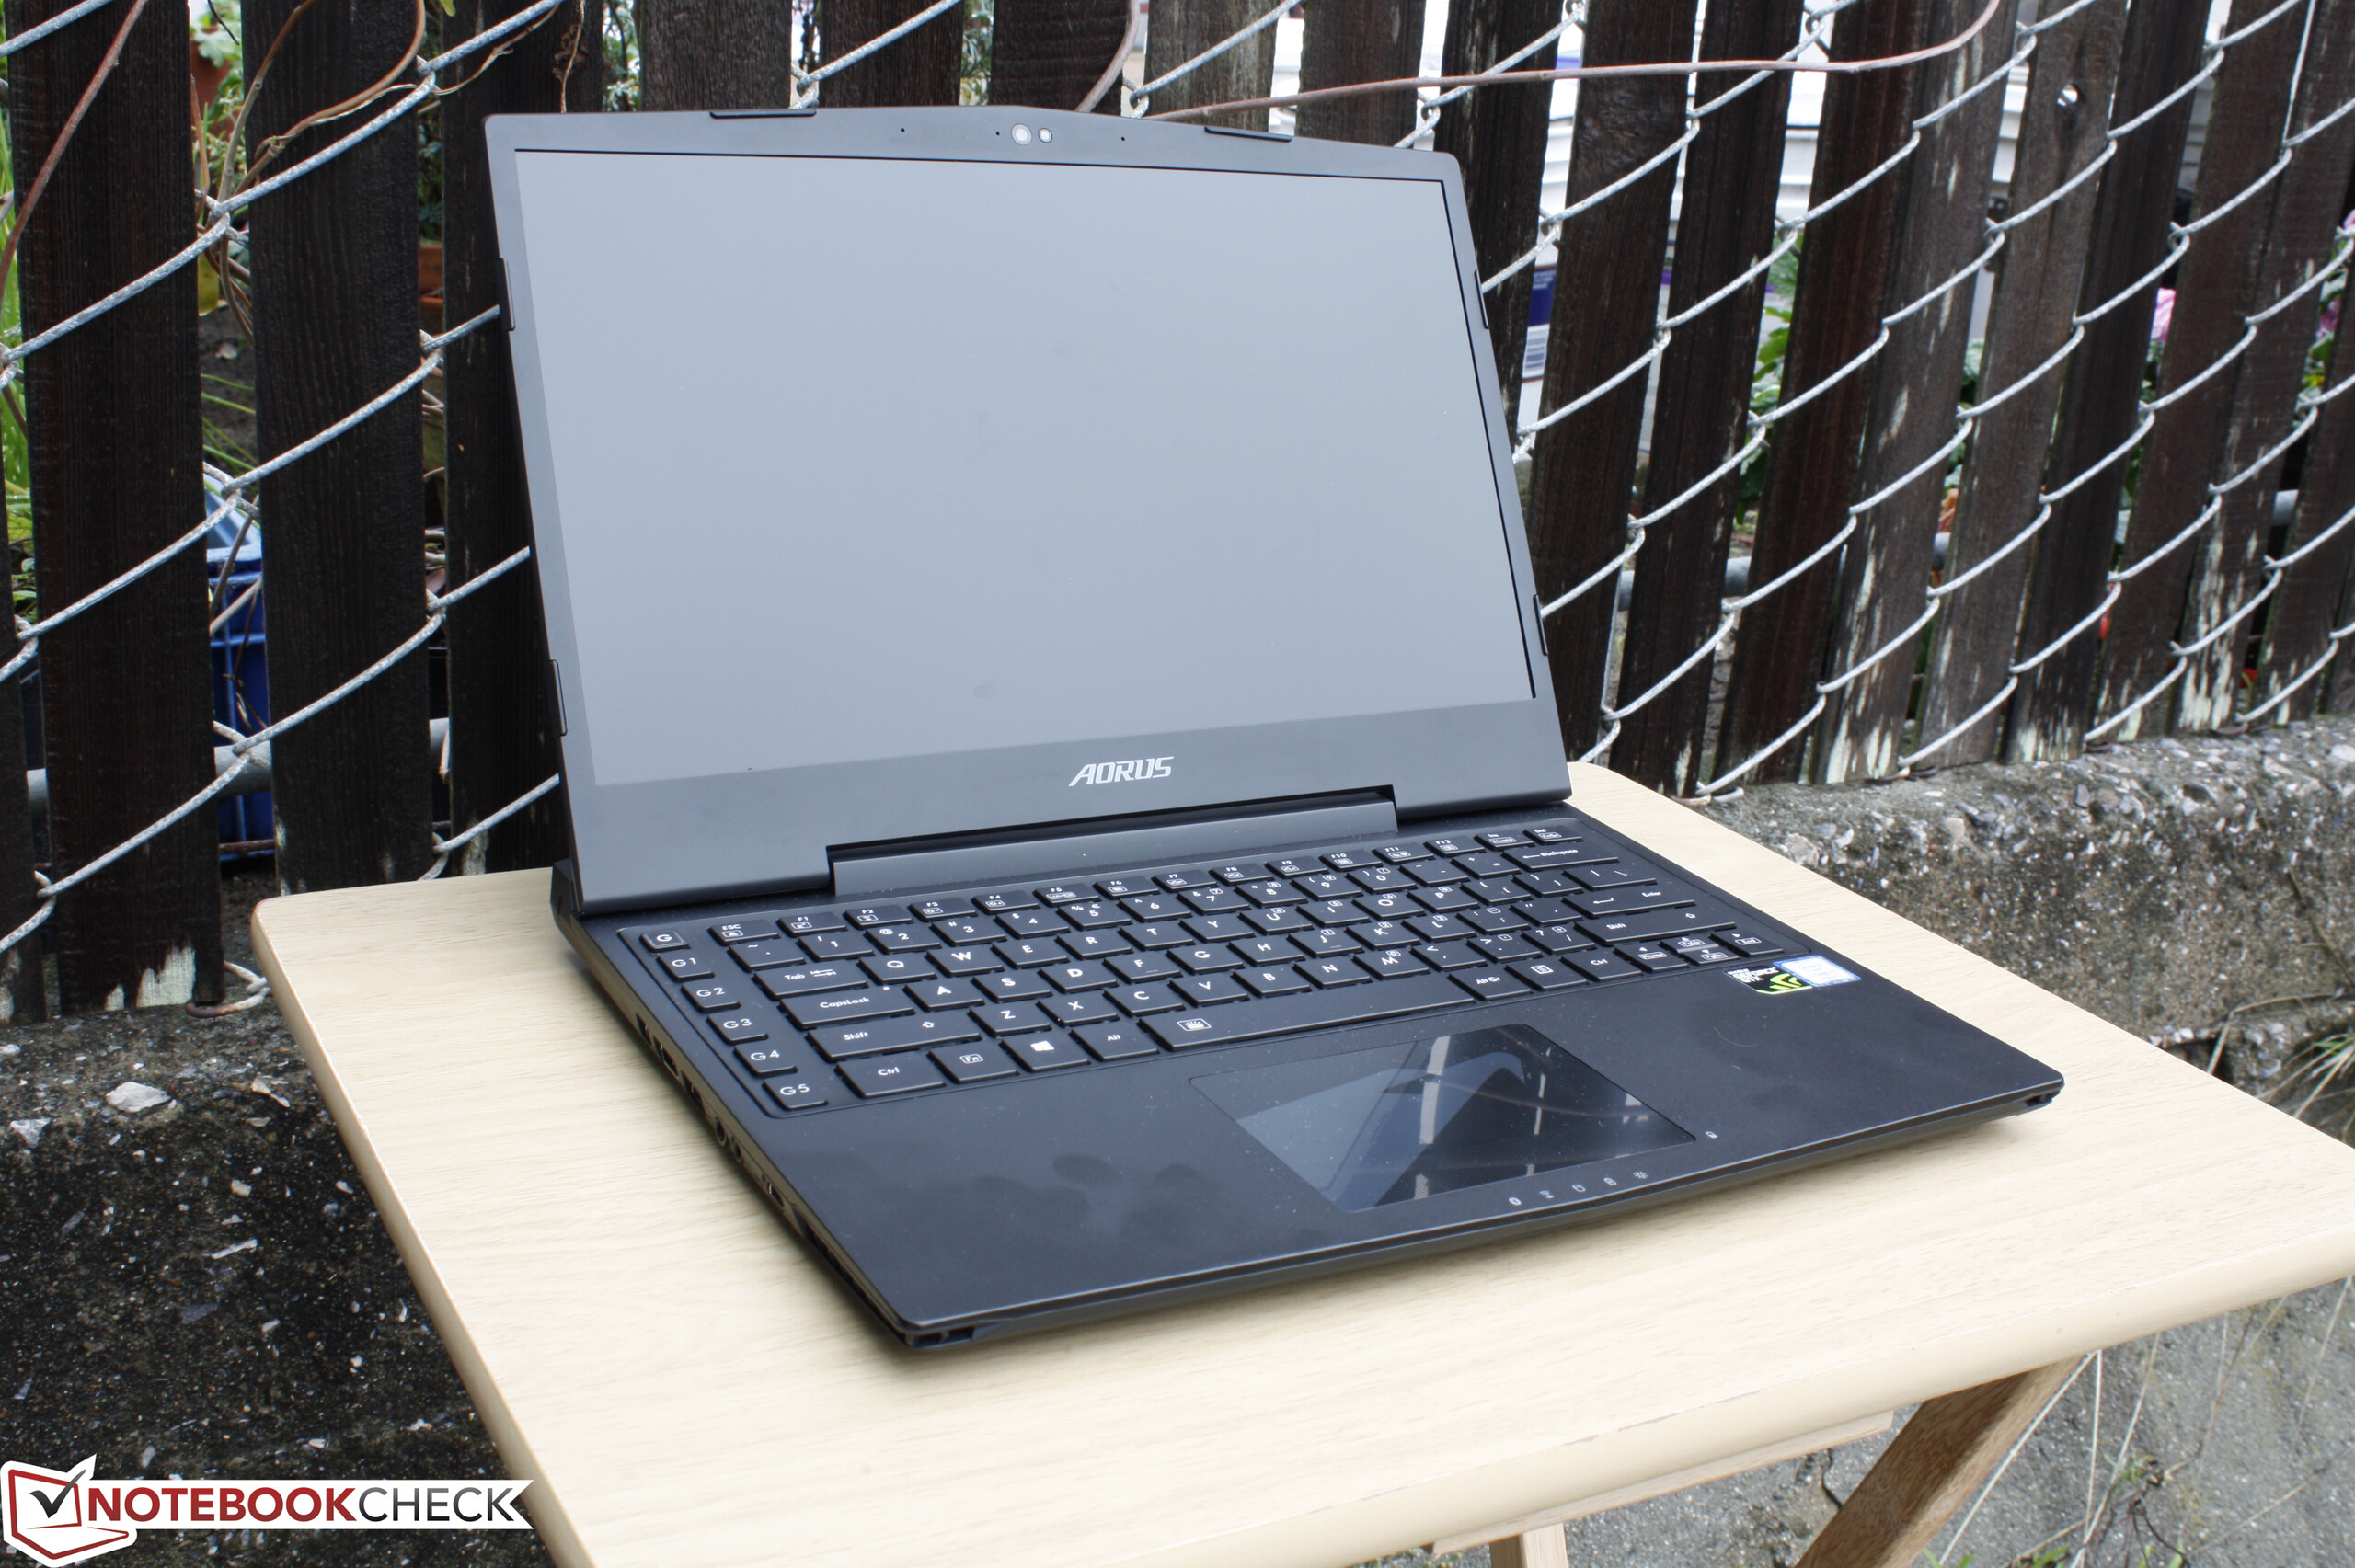
Aorus X3 Plus v5 笔记本电脑简短评测


| |||||||||||||||||||||||||
Brightness Distribution: 79 %
Center on Battery: 394.8 cd/m²
Contrast: 1347:1 (Black: 0.293 cd/m²)
ΔE Color 4.8 | 0.5-29.43 Ø5
ΔE Greyscale 5.04 | 0.57-98 Ø5.3
98.1% sRGB (Argyll 1.6.3 3D)
63.4% AdobeRGB 1998 (Argyll 1.6.3 3D)
69.2% AdobeRGB 1998 (Argyll 2.2.0 3D)
98.2% sRGB (Argyll 2.2.0 3D)
67.9% Display P3 (Argyll 2.2.0 3D)
Gamma: 2.26
| Aorus X3 Plus v5 13.90, 3200x1800 | Aorus X3 Plus v3 13.90, 3200x1800 | Alienware 13 (GTX 960M) 13.30, 1920x1080 | Razer Blade 14 2015 14.00, 3200x1800 | Apple MacBook Air 13 inch 2015-03 13.30, 1440x900 | Dell XPS 13 2016 i7 256GB QHD 13.30, 3200x1800 | MSI GS40-6QE16H11 14.00, 1920x1080 | |
|---|---|---|---|---|---|---|---|
| Display | -2% | -3% | 2% | -40% | -5% | -9% | |
| Display P3 Coverage | 67.9 | 67.6 0% | 64.9 -4% | 70.3 4% | 40.1 -41% | 63.6 -6% | 66.2 -3% |
| sRGB Coverage | 98.2 | 93.2 -5% | 94.9 -3% | 97.1 -1% | 59.8 -39% | 93.6 -5% | 85.7 -13% |
| AdobeRGB 1998 Coverage | 69.2 | 69 0% | 67.1 -3% | 71.1 3% | 41.51 -40% | 65.5 -5% | 62.6 -10% |
| Response Times | 812% | 46% | |||||
| Response Time Grey 50% / Grey 80% * | 52.4 ? | 40 ? 24% | 31 ? 41% | ||||
| Response Time Black / White * | 47.2 ? | 30 ? 36% | 23 ? 51% | ||||
| PWM Frequency | 198 ? | 4900 ? 2375% | |||||
| Screen | -16% | -12% | -13% | -15% | 0% | -23% | |
| Brightness middle | 394.8 | 312.4 -21% | 327 -17% | 318.4 -19% | 329 -17% | 285 -28% | 304 -23% |
| Brightness | 370 | 306 -17% | 305 -18% | 311 -16% | 310 -16% | 281 -24% | 282 -24% |
| Brightness Distribution | 79 | 91 15% | 78 -1% | 78 -1% | 82 4% | 90 14% | 88 11% |
| Black Level * | 0.293 | 0.504 -72% | 0.31 -6% | 0.416 -42% | 0.405 -38% | 0.18 39% | 0.37 -26% |
| Contrast | 1347 | 620 -54% | 1055 -22% | 765 -43% | 812 -40% | 1583 18% | 822 -39% |
| Colorchecker dE 2000 * | 4.8 | 4.17 13% | 5.14 -7% | 3.67 24% | 3.96 17% | 4.89 -2% | 7.47 -56% |
| Greyscale dE 2000 * | 5.04 | 4.4 13% | 6.51 -29% | 5.41 -7% | 3.51 30% | 5.16 -2% | 6.51 -29% |
| Gamma | 2.26 97% | 2.26 97% | 2.69 82% | 2.26 97% | 3.83 57% | 2.15 102% | 3.71 59% |
| CCT | 7343 89% | 6925 94% | 7347 88% | 7118 91% | 6711 97% | 7106 91% | 7840 83% |
| Color Space (Percent of AdobeRGB 1998) | 63.4 | 62 -2% | 61 -4% | 64.64 2% | 38.4 -39% | 59 -7% | 56 -12% |
| Color Space (Percent of sRGB) | 98.1 | 97 -1% | 59.8 -39% | 93 -5% | 86 -12% | ||
| Colorchecker dE 2000 max. * | 7.51 | ||||||
| Total Average (Program / Settings) | -9% /
-12% | -8% /
-10% | -6% /
-9% | -28% /
-22% | 269% /
161% | 5% /
-10% |
* ... smaller is better
Display Response Times
| ↔ Response Time Black to White | ||
|---|---|---|
| 47.2 ms ... rise ↗ and fall ↘ combined | ↗ 10 ms rise | 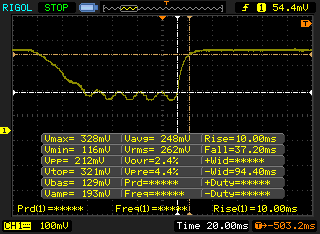 |
| ↘ 37.2 ms fall | ||
| The screen shows slow response rates in our tests and will be unsatisfactory for gamers. In comparison, all tested devices range from 0.1 (minimum) to 240 (maximum) ms. » 99 % of all devices are better. This means that the measured response time is worse than the average of all tested devices (21.5 ms). | ||
| ↔ Response Time 50% Grey to 80% Grey | ||
| 52.4 ms ... rise ↗ and fall ↘ combined | ↗ 22 ms rise | 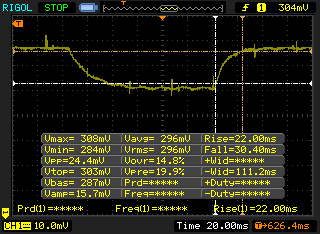 |
| ↘ 30.4 ms fall | ||
| The screen shows slow response rates in our tests and will be unsatisfactory for gamers. In comparison, all tested devices range from 0.2 (minimum) to 636 (maximum) ms. » 88 % of all devices are better. This means that the measured response time is worse than the average of all tested devices (33.8 ms). | ||
Screen Flickering / PWM (Pulse-Width Modulation)
| Screen flickering / PWM detected | 198 Hz | ≤ 90 % brightness setting |
The display backlight flickers at 198 Hz (worst case, e.g., utilizing PWM) Flickering detected at a brightness setting of 90 % and below. There should be no flickering or PWM above this brightness setting. The frequency of 198 Hz is relatively low, so sensitive users will likely notice flickering and experience eyestrain at the stated brightness setting and below. In comparison: 53 % of all tested devices do not use PWM to dim the display. If PWM was detected, an average of 17942 (minimum: 5 - maximum: 3846000) Hz was measured. | ||
| Cinebench R11.5 | |
| CPU Single 64Bit (sort by value) | |
| Aorus X3 Plus v5 | |
| Eurocom Sky DLX7 | |
| MSI PX60 QD-034US | |
| MSI GT72S 6QF | |
| Lenovo IdeaPad Y50 | |
| Acer Aspire E17 E5-752G-T7WY | |
| CPU Multi 64Bit (sort by value) | |
| Aorus X3 Plus v5 | |
| Eurocom Sky DLX7 | |
| MSI PX60 QD-034US | |
| MSI GT72S 6QF | |
| Lenovo IdeaPad Y50 | |
| Acer Aspire E17 E5-752G-T7WY | |
| Cinebench R10 | |
| Rendering Single CPUs 64Bit (sort by value) | |
| Aorus X3 Plus v5 | |
| Eurocom Sky DLX7 | |
| MSI PX60 QD-034US | |
| MSI GT72S 6QF | |
| Lenovo IdeaPad Y50 | |
| Acer Aspire E17 E5-752G-T7WY | |
| Rendering Multiple CPUs 64Bit (sort by value) | |
| Aorus X3 Plus v5 | |
| Eurocom Sky DLX7 | |
| MSI PX60 QD-034US | |
| MSI GT72S 6QF | |
| Lenovo IdeaPad Y50 | |
| Acer Aspire E17 E5-752G-T7WY | |
| Cinebench R15 | |
| CPU Single 64Bit (sort by value) | |
| Aorus X3 Plus v5 | |
| Eurocom Sky DLX7 | |
| MSI PX60 QD-034US | |
| MSI GT72S 6QF | |
| Lenovo IdeaPad Y50 | |
| Acer Aspire E17 E5-752G-T7WY | |
| CPU Multi 64Bit (sort by value) | |
| Aorus X3 Plus v5 | |
| Eurocom Sky DLX7 | |
| MSI PX60 QD-034US | |
| MSI GT72S 6QF | |
| Lenovo IdeaPad Y50 | |
| Acer Aspire E17 E5-752G-T7WY | |
| PCMark 7 - Score (sort by value) | |
| Aorus X3 Plus v5 | |
| Razer Blade 14 2015 | |
| SCHENKER XMG A305 | |
| Apple MacBook Pro Retina 13 inch 2015-03 | |
| MSI GS40-6QE16H11 | |
| Alienware 13 (GTX 960M) | |
| PCMark 8 | |
| Home Score Accelerated v2 (sort by value) | |
| Aorus X3 Plus v5 | |
| Razer Blade 14 2015 | |
| Apple MacBook Pro Retina 13 inch 2015-03 | |
| MSI GS40-6QE16H11 | |
| Work Score Accelerated v2 (sort by value) | |
| Aorus X3 Plus v5 | |
| Razer Blade 14 2015 | |
| Apple MacBook Pro Retina 13 inch 2015-03 | |
| MSI GS40-6QE16H11 | |
| Creative Score Accelerated v2 (sort by value) | |
| Aorus X3 Plus v5 | |
| Razer Blade 14 2015 | |
| Apple MacBook Pro Retina 13 inch 2015-03 | |
| MSI GS40-6QE16H11 | |
| PCMark 7 Score | 5396 points | |
| PCMark 8 Home Score Accelerated v2 | 4033 points | |
| PCMark 8 Creative Score Accelerated v2 | 5939 points | |
| PCMark 8 Work Score Accelerated v2 | 4319 points | |
Help | ||
| Aorus X3 Plus v5 GeForce GTX 970M, 6700HQ, Samsung SM951 MZVPV512HDGL m.2 PCI-e | Aorus X3 Plus v3 GeForce GTX 970M, 4710HQ, 2x Lite-On LMT-256L9M (RAID 0) | Razer Blade 14 2015 GeForce GTX 970M, 4720HQ, Lite-On IT L8T-256L9G | Alienware 13 (GTX 960M) GeForce GTX 960M, 5500U, Samsung SSD PM851 M.2 2280 256GB | Apple MacBook Air 13 inch 2015-03 HD Graphics 6000, 5650U, Apple SSD SD0256F | |
|---|---|---|---|---|---|
| AS SSD | -31% | -58% | -66% | -77% | |
| Copy Game MB/s | 927 | 498.7 -46% | 263.9 -72% | 479.3 -48% | |
| Copy Program MB/s | 368.6 | 322.4 -13% | 242.8 -34% | 245 -34% | |
| Copy ISO MB/s | 1158 | 690 -40% | 456 -61% | 643 -44% | |
| Score Total | 2652 | 1685 -36% | 1049 -60% | 926 -65% | 2383 -10% |
| Score Write | 630 | 703 12% | 407 -35% | 280 -56% | 463 -27% |
| Score Read | 1345 | 641 -52% | 421 -69% | 432 -68% | 1281 -5% |
| Access Time Write * | 0.032 | 0.049 -53% | 0.062 -94% | 0.036 -13% | 0.155 -384% |
| Access Time Read * | 0.041 | 0.056 -37% | 0.07 -71% | 0.118 -188% | 0.171 -317% |
| 4K-64 Write | 368.3 | 544 48% | 307 -17% | 162.8 -56% | 338.9 -8% |
| 4K-64 Read | 1113 | 535 -52% | 343.4 -69% | 354 -68% | 1140 2% |
| 4K Write | 114 | 74.7 -34% | 58.2 -49% | 93.6 -18% | 23.73 -79% |
| 4K Read | 46.24 | 31.15 -33% | 28.6 -38% | 26.32 -43% | 19.16 -59% |
| Seq Write | 1474 | 840 -43% | 419.4 -72% | 233 -84% | 1001 -32% |
| Seq Read | 1859 | 753 -59% | 487.7 -74% | 513 -72% | 1212 -35% |
* ... smaller is better

| 3DMark 11 - 1280x720 Performance (sort by value) | |
| Aorus X3 Plus v5 | |
| Eurocom Sky DLX7 | |
| Acer Predator 15 G9-591-74ZV | |
| Aorus X3 Plus v3 | |
| Lenovo Ideapad Y700 15ISK 80NW | |
| MSI PX60 QD-034US | |
| Asus Zenbook UX303UB-R4100T | |
| 3DMark | |
| 1920x1080 Fire Strike Score (sort by value) | |
| Aorus X3 Plus v5 | |
| Eurocom Sky DLX7 | |
| Acer Predator 15 G9-591-74ZV | |
| Aorus X3 Plus v3 | |
| Lenovo Ideapad Y700 15ISK 80NW | |
| MSI PX60 QD-034US | |
| Asus Zenbook UX303UB-R4100T | |
| 1280x720 Cloud Gate Standard Score (sort by value) | |
| Aorus X3 Plus v5 | |
| Eurocom Sky DLX7 | |
| Acer Predator 15 G9-591-74ZV | |
| Aorus X3 Plus v3 | |
| Lenovo Ideapad Y700 15ISK 80NW | |
| MSI PX60 QD-034US | |
| Asus Zenbook UX303UB-R4100T | |
| 1280x720 Ice Storm Standard Score (sort by value) | |
| Aorus X3 Plus v5 | |
| Eurocom Sky DLX7 | |
| Acer Predator 15 G9-591-74ZV | |
| Aorus X3 Plus v3 | |
| Lenovo Ideapad Y700 15ISK 80NW | |
| MSI PX60 QD-034US | |
| Asus Zenbook UX303UB-R4100T | |
| Fire Strike Extreme Score (sort by value) | |
| Aorus X3 Plus v5 | |
| Eurocom Sky DLX7 | |
| Aorus X3 Plus v3 | |
| Lenovo Ideapad Y700 15ISK 80NW | |
| MSI PX60 QD-034US | |
| 3840x2160 Fire Strike Ultra Score (sort by value) | |
| Aorus X3 Plus v5 | |
| Eurocom Sky DLX7 | |
| Acer Predator 15 G9-591-74ZV | |
| Lenovo Ideapad Y700 15ISK 80NW | |
| 3DMark 11 Performance | 9297 points | |
| 3DMark Ice Storm Standard Score | 52842 points | |
| 3DMark Cloud Gate Standard Score | 20458 points | |
| 3DMark Fire Strike Score | 6489 points | |
| 3DMark Fire Strike Extreme Score | 3347 points | |
Help | ||
| Sleeping Dogs - 1920x1080 Extreme Preset AA:Extreme (sort by value) | |
| Aorus X3 Plus v5 | |
| Eurocom P7 Pro | |
| Eurocom Sky DLX7 | |
| Lenovo Ideapad Y700 15ISK 80NW | |
| MSI PX60 QD-034US | |
| Tomb Raider - 1920x1080 Ultra Preset AA:FX AF:16x (sort by value) | |
| Aorus X3 Plus v5 | |
| Eurocom P7 Pro | |
| Eurocom Sky DLX7 | |
| Lenovo Ideapad Y700 15ISK 80NW | |
| MSI PX60 QD-034US | |
| BioShock Infinite - 1920x1080 Ultra Preset, DX11 (DDOF) (sort by value) | |
| Aorus X3 Plus v5 | |
| Eurocom P7 Pro | |
| Eurocom Sky DLX7 | |
| Lenovo Ideapad Y700 15ISK 80NW | |
| MSI PX60 QD-034US | |
| Metro: Last Light - 1920x1080 Very High (DX11) AF:16x (sort by value) | |
| Aorus X3 Plus v5 | |
| Eurocom P7 Pro | |
| Lenovo Ideapad Y700 15ISK 80NW | |
| MSI PX60 QD-034US | |
| Thief - 1920x1080 Very High Preset AA:FXAA & High SS AF:8x (sort by value) | |
| Aorus X3 Plus v5 | |
| Eurocom P7 Pro | |
| Eurocom Sky DLX7 | |
| Lenovo Ideapad Y700 15ISK 80NW | |
| MSI PX60 QD-034US | |
| Metal Gear Solid V - 1920x1080 Extra High / On (sort by value) | |
| Aorus X3 Plus v5 | |
| Eurocom Sky DLX7 | |
| Lenovo Ideapad Y700 15ISK 80NW | |
| MSI PX60 QD-034US | |
| Fallout 4 - 1920x1080 Ultra Preset AA:T AF:16x (sort by value) | |
| Aorus X3 Plus v5 | |
| Lenovo Ideapad Y700 15ISK 80NW | |
| low | med. | high | ultra | |
| Sleeping Dogs (2012) | 123.5 | 45 | ||
| Tomb Raider (2013) | 185.4 | 86.7 | ||
| BioShock Infinite (2013) | 146.8 | 71.8 | ||
| Metro: Last Light (2013) | 93.8 | 53.6 | ||
| Thief (2014) | 73 | 46.5 | ||
| Batman: Arkham Knight (2015) | 59 | |||
| Metal Gear Solid V (2015) | 59.9 | 59.1 | ||
| Fallout 4 (2015) | 52.9 | 42.4 |
| Aorus X3 Plus v5 GeForce GTX 970M, 6700HQ, Samsung SM951 MZVPV512HDGL m.2 PCI-e | Alienware 13 (GTX 960M) GeForce GTX 960M, 5500U, Samsung SSD PM851 M.2 2280 256GB | Razer Blade 14 2015 GeForce GTX 970M, 4720HQ, Lite-On IT L8T-256L9G | MSI GS30 Shadow Iris Pro Graphics 5200, 4870HQ, 2x Toshiba HG6 THNSNJ256G8NU (RAID 0) | MSI GS40-6QE16H11 GeForce GTX 970M, 6700HQ, Samsung MZFLV128 NVMe | |
|---|---|---|---|---|---|
| Noise | 4% | 2% | -13% | -6% | |
| Idle Minimum * | 32.1 | 29.2 9% | 29.7 7% | 29.4 8% | 33 -3% |
| Idle Average * | 32.4 | 29.4 9% | 29.9 8% | 36.2 -12% | 34 -5% |
| Idle Maximum * | 32.5 | 29.6 9% | 30 8% | 42 -29% | 38 -17% |
| Load Average * | 40.1 | 45.8 -14% | 42.1 -5% | 52.8 -32% | 44 -10% |
| Load Maximum * | 54.6 | 52 5% | 59 -8% | 53.6 2% | 52 5% |
* ... smaller is better
Noise Level
| Idle |
| 32.1 / 32.4 / 32.5 dB(A) |
| Load |
| 40.1 / 54.6 dB(A) |
 | ||
30 dB silent 40 dB(A) audible 50 dB(A) loud |
||
min: | ||
(±) The maximum temperature on the upper side is 44.6 °C / 112 F, compared to the average of 40.4 °C / 105 F, ranging from 21.2 to 68.8 °C for the class Gaming.
(-) The bottom heats up to a maximum of 49.8 °C / 122 F, compared to the average of 43.2 °C / 110 F
(+) In idle usage, the average temperature for the upper side is 23.5 °C / 74 F, compared to the device average of 33.8 °C / 93 F.
(+) The palmrests and touchpad are cooler than skin temperature with a maximum of 30.4 °C / 86.7 F and are therefore cool to the touch.
(±) The average temperature of the palmrest area of similar devices was 28.9 °C / 84 F (-1.5 °C / -2.7 F).
| Aorus X3 Plus v5 73 Wh | Aorus X3 Plus v3 73 Wh | Alienware 13 (GTX 960M) 52 Wh | Dell XPS 13 2016 i7 256GB QHD 56 Wh | MSI GS30 Shadow 50 Wh | MSI GS40-6QE16H11 47 Wh | Razer Blade 14 2015 61 Wh | |
|---|---|---|---|---|---|---|---|
| Battery Runtime | 16% | 74% | 64% | -15% | -10% | -9% | |
| Reader / Idle | 481 | 423 -12% | 675 40% | 784 63% | 403 -16% | 313 -35% | 380 -21% |
| WiFi v1.3 | 305 | 258 -15% | 432 42% | 297 -3% | 222 -27% | ||
| Load | 55 | 96 75% | 114 107% | 103 87% | 48 -13% | 60 9% | 66 20% |
| WiFi | 210 |
Pros
Cons
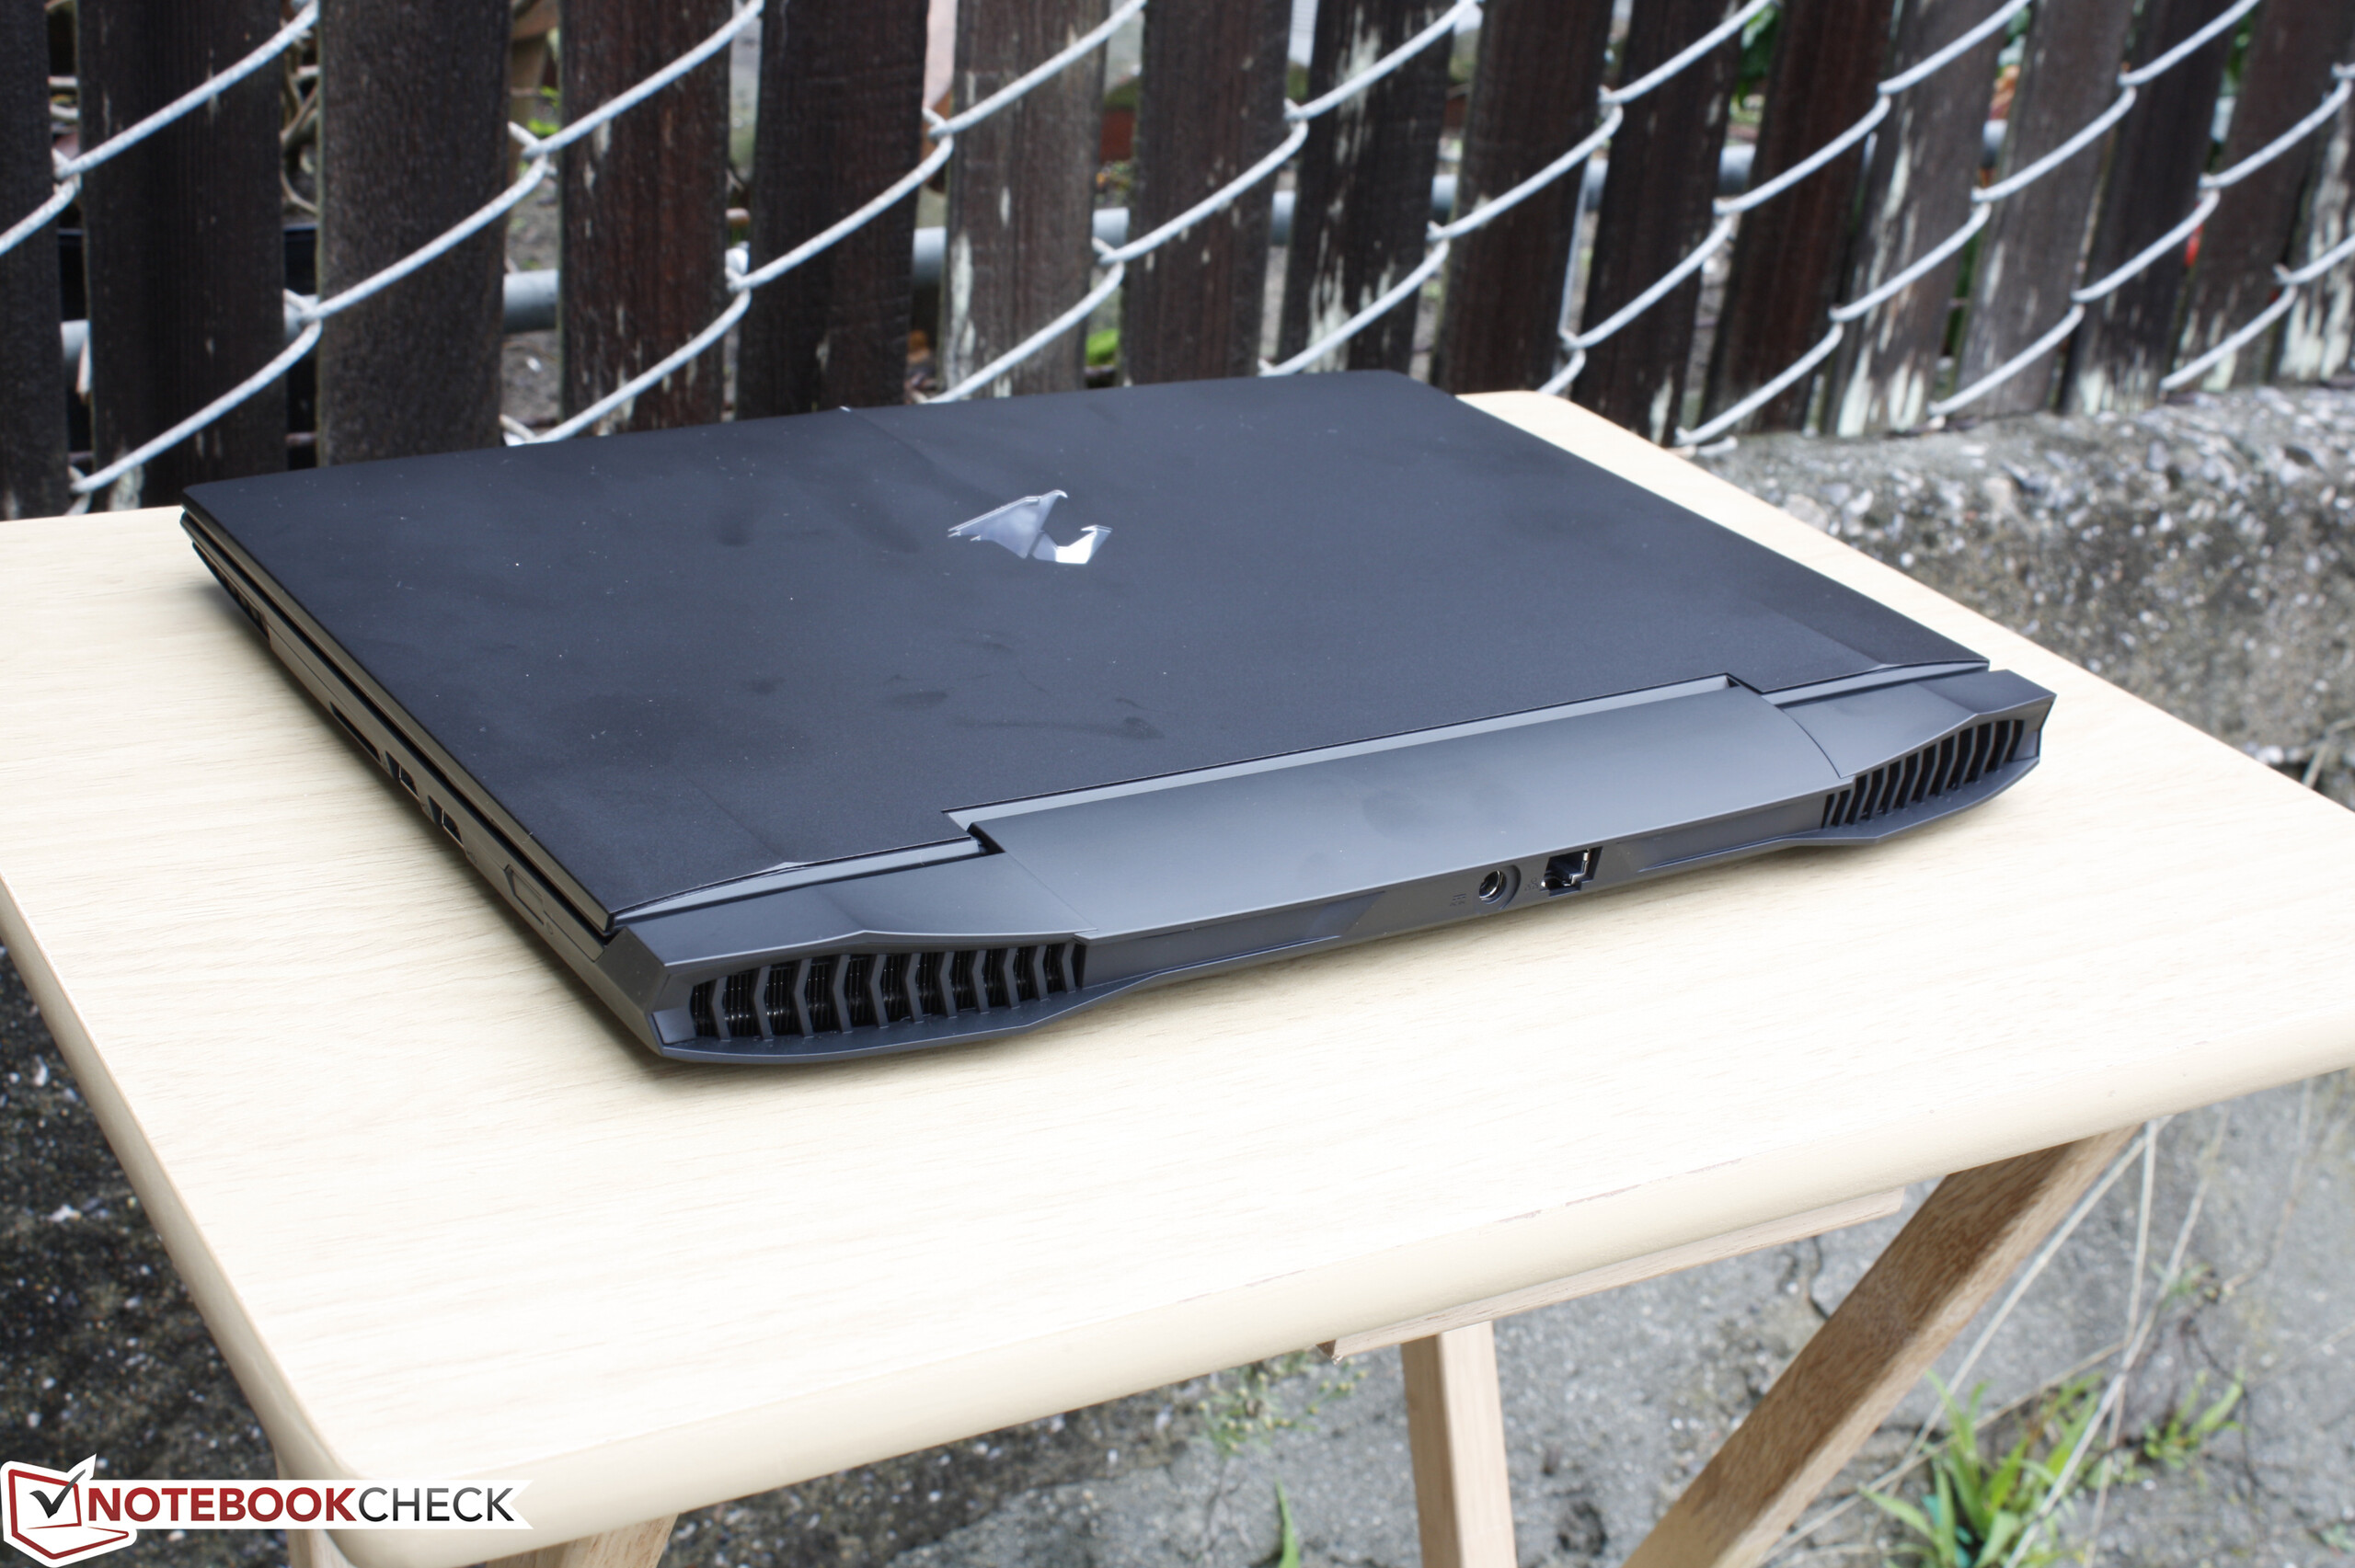
作为Aorus最小的一款设备,X3 Plus v5击中了不少目标,但也错失了一些重要的靶子。它的13.9寸屏幕十分奇怪,尽管它宽广的色域提供了出色的视觉效果,同时它拥有高密度像素,高对比度和明亮的背光,但是它在细节上如平均亮度分布,未校对的色彩准确度和灰阶,响应时间,低亮度PWM造成的闪烁等方面都让人失望。
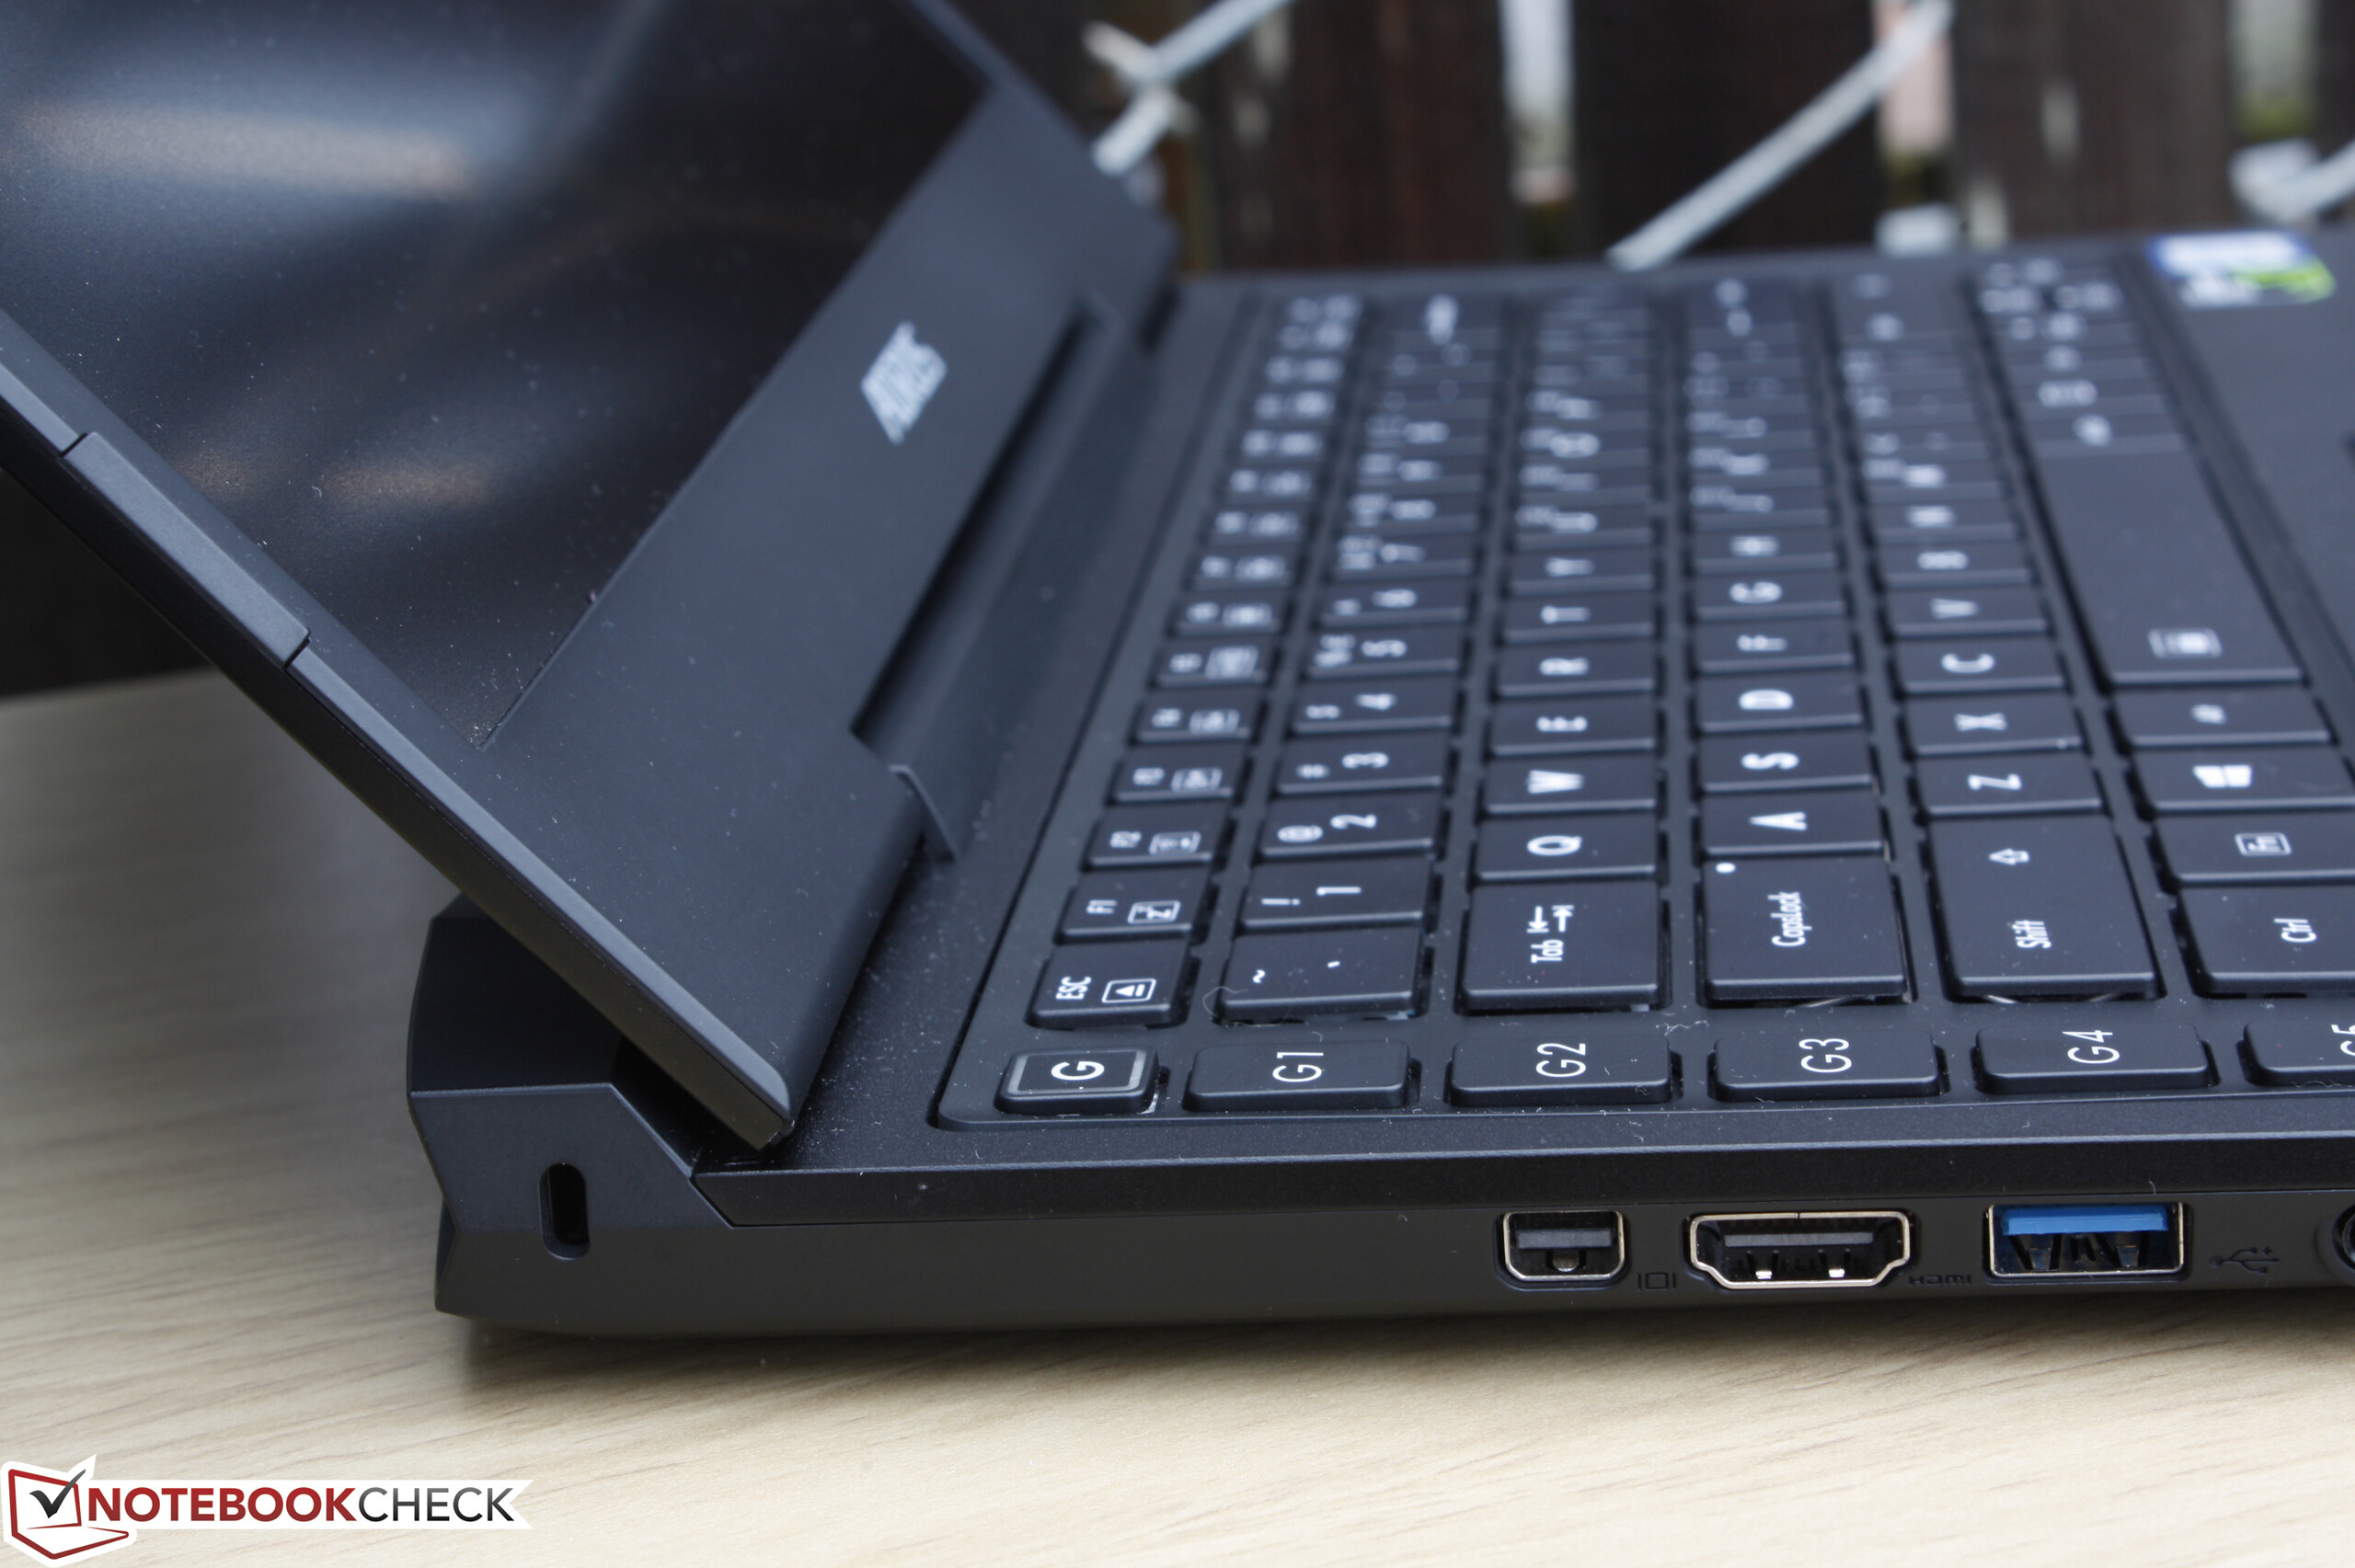
如果Aorus可以为它搭配更强的机身和屏幕,那么X3 Plus将会是值得向所有需要一台身型小巧而同时拥有17寸设备的生猛性能的游戏笔记本电脑用户推荐的选择。希望它再重新设计中可以解决这些问题,并增加一些已经很常见的功能如Thunderbolt 3,G-Sync,和触控屏幕支持。
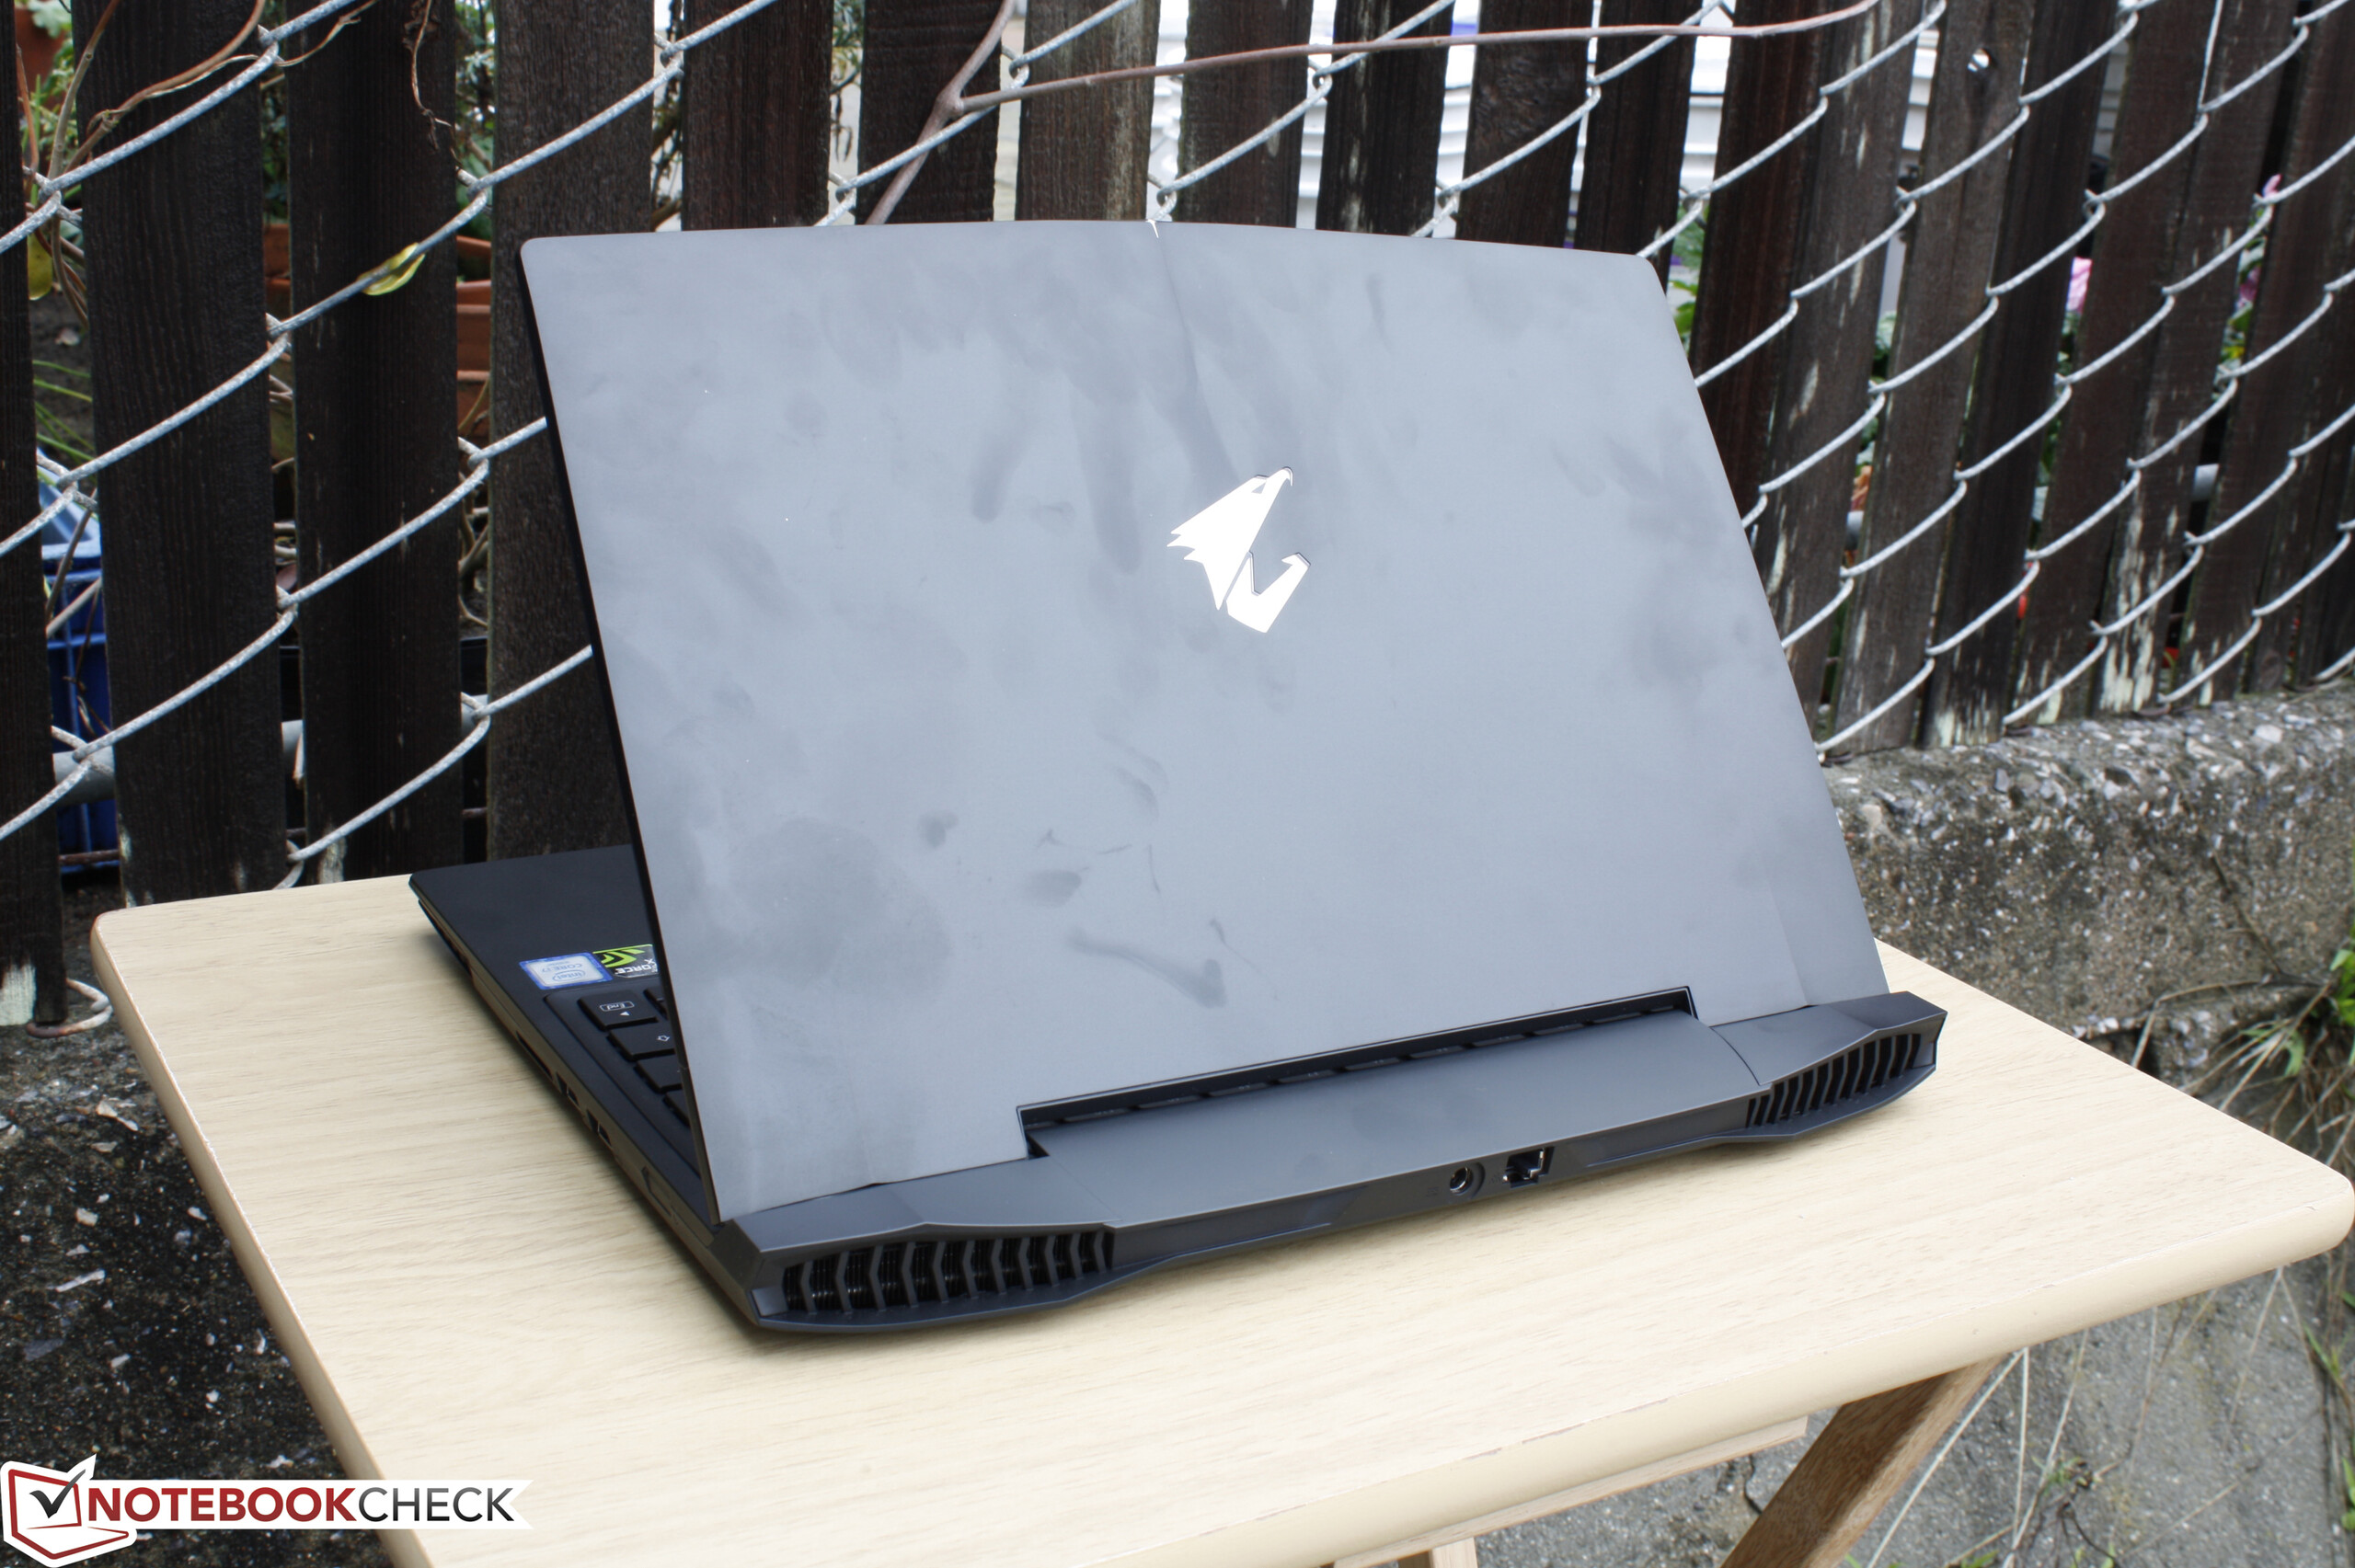
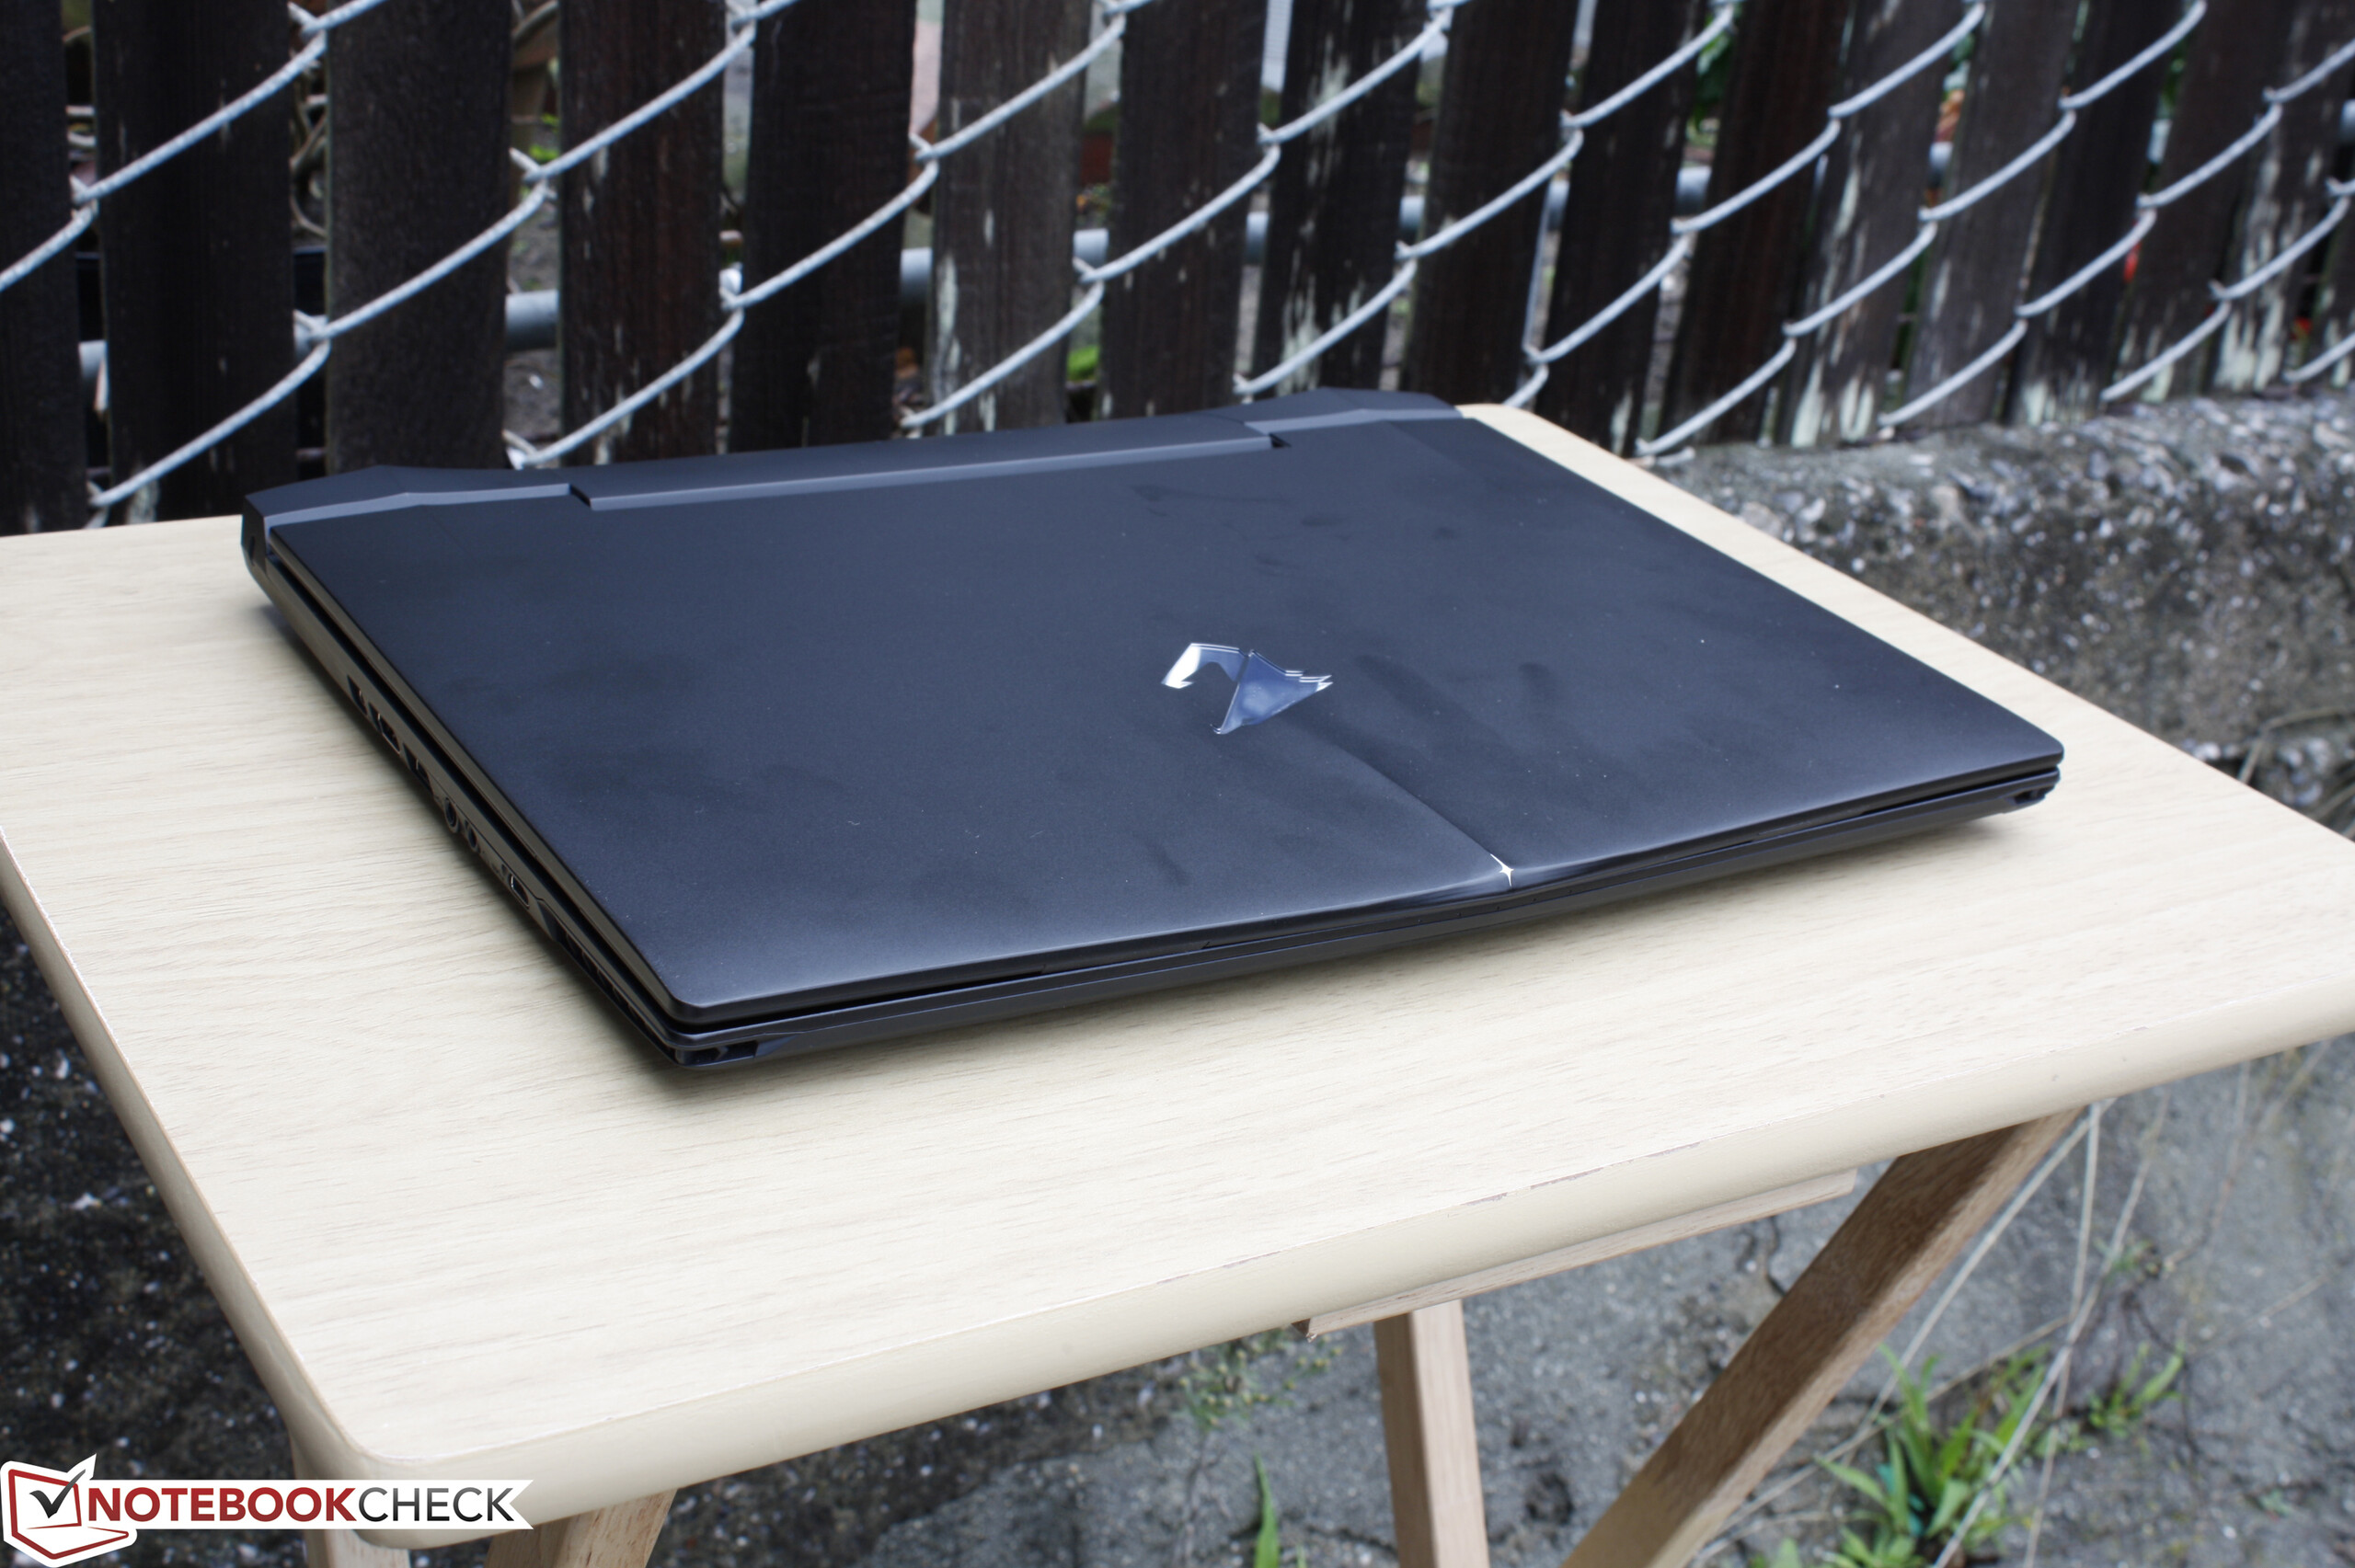
Aorus X3 Plus v5名副其实地成为了最快的13.9寸游戏本,它在性能上毫无破绽,并提供了更大尺寸笔记本电脑同样的功能。它的制造工艺还需要向竞争对手如Razer Blade 14和微星GS40在灵活性和坚固性方面看齐。
注:本文是基于完整评测的缩减版本,阅读完整的英文评测,请点击这里。
Aorus X3 Plus v5
-
02/23/2016 v5(old)
Allen Ngo
Pricecompare
